Redistribution of Income through Taxation and Spending in ... of... · •How well do taxes and...
28
Redistribution of Income through Taxation and Spending in South Africa
Transcript of Redistribution of Income through Taxation and Spending in ... of... · •How well do taxes and...

Redistribution of Income through
Taxation and Spending in South Africa

Two Main Questions
• How well do taxes and spending in South
Africa redistribute income between the rich
and poor?
• What is the impact of taxes and spending on
poverty and inequality in South Africa?

Innovations
• Uses the 2010/11 Income and Expenditure Survey (IES).
• Assesses both taxes and spending at the same time.
• Applies the Commitment to Equity (CEQ) methodology, allowing for cross-country comparability.
For more details, see http://www.commitmentoequity.org.

Key results
1. The tax and social spending system is overall
progressive.
2. Fiscal policy leads to reductions in poverty and
inequality that are the largest achieved in the set of
12 middle income countries.
Further poverty and inequality reductions will require
more inclusive economic growth.

Taxes
• Personal income tax
• Payroll taxes: UIF and SDL
• VAT
• Excise duties on alcohol and tobacco
• Fuel levy

Direct taxes are absolutely progressive.
0%
10%
20%
30%
40%
50%
60%
70%
80%
90%
100%
0% 10% 20% 30% 40% 50% 60% 70% 80% 90% 100%
Cu
mu
lati
ve
Pro
po
rtio
n o
f m
ark
et i
nco
me/
tax
Cumulative Proportion of the Population
South Africa Concentration Curves of Direct Taxes
(share paid by market income deciles)
Direct taxes
Market Inc
45 Degree Line
Source: Own estimates for South Africa based on IES 2010/11.
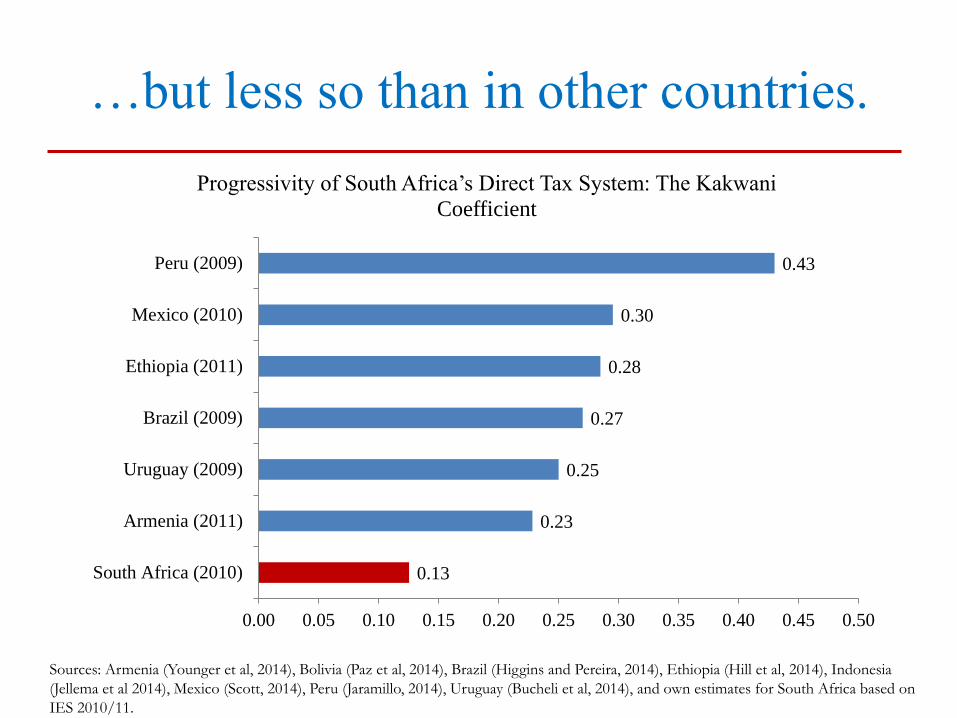
…but less so than in other countries.
Sources: Armenia (Younger et al, 2014), Bolivia (Paz et al, 2014), Brazil (Higgins and Pereira, 2014), Ethiopia (Hill et al, 2014), Indonesia
(Jellema et al 2014), Mexico (Scott, 2014), Peru (Jaramillo, 2014), Uruguay (Bucheli et al, 2014), and own estimates for South Africa based on
IES 2010/11.
0.13
0.23
0.25
0.27
0.28
0.30
0.43
0.00 0.05 0.10 0.15 0.20 0.25 0.30 0.35 0.40 0.45 0.50
South Africa (2010)
Armenia (2011)
Uruguay (2009)
Brazil (2009)
Ethiopia (2011)
Mexico (2010)
Peru (2009)
Progressivity of South Africa’s Direct Tax System: The Kakwani
Coefficient

In contrast, indirect taxes are slightly
regressive on account of excise taxes
0%
10%
20%
30%
40%
50%
60%
70%
80%
90%
100%
Cum
ula
tive
pro
po
rtio
n o
f
dis
po
sab
le in
com
e/ta
x
Cumulative proportion of the population
South Africa Concentration Curves of Indirect Taxes (share paid by disposable income deciles)
Disposable Income VAT Excise Tax
Fuel Levy 45 Degree Line
Source: Own estimates for South Africa based on IES 2010/11.

Overall, the tax system is globally
progressive.
Sources: Own estimates for South Africa based on IES 2010/11.
0%
10%
20%
30%
40%
50%
60%
70%
80%
90%
100%
0% 10% 20% 30% 40% 50% 60% 70% 80% 90% 100%
Cum
ula
tive
Pro
po
rtio
n o
f T
ax
Cumulative Proportion of the Population
South Africa. Concentration Curves of All Taxes, 2010 (share of market income)
Market Inc
45 Degree Line
All taxes

How progressive is social
spending in South Africa?
• Direct cash transfers
• Health
• Education
• Free basic services

Direct cash transfers are absolutely
progressive…
0%
10%
20%
30%
40%
50%
60%
70%
80%
90%
100%
0 1 2 3 4 5 6 7 8 9 10
Cu
mu
lati
ve
Pro
po
rtio
n o
f In
com
e/S
pen
din
g
Cumulative proportion of the population by market income deciles
Direct Cash Transfers by Category
Concentration Curves for Transfers and Lorenz Curve for
Market Income
Lorenz for Market Income
Direct Transfers
Old -age pension
Child support grant
Disability grant
Population Shares
Sources: Own estimates for South Africa based on IES 2010/11.

Cash transfers are large relative to the
incomes of the poor
Sources: Argentina (Lustig and Pessino, 2014), Armenia (Younger et al, 2014); Brazil (Higgins and Pereira, 2014), Mexico (Scott, 2014),
Uruguay (Bucheli et al, 2014), and own estimates for South Africa based on IES 2010/11.
0%
200%
400%
600%
800%
1000%
1200%
Argentina(2009)
Armenia(2011)
Brazil (2009) Mexico(2010)
South Africa(2010)
Uruguay(2009)
Incidence of Direct Cash Transfers (share of market income deciles)
Poorest decile Richest decile

FBS are more progressive when targeted
Source: Own estimates based on IES (2010/11).
0%
10%
20%
30%
40%
50%
60%
70%
80%
90%
100%
0 1 2 3 4 5 6 7 8 9 10
Cu
mu
lati
ve
Pro
po
rtio
n o
f In
com
e/S
pen
din
g
Cumulative proportion of the population by market income deciles
Concentration Curves for Free Basic Services
Lorenz for Market Income
FBS as a transfer
FBS as a subsidy
Population Shares

Health and education spending are
progressive in absolute terms..
0%
10%
20%
30%
40%
50%
60%
70%
80%
90%
100%
0 1 2 3 4 5 6 7 8 9 10
Cu
mu
lati
ve
Pro
po
rtio
n o
f In
com
e/S
pen
din
g
Cumulative proportion of the population by market income deciles
Concentration of Health Spending and Lorenz Curve
for Market Income
Lorenz for Market Income
In-kind Education
In-kind Health
Population Shares
Source: Own estimates using IES, 2010/11 and NIDS 2008w1.

However, the results vary according to
the level of education
Source: Own estimates using IES, 2010/11.
0%
10%
20%
30%
40%
50%
60%
70%
80%
90%
100%
Preschool Primary Secondary Post
secondary
training
Adult training
centres
University
South Africa. Percent of Target Population
Income < $1.25 $1.25—$2.5 $2.5—$4 $4—$10 $10—$50 > $50

Social spending as a whole is strongly
progressive
0.77
0.50
0.16
0.01
0.00
-0.11
-0.12
-0.15
-0.17
-0.19
-0.19
-0.25
-0.32
-0.34
-0.37
-0.39
-0.60 -0.40 -0.20 - 0.20 0.40 0.60 0.80 1.00
Market income Gini
Tertiary Education Spending
Free basic services (as indirect subsidies)
Other grants
Health Spending
Pre-school education
Secondary School Education
Grant-in-aid
Old age pension
Pre and Primary education
Primary education
Disability grant
Foster Care grant
Child support grant
Care dependency
Free basic services (as transfers)
South Africa. Concentration coefficients for Spending
Source: Own estimates using IES, 2010/11.

What is the net impact of taxes and
government transfers on poverty and
inequality?
17

Poverty declines substantially due to
fiscal policy
18
+ direct
transfers
- Indirect
taxes
+ indirect
subsidies
- direct
taxes
40.8% 29.0%
46.5%
34.2%
39.6%
52.3% 50.1%
0%
10%
20%
30%
40%
50%
60%
Market Income Net Market Income Disposable Income Post-fiscal Income
National food poverty line1
National lower bound poverty line 2
National upper bound poverty line3
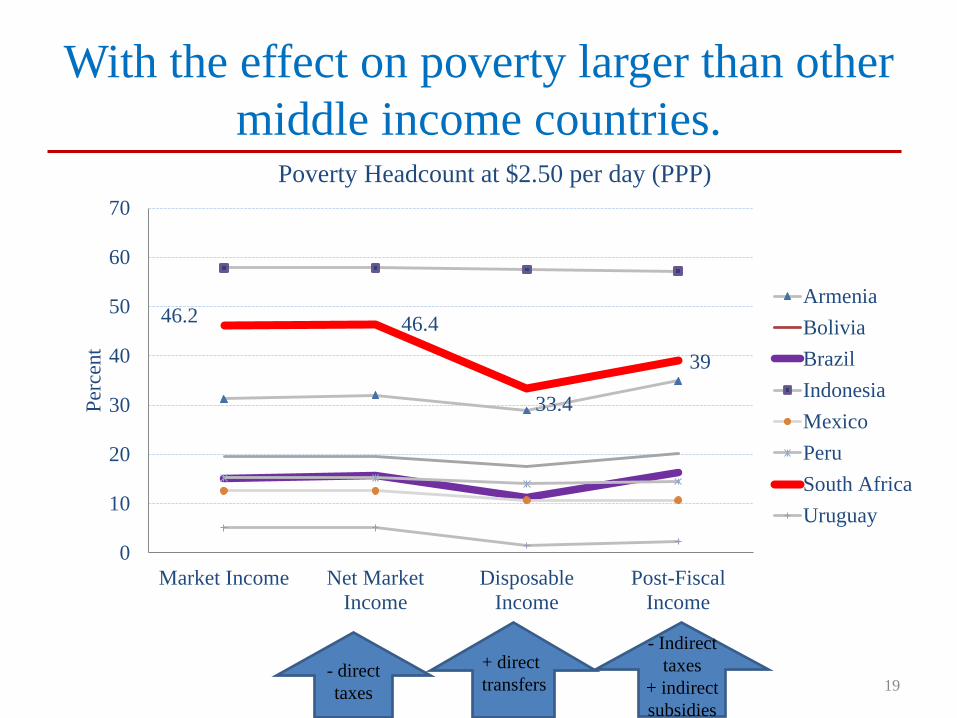
With the effect on poverty larger than other
middle income countries.
19
+ direct
transfers
- Indirect
taxes
+ indirect
subsidies
- direct
taxes
46.2 46.4
33.4
39
0
10
20
30
40
50
60
70
Market Income Net Market
Income
Disposable
Income
Post-Fiscal
Income
Per
cen
t
Poverty Headcount at $2.50 per day (PPP)
Armenia
Bolivia
Brazil
Indonesia
Mexico
Peru
South Africa
Uruguay
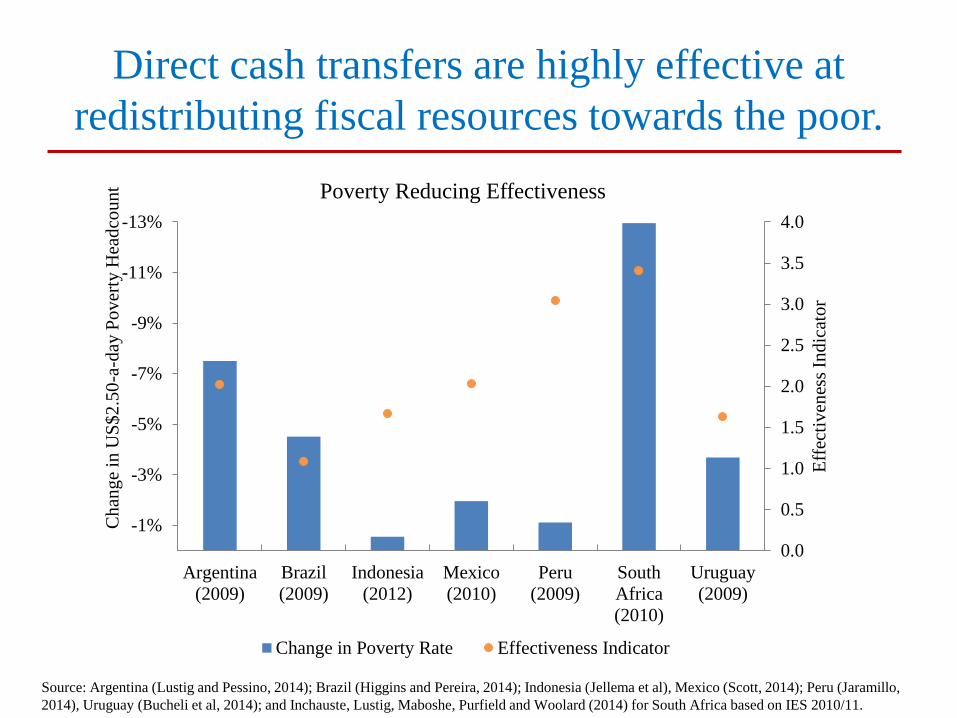
Direct cash transfers are highly effective at
redistributing fiscal resources towards the poor.
0.0
0.5
1.0
1.5
2.0
2.5
3.0
3.5
4.0-13%
-11%
-9%
-7%
-5%
-3%
-1%
Argentina
(2009)
Brazil
(2009)
Indonesia
(2012)
Mexico
(2010)
Peru
(2009)
South
Africa
(2010)
Uruguay
(2009)
Eff
ecti
ven
ess
Ind
icat
or
Ch
ang
e in
US
$2
.50
-a-d
ay P
ov
erty
Hea
dco
un
t Poverty Reducing Effectiveness
Change in Poverty Rate Effectiveness Indicator
Source: Argentina (Lustig and Pessino, 2014); Brazil (Higgins and Pereira, 2014); Indonesia (Jellema et al), Mexico (Scott, 2014); Peru (Jaramillo,
2014), Uruguay (Bucheli et al, 2014); and Inchauste, Lustig, Maboshe, Purfield and Woolard (2014) for South Africa based on IES 2010/11.

Inequality falls substantially with
Government interventions,…
0.771 0.75
0.694 0.695
0.596
0.25
0.35
0.45
0.55
0.65
0.75
0.85
Market Income Net Market
Income
Disposable
Income
Post-Fiscal
Income
Final Income
The Gini Coefficient before and after Taxes, Transfers and Free
Services, Education and Health Falls by over one-fifth
- direct
taxes + transfers
& FBS
- VAT, Fuel,
excise + Educ,
+Health

…more so than in other middle-income
countries…
Source: Armenia (Younger et al, 2014); Bolivia (Paz et al, 2014); Brazil (Higgins and Pereira, 2014); Ethiopia (Woldehanna et al, 2014); Indonesia (Jellema et al 2014); Mexico (Scott, 2014); Peru (Jaramillo, 2014); Uruguay (Bucheli et al, 2014); Lustig(2014) based on Costa Rica (Sauma et al, 2014), El Salvador (Beneke de Sanfeliu et al, 2014), and Guatemala (Cabrera et al, 2014); and own estimates for South Africa based on IES 2010/11.
-0.20
-0.18
-0.16
-0.14
-0.12
-0.10
-0.08
-0.06
-0.04
-0.02
0.00
Change in Gini

…but inequality is still higher after fiscal policy than
inequality prior to fiscal policy in other countries
0.579
0.771
0.694
0.596
0.25
0.35
0.45
0.55
0.65
0.75
Market Income Net Market Income Disposable Income Post-Fiscal Income Final Income
Gini Coefficient for Each Income Concept
Brazil (2009)
Indonesia
(2012)
Mexico (2010)
South Africa
(2010)
0.439
- direct
taxes + transfers
& FBS
- VAT,
- Fuel
- Excise
+ Educ,
+Health

Conclusions
• Taxes are slightly progressive and social
spending is highly progressive.
• South Africa performs very well when
compared with other middle income countries.
• Further poverty and inequality reductions
require more inclusive economic growth.

THANK YOU
25

References
• Bucheli, Marisa, Nora Lustig, Máximo Rossi, and Florencia Amábile. 2014. “Social
Spending, Taxes, and Income Redistribution in Uruguay.” Pubic Finance Review.
Published online 20 Nov 2013.
• Higgins, Sean and Claudiney Pereira. 2014. “The Effects of Brazil’s Taxation and
Social Spending on the Distribution of Household Income.” Pubic Finance Review.
Published online 20 Nov 2013.
• Hill, Ruth, Eyasu Tsehaye, and Tassew Woldehanna. 2014. "The Distributional
Impact of Fiscal Policy in Ethiopia". Background Paper for World Bank Poverty
Assessment. (forthcoming)
• Jaramillo, Miguel. 2014. “The Incidence of Social Spending and Taxes in Peru.”
Pubic Finance Review. Published online 20 Nov 2013.
• Jellema, Jon, Matthew Wai-Poi, and Rythia Afkar. 2014. "the Distributional Impact
of Fiscal Policy in Indonesia". World Bank (forthcoming).

References
• Leibbrandt, M.; I. Woolard; A. Finn; and J. Argent (2010), “Trends in South African
Income Distribution and Poverty since the Fall of Apartheid”, OECD Social,
Employment and Migration Working Papers, No. 101, OECD Publishing, OECD.
doi:10.1787/5kmms0t7p1ms-en.
• Lustig, N. and S. Higgins. 2013. “Commitment to Equity Assessment
(CEQ): Estimating the Incidence of Social Spending, Subsidies and
Taxes. Handbook,” CEQ Working Paper No. 1, revised September 2013.
• Lustig, N. 2012. “Commitment to Equity: Diagnostic Questionnaire” CEQ Working
Paper No. 2.
• Lustig, N. and S. Higgins. 2012. "Fiscal Incidence, Fiscal Mobility and the Poor: a
New Approach,” CEQ Working Paper No. 4, September.
• Lustig, N., Pessino C., and J. Scott. 2013. "The Impact of Taxes and Social
Spending on Inequality in Argentina, Bolivia, Brazil, Mexico, Peru, and Uruguay:
Introduction to the Special Issue". Pubic Finance Review. Published online 20 Nov
2013.

References
• Lustig, Nora and Carola Pessino. 2014. “Social Spending and Income
Redistribution in Argentina in the 2000s: the Rising Role of Noncontributory
Pensions.” Pubic Finance Review. Published online 20 Nov 2013.
• Lustig, N. 2014. “Consumption Taxes, Inequality and the Poor.” CEQ Working
Paper No. 23, Center for Inter-American Policy and Research and Department of
Economics, Tulane University and Inter-American Dialogue.
• Paz Arauco, Veronica, George Gray Molina, Wilson Jiménez Pozo, and Ernesto
Yáñez Aguilar. 2014. “Explaining Low Redistributive Impact in Bolivia” Pubic
Finance Review. Published online 20 Nov 20
• Scott, John. 2014. “Redistributive Impact and Efficiency of Mexico’s Fiscal
System.” Pubic Finance Review. Published online 20 Nov 2013.
• Younger, Stephen D. and Artsvi Khachatryan. 2014. "Fiscal Incidence in Armenia".
Background Paper for World Bank Armenia Public Expenditure Review.
(forthcoming)