Redesigning a Minimum Wage...as servants, guards, valets, palanquin bearers, and labourers.”...
16
CHAPTER Redesigning a Minimum Wage System in India for Inclusive Growth 11 Despite India’s outstanding growth in the last two decades, low pay and wage inequality remain serious obstacles towards achieving inclusive growth. An effective minimum wage policy that targets the vulnerable bottom rung of wage earners can help in driving up aggregate demand and building and strengthening the middle class, and thus spur a phase of sustainable and inclusive growth. However, the present minimum wage system in India is extremely complex with 1,915 minimum wages defined for various scheduled job categories for unskilled workers across various states. Despite its complex structure and proliferation of scheduled employments over time, the Minimum Wages Act,1948 does not cover all wage workers. One in every three wage workers in India has fallen through the crack and is not protected by the minimum wage law. Given this situation, this chapter reviews the situation pertaining to minimum wages in India and suggests the way forward for rationalising and streamlining the policy for minimum wages. INTRODUCTION 11.1 Minimum wages for labour rendered has been a feature of society since ancient times. For instance, the famous Indian treatise from 2nd Century BCE, Arthashastra, ordained “the lowest wages for state employees was 60 panas per year for unskilled workers such as servants, guards, valets, palanquin bearers, and labourers.” Similarly, the minimum wages for agricultural labourers, watchmen, cowherds and other unskilled workers in the private sector was effectively set at 60 panas a year 1 (Chapter-3, Book V:"The Conduct of Courtiers"). Similarly, the Code of Hammurabi, which is often cited as the oldest written laws on record, mentions minimum wages: “If a man hires a workman, then from the beginning of the year until the fifth month he shall give six grains of silver per diem. From the sixth month until the end of the year he shall give five grains of silver per diem.” 11.2 In recent years, minimum wage systems have been strengthened by many countries to lift workers out of poverty and to reduce levels of inequality. The renewed interest in minimum wage arises as recent literature and evidence suggests that minimum wages can promote social justice without any major negative implication for employment if wages are set at an adequate level. 11.3 In the last five years, during a period of global economic slowdown, sluggish global trade and export growth, India’s growth story has been powered by private consumption. Therefore, with 93 per cent 1 One pana was a punch-marked silver/copper coin of the Maurya period.
Transcript of Redesigning a Minimum Wage...as servants, guards, valets, palanquin bearers, and labourers.”...

CHAPTER
Redesigning a Minimum Wage System in India for Inclusive Growth
11
Despite India’s outstanding growth in the last two decades, low pay and wage inequality remain serious obstacles towards achieving inclusive growth. An effective minimum wage policy that targets the vulnerable bottom rung of wage earners can help in driving up aggregate demand and building and strengthening the middle class, and thus spur a phase of sustainable and inclusive growth. However, the present minimum wage system in India is extremely complex with 1,915 minimum wages defined for various scheduled job categories for unskilled workers across various states. Despite its complex structure and proliferation of scheduled employments over time, the Minimum Wages Act,1948 does not cover all wage workers. One in every three wage workers in India has fallen through the crack and is not protected by the minimum wage law. Given this situation, this chapter reviews the situation pertaining to minimum wages in India and suggests the way forward for rationalising and streamlining the policy for minimum wages.
INTRODUCTION11.1 Minimum wages for labour rendered has been a feature of society since ancient times. For instance, the famous Indian treatise from 2nd Century BCE, Arthashastra, ordained “the lowest wages for state employees was 60 panas per year for unskilled workers such as servants, guards, valets, palanquin bearers, and labourers.” Similarly, the minimum wages for agricultural labourers, watchmen, cowherds and other unskilled workers in the private sector was effectively set at 60 panas a year1 (Chapter-3, Book V:"The Conduct of Courtiers"). Similarly, the Code of Hammurabi, which is often cited as the oldest written laws on record, mentions minimum wages: “If a man hires a workman, then from the beginning of the year until the fifth month
he shall give six grains of silver per diem. From the sixth month until the end of the year he shall give five grains of silver per diem.”
11.2 In recent years, minimum wage systems have been strengthened by many countries to lift workers out of poverty and to reduce levels of inequality. The renewed interest in minimum wage arises as recent literature and evidence suggests that minimum wages can promote social justice without any major negative implication for employment if wages are set at an adequate level.
11.3 In the last five years, during a period of global economic slowdown, sluggish global trade and export growth, India’s growth story has been powered by private consumption. Therefore, with 93 per cent
1 One pana was a punch-marked silver/copper coin of the Maurya period.

200 Economic Survey 2018-19 Volume 1
workers in the informal economy, a well designed minimum wage system can reduce inequalities in incomes, bridge gender gaps in wages and alleviate poverty.
11.4 Wage levels and distribution of wages are, to a large extent, influenced not only by skills and productivity levels, but also by the role of labour market institutions, particularly minimum wages and collective bargaining. But for the minimum wage system to play a meaningful role in aligning protection with the promotion of sustainable growth, it must be properly designed, its goals clarified, and its enforcement made effective. However, the minimum wage system in India is extremely complex with a plethora of minimum wages. Given this situation, this chapter reviews the situation pertaining to minimum wages in India and suggests the way forward for rationalising and streamlining the policy for minimum wages.
MINIMUM WAGE SYSTEM IN INDIA 11.5 The Indian Minimum Wage System has been quite a debated and dynamic issue.
• India was one of the first developing countries to introduce minimum wages with the enactment of the Minimum Wages Act way back in 1948. The Act protects both regular and casual workers. Minimum wage rates are set both by the Central and the State governments for employees working in selected ‘scheduled’ employment2. Minimum wages have been set for different categories of workers according to skill levels, location and occupations. The Act did not prescribe norms for fixing the level of the minimum wage. However, it provided for tripartite advisory boards consisting of employers, employees of scheduled employments, and independent
persons to advise the Government in fixing minimum wages.
• The Indian Labour Conference (ILC) of 1957 recommended determining the minimum wage based on the principle of a household’s needs.
• In 1988, the Labour Minister’s Conference made recommendations for linking minimum wage with the cost of living index, which became mandatory in 1991.
• In 1992, the Supreme Court of India ruled that minimum wage should also be linked with aspects such as children’s education, medical requirements etc.
NATIONAL LEVEL MINIMUM WAGE11.6 The idea of a national level minimum wage has been debated since the enactment of the Minimum Wages Act in India. The main argument against a national minimum wage has been the existence of wide disparities in economic development and large variations in cost of living between regions and states. Box 1 portrays the time-line involved in arriving at a National Floor Level Minimum Wage (NFLMW) in India.
COMPLEX MINIMUM WAGE SYSTEM IN INDIA 11.7 Over the last 70 years, the minimum wage system in India has expanded and has become complex. The first set of complexities arises from issues relating to its coverage. Today, there are nearly 429 scheduled employments and 1,915 scheduled job categories for unskilled workers. This massive expansion in job categories and wage rates has led to major variations not only across states but also within states.
11.8 A second set of complexities arises
2 Employments notified under the Minimum Wages Act by the Centre and States.

201Redesigning a Minimum Wage System in India for Inclusive Growth
1969
• First National Commission on Labour.• Recommendation: National Mimimum Wage is neither ‘feasible nor desirable’.
1978
• Bhoothalingam Committee• Argued for adoption of National Floor Level Minimum Wage to ensure a uniform
wage for all workers and enhance protection of the most vulnerable workers and eliminate arbitariness in the determination of level of minimum wages for different States and occupations. Recommendations were mainly for the organized sector.
• Unorganized sector and agriculture were left out.
1991
• National Commision on Rural Labour• Recommended for a National Floor Level Minimum Wage as wide disparites
were prevalent in minimum wages across States.
1996
• Central Government adopted non-statutory National Floor Level Minimum (NFLMW)- ` 35 per day was notified.
• This NFLMW is updated regularly as per CPI.• NFLMW is `176 per day w.e.f. 01.06.2017
from the lack of uniform criteria for fixing the minimum wage rate. In some states or in specific scheduled employments, minimum wages are linked to the cost of living, through a variable dearness allowance (VDA) whereas other states do not include the VDA component. All this affects the level and variation of wage rates that can be observed across and within States.
11.9 The variation of scheduled employments and minimum wage rates within and across states is shown in Figure 1. The number of scheduled employments varies from 3 in Mizoram to 102 in Assam with the number of scheduled employments being in the high double digits in most states. Similarly, the notified lowest minimum wage rate (per day) varies from `115 in Nagaland
to ` 538 in Delhi. The range (difference between highest and lowest minimum wages) in each state varies from ` 16 in Nagaland to ` 905 in Kerala.
11.10 The third set of complexities arises from the fact that Minimum Wages Act does not cover all wage workers. One in every three wage workers in India has fallen through the crack and is not protected by the minimum wage law (ILO, 2018). Some major vulnerable categories – such as domestic workers – are presently covered only in 18 States and Union Territories. Further, the revision of minimum wage rates has often been delayed (Anant and Sundaram, 1998).
11.11 India has taken a number of steps to improve overall coherence, for example, by declaring a national minimum wage floor
Box 1: Timeline of adoption of National Minimum Wage

202 Economic Survey 2018-19 Volume 1
Figure 1: Range of Minimum Wages in India (Rs. per day)
Note: Figures on the horizontal axis indicates the number of scheduled employments notified under the Minimum Wage Act by the Central Government and all the States/Union Territories.Source: The data pertaining to the scheduled employments and minimum wage rates notified by the State/Central Government have been collated from the latest minimum wage notifications issued by the respective Governments. These notifications have been issued at different points of time ranging from December 2014 to April 2019.
and strengthening the coordination of the Central Advisory Board with State Advisory Boards, and by promoting states to determine minimum wage rates through consultations within five broader regional committees. However, a simple system covering as many workers as possible, understood by all, and easily enforceable is the key to improve the effectiveness of minimum wage.
DIFFERENT MINIMUM WAGE ACROSS STATES: IS IT JUSTIFIED?11.12 The main justification for persisting with different levels of minimum wages across states is that they reflect different levels of economic development. In Figure 2, the per capita Net State Domestic Product (NSDP) for 2016-17 is plotted against the most recently notified lowest minimum wage rates. Several states are significant outliers with some of the lowest minimum
wages for unskilled workers notified by the more advanced and industrialised states and vice versa.
REFLECTION OF GENDER DISCRIMINATION THROUGH MINIMUM WAGE PROVISIONS11.13 While the Minimum Wages Act does not discriminate between women and men, an analysis of minimum wages for different occupations shows persistence of systematic bias. For instance, women dominate in the category of domestic workers while men dominate in the category of security guards. While both these occupations fall within the category of unskilled workers, the minimum wage rate for domestic workers within a state is consistently lower than that for the minimum wage rates for security guards (Figure 3). Furthermore, the differences in their minimum wage rates are quite large with the minimum wage rates for security guards
54 76 61 24 19 28 30 67 29 62 15 46 70 90 46 102 58 88 3 88 73 56 72 80 26 56 71 73 20 73 45 50 44 9 75 7 29 115 132 166 170 171 196 200 202 206 213 225 225 235 239
240255 261 268
270280 287 294 294 295
300 304 311 312 325327 336 340 376 401
411 451
538
135
419 410
271350
244 240
596
458
283273
400436 381 428
478
329
415 460430
1192
310 310364
365 329
510
396483 411
772
455 417
581
658 651
710
0
200
400
600
800
1000
1200
1400
1600
1800

203Redesigning a Minimum Wage System in India for Inclusive Growth
Figure 2: Per Capita Net State Domestic Product 2016-17 (at current prices) andLatest Notified Lowest Minimum Wage Rates in India
Source: Per Capita NSDP 2016-17 from CSO. Data pertaining to the lowest minimum wage rates notified by the State/Central Government have been collated from the latest minimum wage notifications issued by the respective Governments. These notifications have been issued at different points of time ranging from December 2014 to April 2019.
Figure 3: Comparison of Minimum Wages for Domestic Workers (Female Dominated) and Security Guards (Male Dominated)
Source: Based on the latest minimum wage notifications issued by the respective state governments.
Andhra Pradesh
Arunachal Pradesh
AssamBihar
Chhattisgarh
GoaGujarat
Haryana
Himachal Pradesh
Rajasthan
Jharkhand
Karnataka
Kerala
MaharashtraMeghalaya
WestBengal
Mizoram
Nagaland
OdishaPunjab Sikkim
Tamil Nadu
Telangana
Uttarakhand
Uttar Pradesh
A & N Islands
Chandigarh
Delhi
Puducherry
0.00
100.00
200.00
300.00
400.00
500.00
600.00
0 50000 100000 150000 200000 250000 300000 350000 400000
Min
imum
Wag
es (i
n `)
Per Capita Net State Domestic Product (in `)
J&K
ManipurMP
319286
171
328
412
233
050
100150200250300350400450
Andhra Pradesh Assam Himachal Pradesh
Domestic Workers Security Guard
204 Economic Survey 2018-19 Volume 1
in Assam being 44 per cent higher than that for domestic workers. Such large differences can only be attributed to gender bias as is obvious from the disparity across states.
COMPLIANCE WITH THE MINIMUM WAGE ACT11.14 The proliferation of minimum wage rates and scheduled employments is a strong deterrent for compliance. Different statutory minimum wage rates for the same occupation between states combined with the wide range between the lowest and highest minimum wages can trigger migration of the industry to lower wage regions/state. As the impact of minimum wage levels on employment and poverty depends on the level of compliance and enforcement (Soundararajan, 2014), it is of paramount importance to rationalise the minimum wage policy.
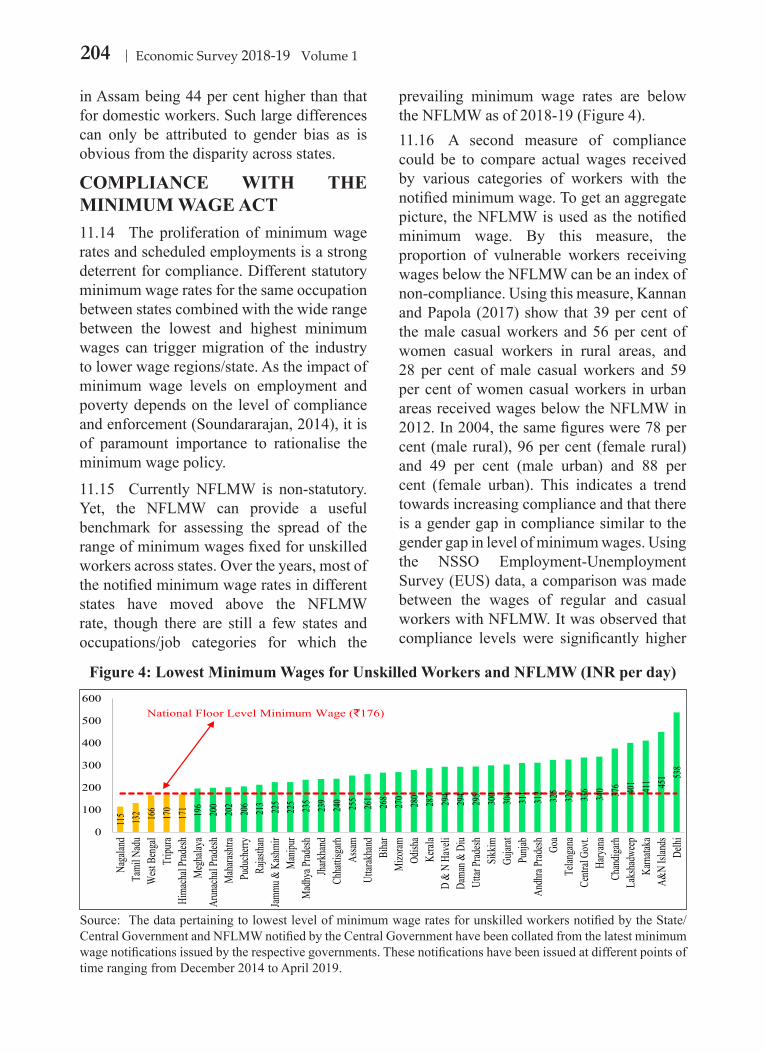
11.15 Currently NFLMW is non-statutory. Yet, the NFLMW can provide a useful benchmark for assessing the spread of the range of minimum wages fixed for unskilled workers across states. Over the years, most of the notified minimum wage rates in different states have moved above the NFLMW rate, though there are still a few states and occupations/job categories for which the
prevailing minimum wage rates are below the NFLMW as of 2018-19 (Figure 4).11.16 A second measure of compliance could be to compare actual wages received by various categories of workers with the notified minimum wage. To get an aggregate picture, the NFLMW is used as the notified minimum wage. By this measure, the proportion of vulnerable workers receiving wages below the NFLMW can be an index of non-compliance. Using this measure, Kannan and Papola (2017) show that 39 per cent of the male casual workers and 56 per cent of women casual workers in rural areas, and 28 per cent of male casual workers and 59 per cent of women casual workers in urban areas received wages below the NFLMW in 2012. In 2004, the same figures were 78 per cent (male rural), 96 per cent (female rural) and 49 per cent (male urban) and 88 per cent (female urban). This indicates a trend towards increasing compliance and that there is a gender gap in compliance similar to the gender gap in level of minimum wages. Using the NSSO Employment-Unemployment Survey (EUS) data, a comparison was made between the wages of regular and casual workers with NFLMW. It was observed that compliance levels were significantly higher
Figure 4: Lowest Minimum Wages for Unskilled Workers and NFLMW (INR per day)
Source: The data pertaining to lowest level of minimum wage rates for unskilled workers notified by the State/Central Government and NFLMW notified by the Central Government have been collated from the latest minimum wage notifications issued by the respective governments. These notifications have been issued at different points of time ranging from December 2014 to April 2019.
115 132 166
170
171 196
200
202
206
213
225
225
235
239
240 255
261
268
270
280
287
294
294
295
300
304
311
312 325
327
336
340 376 401
411 45
1 538
0
100
200
300
400
500
600
Naga
land
Tami
l Nad
uW
est B
enga
lTr
ipura
Hima
chal
Prad
eshM
egha
laya
Arun
acha
l Prad
eshM
ahara
shtra
Pudu
cherr
yRa
jastha
nJam
mu &
Kash
mir
Man
ipur
Mad
hya P
radesh
Jhark
hand
Chha
ttisga
rhAs
samUt
tarak
hand
Biha
rM
izoram
Odish
aKe
rala
D &
N Ha
veli
Dama
n & D
iuUt
tar Pr
adesh
Sikkim
Gujar
atPu
njab
Andh
ra Pr
adesh Go
aTe
langa
naCe
ntral
Govt.
Harya
naCh
andig
arhLa
ksha
dwee
pKa
rnatak
aA&
N Isl
ands
Delhi
National Floor Level Minimum Wage (`176)

205Redesigning a Minimum Wage System in India for Inclusive Growth
Figure 5: Percentage of Regular Workers Receiving Wages over the NFLMW, 2012
Source: Based on unit level data of the NSS Employment-Unemployment Survey, 2011-12.
Figure 6: Percentage of Casual Workers Receiving Wages over the NFLMW, 2012
Source: Based on unit level data of the NSS Employment –Unemployment Survey, 2011-12
0.0010.0020.0030.0040.0050.0060.0070.0080.0090.00
100.00
INDIA - 80.6
0.0010.0020.0030.0040.0050.0060.0070.0080.0090.00
100.00INDIA-58.05

206 Economic Survey 2018-19 Volume 1
for regular wage workers when compared to casual wage earners, as indicated in Figures 5 & 6.
IMPACT OF MINIMUM WAGES 11.17 What has been the impact of minimum wage on the labour market in India? To what extent has it been successful in fulfilling the goal of protecting the vulnerable workers, improving general wage levels, and reducing inequality and poverty? In this context, it must be remembered that a well-designed minimum wage system is only one of the several institutional mechanisms necessary for a meaningful impact on all these factors.
Impact on wage levels11.18 Rani, Belser and Ranjbar (2013) demonstrate that minimum wage in India does not operate as a conventional floor wage to protect the lowest paid workers. Nevertheless, the study shows the presence of a “lighthouse effect”, i.e., the minimum wage acts as a benchmark that pulls up wages in the low-paid and informal sector by enhancing the bargaining power of vulnerable workers. 11.19 Menon and Rodgers (2017) use household survey data from 1982-83 and 2008 to show a marked increase in compliance between these two periods with a stronger impact on male wages compared to female wages and on regular wages compared to casual wages during this period. Using data for workers in the construction industry, Soundararajan (2018) shows the presence of the “lighthouse effect” of minimum wage. Specifically, minimum wage seems to have shaped wage bargaining, thereby leading to rise in actual wages.
11.20 Rani and Ranjbar (2015) show that the minimum wage does impact the distribution of actual wages, with the impact depending on wage quantile. They show
that for 2009-10, the marginal effects of the effective minimum wage increases gradually as we move towards the 80th quantile, i.e., the marginal wage pushes up the wages disproportionately more on the lower side of the wage distribution. This is quite different from the marginal effects observed in 2004-05, when the marginal effects of an increase in the minimum wage were greater at the higher levels of the income distribution than at lower levels (Figure 7).
Figure 7: Effect of minimum wages on wage distribution in India
Source: Rani and Ranjbar (2015)
Impact on Wage Inequality11.21 International experience suggests that greater compliance with minimum wages has led to reduction in wage inequality. India’s experience regarding the impact of minimum wages on wage inequality needs to be evaluated keeping in mind the segmentation in the labour market and variations across various categories of workers.
11.22 Between 1993 and 2011, the average real wages increased in India, with the fastest growth recorded for casual labour, women’s labour, and rural/agricultural labour (ILO 2018). Despite these increases, the existing wage inequality measured by the Gini coefficient remains very high by international standards (Figure 8) 3. Going deeper, it is seen
3 The Gini coefficient is a commonly-used measure of income inequality that condenses the entire income distribution for a country into a single number between 0 and 1: the higher the number, the greater the degree of income inequality.

207Redesigning a Minimum Wage System in India for Inclusive Growth
Figure 8: Gini Coefficient for Regular and Casual Workers: 1993-94 to 2011-12
Source: ILO, 2018.
that this inequality has increased amongst regular workers while it has decreased among casual workers.
11.23 A similar trend is visible when we measure wage inequality through wage dispersion ratios (Tables 1 and 2). The ratio of the average wage rate of the top 10 per cent
compared to the wage rate of the bottom 10 per cent of wage earners (P90/P10) declined among casual workers and increased among regular workers, except regular male rural workers. The ratio of the wage rate of the middle 10 per cent of wage earners (50th decile or P50) to the bottom 10 per cent declined consistently during 1993-2011 for
Table 1: Rural Wage Inequality Dispersion Ratios: 1993-94 to 2011-12 1993-94 2004-05 2011-12
(P90/P10)
(P90/P50)
(P50/P10)
(P90/P10)
(P90/P50)
(P50/P10)
(P90/P10)
(P90/P50)
(P50/P10)
RuralRegular
Male 7.6 2.3 3.3 9 3.5 2.6 7.1 3.6 2.0Female 12 4.3 2.8 15 5.8 2.6 12.5 5.0 2.5
CasualMale 3.3 2.0 1.7 2.9 1.7 1.7 2.9 1.7 1.7Female 3.1 1.7 1.8 2.8 1.8 1.5 2.5 1.5 1.7
Table 2: Urban Wage Inequality Dispersion Ratios 1993-94 to 2011-12 1993-94 2004-05 2011-12
(P90/P10)
(P90/P50)
(P50/P10)
(P90/P10)
(P90/P50)
(P50/P10)
(P90/P10)
(P90/P50)
(P50/P10)
UrbanRegular
Male 7.0 2.3 3.0 8.6 3.2 2.7 8.9 3.5 2.5Female 12.9 2.6 5.0 18.7 5.6 3.3 15.6 5.0 3.1
CasualMale 3.7 1.8 2.0 3.1 1.8 1.8 3.0 1.9 1.6Female 3.8 1.8 2.1 3.5 1.8 2.0 4.0 2.0 2.0
Source: ILO, 2018.
0.41
0.30
0.460.49
0.28
0.500.49
0.26
0.47
0.00
0.10
0.20
0.30
0.40
0.50
0.60
Regular Casual All
1993-94 2004-05 2011-12

208 Economic Survey 2018-19 Volume 1
regular and casual workers, both for males and females in urban and rural areas. Thus, there is a ‘catching up’ process because of the faster increase of wages of casual workers, which substantiates the ‘lighthouse effect’ of minimum wages.
11.24 This mixed trend of wage inequality – increasing amongst regular workers and declining amongst the bottom and middle level of all workers – can perhaps be explained by the rise of average minimum wages, in consonance with the increase in Mahatma Gandhi National Rural Employment Guarantee Scheme (MGNREGS) wages, which were benchmarked to minimum wages (Berg et al., 2018). It is, therefore, established that well-designed and effective implementation of minimum wages will strengthen the trend towards decreasing wage
inequality especially at lower levels. This becomes all the more significant as women constitute the majority of the bottom rungs of the wage distribution. This also shows how compliance of the statute is imperative for increasing welfare.
Impact on Employment11.25 Broecke (2017) finds in a meta-study on employment across Brazil, Chile, China, Colombia, India, Indonesia, Mexico, the Russian Federation, South Africa and Turkey that minimum wages have only a minimal (or no) impact on employment in emerging economies.
11.26 Rani, Belser and Ranjbar (2013), in a study of 70 districts of India, find that there was no impact of minimum wages on employment between 2005 and 2010.
BOX 2: MINIMUM WAGE SYSTEM IN BRICS
BRICS countries have varied systems in terms of coverage, degree of tripartite consultation, criteria for setting the minimum wage and adjustment procedure. However, in all these countries, minimum wages are explicitly embedded within a larger wage policy aimed at balancing needs of the workers with overall economic factors.
Table 3: Minimum Wage System in BRICS countries
Brazil China Russia South Africa IndiaCoverage National
minimum wage, covering all workers. Regions can also define minimum wages above the national level.
Minimum wage rates are established by province.
Regional minimum wages that coexist with a national minimum wage. The regional minimum wages are fixed above the federal rate.
A national minimum wage was approved in 2018, covering all groups of wage earners.
Minimum wages are limited to Scheduled Employments, diff. skills & occupations.

209Redesigning a Minimum Wage System in India for Inclusive Growth
Consultation ‘Quadripartite commission’ in 2005, composed of federal government, state government, employers and unions, formulates a long-term minimum wage policy - until 2019.
Administrative authorities, in charge of labour issues prepare a programme to fix and adjust minimum wages.
Russian Tripartite Committee- the Employers’ association, trade unions and the Government of the Russian Federation decides.
The tripartite Employment Conditions Commission (ECC) advises the Minister of Labour on the determination of the minimum wage.
Minimum Wages are set through Notification or Consultation, based on the tripartite Advisory Board and Committees set for this purpose.
Criteria Minimum wage is increased by the sum of inflation in the previous year plus the GDP growth of 2 years before (if >0)
Cost of living of workers and their dependents; the consumption price index; the average wages of workers; labour productivity; the urban economic situation; and the level of economic development.
Regions choose different criteria for their minimum wages but the subsistence minimum is a need-based income level that is the benchmark that guarantees minimum consumption requirements.
Cost of living and minimum living levels, poverty alleviation, wage differentials & inequality, OSH, conditions and level of employment, inflation, GDP, productivity, collective bargaining.
Adopted need-based norms from the 1957, 15th ILC Session and 1992 Supreme Court Judgment
Adjustment Adjusted on an annual basis
At least every two years, and whenever appropriate when the indicators change.
No specific periodicity
Regular annual adjustment.
Adjusted at least every five years.
Source: ILO, 2018
However, Menon and Rogers (2017) report a positive effect of minimum wages on employment levels for both men and women. They find that a 10 per cent rise in minimum wages raised the employment level by 6.34 percentage points in rural areas while it had a statistically insignificant impact on urban employment levels for both men and women.
WAY FORWARD11.27 It is evident from above that a well-designed minimum wage system can be
a potent tool for protecting workers and alleviating poverty, if set at an appropriate level that ensures compliance. International experience has shown that relatively simple systems are more effective and usually complex systems are least effective. Cunningham (2007) and Ghose (1997) show that a complex system of minimum wages shows lack of coherence about wage levels and wages being set in an arbitrary fashion. United Kingdom, for example, abolished its system of industry-wide trade boards in the

210 Economic Survey 2018-19 Volume 1
1980s and replaced it with a simple national minimum wage. This trend is reflected in evolution of ILO standards as well, which earlier encouraged the adoption of a select system of minimum wages to groups of workers who are in a weak bargaining position in the labour market, but later promoted a comprehensive approach that covers as many workers as possible.
11.28 Multiple minimum wages usually exist to take care of the needs of a heterogeneous labour force. For example, this is the case in India and the Latin American Countries that have a high diversity of labourers. Some policy recommendations for an effective
design of minimum wages system are as follows:
Simplification and Rationalisation: Rationalisation of minimum wages as proposed under the Code on Wages Bill needs to be supported. This code amalgamates the Minimum Wages Act, 1948, the Payment of Wages Act, 1936, the Payment of Bonus Act, 1965 and the Equal Remuneration Act, 1976 into a single piece of legislation. The definition of wage in the new legislation should subsume the present situation of 12 different definitions of wages in different Labour Acts.
Figure 9: Geographical regions as determined by the Expert Committee on determining the methodology for fixing the National Minimum Wage, 2019
Source: Expert Committee on determining the methodology for fixing the National Minimum Wage, 2019

211Redesigning a Minimum Wage System in India for Inclusive Growth
Setting a National Floor Level Minimum Wage: Central Government should notify a “national floor minimum wage” that can vary across the five geographical regions (Figure 9). Thereafter, states can fix the minimum wages, which shall not be less than the “floor wage.” This would bring some uniformity in the minimum wages across country and would make all states almost equally attractive from the point of view of labour cost for investment as well as reduce distress migration.
Criteria for setting minimum wage: Further, the Code on Wages Bill should consider fixing minimum wages based on either of the two factors viz; (i) the skill category i.e unskilled, semi-skilled, skilled and highly skilled; and (ii) the geographical region, or else both. This key change would substantially reduce the number of minimum wages in the country. For instance, Madhya Pradesh has notified minimum wages based on just four skill levels of unskilled, semi-skilled, skilled and highly skilled across occupations and regions. The state has just four basic minimum wages for the four skill categories.
Coverage: The proposed Code on Wages Bill should extend applicability of minimum wages to all employments/workers in all sectors and should cover both the organized as well as the unorganized sector.
Regular adjustment: A mechanism should be developed to adjust minimum wages regularly and more frequently, similar to countries like Montenegro, Nicaragua, Netherlands, Uruguay, and Costa Rica, where the minimum wage adjustment takes place every six months (ILO, 2014). A dashboard needs to be set up by the Ministry of Labour & Employment, which shows the date
of the last revision in the minimum wage adjunct to the mandated period. This would enable dissemination of information and increased transparency in the system.
Role of Technology: The concept of ‘bounded rationality’ in behavioural economics is that there are restrictions to human information processing, due to limits in knowledge (or information) and computational capacities (Kahneman, 2003). A complex system with multiplicity of wages across states and across occupations sets limits on how workers process the information available and use it to their benefit. Technology can help in overcoming this behavioural bias by making information available in a simple and clear manner. Use of a variety of online, mobile phone and networking technologies have the potential to facilitate the collection and analysis of labour statistics, assist with the dissemination of information about labour laws and policies, reduce costs and improve transparency. A national level dashboard can be created at the Centre with access to the state governments whereby the states can regularly update the notifications regarding minimum wages. This portal must be made available at Common Service Centres (CSCs), rural haats etc., with the required mass media coverage so that the workers are well-informed and their bargaining skills and decision-making power are strengthened. Uniformity in minimum wages would also encourage industries to move towards interior areas and thereby reduce labour migration. Information on various combinations of wages, occupations/skills and states can be made available so that workers can get easy access to whatever combination of minimum wages they want to know. The system should be built in a way that

212 Economic Survey 2018-19 Volume 1
flashes ‘red’ alerts if the statute is not being followed in any state or occupation in the notified area.
Grievance redressal: There should be an easy to remember toll-free number for anybody to register his grievance on non-payments of the statutory minimum wages. This number should be given wide publicity to make people aware of this avenue for grievance redressal. Swift action should be taken against the offenders and this action should be flashed on the dashboard without going into specific details. The impression of action being taken would act as a deterrent to employers to flout the statute.
Box 3 : Use of Technology for Minimum Wage Enforcement- Cross Country Experiences
In UAE, all enterprises have been legally required to pay wages for both national and migrant workers through banks and other financial service providers. This system allows the Ministry of Labour to have a comprehensive wage database and an electronic wage payment monitoring mechanism for enterprises within the country.
In South Africa a system, called ‘Impimpi Alive’, enables workers to send anonymous SMS messages to the Department of Labour (DOL) after which an inspector is dispatched to the employer’s place of business within 48 hours.
In U.S. an app – The Wage & Hour Guide for Employers App – puts federal and state wage and hour laws at the fingertips of employers as well as law makers for better transparency.
U.S. also has an app – GovDocs Minimum Wage app that provides the most up-to-date minimum wage rate data for all company locations.
CHAPTER AT A GLANCE The present minimum wage system in India is complex with 1,915 minimum wages defined for
various scheduled job categories across various states.
One in every three wage workers in India is not protected by the minimum wage law.
Minimum wages should be fixed for four categories namely, unskilled, semi-skilled, skilled and highly skilled based on the geographical region and should cover all workers, irrespective of any wage ceilings.
A simple, coherent and enforceable Minimum Wage System should be designed with the aid of technology as minimum wages push wages up and reduce wage inequality without significantly affecting employment.
An effective minimum wage policy is a potential tool not only for the protection of low-paid workers but is also an inclusive mechanism for more resilient and sustainable economic development.
11.29 To sum up, the world of work is in a churn as technology is heralding major transformations both in the workplace as well as in work and employment relations. The impact is being felt both in the developed and developing countries. For India, undergoing a delayed structural and demographic transition, the challenges posed by the technology driven changes are enormous. Expanding decent employment to young aspirants in the labour markets is a major concern. Establishing an effective minimum wage system that will lead to inclusive growth is therefore an urgent necessity.

213Redesigning a Minimum Wage System in India for Inclusive Growth
REFERENCESAnant, T.C.A., and K. Sundaram. 1998. “Wage Policy in India: A Review.” The Indian Journal of Labour Economics,Vol. 41 (4) 815-834.
Berg, E., Bhattacharyya, S., Rajasekhar, D., & Manjula, R. 2018. “Can public works increase equilibrium wages? Evidence from India’s National Rural Employment Guarantee.” World Development,103 239-254.
Broecke, Stijn, Alessia Forti, and Marieke Vandeweyer. 2017. “The effect of minimum wages on employment in emerging economies: A survey and meta-analysis.” Oxford Development Studies, 45, No.3 366-391.
Cunningham, Wendy. 2007. Minimum Wages and Social Policy : Lessons from Developing Countries. Washington.D.C.: World Bank.
Ghose, A.K. 1997. “Should there be a national minimum wage in India?” The Indian Journal of Labour Economics, 40(44) 697-713.
Goldar, B. and Banga, R. 2005. “Wage-productivity Relationship in Organised Manufacturing in India: a State-wise Analysis.” The Indian Journal of Labour Economics, 48(2) 259-272.
Government of India. 2019. Report of the Expert Committee on Determining the Methodology for Fixing the National Minimum Wage. Expert Group, New Delhi: Ministry of Labour and Employment.
International Labour Organisation. 2018. India Wage Report: Wage Policies for Decent Work and Inclusive Growth. Geneva: ILO.
International Labour Organisation. 2014. Minimum Wage Systems. International Labour Conference, 103rd Session, Geneva: ILO.
International Labour Organization. 2018. New technologies and the transition to formality: The trend towards e–formality, Employment Policy Department, Employment Working Paper No. 247. Geneva: ILO.
Kahneman, Daniel. 2003. “Maps of Bounded Rationality: Psychology for Behavioral Economics.” American Economic Review, 93 (5) 1449-1475.
Menon, N. and Rodgers, Y. 2018. “Child Labour and the Minimum Wage: Evidence from India.” Journal of Comparative Economics, 46 480-494.
Menon, N. and Rodgers, Y. 2017. “The Impact of the Minimum Wage on Male and Female Employment and Earnings in India.” Asian Development Review, 34(1) 28–64.
Papola, T.S. and Kannan, K.P. 2017. Towards an India Wage Report. New Delhi: ILO.
Rani, U., & Ranjbar, S. 2015. “Impact of Minimum wages on wage quantiles: Evidence from developing countries.” 4th Conference of the Regulating for the Decent Work Network. Geneva: ILO.
Rani, U., Belser, P., and Ranjbar, S. 2013. Role of Minimum Wages in Rebalancing the Economy. World of Work Report 2013: Repairing the Economic and Social Fabric, Geneva: ILO.
Soundararajan, V. 2018. Heterogeneous Effects of Imperfectly Enforced Minimum Wages in Low-Wage Labour Markets. Working Paper, Bengaluru: Indian Institute of Management.
Soundararajan, V. 2014. Minimum Wage Effects at Different Enforcement Levels: Evidence from Employment Surveys in India. Working Paper Series, Cornell: Charles H. Dyson School of Applied Economics and Management, Cornell University.
Wolfson, Paul. 2019. A Review of Consequences of the Indian Minimum Wage on Indian Wages and Employment. Geneva: forthcoming as a Publication of the International Labour Organisation.