REDD+ Project for Caribbean Guatemala -...
214
MONITORING & IMPLEMENTATION REPORT VCS Version 3.6, CCB Standards Second Edition v3.0 1 REDD+ PROJECT FOR CARIBBEAN GUATEMALA: THE CONSERVATION COAST MONITORING & IMPLEMENTATION REPORT Karen Aguilar, Development Director [email protected] Document Prepared By Paz Lozano, Manager of Development Services [email protected] Kyle Holland, Managing Director [email protected]
Transcript of REDD+ Project for Caribbean Guatemala -...

MONITORING & IMPLEMENTATION REPORT VCS Version 3.6, CCB Standards Second Edition
v3.0 1
REDD+ PROJECT FOR CARIBBEAN
GUATEMALA: THE CONSERVATION
COAST
MONITORING & IMPLEMENTATION
REPORT
Karen Aguilar, Development Director
Document Prepared By
Paz Lozano, Manager of Development Services
Kyle Holland, Managing Director

MONITORING & IMPLEMENTATION REPORT VCS Version 3.6, CCB Standards Second Edition
v3.0 2
Project Title REDD+ Project for Caribbean Guatemala: The Conservation Coast
Version 2.3
Report ID
Date of Issue 9 January 2017
Project ID
Monitoring Period 1 April 2012 – 31 March 2014
Prepared By Ecological Carbon Offsets Partners, LLC (ecoPartners)
and
Fundacion para el Ecodesarrollo y la Conservacion (FUNDAECO)
Contact ecoPartners
Phone: +1 (415) 634-4650
Address: 2930 Shattuck Ave, Suite 305, Berkeley, CA 94705
Email: [email protected]
Website: www.epcarbon.com
MONITORING & IMPLEMENTATION REPORT VCS Version 3.6, CCB Standards Second Edition
v3.0 3
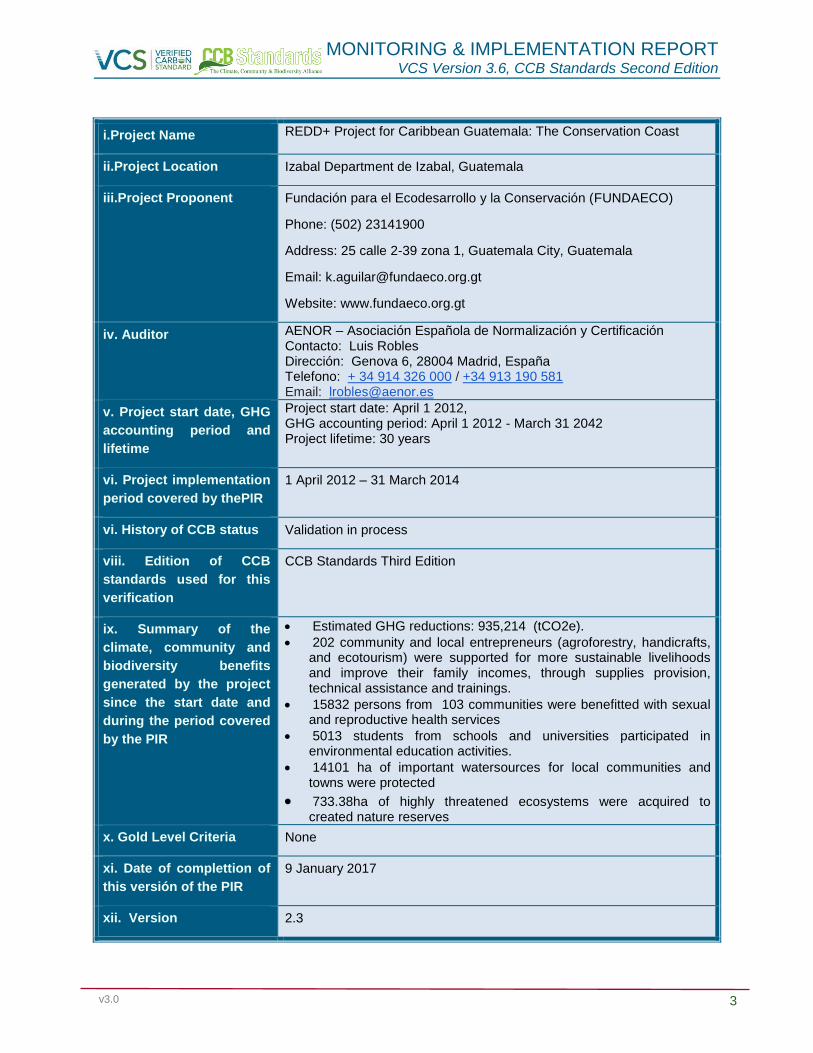
i.Project Name REDD+ Project for Caribbean Guatemala: The Conservation Coast
ii.Project Location Izabal Department de Izabal, Guatemala
iii.Project Proponent Fundación para el Ecodesarrollo y la Conservación (FUNDAECO)
Phone: (502) 23141900
Address: 25 calle 2-39 zona 1, Guatemala City, Guatemala
Email: [email protected]
Website: www.fundaeco.org.gt
iv. Auditor AENOR – Asociación Española de Normalización y Certificación Contacto: Luis Robles Dirección: Genova 6, 28004 Madrid, España Telefono: + 34 914 326 000 / +34 913 190 581 Email: [email protected]
v. Project start date, GHG
accounting period and
lifetime
Project start date: April 1 2012, GHG accounting period: April 1 2012 - March 31 2042 Project lifetime: 30 years
vi. Project implementation
period covered by thePIR
1 April 2012 – 31 March 2014
vi. History of CCB status Validation in process
viii. Edition of CCB
standards used for this
verification
CCB Standards Third Edition
ix. Summary of the
climate, community and
biodiversity benefits
generated by the project
since the start date and
during the period covered
by the PIR
Estimated GHG reductions: 935,214 (tCO2e).
202 community and local entrepreneurs (agroforestry, handicrafts, and ecotourism) were supported for more sustainable livelihoods and improve their family incomes, through supplies provision, technical assistance and trainings.
15832 persons from 103 communities were benefitted with sexual and reproductive health services
5013 students from schools and universities participated in environmental education activities.
14101 ha of important watersources for local communities and towns were protected
733.38ha of highly threatened ecosystems were acquired to created nature reserves
x. Gold Level Criteria None
xi. Date of complettion of
this versión of the PIR
9 January 2017
xii. Version 2.3

MONITORING & IMPLEMENTATION REPORT VCS Version 3.6, CCB Standards Second Edition
v3.0 4
Table of Contents
1 General ..................................................................................................................................................................... 10 1.1 Summary Description of the Project (G1) ......................................................................................... 10
1.1.1 Project Objectives ...................................................................................................................... 10
1.2 Project Location (G1 & G3) ............................................................................................................... 12
1.2.1 Soil .............................................................................................................................................. 12
1.2.2 Geology ...................................................................................................................................... 14
1.2.3 Climate ....................................................................................................................................... 15
1.3 Project Proponent (G1, G4) ............................................................................................................... 17
1.4 Other Entities Involved in the Project (G4) ....................................................................................... 18
1.4.1 Technical Skills and Capacity ...................................................................................................... 19
1.4.2 Regulators .................................................................................................................................. 19
1.4.3 GHG Program Administrators .................................................................................................... 19
1.5 Project Start Date .............................................................................................................................. 20
1.5.1 Program Start Date .................................................................................................................... 20
1.5.2 Project Activity Instance Start Dates .......................................................................................... 20
1.6 Project Crediting Period .................................................................................................................... 22
2 Implementation of Design ........................................................................................................................................ 22 2.1 Sectoral Scope and Project Type ....................................................................................................... 22
2.1.1 Grouped Project ......................................................................................................................... 22
2.1.2 Project Area................................................................................................................................ 23
2.2 Description of the Project Activity (G2) ............................................................................................ 24
2.2.1 Activities Leading to Net GHG Emissions Reductions ................................................................ 24
2.2.2 Activities Leading to Community and Biodiversity Benefits ...................................................... 25
2.3 Management of Risks to Project Benefits (G1) ................................................................................. 26
2.3.1 Climate Risks .............................................................................................................................. 27
2.3.2 Community Risks ........................................................................................................................ 27
2.3.3 Biodiversity Risks ........................................................................................................................ 28
2.4 Measures to Maintain High Conservation Values (B1, B2, CM1, CM2) ............................................ 29
2.4.1 Community High Conservation Values (CM1, CM2) .................................................................. 29
2.4.2 Biodiversity High Conservation Values (B1, B2) ......................................................................... 30
2.5 Project Financing (G3 & G4) .............................................................................................................. 32
MONITORING & IMPLEMENTATION REPORT VCS Version 3.6, CCB Standards Second Edition
v3.0 5
2.4.2 Employment Training ................................................................................................................. 32
2.5 Equal Opportunities for Employment (G4) ....................................................................................... 34
2.5.1 Worker’s Rights .......................................................................................................................... 35
2.5.2 Worker Safety ............................................................................................................................ 36
2.6 Stakeholders (G3) .............................................................................................................................. 37
2.6.1 Stakeholder Engagement Structure ........................................................................................... 37
2.6.2 Public Comment Period ............................................................................................................. 38
2.6.3 Stakeholder Conflict and Grievances ......................................................................................... 38
3 Legal Status ............................................................................................................................................................... 39 3.1 Compliance with Laws, Statues, Property Rights and Other Regulatory Frameworks (G3 & G5) .... 39
3.2 Evidence of Project Ownership (G5) ................................................................................................. 41
3.3 Emissions Trading Programs and Other Binding Limits (G5) ............................................................ 42
3.4 Participation under Other GHG Programs (G5) ................................................................................ 42
3.5 Other Forms of Environmental Credit (G5) ....................................................................................... 42
3.6 Projects Rejected by Other GHG Programs (G5) ............................................................................... 42
3.7 Respect for Rights and No Involuntary Relocation (G5) ................................................................... 42
3.8 Illegal Activities and Project Benefits (G5) ........................................................................................ 43
4 Application of Methodology ..................................................................................................................................... 44 4.1 Title and Reference of Methodology ................................................................................................ 44
4.2 Deviations from the Monitoring Plan ............................................................................................... 44
4.3 Project Boundary (G1) ....................................................................................................................... 44
4.4 Baseline Scenario (G2) ...................................................................................................................... 45
4.4.1 Without-Project Scenario for Communities (CM1) ................................................................... 46
4.4.2 Without-Project Biodiversity Scenario (B1) ............................................................................... 47
4.5 Additionality (G2) .............................................................................................................................. 49
4.5.1 VCS Tool for the Demonstration of Additionality ...................................................................... 49
4.5.2 Community and Biodiversity Benefits ........................................................................................ 57
5 Monitoring Data and Parameters ............................................................................................................................. 60 5.1 Description of the Monitoring Plan (CL4, CM4 & B4) ....................................................................... 60
5.1.1 Organization and Management ................................................................................................. 61
5.1.2 Monitoring Methods .................................................................................................................. 62
5.1.3 Data Management ..................................................................................................................... 66
5.1.4 Reporting Methods .................................................................................................................... 66
MONITORING & IMPLEMENTATION REPORT VCS Version 3.6, CCB Standards Second Edition
v3.0 6
5.1.5 Quality Assurance and Control .................................................................................................. 67
5.2 Data and Parameters Available at Validation (CL4) .......................................................................... 67
5.3 Data and Parameters Monitored (CL4, CM4 & B4) ......................................................................... 140
5.3.1 Climate ..................................................................................................................................... 140
5.3.2 Community (CM4) ............................................................................................................. 155
5.3.3 Biodiversity (B4) ....................................................................................................................... 162
6 Quantification of GHG Emission Reductions and Removals (GCL1, CL2, CL3) ........................................................ 166 6.1 Baseline Emissions (CL1) ................................................................................................................. 166
6.2 Project Emissions (CL2) ................................................................................................................... 178
6.2.1 Observed LULC Changes........................................................................................................... 178
6.3 Leakage (CL3) .................................................................................................................................. 182
6.3.1 Leakage Belt ............................................................................................................................. 182
6.3.2 Leakage Emissions .................................................................................................................... 185
6.4 Summary of GHG Emission Reductions and Removals (CL1, CL2) .................................................. 191
6.5 Climate Change Adaptation Benefits (GL1) .................................................................................... 191
7 Community ............................................................................................................................................................. 192 7.1 Net Positive Community Impacts (CM2 & CM4) ............................................................................. 192
7.1.1 Resource Protection ................................................................................................................. 192
7.1.2 Sustainable Enterprise ............................................................................................................. 194
7.1.3 Community Empowerment and Inclusiveness ........................................................................ 196
7.1.4 Education ................................................................................................................................. 198
7.1.5 Access to Resources ................................................................................................................. 201
7.2 Negative Offsite Stakeholder impacts (CM3 & CM4) ..................................................................... 204
8 Biodiversity ............................................................................................................................................................. 204 8.1 Net Positive Biodiversity Impacts (B2 & B4) ................................................................................... 204
8.1.1 Resource Protection ................................................................................................................. 206
8.1.1 Empowerment and Inclusiveness ............................................................................................ 208
8.1.2 Education ................................................................................................................................. 209
8.1.3 Access to Resources ................................................................................................................. 211
8.2 Negative Offsite Biodiversity Impacts (B3 & B4) ............................................................................. 212
9 References .............................................................................................................................................................. 214
Tables

MONITORING & IMPLEMENTATION REPORT VCS Version 3.6, CCB Standards Second Edition
v3.0 7
Table 1. Extent of each soil cover in hectares and its percentages ........................................................... 14 Table 2. Project proponent details. ............................................................................................................ 17 Table 3. Other entities involved in the project. ......................................................................................... 18 Table 4. Examples of project activity instances for the establishment of project start dates for each parcel. ......................................................................................................................................................... 22 Table 5. Non-Permanence risk rating for each defined risk area within the Grouped Project Area. *Overall risk rating cannot be below 10. .................................................................................................... 27 Table 6. Community training opportunities. ............................................................................................... 33 Table 7. External organizations supporting training programs................................................................... 34 Table 8. Laws, their relevance and project compliance. ............................................................................. 41 Table 9. Illegal activities which may negatively affect the Project. ............................................................ 44 Table 10. Carbon pools inside the Project .................................................................................................. 45 Table 11. Sources of emissions inside the Project. ..................................................................................... 45 Table 12. Biodiversity problem flow analysis. ...................................................................................... 49 Table 13. Average values of explanatory spatial variables of deforestation with the Grouped Project Area, the Grouped Project Area san Zonas Nucleos, and the forest area in the Zona Nucleos. ..................................................................................................................................................... 53 Table 14. Theory of change overview for biodiversity related project activities. ...................................... 60 Table 15. Selected carbon pools in the project scenario. ........................................................................... 63 Table 16. Data used for historical LULC analysis ......................................................................................... 64 Table 17. Annual areas deforested per forest class icl within the reference region in the baseline case (baseline activity per forest class) ............................................................................................................. 168 Table 18. Annual areas deforested per forest class icl within the project area in the baseline case (baseline activity per forest class) ............................................................................................................. 169 Table 19. Annual areas deforested per forest class icl within the leakage belt area in the baseline case (baseline activity per forest class) ............................................................................................................. 170 Table 20. Baseline activity data for LU/LC change categories (ct) in reference region. ........................... 173 Table 21. Baseline activity data for LU/LC change categories (ct) in project area. .................................. 175 Table 22. Baseline activity data for LU/LC change categories (ct) in leakage belt. .................................. 177 Table 23. Ex post activity data for LU/LC change categories (ct) in project area. .................................... 179 Table 24. Ex post estimated net carbon stock change in the project area under the project scenario. .. 181 Table 25. Ex post activity data for LU/LC change categories (ct) in leakage belt.. ................................... 187 Table 26. Baseline activity data for LU/LC change categories (ct) in leakage belt ................................... 188 Table 27. Ex post estimated total leakage. ............................................................................................... 190 Table 28. Total ex –post estimated emissions reductions. ....................................................................... 191 Table 29.VCUs; Total ex-post estimated emissions reductions, net of the allocation to the buffer pool. .................................................................................................................................................................. 191 Table 30. Resource Protection and Governance monitoring records. ..................................................... 193 Table 31. Sustainable enterprises monitoring records. ............................................................................ 195 Table 32. Community empowerment and inclusiveness monitoring records. ......................................... 197 Table 33. Education monitoring records. .................................................................................................. 201 Table 34. Improved access to resources monitoring records. .................................................................. 203 Table 35. Resource protection and governance monitoring records. ...................................................... 208 Table 36. Community empowerment and inclusiveness monitoring records. ......................................... 209 Table 37. Education monitoring records. .................................................................................................. 211 Table 38. Improved access to resources monitoring records. .................................................................. 212
MONITORING & IMPLEMENTATION REPORT VCS Version 3.6, CCB Standards Second Edition
v3.0 8
Figures
Figure 1. Soils in the grouped project area ................................................................................................. 13 Figure 2. Topography of the Grouped Project Area.................................................................................... 15 Figure 3. Precipitation in the Grouped Project Area. ................................................................................. 16 Figure 4. Temperature in the Grouped Project Area. ................................................................................. 17 Figure 5. Grouped Project Area. ................................................................................................................. 23 Figure 6. Project Area map. ........................................................................................................................ 24 Figure 7.Reference region forested area (ha) over time in baseline scenario. .......................................... 49 Figure 8: Map of the Core Zone (Zonas Nucleos) .............................................................................. 52 Figure 9. FUNDAECO’s organizational structure. ........................................................................................ 62 Figure 10. Map of the Leakage Area Limits and the baseline forest map. ............................................... 184 Figure 11. Map of the Leakage Area, consisting of only the forest areas within the Leakage Area Limits above......................................................................................................................................................... 185 Figure 12. Comparison of baseline and project scenario deforestation (hectares/year) over the first monitoring period. .................................................................................................................................... 205 Figure 13. Comparison of baseline and project scenario deforestation (hectares) over the first monitoring period. .................................................................................................................................... 205

MONITORING & IMPLEMENTATION REPORT VCS Version 3.6, CCB Standards Second Edition
v3.0 9
Acronyms
Acronym Definition
AFOLU Agriculture, Forestry and Other Land Use
ACF Althelia Climate Fund
AGEXPORT Asociación de Exportadores de Guatemala
AME Asociación Movimiento por la Equidad
ASOREMA Association of Nongovernmental Organizations Linked to Natural Resources and the Environment
AUDD Avoided Unplanned Deforestation and Degradation
CODEDE Consejo Departamental de Desarrollo
CONAP Consejo Nacional de Áreas Protegidas
COPREDEH The Local Representative of the Presidential Commission on Human Rights
CTA Technical Administrative Council
DIPRONA Nature Protection Department of the National Police
FONTIERRAS Guatemalan Land Fund
FOA Forest Owners Assembly
IGSS Instituto Guatemalteco de Seguridad Social
INAB Instituto Nacional de Bosques
INGUAT Instituto Guatemalteco de Turismo
INTECAP Instituto Tecnologico de Capacitacion
IUCN International Union for Conservation of Nature
MARN Ministerio de Ambiente y Recursos Naturales
MICAI Mesa de diálogo Interinstitucional de Coordinación Agraria de Izabal
MSPAS Ministerio de Salud Pública y Asistencia Social
OSAR Observatorio de Salud Sexual y Reproductiva
PINFOR National Forestry Institute and the Program for Forestry Incentives
PINPEP Law for Forestry Incentives for Possessors of Small Extensions of Land for Forestry or Agroforestry Use
PNDRI National Policy for Integral Rural Development
PROBOSQUE Draft of the Law for Promoting the Establishment, Recovery, Restoration, Management, Production, and Protection of Forests in Guatemala
PRONACOM Programa Nacional de Competitividad
QAQC Quality Assurance and Quality Control
REDD+ Reducing Emissions from Deforestation and Forest Degradation plus foster conservation, sustainable management of forests and enhancement of forest carbon stocks
RPP Readiness Preparation Proposal
SEGEPLAN Secretaría de Planificación y Programación de la Presidencia
SIGAP The National Commission for Protected Areas and the Guatemalan System for Protected Areas
SLF Sustainable Livelihoods Framework
SOP Standard Operating Procedure
TOC Theory of Change
UNFCCC United Nations Framework Convention on Climate Change
USAID United States Agency for International Development

MONITORING & IMPLEMENTATION REPORT VCS Version 3.6, CCB Standards Second Edition
v3.0 10
1 GENERAL
1.1 Summary Description of the Project (G1)
This project is an Agriculture, Forestry and Other Land Use (AFOLU) project under the Reducing
Emissions from Deforestation and Degradation (REDD) project category. Specifically, the project is of the
“Avoided Unplanned Deforestation & Degradation” (AUDD) project category.
The project is estimated to generate approximately 23,055,591 VCUs over 30 years. The project area is
located in Department of Izabal in the Caribbean coast region of Guatemala in the Sarstun-Motagua
reference region proposed by the national level REDD+ program. Belonging to the biologically diverse
Mesoamerican Biological Corridor, forests in the project area are important nationally and internationally
for the ecosystem services they provide. The project area forests, however, have experienced a
continued reduction in biomass due largely to small-scale farmers and medium to large scale cattle
ranchers that have sought to expand their activities or have been displaced from agro-industrial
expansion. These forests have also historically been an important source of income for local families, who
periodically harvest small amounts of timber when the economic needs arise.
In 2013 Guatemala passed the Framework for the Regulation of the Reduction of Vulnerability, the
Mandatory Adaptation to the effects of Climate Change and the Mitigation of the effects of Greenhouse
Gases (Decree 07-2013) which gave landowners the rights to emission reductions generated in either
voluntary or compliance markets. This law allowed the REDD+ Project for Caribbean Guatemala to
pursue a Grouped Project design where the project proponent, FUNDAECO, could represent small
landowners and manage the development of a REDD+ project on their behalf through legal contracts that
transfer Rights of Use to FUNDAECO.
The expansion of industrial agriculture and migration of subsistence farmers and cattle ranchers into
protected areas is a historical trend observed in the project zone. Consequently, forests and land within
protected areas are an important source of income within the project zone and is the major focus of the
REDD+ project. The project aims to alleviate these pressures on the forests through the support of
governance capacity (including individual property titling, land-use planning and conservation zone
demarcation), the generation of alternative economic activities and income sources, and through capacity
building in administration and management. These project activities, beyond protecting local forests and
biodiversity, contribute to social and economic development in one of the poorest areas of Guatemala.
The effectiveness of these activities is partially dependent on their long-term economic success and wide-
spread adoption.
Since the project’s inception, local communities have been actively participating in the project’s
formulation and implementation. The early involvement of participating communities has created
awareness among community members and readiness for project implementation.
1.1.1 Project Objectives
FUNDAECO seeks to address the issue of deforestation in Guatemala on a local level. This
initiative will have positive climate, community and biodiversity impacts in the project zone.
The project reduces CO2 emissions by preventing deforestation caused by the conversion of forests into
cropland. The project prevents deforestation by addressing the drivers of deforestation in the project area
MONITORING & IMPLEMENTATION REPORT VCS Version 3.6, CCB Standards Second Edition
v3.0 11
through effective law enforcement, land-use planning, education, economic opportunities, and sustainable
agroforestry initiatives. FUNDAECO created the following climate, community, and biodiversity objectives
through an analysis of the drivers of deforestation in the project area, the focal issues identified in
consultation with communities and the participatory rural appraisal, and threats to biodiversity in the
project zone. To achieve these objectives, the project proponent designed an array of project activities
that fall under five program areas: resource protection and governance, sustainable enterprise,
community empowerment & inclusiveness, education, and improved access to resources.
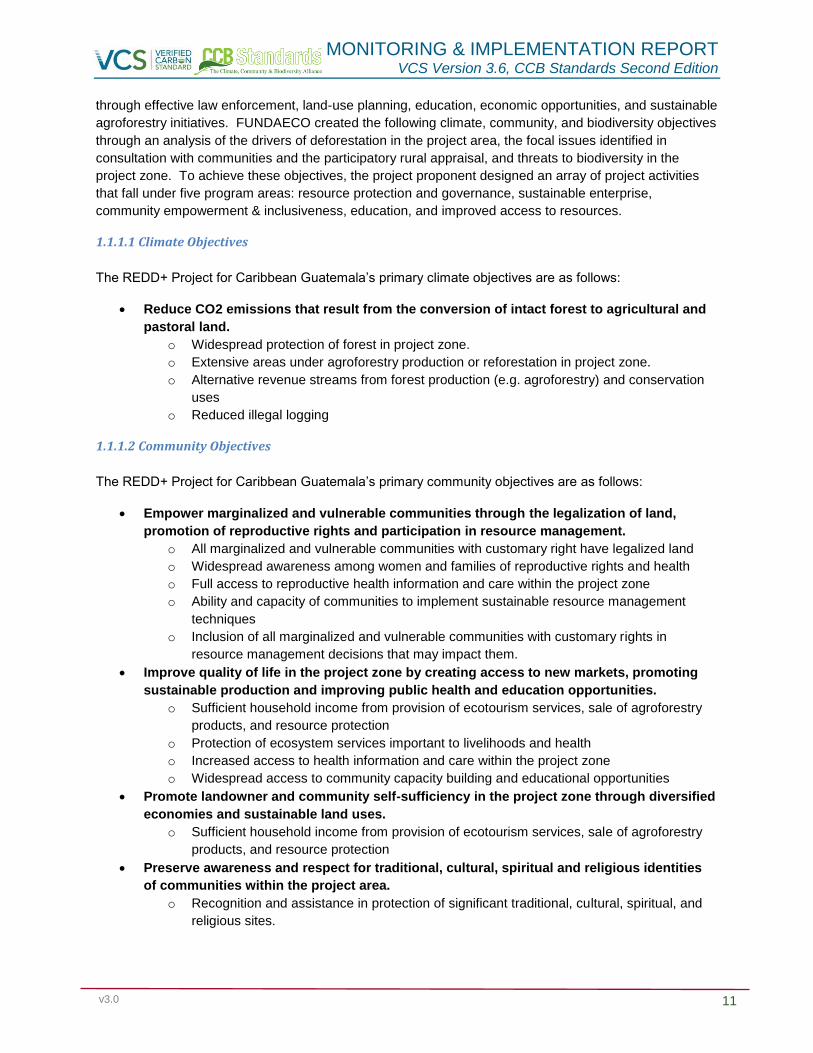
1.1.1.1 Climate Objectives
The REDD+ Project for Caribbean Guatemala’s primary climate objectives are as follows:
Reduce CO2 emissions that result from the conversion of intact forest to agricultural and
pastoral land.
o Widespread protection of forest in project zone.
o Extensive areas under agroforestry production or reforestation in project zone.
o Alternative revenue streams from forest production (e.g. agroforestry) and conservation
uses
o Reduced illegal logging
1.1.1.2 Community Objectives
The REDD+ Project for Caribbean Guatemala’s primary community objectives are as follows:
Empower marginalized and vulnerable communities through the legalization of land,
promotion of reproductive rights and participation in resource management.
o All marginalized and vulnerable communities with customary right have legalized land
o Widespread awareness among women and families of reproductive rights and health
o Full access to reproductive health information and care within the project zone
o Ability and capacity of communities to implement sustainable resource management
techniques
o Inclusion of all marginalized and vulnerable communities with customary rights in
resource management decisions that may impact them.
Improve quality of life in the project zone by creating access to new markets, promoting
sustainable production and improving public health and education opportunities.
o Sufficient household income from provision of ecotourism services, sale of agroforestry
products, and resource protection
o Protection of ecosystem services important to livelihoods and health
o Increased access to health information and care within the project zone
o Widespread access to community capacity building and educational opportunities
Promote landowner and community self-sufficiency in the project zone through diversified
economies and sustainable land uses.
o Sufficient household income from provision of ecotourism services, sale of agroforestry
products, and resource protection
Preserve awareness and respect for traditional, cultural, spiritual and religious identities
of communities within the project area.
o Recognition and assistance in protection of significant traditional, cultural, spiritual, and
religious sites.
MONITORING & IMPLEMENTATION REPORT VCS Version 3.6, CCB Standards Second Edition
v3.0 12
o Resource management with consideration of traditional, cultural, spiritual, and religious
rights
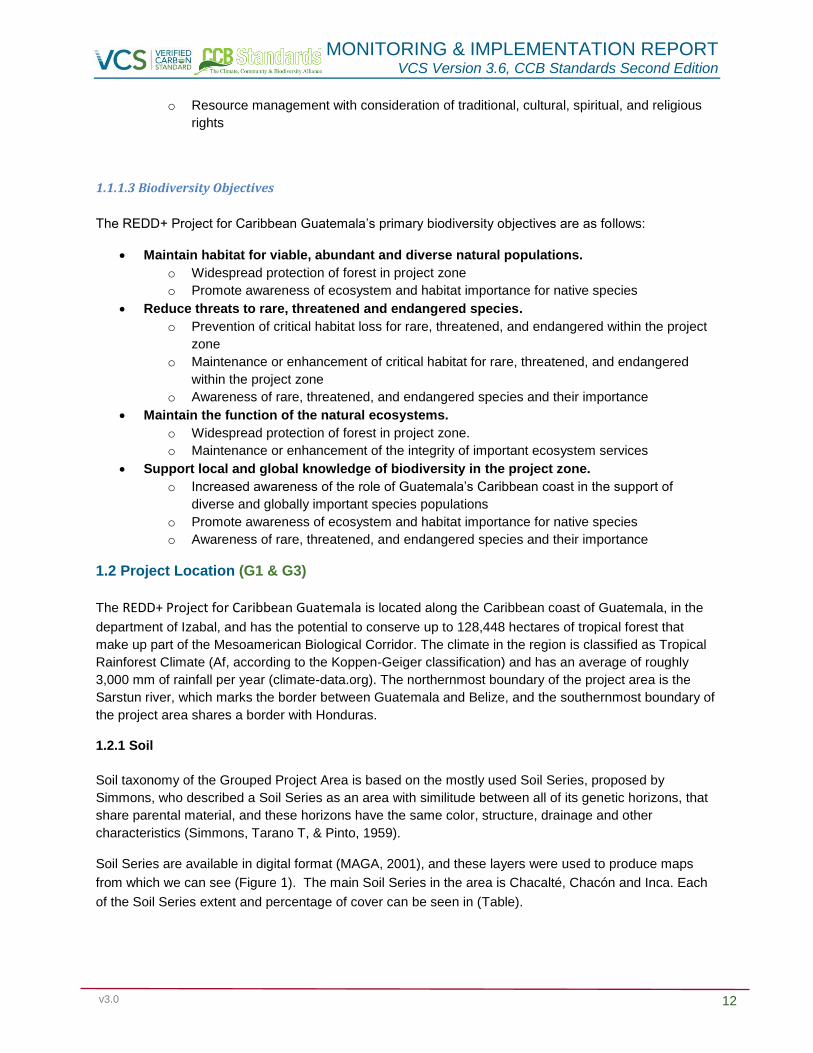
1.1.1.3 Biodiversity Objectives
The REDD+ Project for Caribbean Guatemala’s primary biodiversity objectives are as follows:
Maintain habitat for viable, abundant and diverse natural populations.
o Widespread protection of forest in project zone
o Promote awareness of ecosystem and habitat importance for native species
Reduce threats to rare, threatened and endangered species.
o Prevention of critical habitat loss for rare, threatened, and endangered within the project
zone
o Maintenance or enhancement of critical habitat for rare, threatened, and endangered
within the project zone
o Awareness of rare, threatened, and endangered species and their importance
Maintain the function of the natural ecosystems.
o Widespread protection of forest in project zone.
o Maintenance or enhancement of the integrity of important ecosystem services
Support local and global knowledge of biodiversity in the project zone.
o Increased awareness of the role of Guatemala’s Caribbean coast in the support of
diverse and globally important species populations
o Promote awareness of ecosystem and habitat importance for native species
o Awareness of rare, threatened, and endangered species and their importance
1.2 Project Location (G1 & G3)
The REDD+ Project for Caribbean Guatemala is located along the Caribbean coast of Guatemala, in the
department of Izabal, and has the potential to conserve up to 128,448 hectares of tropical forest that
make up part of the Mesoamerican Biological Corridor. The climate in the region is classified as Tropical
Rainforest Climate (Af, according to the Koppen-Geiger classification) and has an average of roughly
3,000 mm of rainfall per year (climate-data.org). The northernmost boundary of the project area is the
Sarstun river, which marks the border between Guatemala and Belize, and the southernmost boundary of
the project area shares a border with Honduras.
1.2.1 Soil
Soil taxonomy of the Grouped Project Area is based on the mostly used Soil Series, proposed by
Simmons, who described a Soil Series as an area with similitude between all of its genetic horizons, that
share parental material, and these horizons have the same color, structure, drainage and other
characteristics (Simmons, Tarano T, & Pinto, 1959).
Soil Series are available in digital format (MAGA, 2001), and these layers were used to produce maps
from which we can see (Figure 1). The main Soil Series in the area is Chacalté, Chacón and Inca. Each
of the Soil Series extent and percentage of cover can be seen in (Table).

MONITORING & IMPLEMENTATION REPORT VCS Version 3.6, CCB Standards Second Edition
v3.0 13
Figure 1. Soils in the Grouped Project Area.
Simmons Soil Series Hectares %
Water bodies 69.41 0.02
Chacalté 149,645.06 37.09
Chacón 45,855.87 11.37
Champona 21,357.30 5.29
Gacho 36,975.40 9.16
Guapaca 16,389.95 4.06
Guapinol 14,139.10 3.50
Inca 55,756.20 13.82
Manabique 21,189.30 5.25
Quiriguá 3,967.36 0.98
Sarstún 1,599.19 0.40

MONITORING & IMPLEMENTATION REPORT VCS Version 3.6, CCB Standards Second Edition
v3.0 14
Sebach 18,209.70 4.51
Suelos Aluviales 7,606.99 1.89
Tamahú 10,697.80 2.65
Total 403,458.63 100.00
Table 1. Extent of each soil cover in hectares and its percentages
The most commonly found Soil Series is Chacalté at 37% or 150 thousand hectares. Chacalte soils can
be originated from limestone, and may present a karstic relief. Its drainage is good, and its texture is
mostly clay, with average depth of 50 cm. This series is found mostly in areas above 500 meters over sea
level, and it covers most of Cerro San Gil, the higher parts of Cerro Sarstún, and North of Sierra Santa
Cruz.
The next predominant series is Inca at 13.82% of the Surface of interest which is equivalent to 56
thousand hectares. The main origin of these soils is the sediments of the Motagua River. Thus, these are
poorly drained soils, consistent mostly of very fine clays, and very deep, they can go in average to 75cm.
These soils are found mostly along the Motagua Valley.
And third is the Chacón series, with 11.37% cover or 46 thousand hectares. These are soils whose
origins are marine materials, with good drainage, median texture and very deep rounding 100 cm in
depth. They are found in low areas, mostly along the shores of Lake Izabal and the Santo Tomás Bay.
1.2.2 Geology
The Guatemalan Caribbean is not as mountainous as the Highlands found west of Guatemala, but it is
nevertheless a place with a more pronounced relief than the pacific coast. Izabal is mostly composed of
areas at lower levels than 100 meters above sea level, but these plains are interrupted by the peaks of
several Hills and Ranges.
In figure 2 , the topography of the area can be seen, where Cerro San Gil can reach up to 1200 meters
above sea level in some parts, followed by Sierra Caral which stands in some parts above 1000 meters.
Sierra Santa Cruz, is a range that averages 600 meters, going up to 900 at its highest, while the Cerro
Sarstún is the lowest of the protected areas, where the most prominent place, is 500 meters.

MONITORING & IMPLEMENTATION REPORT VCS Version 3.6, CCB Standards Second Edition
v3.0 15
Figure 2. Topography of the Grouped Project Area.
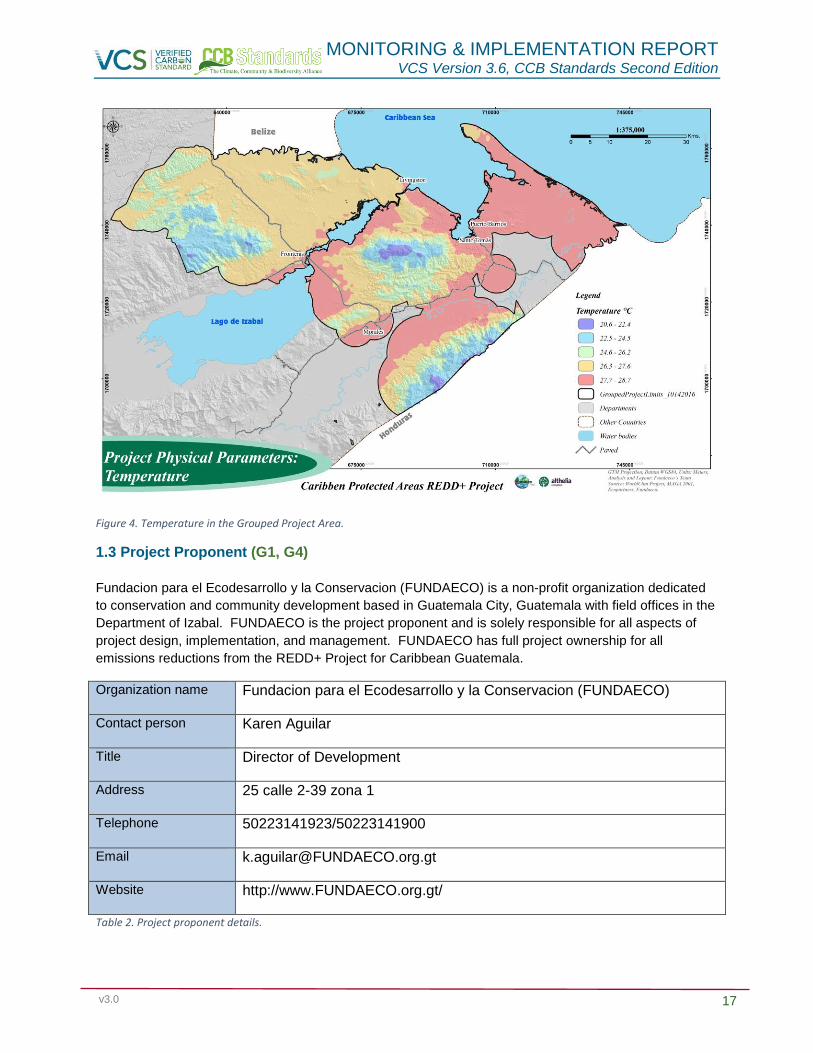
1.2.3 Climate
Precipitation and temperature maps of the area were produced using information from the Very High
Resolution Interpolated Climate Surface for Global Land Areas or WorldClim Project (Hijmans, Cameron,
Parra, Jones, & Jarvis, 2005), which is global data but has been very useful in many national projects
since it incorporates weather stations from continuant countries and thus represents weather in political
borders in a more accurate way. Figures 3 and 4 below show precipitation and temperature.
This is a very rainy area, where precipitation starts at 2,000 millimeters of rain, near the Motagua Valley,
and rises to the north, where it can reach more than 5,000 mm all along the Santo Tomás Bay.
There is a 10°C range of temperature, from the lowest areas where a yearly average temp is 29°C down
to 20°C at the higher points such as the Cerro San Gil peak.

MONITORING & IMPLEMENTATION REPORT VCS Version 3.6, CCB Standards Second Edition
v3.0 16
Figure 3. Precipitation in the Grouped Project Area.
MONITORING & IMPLEMENTATION REPORT VCS Version 3.6, CCB Standards Second Edition
v3.0 17
Figure 4. Temperature in the Grouped Project Area.
1.3 Project Proponent (G1, G4)
Fundacion para el Ecodesarrollo y la Conservacion (FUNDAECO) is a non-profit organization dedicated
to conservation and community development based in Guatemala City, Guatemala with field offices in the
Department of Izabal. FUNDAECO is the project proponent and is solely responsible for all aspects of
project design, implementation, and management. FUNDAECO has full project ownership for all
emissions reductions from the REDD+ Project for Caribbean Guatemala.
Organization name Fundacion para el Ecodesarrollo y la Conservacion (FUNDAECO)
Contact person Karen Aguilar
Title Director of Development
Address 25 calle 2-39 zona 1
Telephone 50223141923/50223141900
Email [email protected]
Website http://www.FUNDAECO.org.gt/
Table 2. Project proponent details.

MONITORING & IMPLEMENTATION REPORT VCS Version 3.6, CCB Standards Second Edition
v3.0 18
1.4 Other Entities Involved in the Project (G4)
Table 3 presents the main organizations and individuals currently providing services for the development
of the REDD+ Project for Caribbean Guatemala.
Company Brief Description of Roles Key Contact
ecoPartners Assistance in project design, PDD drafting, carbon
accounting, spatial modelling – based in Berkeley,
California, USA.
Kyle Holland
Universidad del Valle de
Guatemala (UVG) Centro de
Estudios Ambientales y de
Biodiversidad (CEAB)
Establishment of LULC maps over the historical
reference period, development of species specific
allometric equations, and measurement of carbon
stocks.
Edwin Josué
Castellanos
López
Althelia Ecosphere Funding of project implementation and co-
management of credit sales.
Adam Gibbon
Table 3. Other entities involved in the project.
Ecological Carbon Offset Partners, LLC (ecoPartners) is a consulting firm based out of Berkeley,
California, USA. As a leader of carbon-financed conservation, ecoPartners works with project developers,
forest owners and verification bodies to build successful carbon offset projects. They are experts in the
technical aspects of project design, planning and development including biometrics, accounting
methodologies and remote sensing. ecoPartners has extensive experience validating and verifying
projects under the California Air Resources Board (ARB), Climate Action Reserve (CAR) Standard,
Verified Carbon Standard (VCS), and Climate Community & Biodiversity (CCB) Standard. For the REDD+
Project for Caribbean Guatemala, ecoPartners has provided technical consulting services to FUNDAECO
on project design, documentation, carbon accounting, validation, and remote sensing, as well as in
drafting this Project Description.
Contact: Kyle Holland, Managing Director, Member Address: 2930 Shattuck Ave, Suite 305, Berkeley, CA, 94795, USA Telephone: +1 415-634-4650 Email: [email protected] Website: www.epcarbon.com
Universidad del Valle de Guatemala (UVG) Centro de Estudios Ambientales y de Biodiversidad
(CEAB) aims to find solutions to environmental problems in Guatemala with a comprehensive and
interdisciplinary approach. UVG CEAB has been contracted with to develop the baseline for the Sarstun-
Motagua reference region as part of the national REDD+ program under development in Guatemala.
Under this capacity UVG CEAB has held workshops in the Sarstun-Motagua region to understand agents
and drivers of deforestation, has developed land-use/land-cover maps for the region, and will eventually
implement baseline estimates for this region. A number of technical materials for the REDD+ Project for
Caribbean Guatemala have aligned with the national REDD+ program and Sarstun-Motagua region. As a
result, many of the technical materials created by UVG CEAB have been used in the development of this
project.

MONITORING & IMPLEMENTATION REPORT VCS Version 3.6, CCB Standards Second Edition
v3.0 19
Contact: Edwin Josué Castellanos López, Director del Centro de Estudios Ambientales. Address: Ecosphere Capital Partners LLP (advisors), 7 Chalcot Road, Primrose Hill, London NW1 8LH Telephone: 2364-0336 al 40 ext 596 Email: [email protected] Website: http://www.uvg.edu.gt/investigacion/ceab/index.html
Althelia Ecosphere is a fund dedicated to funding innovative models that lead to long term transitions to
sustainable landuse and mitigate greenhouse gas emissions whilst providing sustainable
livelihoods. Their model aims to address the drivers of deforestation and unsustainable land-use and
release additional value from standing forests from payments for environmental services. Through a focus
on blended value investments that deliver the highest calibre social, environmental and economic
performance, they aim to demonstrate that financial performance can be fully aligned with sound
environmental stewardship and social development. In the context of the REDD+ Project for Caribbean
Guatemala, Althelia has provided financing for project development costs.
Contact: Adam Gibbon, Chief Technical Officer Address: Ecosphere Capital Partners LLP (advisors), 7 Chalcot Road, Primrose Hill, London NW1 8LH Email: [email protected] Website:www.althelia.com
1.4.1 Technical Skills and Capacity
The FUNDAECO leadership team has extensive experience in community engagement, biodiversity
assessment, and forest measurement in Guatemala. The organizational structure for the REDD+ Project
for Caribbean Guatemala as well as the team’s experience is detailed in the Implementation Plan (Plan
de Implementación REDD V6 eP edits.docx).
1.4.2 Regulators
The Ministry of the Environment and Natural Resources (MARN) is the primary regulator of forest lands in
the Guatemala. Compliance with VCS and CCB standards is regulated by a third party verification body.
AENOR is an accredited verification body for VCS and CCB and serves as the initial validator and verifier
for the project.
1.4.3 GHG Program Administrators
The VCS Association (VCSA) and the Climate, Community and Biodiversity Alliance (CCBA) are
responsible for administering their respective programs. These responsibilities include maintaining
documents relevant to project design, implementation, and monitoring. CCBA posts a version of this
document for public comment during validation as well as the Monitoring and Implementation Report
when the project seeks verification. VCSA maintains a registry of projects including descriptions,
monitoring results, and emissions reductions issued.
MONITORING & IMPLEMENTATION REPORT VCS Version 3.6, CCB Standards Second Edition
v3.0 20
1.5 Project Start Date
1.5.1 Program Start Date
The project start date is April 1, 2012. This is the date of the first Project Activity Instance (PAI) that
occurred after additionality was established using expected carbon revenues (see Section 1.6.2) and
funding strategies by FUNDAECO were based on debt-finance with anticipation of REDD+ carbon credit
payments. FUNDAECO began a transition from grant and philanthropic funding to results based
payments mechanisms found in REDD+ as early as 2010. The start of this transition was marked by a
Memorandum of Understanding (MOU) signed in August 2010 between BNP Paribas/ Althelia Ecosphere
and FUNDAECO to reduce emissions through a REDD+ project (see MOU BNP
PARIBAS_Complete.pdf). In addition to increasing the focus on a finance strategy based on REDD+ the
funding from grant and philanthropic sources was ramped down as early as 2011. In 2011 the contract
between FUNDAECO and the Jade Project, supported by the Netherlands, the supported conservation
activities in the network of protected area in Izabal was terminated with the last disbursement schedule in
April 2011 (see Finalizacion CONTRATO JADE 2010-2011.pdf). This last payment covered operational
costs for the remainder of the 2011 annum and FUNDAECO thereafter sough debt-financing to support a
REDD+ project starting in 2012.
FUNDAECO demonstrated its intent to develop a REDD+ program in the Izabal region by following the
five phases set out within the scope of the MOU including Project Identification, Commercial Structuring,
Development, Implementation, and Monetization. Important milestones within the MOU were achieved
including completion of a feasibility study September 14th, 2012, commercial structuring of a REDD+
program with Althelia with a contract reach in early 2015, and the contracting of ecoPartners in early 2015
to assist with the development and implantation implementation of REDD+ project activities.
This timeline demonstrates FUNDAECO’s intentional transition between conservation finance strategies
that, in terms of financial cash-flows, transitioned at the start of 2012. The project start date is reflected
as the first PAI that resulted in emission reductions as a result of project activities funded through
FUNDAECO’s new financial strategy based on REDD+. The first PAI occurred on April 1, 2012 and
created emission reductions from the project activities. See the Fundaeco VM0015 Accounting Model
v1.46.xlsm for a list of all PAI start dates on April 1, 2012 and the activities that correspond to those
dates.
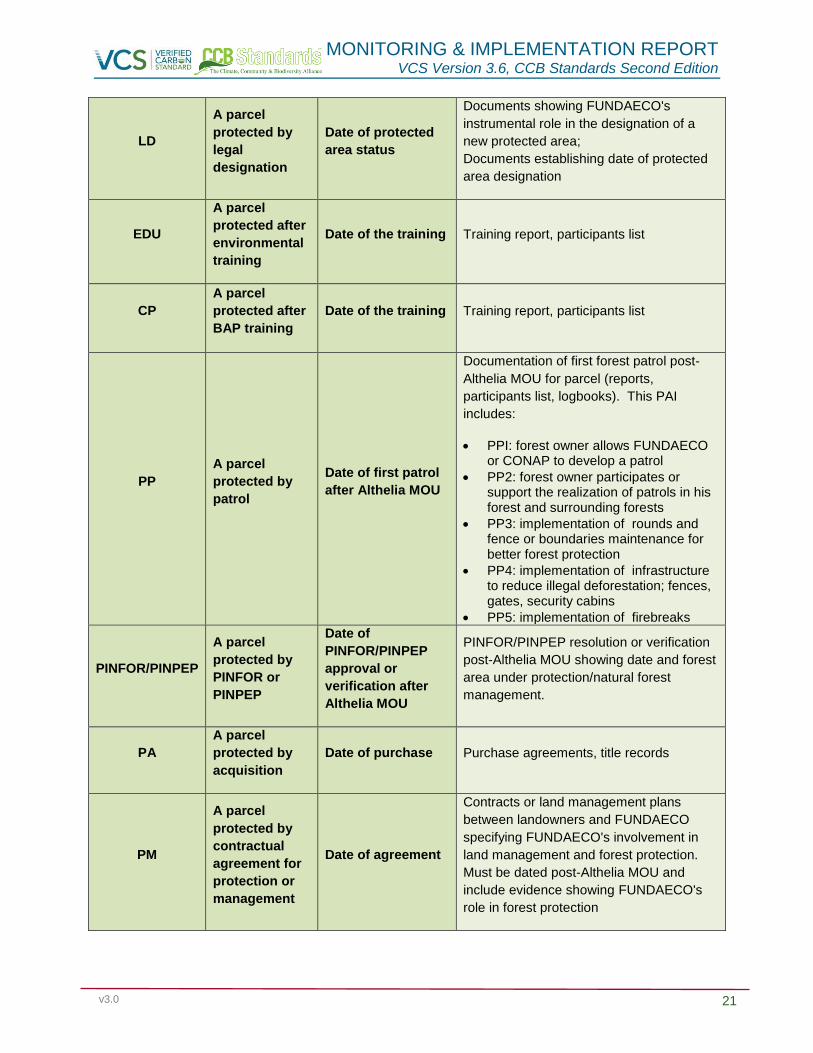
1.5.2 Project Activity Instance Start Dates
In addition to the Project Start Date for the REDD+ Project for Caribbean Guatemala start dates were
collected for each Project Activity Instance (PAI). These start dates were based on a number of potential
project activities implemented by FUNDAECO that lead to emission reductions (see Section 2.2).
Examples of the types of project activities are summarized below in Table 4 along with the type of
documentation provided to demonstrate each PAI start date. For a full list of PAI types and start dates,
see the FUNDAECO REDD+ Database in the Fundaeco VM0015 Accounting Model v1.46.xlsm.
PAI Code Project Activity
Instance PAI Start Date Evidence Establishing PAI Start Date
MONITORING & IMPLEMENTATION REPORT VCS Version 3.6, CCB Standards Second Edition
v3.0 21
LD
A parcel
protected by
legal
designation
Date of protected
area status
Documents showing FUNDAECO's
instrumental role in the designation of a
new protected area;
Documents establishing date of protected
area designation
EDU
A parcel
protected after
environmental
training
Date of the training Training report, participants list
CP
A parcel
protected after
BAP training
Date of the training Training report, participants list
PP
A parcel
protected by
patrol
Date of first patrol
after Althelia MOU
Documentation of first forest patrol post-
Althelia MOU for parcel (reports,
participants list, logbooks). This PAI
includes:
PPI: forest owner allows FUNDAECO or CONAP to develop a patrol
PP2: forest owner participates or support the realization of patrols in his forest and surrounding forests
PP3: implementation of rounds and fence or boundaries maintenance for better forest protection
PP4: implementation of infrastructure to reduce illegal deforestation; fences, gates, security cabins
PP5: implementation of firebreaks
PINFOR/PINPEP
A parcel
protected by
PINFOR or
PINPEP
Date of
PINFOR/PINPEP
approval or
verification after
Althelia MOU
PINFOR/PINPEP resolution or verification
post-Althelia MOU showing date and forest
area under protection/natural forest
management.
PA
A parcel
protected by
acquisition
Date of purchase Purchase agreements, title records
PM
A parcel
protected by
contractual
agreement for
protection or
management
Date of agreement
Contracts or land management plans
between landowners and FUNDAECO
specifying FUNDAECO's involvement in
land management and forest protection.
Must be dated post-Althelia MOU and
include evidence showing FUNDAECO's
role in forest protection

MONITORING & IMPLEMENTATION REPORT VCS Version 3.6, CCB Standards Second Edition
v3.0 22
PD
Parcel
protected after
alternative
productive
activities to
reduce
pressure over
the forest
Date of
implementation Logbook
ECO
Parcel
protected after
ecotourism
project to
reduce
pressure over
the forest
Date of
implementation Logbook
LL Land
Legalization Date of legalization FUNDAECO's role in legalization
Table 4. Examples of project activity instances for the establishment of project start dates for each parcel.
1.6 Project Crediting Period
The project crediting period is 30-years starting on April 1, 2012 and ending on March 31st,
2042. The results presented below occurred during the first monitoring and implementation
period spanning from 2012 to 2014.
2 IMPLEMENTATION OF DESIGN
2.1 Sectoral Scope and Project Type
This project is an Agriculture, Forestry and Other Land Use (AFOLU) project under the Reducing
Emissions from Deforestation and Degradation (REDD) project category, sectoral scope 14. Specifically,
the project is of the “Avoided Unplanned Deforestation & Degradation” (AUDD) project category. The
project will not pursue IFM nor ANR activities in any of the project areas. Some of the project activities do
occur on wetlands; however the specific carbon pools and GHG sources have not been accounted for as
their exclusion leads to conservative estimates of the total GHG emission reductions.
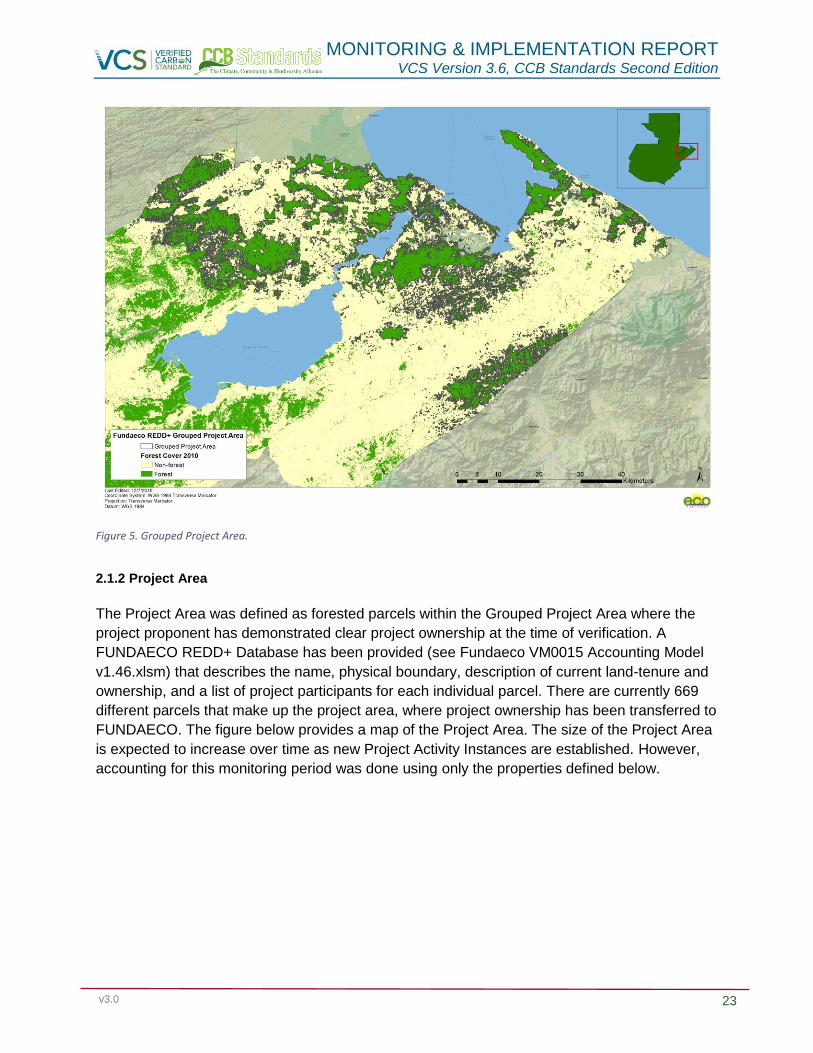
2.1.1 Grouped Project
This project is a grouped project and also uses the programmatic approach. The Grouped Project Area is
shown in the figure below (see GroupedProjectArea_11032016.shp in the provided annexes). The
grouped project area has been designed to display a single baseline scenario and demonstration of
additionality. The Grouped Project Area shows forested areas that meet the eligibility criteria described in
the PD.
MONITORING & IMPLEMENTATION REPORT VCS Version 3.6, CCB Standards Second Edition
v3.0 23
Figure 5. Grouped Project Area.
2.1.2 Project Area
The Project Area was defined as forested parcels within the Grouped Project Area where the
project proponent has demonstrated clear project ownership at the time of verification. A
FUNDAECO REDD+ Database has been provided (see Fundaeco VM0015 Accounting Model
v1.46.xlsm) that describes the name, physical boundary, description of current land-tenure and
ownership, and a list of project participants for each individual parcel. There are currently 669
different parcels that make up the project area, where project ownership has been transferred to
FUNDAECO. The figure below provides a map of the Project Area. The size of the Project Area
is expected to increase over time as new Project Activity Instances are established. However,
accounting for this monitoring period was done using only the properties defined below.

MONITORING & IMPLEMENTATION REPORT VCS Version 3.6, CCB Standards Second Edition
v3.0 24
Figure 6. Project Area map.
2.2 Description of the Project Activity (G2)
2.2.1 Activities Leading to Net GHG Emissions Reductions
FUNDAECO’s climate objective is to reduce CO2 emissions that result from conversion of intact forest to
agricultural land. The REDD+ Project for Caribbean Guatemala’s primary activities to achieve net GHG
emissions reductions are to protect existing forested areas and to provide alternative sustainable
livelihoods for deforestation and forest degradation agents. Without effective legal enforcement and
protection of forested areas as well as a shift in community reliance on the forest as a source of income,
the project area would have seen higher rates of deforestation in the time since the project’s initiation.
In this monitoring period, FUNDAECO has maintained agreements with landowners throughout the
project area to prevent the conversion of forest into agricultural land and grazing area, has provided
protected area properties with consistent forest patrols, and has implemented agroforestry and livelihoods
initiatives aimed at helping families to find stable sources of income that aren’t derived from any
deforestation activities. FUNDAECO has also implemented several other project activities aimed at
curbing deforestation throughout the project area, which are detailed in the theory of change matrix (see
TOC Activity Matrix v1.14.xlsm). Documentation of FUNDAECO’s agreements with landowners within the
project area is confidential, but will be provided to auditors (see Contrato VCUs entre FUNDAECO-
PROPIETARIO 10915.doc). Additionally, records of forest patrol activities in addition to agroforestry and
sustainable economic activities can be found in Monitoring Indicator and Results Matrix v1.5.xlsx.
FUNDAECO has monitored the forest in this period using LANDSAT imagery of the project area for any

MONITORING & IMPLEMENTATION REPORT VCS Version 3.6, CCB Standards Second Edition
v3.0 25
deforestation event in the project area. Approximately 1,250 hectares were deforested within the project
area during this monitoring and implementation period.
2.2.2 Activities Leading to Community and Biodiversity Benefits
FUNDAECO’s community objectives are to:
Empower marginalized and vulnerable communities through the legalization of land, promotion of
reproductive rights and participation in resource management.
Improve quality of life in the project zone by creating access to new markets, promoting
sustainable production and improving public health and education opportunities.
Promote landowner and community self-sufficiency in the project zone through diversified
economies and sustainable land uses.
Preserve awareness and respect for traditional, cultural, spiritual and religious identities of
communities within the project area.
These objectives were obtained through community consultation and the identification of five focal issues
affecting the communities in the project zone:
1. Lack of Economic and Employment Opportunities 2. Lack of Laws, Enforcement and Capacity 3. Land Tenure 4. Necessity 5. Shared Futures
Community benefits are derived from numerous project activities detailed in the Theory of Change Matrix (see TOC Activity Matrix v1.14.xlsm), and fall into the following program areas:
1. Resource Protection 2. Sustainable Enterprise 3. Empowerment and Inclusiveness 4. Education 5. Access to Resources
FUNDAECO’s biodiversity objectives are to:
Maintain habitat for viable, abundant, and diverse natural populations.
Reduce threats to rare, threatened, and endangered species.
Maintain the function of the natural ecosystem.
Increase local and global understanding of biodiversity in Guatemala’s Caribbean Coast.
Activities to achieve these objectives are numerous, and are grouped into four major program areas:
1) Resource Protection and Governance 2) Empowerment and Inclusiveness 3) Education 4) Access to Resources
The implementation plan for the phased project activities is provided as an annex to the Project
Description (see Plan de Implementación REDD V6.docx). The budget and implementation schedule are
also provided as annexes (see BP_budget_and_cashflow_20160630_Final_30_años_(ingresos solo
FUNDAECO).xlsx). In this monitoring period, FUNDAECO has achieved its objectives by implementing
project activities in every program area.
MONITORING & IMPLEMENTATION REPORT VCS Version 3.6, CCB Standards Second Edition
v3.0 26
2.2.2.1 Community-Oriented Project Activities
The community oriented project activities implemented during the past monitoring period with the greatest
impact on the quality of life for people within the project zone were those tied to generating alternative
and sustainable sources of income, expanding health and reproductive care throughout the project zone,
and improving the resource and land management capacity of communities. Together, these project
activities have worked to address focal issues raised by communities throughout the project zone. See
Section 7 for the community monitoring results and demonstration of net positive community impacts for
this monitoring period.
2.2.2.2 Biodiversity-Oriented Project Activities
Project activities that are designed to bring about benefits to biodiversity also tend to overlap quite
frequently with climate and community objectives as well. As such, many activities implemented by
FUNDAECO serve to address multiple objectives across all CCB categories. The primary activities that
FUNDAECO has implemented to target the biodiversity objectives of the project consist of measures
targeted at reducing deforestation, including the enforcement of protected area laws, improved land use
management, and improving economic opportunities. FUNDAECO has also taken measures to directly
protect populations of vulnerable species through the establishment of fish restoration zones and
amphibian protection protocols. In addition, FUNDAECO has worked to educate the public on the
importance of biological diversity and environmental sustainability. FUNDAECO is also currently working
to monitor and catalog bird species within the project zone in order to improve both the project’s and the
scientific community’s understanding of species diversity within the region. See Section 8 for biodiversity
monitoring results and an assessment of net positive biodiversity impacts for this monitoring period.
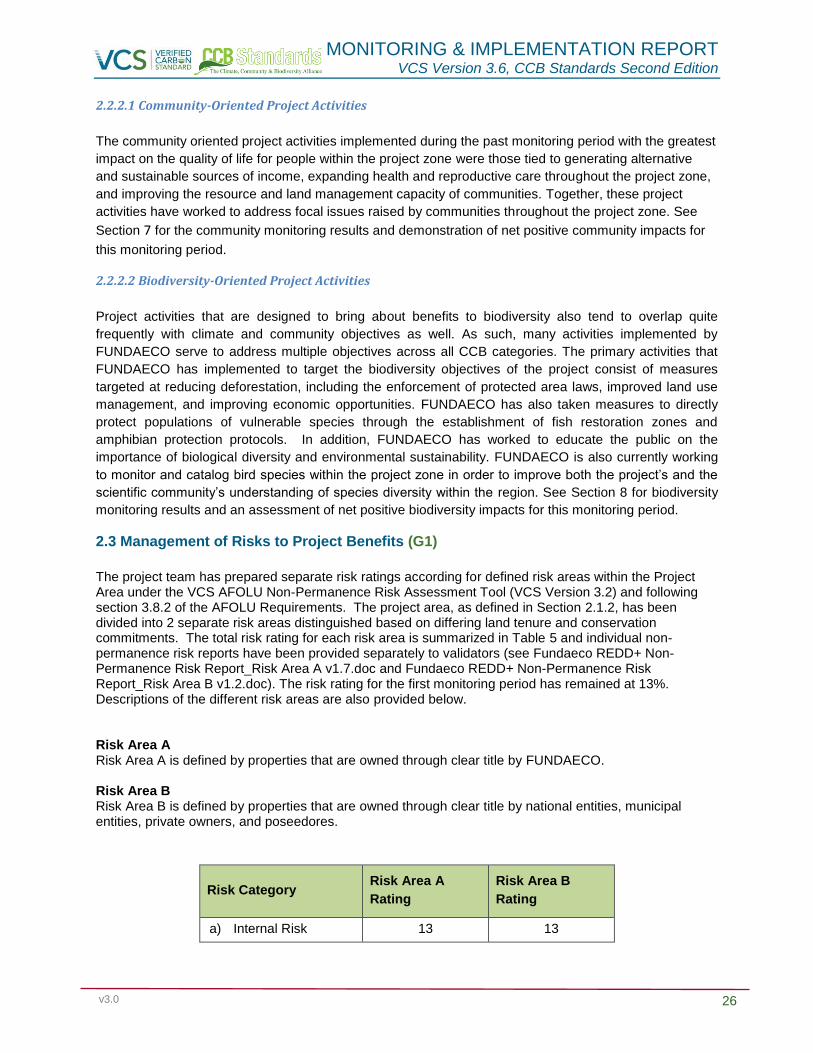
2.3 Management of Risks to Project Benefits (G1)
The project team has prepared separate risk ratings according for defined risk areas within the Project Area under the VCS AFOLU Non-Permanence Risk Assessment Tool (VCS Version 3.2) and following section 3.8.2 of the AFOLU Requirements. The project area, as defined in Section 2.1.2, has been divided into 2 separate risk areas distinguished based on differing land tenure and conservation commitments. The total risk rating for each risk area is summarized in Table 5 and individual non-permanence risk reports have been provided separately to validators (see Fundaeco REDD+ Non-Permanence Risk Report_Risk Area A v1.7.doc and Fundaeco REDD+ Non-Permanence Risk Report_Risk Area B v1.2.doc). The risk rating for the first monitoring period has remained at 13%. Descriptions of the different risk areas are also provided below. Risk Area A Risk Area A is defined by properties that are owned through clear title by FUNDAECO. Risk Area B Risk Area B is defined by properties that are owned through clear title by national entities, municipal entities, private owners, and poseedores.
Risk Category Risk Area A
Rating
Risk Area B
Rating
a) Internal Risk 13 13

MONITORING & IMPLEMENTATION REPORT VCS Version 3.6, CCB Standards Second Edition
v3.0 27
b) External Risk 0 0
c) Natural Risk 0 0
Overall Risk Rating (a
+ b + c) 13* 13*
Table 5. Non-Permanence risk rating for each defined risk area within the Grouped Project Area. *Overall risk rating cannot be below 10.
2.3.1 Climate Risks
Institutional weakness is one the risks that can affect both climate and biodiversity benefits, especially due to lack of resources and lack of continuity of public servants, which results in a slow and interrupted implementation of public policies and strategies. This can affect the project coordination with authorities in charge of law enforcement. To manage these risks FUNDAECO has included in the project an Environmental Litigation, Lobbying and Advocacy Program. At the National level, FUNDAECO is also part of ASOREMA. ASOREMA is the national association for environmental NGOs that holds a chair at INAB Board of Directors, CONAP Council, and the Climate Change Council. At the local level (Izabal Department) FUNDAECO is part of the CODEDE, the MICAI, and Izabal Competitiveness Work Group. From these mechanisms, FUNDAECO is constantly guaranteeing coordination and support to project strategies and activities. The project was presented and obtained endorsement form PRONACOM, Izabal Government, MARN and SEGEPLAN (see .
Lack of governance in areas surrounding project zone can indirectly affect the project. To reduce this risks the project team is integrated by local technicians and community promotors that keep a constant and close communication with communities and landowners to understand their situation and demands. FUNDAECO participates actively in the MICAI to identify and avoid potential conflicts.
The potential lack of carbon market to cover opportunity costs is also a risk that can affect benefits to climate, communities and biodiversity benefits. To manage this risk FUNDAECO has obtained the initial support of Althelia Climate Fund as carbon investors, ACF and FUNDAECO are creating a joint carbon marketing unit, and initial VCUs buyers’ portfolio is prepared.
2.3.2 Community Risks
Lack of access to markets is a risk for agroforestry, artisans, ecotourism and VCUs beneficiaries.
FUNDAECO is closely working with AGEXPORT in order to increase market opportunities for vendors
and producers supported by the project. AGEXPORT has been assessing FUNDAECO in market
identification and contacts, value chains, and commercial image. FUNDAECO has registered the
“Conservation Coast” as the trademark that will support project products image and marketing; based on
a value differentiation.
FUNDAECO is also training local producers and vendors to implement BPAs, improve productivity and in
the case of artisans to improve and update handicrafts designs.
The lack of carbon markets to cover opportunity costs is also a notable a risk. FUNDAECO is managing
these risks in the carbon market unit, but also supporting communities and individual landowners to
diversify their household economy, through supporting; resources for alternative economic activities,
access to markets, and technical support to forest incentives such as PROBOSQIES, PINPEP and
PINFOR.

MONITORING & IMPLEMENTATION REPORT VCS Version 3.6, CCB Standards Second Edition
v3.0 28
Backing commitments under REDD+ project is a challenge since expectations may change over the
years. FUNDAECO anticipated this challenge through a broad consultation process including the
discussion of the carbon contract with each beneficiary. The project team is integrated by local
technicians that are committed to sustainable development and nature conservation in the project zone,
and that have a close communication with communities and individual landowners. The grievance and
redress mechanism, and the adoption of an adaptive management approach will timely implement
solutions. An annual social survey is carried on to know about beneficiaries’ satisfaction level with
FUNDAECO work.
2.3.3 Biodiversity Risks
The Project has used the theory of change to determine the most effective methods for bringing about
benefits to biodiversity. However, there are still several natural and human induced risks to biodiversity
benefits that underlie assumptions in the theory of change model. Some of these threats may be outside
of the project’s control, but others may have concrete mitigation measures that can be implemented by
the project.
Specific risks to biodiversity that may be out of the project’s control include the risk of continued habitat
degradation outside of the project area, as well as the socio-political stability of Guatemala, which could
impact economic drivers of deforestation as well as FUNDAECO’s influence over the project area. There
is also the risk that income generated from agroforestry systems and ecosystem services payments may
not be enough to compete with income derived from activities such as the clearing of forest for agriculture
or cattle grazing, resulting in less reductions in deforestation than anticipated. Additional human-induced
risks include changes in local economic conditions, the lack of capacity and governance in local
communities, the potential use of environmentally harmful practices as part of project activities, and the
lack of a functional land tenure system. Natural risks to the project have been evaluated using the Non-
Permanence Risk Tool (see Fundaeco REDD+ Non-Permanence Risk Report_Risk Area A v1.7.doc and
Fundaeco REDD+ Non-Permanence Risk Report_Risk Area B v1.2.doc), and have been found to pose
insignificant threats to the project area, and consequently pose little threat to the project’s biodiversity
benefits.
FUNDAECO has implemented several strategies for mitigating many of these risks to the project’s
biodiversity benefits. Targeted project activities as well as organization policy both will serve to strengthen
biodiversity benefits and reduce any potential risks (see Section 8 for more details on project activities
tied to biodiversity benefits). Although several risks are outside of the project’s control, including local
governance, changes in local economies, and land tenure systems, FUNDAECO is working to minimize
these through project activities geared at empowering communities and providing land tenure access to
vulnerable populations. Any biodiversity threats caused by the degradation or fragmentation of forest
outside of the current project area also have the potential to be minimized through educational initiatives
and the incorporation of these properties into the project area over time.
FUNDAECO’s policy documents also outline the measures that the organization will take to ensure that
project activities do not cause environmental harm. For example, in the FUNDAECO Policy documents
(see Plan General de BPA 2016.docx), the use of GMOs and invasive species are prohibited, and
environmentally friendly waste management measures are to be implemented as part of any project
activity. All agroforestry and sustainable agricultural programs through FUNDAECO also abide by USAID
guidelines for safe pesticide use (EG-PERSUAP-Final_Oct2012.docx), and an internal best agricultural
practices policy that outlines and justifies safe and appropriate pesticide and fertilizer use (Plan General
de BPA 2016.docx). FUNDAECO agroforestry programs do use non-native and non-invasive species
such as rubber in small-scale plantations within a larger mixed-use sustainable agriculture system. By
MONITORING & IMPLEMENTATION REPORT VCS Version 3.6, CCB Standards Second Edition
v3.0 29
using naturalized non-native and non-invasive species in sustainable and mixed-use agroforestry
systems, FUNDAECO can enable farmers to access markets that provide them with better economic
opportunities, thus preventing them from further clearing forest. For a detailed justification for the use of
non-native species in small-scale agroforestry plantations see Consultoria Selvin Perez doc Final
10062014.docx. Overall with a combination of targeted project activities and organization policies,
FUNDAECO is continuously taking steps to identify and mitigate threats to biodiversity within the project
area and project zone.
2.4 Measures to Maintain High Conservation Values (B1, B2, CM1, CM2)
2.4.1 Community High Conservation Values (CM1, CM2)
According to Richards and Panfil, Social or Community HCVs are those that provide critical ecosystem
services or are of cultural importance. In the project region both of them are founded.
A network of sacred sites where Queqchi and Garifuna communities practice religious rituals have been
identified; each site is composed by several points, specially caves or small mountains called “cerros”:
Tameja River and caves
Rio Quehueche River and Caves
Cerro Sarstun and Sartun River
Rio Cocoli
Siete altares
Caves and cerros at the north of Sierra Santa cruz (Rubel Ho, Rubel Cacao, Sesaquipec and Sesaquisuib)
Ten watersheds were identified as HCVs that provide critical ecosystem services; Las Escobas, Tamejá,
San Marcos, Juan Vicente, Sumaché, Cienega, Chahal, Bobos, Negro and Chiquito.
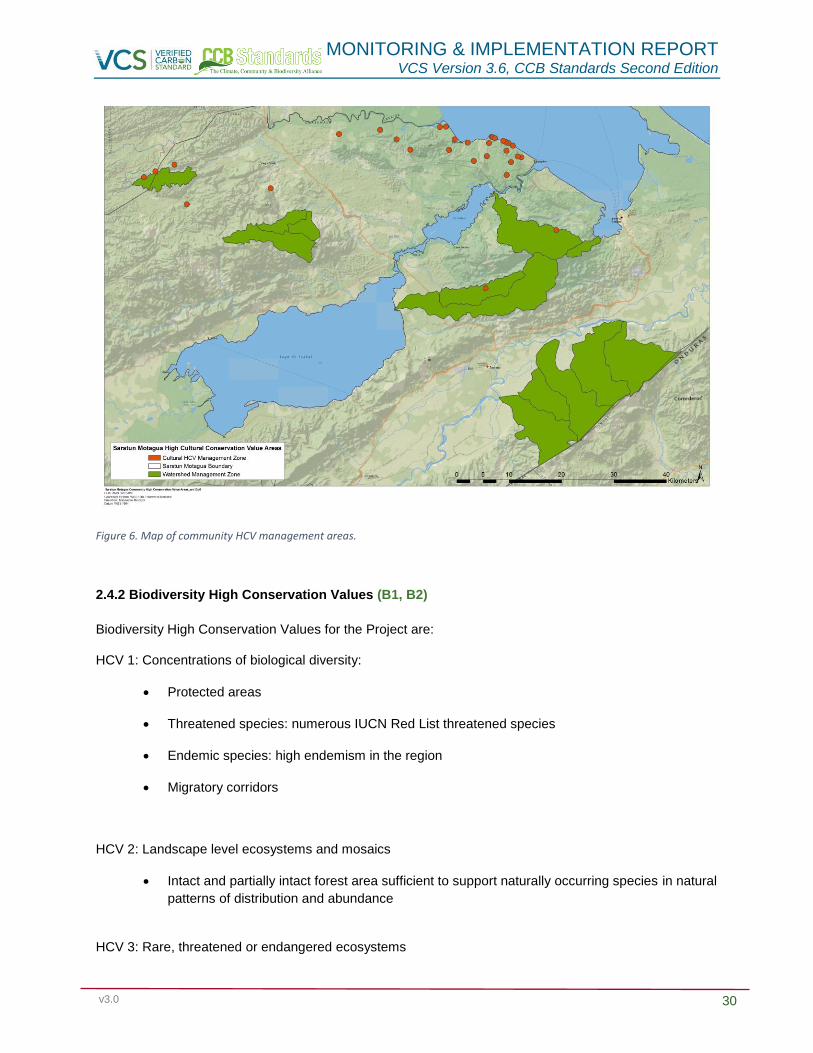
The project is dedicated to maintaining these community HCVs through several targeted project activities.
HCV management areas have been identified (see Figure 6) in order to focus HCV conservation efforts
within the project area. The primary measure taken to maintain HCVs is the reduction of deforestation
within the sites identified as HCVs, through the voluntary integration of some of these forests to the
project area and the implementation of protection activities. By reducing deforestation and degradation,
the project has avoided threats within these areas, and their environmental services and cultural uses can
be guarantee.
FUNDAECO has implemented forest protection measures through the deployment of forest patrols, the
enrollment of landowners along watersheds in PROBOSQUE and PINPEP programs, conservation
education initiatives, and support to preserve awareness and respect for traditional, cultural, spiritual and
religious identities of communities within the project area.
MONITORING & IMPLEMENTATION REPORT VCS Version 3.6, CCB Standards Second Edition
v3.0 30
Figure 6. Map of community HCV management areas.
2.4.2 Biodiversity High Conservation Values (B1, B2)
Biodiversity High Conservation Values for the Project are:
HCV 1: Concentrations of biological diversity:
Protected areas
Threatened species: numerous IUCN Red List threatened species
Endemic species: high endemism in the region
Migratory corridors
HCV 2: Landscape level ecosystems and mosaics
Intact and partially intact forest area sufficient to support naturally occurring species in natural
patterns of distribution and abundance
HCV 3: Rare, threatened or endangered ecosystems
MONITORING & IMPLEMENTATION REPORT VCS Version 3.6, CCB Standards Second Edition
v3.0 31
Lowland forests
Mangroves
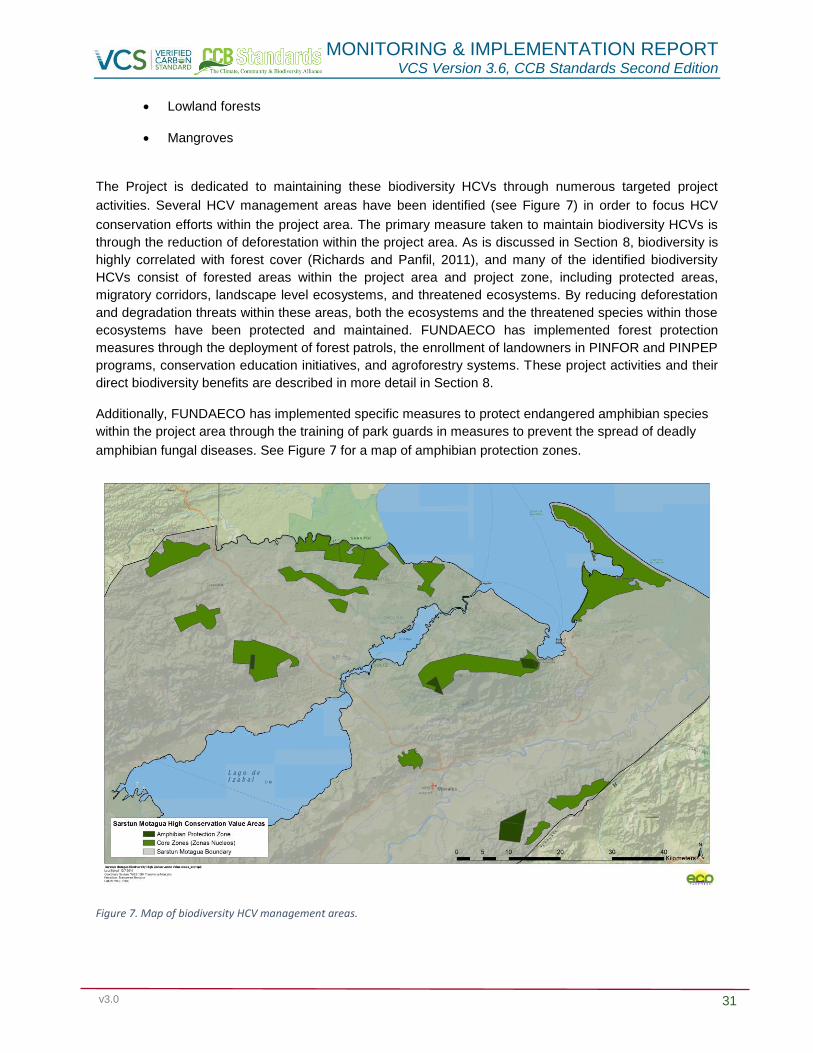
The Project is dedicated to maintaining these biodiversity HCVs through numerous targeted project
activities. Several HCV management areas have been identified (see Figure 7) in order to focus HCV
conservation efforts within the project area. The primary measure taken to maintain biodiversity HCVs is
through the reduction of deforestation within the project area. As is discussed in Section 8, biodiversity is
highly correlated with forest cover (Richards and Panfil, 2011), and many of the identified biodiversity
HCVs consist of forested areas within the project area and project zone, including protected areas,
migratory corridors, landscape level ecosystems, and threatened ecosystems. By reducing deforestation
and degradation threats within these areas, both the ecosystems and the threatened species within those
ecosystems have been protected and maintained. FUNDAECO has implemented forest protection
measures through the deployment of forest patrols, the enrollment of landowners in PINFOR and PINPEP
programs, conservation education initiatives, and agroforestry systems. These project activities and their
direct biodiversity benefits are described in more detail in Section 8.
Additionally, FUNDAECO has implemented specific measures to protect endangered amphibian species
within the project area through the training of park guards in measures to prevent the spread of deadly
amphibian fungal diseases. See Figure 7 for a map of amphibian protection zones.
Figure 7. Map of biodiversity HCV management areas.
MONITORING & IMPLEMENTATION REPORT VCS Version 3.6, CCB Standards Second Edition
v3.0 32
2.5 Project Financing (G3 & G4)
FUNDAECO is committed to covering project operation costs, initially through an investment from Althelia
Climate Fund that covers development expenses. During the rest of the project lifetime FUNDAECO is
committed to sell carbon credits with the support from ACF. Also, a VCU marketing unit will be
established in Guatemala to reach local companies. However, when considering the carbon market
uncertainty, and to guarantee project cash flow FUNDAECO will continue to seek funds from international
cooperation. FUNDAECO will work with recognized sustainable development and conservation funds and
agencies to cover costs from the different project components.
2.6 Employment Opportunities and Worker Safety (G4)
Since its foundation in 1990, FUNDAECO has complied with legal and administrative provisions on labor
and social security and work rights; this practice is implemented throughout all of FUNDAECO Programs
and Projects.
The rights and obligations of workers are contained in the Labor Code (Decree 1441 of the Guatemalan
Congress). The state agency that enforces workers’ rights respect is the Ministerio de Trabajo y Previsión
Social, and the social security is in charge of the Instituto Guatemalteco de Seguridad Social – IGSS -.
FUNDAECO is registered as an employer with both entities, and can receive evaluations as required by
the law. In addition to social security coverage, the institution establishes an aggregate insurance policy
with life insurance and medical expenses coverage.
FUNDAECO, in compliance with the content on civil, commercial and labor- enacts a Human Resources
Policy, as part of Manual for Policies, Rules and Procedures, including, among others items: types of
recruitment, recruitment processes, wages and salaries, interpersonal relations and performance
evaluations.
2.4.2 Employment Training
In order to build local useful skills and knowledges to increase success in the project implementation and
goals, a significant amount of training and capacity building its being implemented by FUNDAECO, and is
provided in different level to field technicians and community beneficiaries.
Through workshops, filed technicians, and project beneficiaries were trained to implement several types
of agro-ecological products (black pepper, cardamom, rambutan, forestry amount others) and
ecotourism in an environmentally low-impact manner during the previous reporting period. Through
these activities economic opportunities were improved in different areas. Please see the table below.
Training opportunities
SAF ECOTOURISM HANDCRAFTS
Plant Production Development of tourism product Quality and added value
Grafting Community Tourism Guides New designs

MONITORING & IMPLEMENTATION REPORT VCS Version 3.6, CCB Standards Second Edition
v3.0 33
Soil preparation and nutrition Provision of food services Material costing and small
business management
System establishment Management of groups and
tourism culture
Crop Management Provision of lodging services
Harvest
Post harvest
Processing
Packing
Biofertilizers
BPAs
Table 6. Community training opportunities.
Specific training for the project:
FUNDAECO trains all staff in the different aspects of the project components. For new employees,
training period (induction process) will be provided in a 4 week term, immediately after beginning
employment. The Induction process starts with identifying relevant topics to train the new employee. This
process included field visits looking to integrate the technician in ongoing efforts with project stakeholders
and communitarian leaders during the reporting period. Directors and Coordinators ensured that
additional training is provided to staff, where needed, with efforts from FUNDAECO or from external
support.
Communities: FUNDAECO implements capacity-building activities with communities all over Caribbean Guatemala.
When working with community members, the community itself will select the people participating in the
proposed activities.
FUNDAECO divides 3 different levels of development in staff training systems:
1st level: FUNDAECO technical staff receives training in productivity, organization and legal
subject; these technical teams are the ones that have the job to replicated -with knowledge
transfer and generation of capabilities- across project organizations (Producers
Organizations, Local Committees and COCODES)
2nd level: FUNDAECO technical staff, along with the accompanied of organizations leaders,
provides technical assistance to producers at an individual plot level.
3rd level: For the different products will feature and deliver technical manuals containing the
minimum "technology package" for the productive development of each of the production
initiatives; all contents and tools provide by the technology package and deliver for capacity
building activities, are designed to be culturally appropriate.

MONITORING & IMPLEMENTATION REPORT VCS Version 3.6, CCB Standards Second Edition
v3.0 34
Although FUNDAECO and its partners possessed specific skills to accomplish these levels of training
during the reporting period, additional specialized consultants might be retained in the future.
Efforts with external support:
Regarding agroforestry systems, specific training was provided by FUNDAECO to support project
productive activities including agroforestry systems and ecotourism. Other trainings conducted during the
reporting period included PINFOR, PINPEP, protected areas management, Law Enforcement, monitoring
and conflict resolution; the Geographic or thematic coordinator is responsible on detecting training need
and opportunities and the Regional Director for external support in this trainings.
Finally trainings on Human Rights, Sexual and Reproductive Health and Rights, and other issues
covering community rights and empowerment, were organized by the Social and Gender Director during
the reporting period. The project is constantly supporting midwives and health promotors and volunteers
in related trainings.
The next table shows partner institutions and organizations that are previously identified to support the
implementation of the training programs; other institutions can be included along the project life:
External organizations supporting training programs
INTECAP “Instituto Tecnologico de Capacitacion” supports Agroforestry Systems and
Ecotourism
AGEXPORT “Asociación de Exportadores de Guatemala” supports Agroforestry Systems and
Ecotourism
AGREQUIMA Agrequima it’s an technical company that’s specializes in Best Practice
implementation
INAB "Instituto Nacional de Bosques”with support in agroforestry and forestry
INGUAT “Instituto Guatemalteco de Turismo” supports Ecotourism
MSPAS “Ministerio de Salud Pública y Asistencia Social” Health and Sexual and
Reproductive Health
OSAR “Observatorio de Salud Sexual y Reproductiva”Sexual and Reproductive Health
and Rights
AME Guatemala “Asociación Movimiento por la Equidad” Fundamental Human Rights, Sexual and
Reproductive Health and Rights, Gender
Table 7. External organizations supporting training programs.
2.5 Equal Opportunities for Employment (G4)
FUNDAECO requires specialist services in natural resources management, agriculture, forestry, social
work, laws and politics, communications, nurses, biology, accounting, administration and finance,
educators, rangers, farmers and field workers.
Maintenance of work stability:

MONITORING & IMPLEMENTATION REPORT VCS Version 3.6, CCB Standards Second Edition
v3.0 35
FUNDAECO maintains a low staff turnover rate; this policy values the interest towards nature and
communities, experience, and dedication of the staff. During the reporting period, FUNDAECO retained
existing staff in order to harness already acquired experience in: REDD + topic; the knowledge of the
project area, and its social and natural conditions and dynamics; and the contacts with local
communities and stakeholders. FUNDAECO also hired additional staff members with important
experience local experience to implement activities during the reporting period.
New hires and promotion:
FUNDAECO procedures are established in section one of the institutional Manual for Policies, Rules and
Procedures. According to this manual when a new position or task is required, first opportunity is given to
existing staff. During the reporting period, the Technical Administrative Council or CTA “Consejo Tecnico
Administrativo” report internally in the institution for new opportunities or vacancies by inner
communication channels. Employees submitted their aspirations to be reclassified or promoted, once the
profiles required have been published and their skills are commensurate with the position available.
Induction process:
All new and promoted employees, prior to assuming the fulfillment of their responsibilities, must receive
from the Administrative Director or administrative assistants an induction on institutional manuals,
FUNDAECO mission and vision, policies and other administrative documentation. Procedures aspects,
information on monthly salary, delivery of relevant documents and signing of pertinent documentation.
The reporting period, the immediate superior gave induction on the position tasks.
2.5.1 Worker’s Rights
The rights and obligations of workers were observed and enforced in accordance with Labor Code of
Guatemala. These provisions were developed in FUNDAECOs manual of Internal Working Regulation
and Procedure which was presented to the Ministry of Labor and Social Security for review and approval
by a representative of the employer and two representatives of the workers, having been approved by the
Ministry through the 179-2002 resolution, regulating the conditions of working hours, salary payments,
holidays, requests and claims, obligations of the employer and employees, safety and health.
In compliance with the established regulations, this manual was made available to workers at each office
in printed form and in digital form. Besides these regulations when hired, the employee receives the
institutional Code of Ethics and Values, which contained general and mission related values to be
observed by our staff. More recently FUNDAECO has developed it Policy on Gender, No Discrimination
and Violations against Fundamental Human Rights. All manual and regulations were implemented under
the concepts and criteria stated along this Policy.
On Non-Discrimination: Every employee has the right not to be discriminated directly or indirectly for employment, or once employed, for reasons of gender, marital status, age within the law limits, racial or ethnic origin, social status, religion or belief, political ideas, sexual orientation, membership or not to a labor union. Employment benefits to personal during the reporting period:
All employees were entitled to benefits prescribed by Guatemalans labor laws.
FUNDAECO recognized as institutional policy the payment of a universal indemnity after 4 years of working with the institution when the employee has accumulated a favorable record of conduct and performance; the termination is on friendly terms and under no circumstances for reasons of serious faults against the rules of the institution or the existing labor law in Guatemala. If any employee resigns before the four years, it will be the Technical Administrative Council (CTA), who will assess whether or not the universal compensation takes place.

MONITORING & IMPLEMENTATION REPORT VCS Version 3.6, CCB Standards Second Edition
v3.0 36
Health Suspension by the Guatemalan institute of Social Security: Any worker can be temporally suspended from his job duties because of illness or accident, remuneration shall be in accordance with the provisions of the organic law of IGSS. A copy of the suspension certificate is sent to the employee's personnel file and payroll manager.
Life and health insurance.
FUNDAECO recognized the concept of a "performance bonus", up to a maximum of 25% of the base salary. For the worker to enjoy this benefit, it must be stated in the employment contract.
Field expenses: allocation of funds will be made for personnel who need to travel outside their workplace as part of their job functions.
2.5.2 Worker Safety
FUNDAECO in fulfillment of Guatemalan law is registered with a patronal number and complied with the
established benefits covering registered employees with the following social security programs:
Common disease
Accidents
Maternity
Age Disability
In addition to the benefits of the Guatemalan Social Security Institute, FUNDAECO in a common
agreement with employees hirds a collective life and medical expenses insurance coverage prior to the
reporting period and maintained throughout the reporting period. During the reporting period, the medical
expense coverage was extended at the request of employees to their families.
Within the regulations of the Guatemalan Social Security Institute conducted in coordination with the
Ministry of Labor, FUNDAECO applied the following regulations during the reporting period:
The Regulation on Health and Safety at Work, contained in the Government Agreement
No. 229-2014 and its amendments contained in No.33-2016, which contains regulations
regarding work environment, vehicle driving, handling and operation of machinery,
infrastructure and facilities, hazardous substances, infectious diseases and first aid kits.
Regulation on Accident Protection, published by the Guatemalan Social Security Institute
board (Agreement no. 1002) that regulates issues relating to accident prevention and first
aid measures.
Specific procedures related to FUNDAECO field work were included in the institutional Policy and Plan for
Health and Safety. FUNDAECO has also adopted the Security and Risk Manual at the Herpetarium, from
the Guadalajara Zoo Herpetarium in order to manage its local Herpetarium at Cerro San Gil. This
herpetarium is registered at CONAP, and personnel have been trained by the Director of the National
History Museum Herpetarium.
The body responsible for ensuring compliance with all laws and regulations is the Technical
Administrative Council or CTA, and at the same time operates as the Health and Safety Committee
supplying security protocols and issued several tools for each employee, among some of this tools we
can mention the instructive for Safety on Emergency Situations, instructional use of water and land
vehicles; Chapter XIII of the Internal Work Regulations containing the Hygiene and Safety at Work
guidelines.

MONITORING & IMPLEMENTATION REPORT VCS Version 3.6, CCB Standards Second Edition
v3.0 37
2.6 Stakeholders (G3)
2.6.1 Stakeholder Engagement Structure
FUNDAECO has worked in the project region for over twenty years, and during this period, it has
designed, promoted and supported different mechanisms and structures that ensure the active
participation of all stakeholders – particularly communities- in consultation, decision making, and
implementation of field activities across the project region. These formal structures – established both
under the Development Councils Legislation and the Protected Areas Legislation- will ensure the active
engagement and participation of all stakeholders throughout the project implementation period.
Communities in particular, participated not only as Forest owners and Carbon right holders, but also as
members of protected area management bodies, as project beneficiaries and as direct participants in the
implementation of project activities.
From the local to the regional level, the following structures have been involved in project consultation
and planning prior to and during the reporting period, ensuring project implementation, follow-up and
oversight:
COCODEs (Comités Comunitarios de Desarrollo), or Community Development Councils, are the
basic unit for consultation, planning and implementation; The General Assembly of each COCODE –
in which all community members (both men and women) participate- elects a Board of Directors and
a President, who in turn represents his/her community in regional bodies.
Local Regional Indigenous and Community Associations and Protected Area Community
Assemblies (Asambleas o Consejos Intercomunitarios de Áreas Protegidas): Local
Associations representing a group of communities, usually associated with the management of land
and natural resources in a particular region or protected area, are also an important mechanism for
community stakeholders engagement. The Associations Aj Rihonel Re li Ch´och in Río Sarstún, Aj
Ilol Quiché in Chocón Nacional, San Antonio Aj Awinel in Jalauté, Asociación Cerro 1019 in Sierra
Santa Cruz, have been key partners in all FPIC processes, and will also participate in the protection
and community development activities throughout project implementation.
These Associations also represent the communities within a particular protected area, and are
consulted and engaged in all field activities and key management decisions, including the
consultation and implementation of the REDD+ project. These participatory bodies will be
strengthened in each protected area during project implementation.
Protected Area Executive Councils or Boards of Directors (“Consejos Ejecutivos Locales de
Áreas Protegidas”) will also be a key participatory body for the active engagement of all
stakeholders in project implementation. These Councils, which preside over the management of
specific protected area, integrate key stakeholders at the local level, including the National Council of
Protected Areas, Municipalities, Private Landowners and/or Private Sector representatives,
Governor, relevant government agencies, and Local Community Representatives.
COMUDEs (Comités Municipales de Desarrollo) or Municipal Development Councils, are
participatory bodies at the Municipal level; Presided by local Mayors, they also incorpórate private
landowners, community representatives, local representatives of Government Agencies, and NGOs.
The REDD+ Project has been extensively socialized with COMUDEs, as a key administrative body
that ensures wide engagement of all stakeholders in a particular Municipality.
Consejo Departamental de Desarrollo (CODEDE), the Development Council for the Department of
Izabal, presided by the local Governor, is the regional body that ensures the engagement of
stakeholders at the regional level. The REDD+ project has been submitted for its review during the
FPIC process, and the CODEDE will ensure regional level support to project implementation.

MONITORING & IMPLEMENTATION REPORT VCS Version 3.6, CCB Standards Second Edition
v3.0 38
Additionally, a wide array of local producer associations, women associations, and other local organized
groups were consulted during the FPIC process prior to and during the reporting period, and were
actively involved in project implementation (Please refer to Campaña Carbono 2015 992015.docx for a
full list of partner community associations).
These different participatory governance structures have been engaged during project preparation and
consultation, and have been actively engaged in project implementation by FUNDAECO´s local field
teams, deployed across the region in five field offices and three Field Stations. In each office, a
Technical Coordinator and a team of environmental educators, social workers, agronomists, naturalists,
and field workers have ensured a close, intensive and active engagement of communities, forest owners,
agroforestry producers, women and youth in the implementation of all project activities. All project
implementation activities have been closely coordinated in each level with the appropriate participatory
bodies, and a Regional Project Coordinator has ensured regional coordination with the Governor of
Izabal, and the Regional Coordinator of the National Council of Protected Areas. FUNDAECO, as project
proponent, has ensured administrative support, operational planning, oversight, coordination with all
relevant partners and stakeholders for project activities implementation, and Auditing and MRV
requirements for the project. For more details on stakeholder engagement, please see section 2.7 of the
PD.
2.6.2 Public Comment Period
This document was posted to the CCBA website along with the PD and held open for public comment.
The project proponent also posted a summary of this document in accordance with the Rules for the Use
of the CCB Standards (December, 2013). Summaries of the PD have been translated into Spanish, the
language most prevalently spoken in the project zone, and posted on the CCBA website. The project
Implementation Plan was also made publically available in Spanish. FUNDAECO has organized
socialization activities with associations and community groups, in order to ensure understanding and
obtain comments. FUNDAECO has also used other media to publicize the PD and Implementation Plan
and to gather comments, such as newspapers and social media. When needed, a Q’eqchi’ translator has
participated to guarantee comprehension of the PDD to Q’eqchi’ communities. All comments have been
centralized by FUNDAECO and will be presented to project validators.
2.6.3 Stakeholder Conflict and Grievances
Based on its past experience in the Project Region, FUNDAECO has strengthened and expanded its
existing procedures to ensure access to information, response to complaints and grievances, and conflict
prevention and resolution -from the community to the regional level. This work began prior to the first
reporting period and is on-going.
A system for the reception, registration, response, resolution and/or referral of grievances has been
implemented at different geographical and organizational levels, according to their gravity and urgency,
ranging from requests of access to information, operational and administrative complaints, grievances
and disputes over rights of access, collective conflicts, and potential violations of Legislation and
Fundamental Rights. Different and specific channels of communication and complaint have been used,
based on current practices, in order to ensure that all stakeholders, particularly vulnerable populations –
such as indigenous women- have rapid access to complaints and grievance redress.
In order to improve the Project´s performance as related to proper and effective response to complaints
and grievances, the following mechanisms have been implemented:
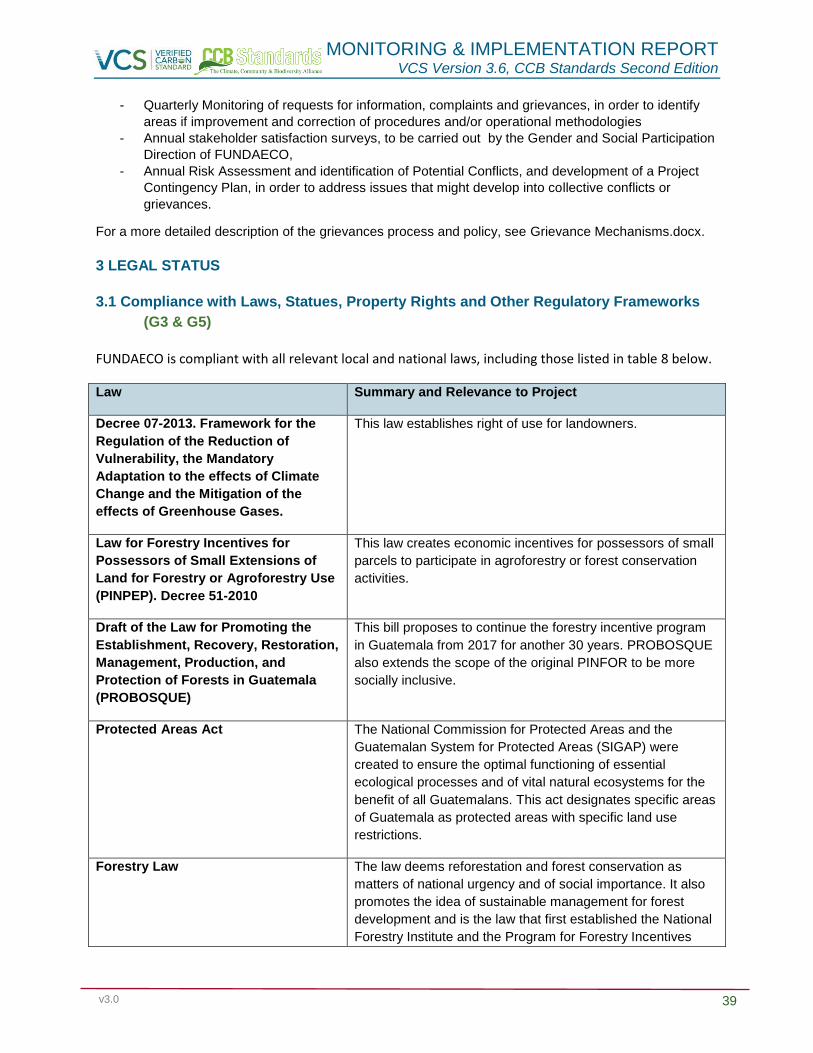
MONITORING & IMPLEMENTATION REPORT VCS Version 3.6, CCB Standards Second Edition
v3.0 39
- Quarterly Monitoring of requests for information, complaints and grievances, in order to identify
areas if improvement and correction of procedures and/or operational methodologies
- Annual stakeholder satisfaction surveys, to be carried out by the Gender and Social Participation
Direction of FUNDAECO,
- Annual Risk Assessment and identification of Potential Conflicts, and development of a Project
Contingency Plan, in order to address issues that might develop into collective conflicts or
grievances.
For a more detailed description of the grievances process and policy, see Grievance Mechanisms.docx.
3 LEGAL STATUS
3.1 Compliance with Laws, Statues, Property Rights and Other Regulatory Frameworks
(G3 & G5)
FUNDAECO is compliant with all relevant local and national laws, including those listed in table 8 below.
Law Summary and Relevance to Project
Decree 07-2013. Framework for the
Regulation of the Reduction of
Vulnerability, the Mandatory
Adaptation to the effects of Climate
Change and the Mitigation of the
effects of Greenhouse Gases.
This law establishes right of use for landowners.
Law for Forestry Incentives for
Possessors of Small Extensions of
Land for Forestry or Agroforestry Use
(PINPEP). Decree 51-2010
This law creates economic incentives for possessors of small
parcels to participate in agroforestry or forest conservation
activities.
Draft of the Law for Promoting the
Establishment, Recovery, Restoration,
Management, Production, and
Protection of Forests in Guatemala
(PROBOSQUE)
This bill proposes to continue the forestry incentive program
in Guatemala from 2017 for another 30 years. PROBOSQUE
also extends the scope of the original PINFOR to be more
socially inclusive.
Protected Areas Act The National Commission for Protected Areas and the
Guatemalan System for Protected Areas (SIGAP) were
created to ensure the optimal functioning of essential
ecological processes and of vital natural ecosystems for the
benefit of all Guatemalans. This act designates specific areas
of Guatemala as protected areas with specific land use
restrictions.
Forestry Law The law deems reforestation and forest conservation as
matters of national urgency and of social importance. It also
promotes the idea of sustainable management for forest
development and is the law that first established the National
Forestry Institute and the Program for Forestry Incentives

MONITORING & IMPLEMENTATION REPORT VCS Version 3.6, CCB Standards Second Edition
v3.0 40
(PINFOR).
Law on Land Registry Established the registry for cadastral data on the national
level. The law also defines different types of property and
land ownership such as community lands, and possessors.
Law for the Public Access to
Information
The objective of this law is to guarantee that all interested
parties, free from discrimination, have the right to request and
access public information in the possession of the central
authorities and local government. This is a key tool for the
dissemination process of both the project and the national ER
program.
Forestry Policy The objective of this policy is to increase the socioeconomic
benefits derived from the goods and services produced in
forest ecosystems and to contribute to land management in
rural areas through productive management and the
conservation of natural resources.
Agricultural Policy The agricultural policy aims to transform the agrarian situation
of Guatemala by promoting legal possession and land tenure,
as well as the resolution of land conflicts so that together with
the use of other productive assets, conditions are improved of
the population lives in rural areas and integrated rural
development is fostered, in a multicultural society
National Policy for Integral Rural
Development (PNDRI)
This policy’s objective is to achieve improvements in the
quality of life for people in rural areas through equitable
access and sustainable use of productive resources, means
of production, and natural and environmental goods and
services.
Policy for Biological Diversity It aims to promote effective management of biodiversity in
Guatemala by emphasizing conservation and sustainable
resource use as a crucial factor in sustainable development.
National Policy for Climate Change The Climate Change policy’s objective is to have Guatemala
adopt risk prevention measures on a national and municipal
level in order to reduce vulnerability and improve adaptation
to climate change. It also aims to reduce GHG emissions in
order to improve the quality of life of Guatemala’s citizens and
to strengthen Guatemala’s influence in international climate
change discussions.
National Strategy and Action Plan for
Biodiversity 2012-2022
This is a tool developed to implement the national Policy for
Biological Diversity and to complement article 64 of the
Constitution, which declares that conservation, protection and
improvement of the country’s natural resources are topics of
national concern.

MONITORING & IMPLEMENTATION REPORT VCS Version 3.6, CCB Standards Second Edition
v3.0 41
National Development Plan Katun
2032
A national development plan with goals for sustainable
development throughout Guatemala by 2023.
Plan of Action for the Prevention and
Reduction of Illegal Logging in
Guatemala
This plan aims to strengthen institutional actions to prevent
and reduce illegal logging, while fostering responsible
participation of related stakeholders to design and implement
a long term strategy
Forestry Concessions Established zones for forestry use and management for both
communities and industry. Management units are defined by
CONAP and are approved for a specific type of use or
management of the area’s natural resources, which can
involve sustainable management, protection, conservation,
and improvement. Concessions are granted for long periods
of time and require the development of management plans,
environmental impact assessments, and land use plans,
which are approved by CONAP to ensure compliance with
regulations. CONAP has granted a total of fourteen different
concessions, twelve of which are community-managed and
two of which are for industrial use.
National Strategy for the Sustainable
Production and Efficient Use of
Firewood
The strategy aims to develop tools and skills that
guarantee availability of fuel wood by sustainable
production, and adoption of efficient technologies.
Allowing the prevention of health problems related to
smoke and forest conservation.
Table 8. Laws, their relevance and project compliance.
3.2 Evidence of Project Ownership (G5)
Based on the VCS Standard Section 3.11.1, the project demonstrates that the proponents have project
ownership over the emission reductions under subsection 4:
“Project ownership arising by virtue of a statutory, property or contractual right in the land, vegetation or
conservational or management process that generates GHG emission reductions and/or removals (where
such right includes the right of use of such reductions or removals and the project proponent has not
been divested of such project ownership)”
As a grouped project the REDD+ Project for Caribbean Guatemala has a number of landholders with
different land tenure arrangements where project activities are implemented and emission reductions can
be claimed. Different tenure arrangements include private property, private property holders without
formal title termed possessors, community lands, State lands administered by CONAP, State lands given
in concession to communities and industries and other users. With the exception of possessors, all of the
tenure arrangements present in the grouped project area arise from either formal titles or formal
management agreements with the State. These formal agreements are catalogued by the Cadastral
Information Registry (RIC) following the Cadastral Information Registry Act of 2005 (Decree 41-2005).
MONITORING & IMPLEMENTATION REPORT VCS Version 3.6, CCB Standards Second Edition
v3.0 42
In the case of possessors, land titles are recognized by the State through municipal certificates. A
possessor is defined as a land holder who without being land owner exercises some or all of the usual
property rights over a piece of land (Article 23 of Decree 41-2005). PINPEP furthers the definition of a
possessor in the context of forests and delineates clear statutes of property rights and required
documentation. PINPEP rules hold that to be recognized as a land holder without title (i.e. possessor) a
certificate provided by the mayor of the relevant municipality is required declaring that the person
concerned is known as the local occupier of the land in a way that is peaceful, public, permanent and in
good faith and that no competing claim on the land is known.
With established rights to property Article 22 of the Framework for the Regulation of the Reduction of
Vulnerability, the Mandatory Adaptation to the effects of Climate Change and the Mitigation of the effects
of Greenhouse Gases (Decree 07-2013) further the Rights of Use of legal owners or possessors of lands
to emission reductions generated in either voluntary or compliance markets. For the REDD+ Project for
Caribbean Guatemala, all participating properties have transferred their emissions reductions Rights of
Use to FUNDAECO. Contracts with each land owner are confidential, but will be provided to auditors as
part of the Project Description annexes. Each contract transfers project ownership for a minimum of 20-
years and is renewable for an additional 10 years. Where project activities have been implemented since
the project start date carbon rights are transferred retroactively and land owners have declared to not
participate in any other emissions trading programs.
3.3 Emissions Trading Programs and Other Binding Limits (G5)
Guatemala submitted an Intended Nationally Determined Contribution (INDC) to the UN Framework
Convention on Climate Change’s (UNFCCC) Paris Agreement in 2015. The Paris Agreement will not
take effect until 2020 and as such no emissions trading programs currently exist within Guatemala.
Currently a national REDD+ program is under development but is not yet operational.
3.4 Participation under Other GHG Programs (G5)
The project has not been registered, nor is it seeking registration under any other GHG program.
3.5 Other Forms of Environmental Credit (G5)
Carbon credits are currently the only environmental credit being generated from this project. In addition,
the appropriate legal agreements are in place between project participants to ensure credits are not sold
more than once.
3.6 Projects Rejected by Other GHG Programs (G5)
The project has not been rejected by any other GHG program.
3.7 Respect for Rights and No Involuntary Relocation (G5)
The Free Prior and Informed Consent process was implemented by FUNDAECO with the identified
stakeholders mentioned in Section 2.6. The project team and field technicians developed more than a
100 meetings, workshops and assemblies to present the project to the communities and institutions
involved in the project, and to discuss their support or consent.

MONITORING & IMPLEMENTATION REPORT VCS Version 3.6, CCB Standards Second Edition
v3.0 43
The information presented and discussed during the FPIC process explained: the fundamental
knowledge about Climate Change and the environmental services of the forest; the deforestation rates of
the Caribbean Guatemala; the concepts and elements related to REDD+, and the objectives, strategies
and benefits of the REDD+ Project.
With the purpose of performing a FPIC process that meets the criteria of the international conventions,
the project was launched by the Department Governor, through a meeting request with the main
institutions and coordination groups, including interinstitutional coordination groups, development
Councils, and regional associations. The launching call and invited institutions and groups are presented
in the Informe de Proceso FPIC.
The strategy followed during the implementation of the FPIC process (detailed in document “Informe de
Proceso FPIC”) looked to cover all the coordination and organization levels within the project region
starting with: the Governor presentation; then meetings with governmental institutions, interinstitutional
coordination groups, and development Councils; meetings with key community groups and leaders and
finalized with workshops with private forest owners and other stakeholders.
More than 100 consultation and socialization events where held from during the reporting period
(meetings, workshops, assemblies, etc.) in which more than 2400 people participated (between
community groups, governmental institutions, community leaders, private stakeholders, women rights
groups, etc.).
The free and previous consultation process developed with the communities involved in the REDD+
project was made in order to obtain the community participation and validation of the proposed project, it
also helped –in an indirect way- to obtain the communities’ main concerns regarding the implementation
of the project and the activities that FUNDAECO should develop to support the REDD+ project (see
Informe de Proceso de Consulta Previa _ GPV4.docx).
The project does not require or involve the involuntary relocation of people or of activities important for
their livelihoods or culture. The project is designed respecting and supporting people rights, in this sense
the project includes land legalization actions that allow interested communities, with historical rights but
without land titles, to include their forest in the grouped project area.
3.8 Illegal Activities and Project Benefits (G5)
Illegal activities that have historically occurred within the project area include deforestation for land use
change purposes, and illegal logging. The project does not benefit from deforestation for subsistence
agriculture or cattle grazing purposes or the removal of timber through illegal logging. These activities
result in negative impacts to project benefits, and as a result the project has several ways of minimizing
illegal activities with in the area, as shown in table 9 below.
Illegal activity Action Benefit
Support to Guatemalan institutions in
charge of law enforcement, especially
CONAP, INAB and MP.
Support to communities or individual forest
owners in legal following in case of illegal

MONITORING & IMPLEMENTATION REPORT VCS Version 3.6, CCB Standards Second Edition
v3.0 44
Illegal logging
Support to law enforcement
activities committed by a third part.
Support in forest patrols especially to
communities or individual forest owners that
do not have the resources to deploy this
action.
Forestry plantations Access to resources
Deforestation
Law enforcement Support to Guatemalan institutions in
charge of law enforcement, especially
CONAP, INAB and MP.
Forest patrols Support to communities or individual forest
owners in legal following in case of illegal
activities committed by a third part.
Support for access to forestry
incentives program PINFOR and
PINPEP, and incomes from VCUs
Access to resources as they will not have to
pay for a professional to prepare files to be
presented to incentives Programs PINFOR
and PINPEP, alternative incomes from
incentives and VCUs
Support for agroforestry plantations
and access to markets
Access to resources (plantations supplies,
technical assistance, marketing support)
and alternative incomes
Table 9. Illegal activities which may negatively affect the Project.
4 APPLICATION OF METHODOLOGY
4.1 Title and Reference of Methodology
Approved VCS Methodology VM0015, Version 1.1, Methodology for Avoided Unplanned
Deforestation.
4.2 Deviations from the Monitoring Plan
No monitoring deviations have been proposed in the PD or are proposed for this monitoring period.
4.3 Project Boundary (G1)
Carbon Pools:
Carbon Pool Included? Justification/ Explanation of
Choice
Aboveground tree biomass Yes Major carbon pool affected by
project activities.

MONITORING & IMPLEMENTATION REPORT VCS Version 3.6, CCB Standards Second Edition
v3.0 45
Aboveground non-tree
biomass
Yes Expected to increase from
project activities. Must be
included when the land cover
under the baseline scenario is
perennial tree crop.
Belowground biomass Yes Major carbon pool affected by
project activities.
Dead wood No May be conservatively
excluded as it expected to
decrease under the baseline
scenario.
Litter Yes Major carbon pool affected by
project activities
Soil organic carbon No May be conservatively
excluded as it expected to
decrease under the baseline
scenario.
Wood products Yes Major carbon pool affected by
project activities
Table 10. Carbon pools inside the Project
Sources of GHG Emissions:
Gas Included? Justification/Explanation
Biomass
burning
CO2 No Accounted for as changes in carbon
stocks
CH4 No Not a significant source (<5%) according
to the revised LULUCF IPCC GL 1996
document.
N2O No Considered insignificant according to
VCS Program Update of May 24th, 2010
Livestock
Emissions
CO2 No Not a significant source
CH4 No Not an included activity
N2O No Not an included activity
Table 11. Sources of emissions inside the Project.
4.4 Baseline Scenario (G2)
Per VM0015, the most plausible baseline scenario for the project is continued unplanned deforestation for
timber, agriculture and grazing activities resulting in removal of old growth/ primary forest. The project

MONITORING & IMPLEMENTATION REPORT VCS Version 3.6, CCB Standards Second Edition
v3.0 46
area would be deforested in the absence of the REDD project activity. The deforested areas are mosaic
in nature.
Deforestation of old-growth/ primary forest without logging (A)
This option applies because under the mosaic typology of deforestation, the historical changes in land-
use are representative of the most likely future changes in land-use.
4.4.1 Without-Project Scenario for Communities (CM1)
FUNDAECO made a scenario exercise based on methods proposed by Richards and Panfil (2011).
Focal questions were related to access to land and natural resources in both the baseline and project
scenarios. The focal issues within the community were tied directly to the agents and drivers analysis, as
is described in the PD.
Six main focal issues for communities were identified:
Access to land
Maize production/crop lands
Access to livelihoods other than maize
Rains and water
Education
Sexual and Reproductive education and health
a. Access to land: access to land is one of the main focal issues, and it means access to croplands, pasture land, and other natural resources including wood, fuelwood, and water sources. At the community level, access to land also means access to sacred sites. In absence of the project, it is expected that communities will continue the fight for the
establishment of agricultural and pastoral land in forested areas due to factors such as the
expansion of industrial agriculture in previously cultivated low-land areas and increasing
population. However they are aware of the need they have for external support such as provided
by FUNDAECO and the project, due that the process for land titling requires the preparation of
technical and social files, as well as administrative procedures and lobbying with FONTIERRAS
headquarters in Guatemala. They are aware that without land, there is no food security, but they
also preview other situations such as migration and social conflict.
b. Maize production: Maize crop is considered focal issue since it means food security to families that cultivate it for consumption. During the exercise, the issue was analyzed from the production perspective; sufficient yield and a not sufficient yield, to feeding family needs. Production is related to quality of grain, agricultural practices, and quality of soil. When adding other driver forces such as quality soil and land, and population growth the scenario shows that this is a multi-variable force, that then need to be addressed considering all other identified forces.
In the present, quality lands are scarce and peasants lack of best agricultural practices; so to get
enough yield peasant needs to use more land, in shorter fallow cycles.
Without the project, communities will stay in present conditions, meaning they will need to expand
croplands eliminating forests, but also getting into others lands when their land is not producing
enough. When added population growth factor, situation turns into social conflicts. Other
MONITORING & IMPLEMENTATION REPORT VCS Version 3.6, CCB Standards Second Edition
v3.0 47
envisaged situations are related to lack of rains (“the forest produces rains”), erosion and
disasters.
c. Access to livelihoods other than maize: Livelihoods other than maize can include other crops, but also activities such as ecotourism, or work opportunities. However, this driver force relies on some other forces such as access to markets, best organization and entrepreneurial capacities.
Without the project, there will be less access to project activities and then less support to
diversified and alternative livelihoods. It is recognized that the government have some programs,
but lack of capacities to identify priorities, reach communities and make a good follow-up of their
program beneficiaries. In this scenario, communities will need to turn to unsustainable wood
extraction, unsustainable maize expansion and migration to uncertain conditions; poverty will
increase.
d. Rains and water: Considered as contributing forces since crops and domestic consumption rely on them, rain and water are an uncertain driver force since there are no specific models for the region. However local have started to feel difference between previous patterns and present rain patterns, in the last years yields were affected by longer dry seasons, at the same time that disasters have occurred with heavy unusual rains over deforested lands, and river flows are reduced compared to before volumes.
When analyzing this driver force it is clear that there is a local knowledge on the influence on
forest in the rivers flows and rains. Without project, there will be no law enforcement or access to
incentives that guaranteed watersheds protection, that will be deforested leading to reduced river
flows and competition for its use.
c. Education this is a driver force related with livelihoods but also to general community welfare. In
the present communities, do not have access to high school, or to technical education levels. This
reduces their work opportunities. In addition, the situation is worst for women that in many cases
do not finish even elementary school. Without the project education opportunities for women area
reduced.
e. Sexual and reproductive education and health: In the present women need to walk long distances to the nearest public health services, and they can die during pregnancy or birth from causes that can be prevented; rural and isolated communities in the project region have high mortality rates, compared just to the ones from Africa. There is also no access to family planning methods which impacts in the health of women and children, but also in the family economy, and resources such as croplands. Without the project, mortality rates for pregnant women will remain the same, but also their health conditions in general. Moreover, population growth will affect scarce resources, especially land and cropland.
4.4.2 Without-Project Biodiversity Scenario (B1)
Biodiversity conditions in the baseline scenario were analyzed based on the observed and predicted land
use changes taking place in the project region. As discussed in Richards and Panfil (2011), changes in
biodiversity are strongly correlated with changes in forest cover, making it possible to measure and
analyze biodiversity health by using proxy indicators within the environment. The fact that biodiversity

MONITORING & IMPLEMENTATION REPORT VCS Version 3.6, CCB Standards Second Edition
v3.0 48
abundance is directly correlated with habitat (i.e. forest cover), and ecosystem health is possible to
determine impacts on biodiversity from broader-scale assessments on an ecosystem or regional level.
This method of analysis was used for the FUNDAECO Project to inform the development of the theory of
change model for biodiversity, including project objectives and activities geared towards bringing about
biodiversity benefits (see Section 8 and TOC Activity Matrix v1.14.xlsm).
Through an understanding of the biodiversity that has historically been supported within the project region
and an analysis of trends in forest loss in this area, the trajectory of ecosystem health can be accurately
predicted. The project region consists of a network of threatened forest areas that provide invaluable
habitat for an abundance of endemic species, as well as numerous migratory species. These forests also
provide large-scale ecosystem services such as nutrient enrichment, erosion control, and hydrological
function that benefit both communities and biodiversity within the region.
The ecological integrity of these forests, however, has been severely impacted by anthropogenic land use
change over the past several decades. An analysis of deforestation within the Sarstun Motagua reference
region from the period of 2001-2010 showed an annual rate of deforestation of 3.41% (see
fundaeco_deforestation_rate_v1.4.xlsx for details). This translates to a staggering loss of roughly 20,503
hectares of forest per year.
The problem flow analysis for biodiversity in Table 12 shows how the drivers of deforestation create a
causal chain of events that result in the loss of forest area and have negative effects on biodiversity
throughout the region. Not only have these drivers already contributed to huge losses in forest area
throughout the reference area in the past decade, but there were no direct actions being taken in the
absence of the project to address any of these threats. Without the project’s intervention, there are no
indications that measures would be taken to protect and maintain biodiversity within the Sarstun-Motagua
region, which would result in the further fragmentation and loss of forest habitat as well as the decline in
health and abundance of forest and marine species.
Project Intervention
Areas
Contributing
Factors
Contributing Factors Direct Threat Conservation
Target, Focal
Issues
Governance and
resource protection
(strengthening
enforcement of the
law, legal framework,
land title, land-use
planning &
implementation)
Limited local
resources, legal
framework,
governance and
capacity for land-use
planning
Little to no
enforcement of laws
against forest clearing
Conversion to
crop land
Conversion to
pasture for
cattle ranching
Illegal
settlement of
land
Logging,
fuelwood
collection, and
fishing for
local
enterprise,
In-tact forest
area
(diminished
forest area,
fragmentation,
degradation of
forest
composition,
structure,
function and
habitat)
Marine life
Biodiversity
HCVs
Lack of clarity &
definition of individual
/ family land rights.
Ineffective land-use
planning
Providing access to
resources,
alternative
livelihoods
Limited local
resources , and
limited alternatives
to land clearing,
timber extraction,
Unmet economic,
sustenance needs for
families. High demand
and price for timber

MONITORING & IMPLEMENTATION REPORT VCS Version 3.6, CCB Standards Second Edition
v3.0 49
and fishing and seafood. domestic use
Commercial
sale of fuel
wood,
charcoal, and
fish
Education and
community
empowerment
Limited local capacity
for environmental
leadership project
implementation
Table 12. Biodiversity problem flow analysis.
The model of the baseline scenario also corroborates the biodiversity problem flow analysis in that large-
scale deforestation is predicted to affect biodiversity throughout the reference region and project area
were the project not in place. The baseline model shows a decline in forest area of 11% over the next 30
years in the Grouped Project Area, resulting in a loss of roughly 108,800 total hectares of forest (see
Figure 7 and Fundaeco VM0015 Accounting Model v1.46.xlsm). A loss of forest of this magnitude would
result in dramatic negative effects on biodiversity through the loss, and degradation of habitat and
ecosystem functions. These predicted outcomes highlight the necessity of effective conservation
measures throughout the region.
Figure 7. Grouped Project Area forested area (ha) over time in baseline scenario.
4.5 Additionality (G2)
4.5.1 VCS Tool for the Demonstration of Additionality
The project has used the VCS Tool for the Demonstration of Additionality in VCS AFOLU Project
Activities (VT0001) version 3.0 to assess the additionality of the project and select the baseline scenario.
The assessment remains unchanged since the time of validation.
Step 1: Identification of alternative land use scenarios to the proposed VCS AFOLU project
activity

MONITORING & IMPLEMENTATION REPORT VCS Version 3.6, CCB Standards Second Edition
v3.0 50
Sub-step 1a(a): Identify credible alternative land use scenarios to the proposed VCS
AFOLU project activity
i. Continuation of pre-project land use. The following land uses occurred in the project area prior to project initiation:
1. Unplanned expansion of small-scale commercial agriculture, subsistence agriculture, and cattle grazing – As stated above, the Ladino and Q’etchi communities are relocating from fluvial valleys to protected areas due to heavy investment for large-scale commercial production of timber species, palm oil, and cattle-grazing. The remaining forested areas and protected areas of the region are located in the region’s mountains that are generally above 300m in altitude with steep slopes and are unattractive for agro-industrial cultivation. As a result, agents of deforestation are typically small-scale farmers growing annual or permanent crops and farming livestock. This land use results in deforestation (unplanned).
ii. Project activity on the land within the project boundary performed without being registered as the VCS AFOLU project
2. It is possible, though highly unlikely, that FUNDAECO could prevent deforestation from small-scale farming and cattle-grazing that result in the project area without registering the activity as a VCS project and by financing alternative livelihood and other project activities through aid agencies, philanthropy, or grants.
3. It is possible, though highly unlikely, that national or international development or non-governmental organizations could implement similar alternative livelihood, governance, and capacity building activities to reduce deforestation.
iii. Activities similar to proposed project activity on at least part of the land within the project boundary resulting from legal requirements or observed similar activities
4. PINFOR and PINPEP, described above in Section 3.1, are established forest
protection programs by INAB that include payments for conservation or protection of forest resources on private lands. It is possible, although highly unlikely, that landowners could pursue these payments individually in the project area to protect or conserve forested areas and prevent unplanned deforestation.
Sub-step 1a(b): Credibility of identified land use scenarios
Scenario 1 was present in the project area prior to project initiation and is thus credible. The
drivers of deforestation study carried out by the CNCG working group (see CNCG SM drivers of
deforestation_final_1.pdf) confirm that these land uses were present in the project area prior to
the project start dates and are likely to continue unabated in absence of the project. Scenario 2
above is considered credible since FUNDAECO has been operating in the Izabal region for over
20 years through various financing strategies including donors. Scenario 3 is considered credible
because while aid and non-governmental organizations have implemented sustainable
development projects in the region before, they have been markedly different in scale. Scenario 4
is considered credible as there are existing regulations for PINFOR and PINPEP (see Section
MONITORING & IMPLEMENTATION REPORT VCS Version 3.6, CCB Standards Second Edition
v3.0 51
3.1) that are managed by INAB and these activities are present in the project area prior to project
initiation.
Sub-step 1a(c): List of credible alternative land use scenarios
1. Unplanned expansion of small-scale commercial agriculture, subsistence agriculture, and cattle
grazing, see number 1 above.
2. Implementation of alternative livelihood and other activities to reduce of deforestation due to
small-scale agriculture and cattle-grazing by FUNDAECO through financial resources other than
carbon credits, see number 2 above
3. Implementation of alternative livelihood, governance, and capacity building activities to reduce
deforestation by an international or national non-profit, see number 3 above.
4. Application for conservation payments through the PINFOR or PINPEP programs by individual
landowners resulting in reduced deforestation.
Sub-step 1b(a): Consistency of credible land use scenarios with enforced mandatory
applicable laws and regulations
i. Scenario 1 is legal within the project area except for within the Zona Nulceos of protected areas that according to the Planes Maestros does not allow for the use of natural resources or any production system including agriculture, livestock, or forestry (see Plan Maestro Cerro San Gil.pdf, plan maestro Parque Nacional Rio Dulce.pdf, Plan Maestro Parque Regional Municipal Montana Chiclera.pdf, Plan Maestro Punta de Manabique.pdf, Plan Maestro Río Sarstún 200709.pdf, and Decreto 16-2014_Sierra Caral.pdf). Around the Zona Nucleos within protected areas are Zona de Uso Multiplo, Zona de Amortiguamientos, and Zona Recreativas where natural resources use or productions systems including agriculture, livestock, and forestry are permitted. Outside of the protected areas Scenario 1 meets applicable laws. Land use scenarios 2 & 3 involve the action of local or international NGOs and it is assumed that their activities would be in compliance with regulatory requirements. Land use scenario 4 is based on the regulatory framework of the PINFOR and PINPEP laws, described above in Section
3.1, and is this in compliance with all regulatory requirements.
ii. In the case of Scenario 1, an analysis of current practice with Zona Nucleos is presented demonstrating that the mandatory laws with these areas are not enforced and non-compliance within these areas is widespread. As discussed in Section 4.5.3 of the Joint VCS and CCB Project Description, an exploratory factor analysis of 501 questionnaires concerning the regional population’s views on the cause of deforestation found that a “Lack of Laws, Enforcement and Capacity” is the second factor in explaining the quantity of deforestation in the region. This suggests that the regional population recognizes that mandatory laws within the region are not enforced and non-compliance often passes with no oversight from the legal authority of CONAP.
In addition to this evidence, the rate of deforestation was analyzed during the historical
reference period based on LULC maps for 2001, 2006, 2010 (see Section 5.3 of the Joint
VCS and CCB Project Description). Over that time period the Zonas Nucleos had a
deforestation rate of 1.16% while within the Reference Region the deforestation rate was
3.41% (see fundaeco_deforestation_rate_v1.4.xlsx and Fundaeco Deforestation Rate -
Zona Nucleos v1.1.xlsx). Although the deforestation rate appears low to that of the

MONITORING & IMPLEMENTATION REPORT VCS Version 3.6, CCB Standards Second Edition
v3.0 52
reference region, this remains a relatively high deforestation rate that results in 2,260-ha
of forest loss per year in areas where deforestation is illegal. Moreover, an analysis of
the spatial drivers of deforestation (see Section 4.5.3 of the Joint VCS and CCB Project
Description) demonstrated that elevation, slope, distance to forest edge, distance to
secondary roads, and distance to navigable hydrology were the variables that explained
the greatest variance in locations of forest loss, where lower values explained greater
deforestation. The average of each of these variables over forested areas for 2010 is
presented in Table 13 across two areas: 1) the Grouped Project Area with Zona Nucleos
removed and 2) the Zona Nucleos.
Figure 8: Map of the Core Zone (Zonas Nucleos).
Spatial Variable
Grouped
Project
Area
Zonas
Nucleos
Grouped
Project Area
san Zonas
Nucleos
Elevation (meters above sea
level) 301.012 340.22 247.69
Slope (Percent rise) 27.531 24.90 28.08
Distance to Forest Edge (meters) 0.229 0.0967 0.3699

MONITORING & IMPLEMENTATION REPORT VCS Version 3.6, CCB Standards Second Edition
v3.0 53
Distance to Hydrology (meters) 4268.83 5818.19 5138.75
Distance to Navigable Hydrology
(meters) 7131.2 6347.0 7862.66
Pop Density (people per square
meter) 106.984 105.673 116.63
Distance to Secondary Roads
(meters) 4268.83 5818.19 3153.18
Distance to Tertiary Roads
(meters) 1701.42 2363.07 1227.0
Distance to Primary Roads
(meters) 11780.8 12729.4 10987.6
Farm coverage (coverage metric,
higher = more coverage in region) 2844.35 1958.7 3575.26
Pasture coverage analysis
(coverage metric, higher = more
coverage in region) 34115.5 30543.1 36200.69
Table 13. Average values of explanatory spatial variables of deforestation with the Grouped Project Area, the Grouped Project Area san Zonas Nucleos, and the forest area in the Zona Nucleos.
Table 13 demonstrates that the identified spatial variables in the Zonas Nucleos are
greater than that of the average of the Grouped Project Area and provide explanation for
outside governance and oversight by CONAP for a lower deforestation rate. As Zonas
Nucleos are often contained within the upper reach of mountain ranges in Izabal and
within the interior of protected areas, this result is expected.
Lastly, the seven protected areas within the Project Zone are co-managed between
FUNDAECO and CONAP. This is demonstrated in the Plan Maestros where
FUNDAECO is listed as a management partner. This points to the fact that if
FUNDAECO were not to receive additional funds through the REDD+ Project for
Caribbean Guatemala, the capacity of an important management partner would be
compromised proving that despite the illegality of deforestation in Zonas Nucleos,
Scenario 1 remains additional.
Together, this evidence demonstrates that the local population recognizes the lack of
enforcement within protected areas which is demonstrated by the 2,260-ha of forest loss
per year in Zonas Nucleos. Although this deforestation rate is low compared to that of
the reference region, this can be explained by location rather than governance or legal
authority.
iii. Based on above, no land use scenarios have been removed.
Sub-step 1b(b): Outcome of Sub-step 1b

MONITORING & IMPLEMENTATION REPORT VCS Version 3.6, CCB Standards Second Edition
v3.0 54
1. Unplanned expansion of small-scale commercial agriculture, subsistence agriculture, and cattle
grazing, see number 1 above.
2. Implementation of alternative livelihood and other activities to reduce of deforestation due to
small-scale agriculture and cattle-grazing by FUNDAECO through financial resources other than
carbon credits, see number 2 above
3. Implementation of alternative livelihood, governance, and capacity building activities to reduce
deforestation by an international or national non-profit, see number 3 above.
4. Application for conservation payments through the PINFOR or PINPEP programs by individual
landowners resulting in reduced deforestation.
Sub-step 1c: Selection of baseline scenario
Due to the continued displacement of Ladino and q’eqchi’ into protected areas and the lack of adequate
governance and resources to limit land conversion for agriculture and cattle-grazing within the project
area as demonstrated in Section 4.5.3 of the Joint VCS and CCB Project Description, the most plausible
baseline scenario is the continuation of previous and current land use scenario (scenario 1 above). This
scenario has been ongoing in the project area and reference area over the last decade and is unlikely to
cease without effective intervention.
The project activities described in this document require substantial financial resources and long-term
presence in the project area to manage the activities. Without significant financial returns to ensure
project longevity, aid and non-governmental projects cannot operate at the scale described above.
Because of these limitations on potential regional, national, and NGO activities, scenarios 2 and 3 were
not selected.
PINFOR and PINPEP offer an alternative revenue source for forest protection and conservation that has
existed in the project area prior to project initiation. Application to PINFOR and PINPEP, however,
involves several technical steps including mapping of property and forest boundaries, forest inventory,
and completion of technical forms. In Izabal this technical expertise has been primarily provided by
FUNDAECO to private landowners and is not carried out by individual landowners. In addition, PINFOR
and PINPEP payments are only provided to landowners for several years, after which they receive no
additional benefits and cannot re-enroll in the program. This makes PINFOR and PINPEP unviable as
long-term economic opportunities for landowners. For this reason scenario 4 was not selected.
Step 2: Investment Analysis
The VCS Additionality Tool requires that either step 2 (investment analysis) or step 3 (barrier analysis) be
undertaken (or both). The barrier analysis was selected and is completed below.
Step 3: Barrier analysis
This section shows how project activities would not take place without the revenues arising from the sale
of GHG credits.

MONITORING & IMPLEMENTATION REPORT VCS Version 3.6, CCB Standards Second Edition
v3.0 55
Step 3a: Identify barriers that would prevent the implementation of the type of proposed project
activity
Investment barriers. Similar activities to the Resource Protection, Governance, and Monitoring,
Sustainable Enterprise, Education, Community Empowerment & Inclusiveness, and Increased
Access to Resources activities identified in the Theory of Change document (see TOC Activity
Matrix v1.14.xlsm) have only taken place with the aid of grants from international cooperation, the
national government, or international donors. Previously FUNDAECO received international aid
to finance project activities that ended in April 2011 (Finalizacion CONTRATO JADE 2010-
2011.pdf). With a slowdown in international aid FUNDAECO deliberately pursued a new
financing strategy through REDD+ and forest carbon credits demonstrated by entering a
Memorandum of Understanding with the Althelia Fund on August 8th, 2010 (MOU BNP
PARIBAS_Complete.pdf). To overcome the lack of international aid and investment barriers
FUNDAECO pursued a new financing strategy under REDD+.
Other forms of finance such as debt funding are not available for these types of project activities,
unless under a REDD+ project that is conditional on the returns in the form of VCUs. As a non-
profit organization that directs income towards management costs and project activities, seeking
credit is inherently risky without producing a scalable commodity such as carbon credits. The
REDD+ project enables the carbon streams to be used as guarantee.
Institutional barriers. There are risks related to changes in government policies, as the
Guatemalan National Emissions Reduction Program is being developed, and there are on-going
discussions about the adoption of a jurisdictional framework. Early REDD+ initiatives are being
promoted by the Government, and will help bring down the barrier. The main institutional barrier,
though, is the lack of enforcement within protected areas by national entities due to following
shortcomings identified in Guatemala’s Readiness Preparation Proposal(RPP) a)the existence of
significant regulatory loopholes; b) cross competencies among different institutions, which often
means that none of the institutions take responsibility; c) regulations that lack sufficient coercion; d)
few formal areas for public participation in the design and control of institutions and policies; and e) a
lack of inter-institutional coordination (Guatemala Final RPP_March 2012.pdf).
Barriers related to local tradition. Traditional use of resources and agriculture is very basic, not
linked with broader markets, and relies on the harvest potential of a combination of subsistence
crops.
Barriers due to prevailing practice. The REDD+ project promoted by FUNDAECO is the first of its
kind in the Izabal Department of Guatemala. There are three other REDD initiatives in the Tierras
Baja del Norte region of Guatemala in the Maya Biosphere Reserve, Sierra del Lacandon
National Park, and in the eco-region of Lachua. However, none of these projects have achieved
validation or verification under VCS or CCBA.
Barriers due to social conditions and land-use practices. Important drivers of deforestation in
the area include increasing population and investment in agro-industrial activities in Izabal
creating demographic pressure on land.
Barriers related to Land tenure and property rights. The prevailing communal land ownership
limits the incentives for conservation, as property rights on the timberlands are not clearly
defined. The internal informal tenure systems present a risk of land fragmentation.

MONITORING & IMPLEMENTATION REPORT VCS Version 3.6, CCB Standards Second Edition
v3.0 56
Barriers related to markets, transport and storage. There are infrastructure barriers, including lack
of transportation, energy and waterways to generate stock piling or processing of agricultural
goods in the territories. It is difficult to transport products included in project activities to market as
infrastructure is scarce or nonexistent.
Unregulated and informal markets. The markets for products related to the project activities do not
allow the transmission of effective information to the communities proposing the project.
Remoteness of AFOLU activities. The project occurs in an area with underdeveloped road and
infrastructure resulting in high transportation costs, eroding competitiveness and profitability of
non-timber forest products
Lack of infrastructure. There are no facilities to convert, store, or add value to production from
proposed project activities. This lack of infrastructure limits the possibilities for communities to
profit from the goods produced through the proposed project activities.
Step 3b: Show that the identified barriers would not prevent the implementation of at least one the
alternative land use scenarios (except the proposed project activity):
All barriers identified above will not prevent the land use scenarios identified in Step 1.
Step 4: Common practice analysis
Due to the lack of governmental and community resources, projects or initiatives to reduce deforestation
and forest degradation on this scale in the region, are being launched by local and international NGOs, in
some cases with the participation of the government. Several projects REDD+ project exist within
Guatemala, and 2 have recently achieved validation, and are actually under verification. These include:
- A project in the Forest Concessions of the Maya Biosphere Reserve, run by Concesionarios Forestales de Petén and the Rainforest Alliance (GUATECARBON). It covers an area of nearly 500,000 ha and aims to strengthen existing activities in sustainable forestry management in the face of future deforestation pressures. It is validated under CCB and VCS.
- A project in the Sierra del Lacandón National Park, run by the Fundación Defensores de la Naturaleza (Forest For Life). It covers an area of 202865 ha and aims, amongst other objectives, to reduce the advancement of agricultural land into the park, illegal logging, and forest fires. The project has succeeded in reducing CO2emissions by the equivalent of 1,238 million tons over 20 years. It is validated under VCS and CCBA.
- A project in the eco-region of Lachuá, run by the Fundación Lachuá and the IUCN. The ecoregion of Lachuá consists of 33000 ha of native forests, 14000 ha of which are located within the Lachuá national park. This project has not experienced any recent deforestation, but it is expecting a strong increase in deforestation in the future due to the tarmacking of the road known as the Franja Transversal del Norte, a road that crosses Guatemala from east to west. The results of the subnational reference scenario appear to confirm the feasibility of developing a REDD project in this region. It is seeking a VCS and CCBA certification.

MONITORING & IMPLEMENTATION REPORT VCS Version 3.6, CCB Standards Second Edition
v3.0 57
While FUNDAECO has supported similar project activities in the region previously, the traditional source
of FUNDAECO’s financing, international donors, ended in April 2011 (Finalizacion CONTRATO JADE
2010-2011.pdf). In response to this FUNDAECO pursued a new financing strategy through REDD+ forest
carbon credits and entered an MOU with the Althelia Fund to initiate the due diligence of this financing
strategy (MOU BNP PARIBAS_Complete.pdf). FUNDAECO has been the principal group who has
implemented the outline project activities above (see Section 2.2) in Izabal at a regional scale.
The region is predominately comprised of private landowner, community landowners, and non-titled right
holders, who do not have the financial capacity to implement activities similar in scope to those presented
here. Therefore, efforts to reduce deforestation and forest degradation through Resource Protection,
Governance, and Monitoring, Sustainable Enterprise, Education, Community Empowerment &
Inclusiveness, and Increased Access to Resources, are not common practice in the region. As a result of
this analysis, the project activities are determined to be additional.
4.5.2 Community and Biodiversity Benefits
4.5.2.1 Community Benefits
During the reporting period, the project benefited community members according to their location and
implemented activities related to the Theory of change, this means that not all communities are getting all
the project benefits, as shown below:
Supported agroforestry initiatives: the provision of agroforestry supplies such as seeds, plants
and basic agrochemicals in the initial phases of the agroforestry system. FUNDAECO is
providing these supplies just for prioritized agroforestry systems. This benefit covered only
communities located in areas deforested before 2001, and where deforestation threats continue.
Technical assistance for agroforestry: FUNDAECO technicians visited supported producers
during the reporting period but also other producers that were willing to improve their production
and are organized in productive groups or associations. The technical assistance visits
pretended to detect any problem with their crops and give advice to the producer.
Revenues from agroforestry production: supported producers were able to sell their products and
generate revenues. FUNDAECO had a positive role to make this benefit possible, by developing
a regional marketing strategy for these products, through the brand “The Conservation Coast TM”,
that promote the values for these products during the reporting period. FUNDAECO also
established an alliance with AGEXPORT to obtain advice and support to access markets to the
benefit of producers in the Project Zone.
Land legalization: FUNDAECO supported historically seated communities in land legalization, by
preparing technical and legal files required by FONTIERRAS, and by lobbying institutions
involved in land legalization. Land legalization allowed communities to access forestry incentives,
and to participate in the project as carbon holders.
Support to access forestry incentives: PINFOR, PINPEP, PROBOSQUE: FUNDAECO supported
communities in the preparation of technical and legal files required by INAB to access the
different forestry incentives; this includes forest inventory, forest management plan, legal file and
the designation of FUNDAECO professional as forestry regent. This support was provided to
communities that are participating as carbon holders. Supported communities received forestry
incentives directly from INAB during the reporting period.

MONITORING & IMPLEMENTATION REPORT VCS Version 3.6, CCB Standards Second Edition
v3.0 58
Services in control and surveillance of their properties and litigation: The project has regional
control and surveillance team that organizes and implement patrols within all the Project Area.
Sexual and Reproductive Health and Education: this is a regional benefit provided by
FUNDAECO to cover communities within the Project Zone. Many community members, with
special focus on women, were provided access to services in the Community Women Clinics and
medical days organized by FUNDAECO. As part of the Sexual and Reproductive Health Strategy
FUNDAECO also organized talks, courses, and awareness activities, trains young women in
peer to peer education, support midwifes and health promotors in updating their skills during the
reporting period.
Education and training: FUNDAECO provided training focused on young women, in order to
support them in finishing elementary and high school. Women were selected according to their
willingness and commitment to finish this education phases.
4.5.2.12 Biodiversity Benefits
Man project activities produced positive biodiversity impacts during the reporting period. These have
been categorized into four different program areas, through the theory of change approach, that focus on
resource protection, empowerment and inclusiveness, education, and access to resources. Many of these
project activities effectively maintained and supported biodiversity in the Project Zone to bring about
climate and community benefits as well. The realized biodiversity impacts of each program area and its
corresponding project activities are described below.
Program Areas Activities Medium-term Impacts Long-term Impacts
Resource
Protection and
Governance
Implementation of fish
restoration zones
Greater clarity and
commitment re land-use
and sustainable
strategies.
Increased awareness of
the role of Guatemala’s
Caribbean coast in the
support of diverse and
globally important
species populations.
Maintenance or
enhancement of the
integrity of important
ecosystem services.
Widespread protection
of forest in project zone
Enforced protection and
management of
protected area forests
and community water
sources
Prevention of habitat
loss and maintenance of
natural ecosystems.
Greater awareness and
respect for land title and
land-use designations.
Increased land tenure
and land legalization
efforts
Increased area of newly
legally registered land
that can be brought into
forest protection,
agroforestry, or
reforestation.
Environmental litigation,
and participation in local
government and
Continuation of
important forestry, land
use planning, and

MONITORING & IMPLEMENTATION REPORT VCS Version 3.6, CCB Standards Second Edition
v3.0 59
protected area councils climate change laws
Increased governance
capacity and a positive
influence on land
management decisions
within protected areas
Empowerment
and Inclusiveness
Engagement of
community in biological
monitoring process
including the
engagement of local
fisherman in reef
monitoring initiatives
Increased awareness
and knowledge of
biodiversity,
ecosystems, and
threatened or
endangered species
within the project area
and Caribbean coast
Increased awareness of
the role of Guatemala’s
Caribbean coast in the
support of diverse and
globally important
species populations
Awareness of rare,
threatened, and
endangered species
and their importance
Education Ecotourism site
establishment
Increased awareness
and knowledge of
biodiversity,
ecosystems, and
threatened or
endangered species
within the project area,
Caribbean coast, and
world
Increased awareness of
the role of Guatemala’s
Caribbean coast in the
support of diverse and
globally important
species populations
Maintenance or
enhancement of critical
habitat and populations
of rare, threatened, and
endangered species
within the project zone
Workshops and
education initiatives for
schools and communities
on biodiversity and
ecosystem conservation
Support for biodiversity
research throughout the
project zone
Training and education
for park guards on
amphibian fungus and
preventing its spread to
vulnerable populations
Maintenance and
protection of habitat
integrity and populations
of endangered species
Access to
Resources
Land use planning and
legal services in project
zone
Increased
implementation of forest
protection through land
use management and
land legalization
Widespread protection
of forest in project zone

MONITORING & IMPLEMENTATION REPORT VCS Version 3.6, CCB Standards Second Edition
v3.0 60
Establishment of
agroforestry plantations
and related services to
diversify incomes and
supply timber needs
Decreased illegal timber
extraction
Local production and
employment alternatives
Dividends to the
community
Reduced reliance on
unsustainable timber
extraction
Technical assistance for
crops, agroforestry
plantations, and
sustainable fishing.
Improved access to
ecosystem services
payment programs such
as PINFOR and PINPEP
Table 14. Theory of change overview for biodiversity related project activities.
5 MONITORING DATA AND PARAMETERS
5.1 Description of the Monitoring Plan (CL4, CM4 & B4)
In the context of FUNDAECO’s VCS/CCBA REDD+ project in Guatemala, the purpose of the monitoring
plan is to measure and record data and indicators used to measure the climate, community, and
biodiversity effect of the project compared to the baseline, without project, scenario. In accordance with
project verification standards, FUNDAECO has set up the necessary follow-up mechanisms in order to
ensure monitoring of all relevant variables and indicators, including: forest cover; forest degradation;
socio-economic data; average family income evolution; reproductive health indicators; employment
creation; average agricultural yields; biodiversity monitoring (indicator species); etc. For annual
summaries of FUNDAECO’s community, and biodiversity impacts see the Monitoring Indicator and
Results Matrix v1.5.xlsx, Memoria de Labores 2012 Fundaeco.pdf, and Memoria de Labores 2013
Fundaeco.pdf). Methodologies used to estimate and model values correspond to those proscribed by
VM0015 v1.1, and are detailed in sections 4, 5, 6, and 7 of the Joint VCS-CCB Project Description.
Periodicity of monitoring is enumerated for each parameter in Sections 5.3 and 5.2 Roles and
responsibilities for monitoring as well as GHG information management systems are in Section 5.1.
The climate impact on the project and other areas was monitored using remote sensing, permanent plots
measuring the carbon content of the forest, and a suite of monitoring strategies to climate-related
activities within the leakage belt and the project area itself. While models of carbon savings will be
created to predict the impacts, empirical evidence from the project area and similar control areas outside
of the project will be used at verification to confirm the carbon savings generated.
FUNDAECO monitored activities related to community impacts by keeping records of community
indicators outlined in the Theory of Change document (see TOC Activity Matrix v1.14.xlsm). By keeping
detailed records of the people participating in and affected by community related project activities,
FUNDAECO has been able to measure improvements in the quality of life within communities throughout
the project zone. See Sections 7, 5.1.2.2 and Procedimiento para el Monitoreo Socioeconomico y
Comunitario.docx for a more detailed description of community monitoring procedures and results.

MONITORING & IMPLEMENTATION REPORT VCS Version 3.6, CCB Standards Second Edition
v3.0 61
Biodiversity impacts of the project were measured primarily through analyzing the change in intact forest,
which was used as a proxy for both floral and faunal diversity. Additionally, FUNDAECO implemented an
extensive bird monitoring program in order to catalog avian diversity throughout the project region for use
both in the project’s biodiversity monitoring goals as well as for use within the scientific community.
5.1.1 Organization and Management
FUNDAECO’s organizational structure for project management and implementation consists of four
levels: first level is National Directive Level where Board of director, and Project Directive Committee are
involved, this level also includes legal assessment and communications assessment; second level
includes Thematic coordination with units that respond to each of project components; the third level is
the Regional coordination Level where the Regional Project Director coordinate directly with field level or
the fourth level; the Geographic Coordination or Protected Area Coordination. Each Geographic
Coordination has a Coordinator as well as staff who manage teams that implement project activities
under the climate, community, or biodiversity categories. See Figure 9 for a detailed organizational
structure.

MONITORING & IMPLEMENTATION REPORT VCS Version 3.6, CCB Standards Second Edition
v3.0 62
Co
ord
inac
ion
es
Tem
átic
as
Técnicos de
Monitoreo
Biológico
Co
ord
inac
ion
es
Ge
ogr
áfic
asC
oo
rdin
ació
n r
egi
on
al
Directora Participación
social y Género
/Programa Niña y
Mujer/Grievance
Mechanism
Enfermeras
Clínicas
Comunitarias
de la Mujer
Coordinación
Marino
Costera
Dir
ect
ore
s
A
S
A
M
B
L
E
A
G
E
N
E
R
A
L
T
E
N
E
D
O
R
E
S
D
E
D
E
R
E
C
H
O
S
D
E
C
A
R
B
O
N
OCoordinación Sierra
Santa Cruz/SurOeste
Rio Dulce
Coordinación Sierra
Caral
Coordinación
Montaña
Chiclera
Coordinación Cerro San
Gil/Navajoa/Noroeste
Ríio Dulce/Punta de
Coordinadora Social y
género Regional
Ecoturismo
Tabajadoras sociales
Monitoreo Socio-
Económico
Consejo
Directivo de
Proyecto
Director Estrategico del
Proyecto Mercadeo de
Carbono
Monitoreo Biológico y
HCV Biodiversidad
Unidad Central
de Contabilidad
y Auditoria
Coordinación
SIG
Asistente Litigación
e Incidencia Agronegocios
Director Técnico
Fundaeco
Director
Administrativo
REDD+ Manager
/monitoreo del
Proyecto
Departamento
Jurídico
Director Emprendimientos
Empresariales
Junta directiva de
FUNDAECO
Coordinación de
comunicaciones
Asistencia SIG y
bases de datos
Director
Regional de
Proyecto
Asistente
Administrativa
Regional
Coordinador
Sistemas
Agorforestales
a (Monitoreo
produccion)
Coordinación Regional
de Protección y
Vigilancia
Coordinación Rio
Sarstun/Biotopo
Naachtun
Asistencia de
Comunicaciones/
Educación Ambiental
Figure 9. FUNDAECO’s organizational structure.
5.1.2 Monitoring Methods
All project activities within the Project Area and Project Zone monitored during this reporting period were
consistent with the project activities discussed in the Project Description Document. If any project
activities are to be phased out or incorporated at a later date due to adaptive management, the
monitoring and implementation plans for the REDD+ Project for Caribbean Guatemala will be updated
accordingly.
Each parameter measured will have an associated measurement SOP for each monitoring period,
created by the Director for each sector. If an SOP is adapted from one monitoring period to the next, the
documents shall be versioned and archived and the monitoring report reference the version and title of
the SOP used for that monitoring period. All updates to SOPs shall be approved by the sector director in
the national office. The sector directors are responsible for ensuring that all relevant SOPs are adhered to
by the regional directors and staff.

MONITORING & IMPLEMENTATION REPORT VCS Version 3.6, CCB Standards Second Edition
v3.0 63
5.1.2.1 Climate Monitoring
FUNDAECO quantified the net climate benefit of the REDD+ Project for Caribbean Guatemala through
monitoring according to the methodology prescribed by VM0015 v1.1, including monitoring the required
areas using remote sensing techniques and permanent forest plots installed and maintained in the project
area.
Selected pools included and excluded in the project scenario and a justification for that decision are as
follows:
Carbon Pool Included? Justification/ Explanation of
Choice
Aboveground tree biomass Yes Major carbon pool affected by
project activities.
Aboveground non-tree biomass No May be conservatively excluded
as it expected to decrease under
the baseline scenario.
Belowground biomass Yes Major carbon pool affected by
project activities.
Dead wood No May be conservatively excluded
as it expected to decrease under
the baseline scenario.
Litter Yes Major carbon pool affected by
project activities
Soil organic carbon No May be conservatively excluded
as it expected to decrease under
the baseline scenario.
Wood products Yes Major carbon pool affected by
project activities
Table 15. Selected carbon pools in the project scenario.
5.1.2.1.1 Project Implementation
All climate-related project activities have associated indicators that are monitored at specified
frequencies. Project activities implemented in this monitoring period are consistent with the project
activities outlined in the TOC Matrix (see TOC Activity Matrix v1.14.xlsm) and the Project Description. For
a list of all monitored climate indicators, see TOC Activity Matrix v1.14.xlsm.
5.1.2.1.2 Stocks and Emissions
The project, reference, and leakage area are delineated and monitored for LULC and LULC change using
remote sensing techniques approved per the requirements of VM0015 v1.1 as described in Section 5 of
the Joint VCS-CCB Project Description. Class transitions in all the areas are validated using ground-

MONITORING & IMPLEMENTATION REPORT VCS Version 3.6, CCB Standards Second Edition
v3.0 64
truthing data. Natural disturbances are monitored and areas severely affected re-classified as necessary.
Carbon stocks are measured using field data and updated when required by the methodology.5.1.2.1.2
Data used to analyze deforestation in the project area was all Landsat 8 satellite imagery and followed
Chapter 3A.2.4 of the IPCC 2006 GL AFOLU document. See the table below for a list of all imagery used
in the LULC analysis.
Vector Sensor Resolution Coverage
Acquisition Date
Scene or point identifier
Spatial Spectral (km2) (DD/MM/YY) Path/
Latitude Row/
Longitude
Satellite Landsat 8 OLI 30 11
37,368 04/04/2013 19 49
Satellite Landsat 8 OLI 30 11
37,368 04/12/2013 20 49
Satellite Landsat 8 OLI 30 11
37,368 19/03/2014 19 50
Table 16. Data used for historical LULC analysis
A 2014 LULC map was generated using the procedures described in section 5.3.2 of the Joint VCS and
CCB Project Description. These map products were derived from the imagery sources listed in Table 16
above, and included pre-processing steps such as orthorectification, cloud masking, and radiometric
correction. The imagery was then classified, and an accuracy assessment conducted (see Evaluación de
la precisión 06jul2016 MV .docx and CalculosPrecisión MV junio2016.xlsx).
Pre-processed imagery was used in the classification process. The LULC classes consist of forest land
(very humid and humid forest), annual agriculture, permanent agriculture, pasture, shrubs, wetlands,
urban, other non-forest, and water, which were also considered in the LULC analysis of the 2001-2010
images. Areas classified as no data, cloud, and cloud shadow were masked out for subsequent
processing of map products. For a more detailed description of LULC classification methods, see
Actividad 2.2.2.2 Informe CNCG Q3 FY2014_v2.docx. The accounting of GHG benefits in the project
area only included cloud-free imagery.
The accuracy assessment was conducted on the 2014 LULC map produced by UVG through the allocation of verification points across the reference region. The number of points allocated to reach a 90% accuracy, as required by the VM0015 methodology was determined through the following equation from Gongalton & Green (2009):
Where:
B = the upper percentile (σ/k) x 100 of the Chi squared distribution (x2) with 1 degree of freedom π1 = proportion of the population of the i of K classes that represents the proportion closest to 50% K = number of classes σ = the standard deviation bi = desired precision for class i
The results of the map accuracy assessment are described in more detail in the Evaluación de la
precisión 06jul2016 MV .docx.

MONITORING & IMPLEMENTATION REPORT VCS Version 3.6, CCB Standards Second Edition
v3.0 65
Emissions from the project were quantified using the LULC transitions in the project and leakage areas
from the 2014 mosaic relative to the 2010 benchmark map. See Section 6 for the results of the LULC
analysis from 2010-2014.
5.1.2.1.3 Forest Inventory Methods
No updates to the carbon stock inventory were made during the first monitoring period. Forest inventory
methods to be used in future carbon stock updates are described in section 5 of the Joint VCS and CCB
Project Description and the UVG Field Methodologies (see Metodología en Estimación de Carbono-
Inglé_CEAB-UVG_2010.pdf).
5.1.2.1.4 Leakage
Leakage was monitored according to the VM0015 methodology requirements. Leakage emissions were
calculated based off of the deforestation transitions that happened within the defined leakage belt
between 2010 and 2014. To see how the leakage belt was defined in the ex-post monitoring, see section
6.3.2. Any leakage sources identified as significant in the ex-ante calculations (see Section 5.5 of the
Joint VCS and CCB Project Description), were monitored during this monitoring period. To see all
monitoring results for leakage, please refer to section 6.3 of this report.
5.1.2.2 Community Monitoring
Community impacts were monitored according to the SOPs presented in the document Procedimiento
para el Monitoreo Socioeconomico y Comunitario.docx. Identified indicators were part of the Project
Theory of Change. A report was prepared presenting all impact indicators and monitoring results.
Monitoring was conducted with the input from beneficiaries for the different Project components; forest
owner beneficiaries, productive projects beneficiaries, education beneficiaries, health beneficiaries, and
community participation beneficiaries.
For each beneficiary a permanent tracing was kept. This allowed the quantification of impacts at the end
of the monitoring period, for each component and at the community level. Benefit tracing was done in
three steps: data generation and gathering (using data verifiers); database preparation for each
component; and integrated databases, and database preparation for specific analysis. These steps
allowed the program to track economic and behavioral changes within communities towards more
sustainable and forest-friendly livelihoods.
Results of the community monitoring are publically available, published on the internet and disseminated
to the Forest Owners Assembly and communities inside the project area.
5.1.2.3 Biodiversity Monitoring
Biodiversity impacts were monitored both within the project area and zone. The design of the data and
parameters monitored is such that the project will be able to quantify its impact on biodiversity on a
regional and local level. Both floral and faunal diversity were assessed using the proxy of intact canopy
cover, monitored as part of climate monitoring. While the focus of biodiversity monitoring is on forest
cover and habitat integrity, there are other monitoring activities focusing on avian and amphibian species
as well.

MONITORING & IMPLEMENTATION REPORT VCS Version 3.6, CCB Standards Second Edition
v3.0 66
Avian studies were used to provide FUNDAECO with indicators of wider environmental health or
ecosystem integrity, particularly when such assessments used summarized data from a wide range of
species (Stotz et al. 1996, Bibby 1999, Canterbury et al. 2000, Carignan and Villard 2002, Sutherland et
al. 2004). Ornithological evaluations provide a measure to evaluate, in a quick and precise way, the
ecological characteristics and the conservation status of most terrestrial communities. The periodicity of
avian surveys was on an annual basis, during the months that covers the stop-over of migratory birds in
the region –October to March-. See FUNDAECO_BIRD_MONITORING PROGRAM.pdf.
Amphibians were used as a reporter group to changes habitat or the loss thereof. Because they are so
dependent on the ambient humidity, their geographic ranges, ecological, behavior, and life history it is
strongly influenced by the distribution and abundance of water, usually in the form of rain. In fact, the
abrupt and frequent synchronized playback of some frogs and toads with the first rains is a well-known
natural phenomenon, especially in areas where rainfall is highly seasonal. Amphibians were monitored in
a biannual basis trying to cover the start and the stop of the rainy season.
The procedures for monitoring land cover within the project area are detailed in section 5 of the Joint VCS
and CCB Project Description, and the bird monitoring procedures are detailed in
FUNDAECO_BIRD_MONITORING PROGRAM.pdf. The data and parameters monitored are in section
5.3.3.
Results of the surveys were used in an adaptive framework to evaluate the effectiveness of the project
activities in providing a net biodiversity benefit, and the metrics and project activities modified as needed
by the sector director.
Results of the biodiversity monitoring were made publically available, published on the internet and
disseminated to the Forest Owners Assembly and communities inside the project area, as well as other
stakeholders such as MARN and CONAP.
5.1.3 Data Management
Data produced by FUNDAECO for all project related activities are stored in paper and digital formats
within the regional and national offices. Copies of the data collected at the regional level are stored in
digital format at the national office for safekeeping.
5.1.4 Reporting Methods
Data were collected and analyzed on a regional level, and then is aggregated and reported for the project
as a whole. The regional analyses are helpful in informing the specific region’s implementation teams on
the progress of project activities being implemented in their region. This information was aggregated with
information from all other regional offices to update this monitoring report and provide a project-specific
overview of progress.
FUNDAECO tracked both the rate of deforestation and changes in LULC every monitoring period. Rates
of deforestation in the project area and leakage belt were measured at the end of the first monitoring
period. The project baseline deforestation rate will be reassessed and submitted every ten years for third
party verification. FUNDAECO will conduct an annual internal review of deforestation rates to produce
data-driven models of deforestation in relation to project activities. The models will allow FUNDAECO to
better understand which project activities and locations have been effective at reducing deforestation
rates. Additionally, these reviews will help FUNDAECO better understand which areas need greater focus
and resources to further reduce deforestation.

MONITORING & IMPLEMENTATION REPORT VCS Version 3.6, CCB Standards Second Edition
v3.0 67
A GHG report was prepared this monitoring period, intended to summarize evidence of the net project
benefit for the selected VCS/CBBA auditor. Results of monitoring were communicated in an appropriate
language and format to the communities and stakeholders in the project zone.
5.1.5 Quality Assurance and Control
The directors for community, biodiversity and climate conducted an internal audit of approximately 10% of
the measurements for data and parameters monitored, using a risk-based assessment for selection. If
there was a deviation of more than 5% in the measurement and re-measurement of the parameter, the
deviation was investigated and resolved. When updating data stored electronically, the files were
versioned.
The sector directors are responsible for creation and adaption of QA/QC protocols as required, and for
any technical direction of the regional directors or teams.
The FUNDAECO field teams minimized error by working as teams to check the identification of tree
species and diameter measurements, and to review community and biodiversity data collected. These
teams verified each other’s readings. Managers for each team verified a subset of the data recorded
using risk-based assessment. The regional directors also sampled a subset of data recorded on a
periodic basis, using a risk-based assessment.
To reduce and eliminate transcriptional error, a subset of spreadsheets was proofed by re-reading the
field notebooks and comparing it to the data that has been entered.
All data were reported to project proponents and local stakeholders and any discrepancies or
disagreements were rectified by explanation or joint visitation of activities in question. All publically
available satellite data used in monitoring, validation, verification and certification is archived and
available to auditors.
5.2 Data and Parameters Available at Validation (CL4)
Data Unit / Parameter: %LKB
Data unit: %
Description: Percentage of the overlapping leakage belts area to
be assigned to project, A, B…..N
Source of data: calculated , Equation 2.a,2.b,2.n
Value applied: N/A
Justification of choice of data or description of
measurement methods and procedures applied:
Any Comment: N/A
Data Unit / Parameter: A
Data unit: ha
Description: Area of error due to observed change predicted as
persistence
Source of data: calculated , Equation 9
Value applied: N/A

MONITORING & IMPLEMENTATION REPORT VCS Version 3.6, CCB Standards Second Edition
v3.0 68
Justification of choice of data or description of
measurement methods and procedures applied:
Any Comment: N/A
Data Unit / Parameter: a
Data unit: ha yr-1
Description: Estimated intercept of the regression line
Source of data: calculated , Equation 4a,
Value applied: N/A
Justification of choice of data or description of
measurement methods and procedures applied:
Any Comment: N/A
Data Unit / Parameter: a1 and a2
Data unit: ha
Description: sample plot areas
Source of data: calculated , Equation A3-5
Value applied: N/A
Justification of choice of data or description of
measurement methods and procedures applied:
Any Comment: N/A
Data Unit / Parameter: Aaveragei
Data unit: ha
Description: Area of “average” forest land suitable for
conversion to non-forest land within stratum
Source of data: calculated , Equation 6
Value applied: N/A
Justification of choice of data or description of
measurement methods and procedures applied:
Any Comment: N/A
Data Unit / Parameter: ABSLLK
Data unit: ha
Description: Cumulative area of baseline deforestation within
the leakage belt at year t
Source of data: calculated , Equation Table 9c, Table 11c, Table

MONITORING & IMPLEMENTATION REPORT VCS Version 3.6, CCB Standards Second Edition
v3.0 69
13c, Table 14c, Table 19c
Value applied: N/A
Justification of choice of data or description of
measurement methods and procedures applied:
Any Comment: N/A
Data Unit / Parameter: ABSLLKct,t
Data unit: ha
Description: Area of category ct deforested at time t within the
leakage belt in the baseline case
Source of data: , Equation measured or estimated from literature
Value applied: N/A
Justification of choice of data or description of
measurement methods and procedures applied:
Any Comment: N/A
Data Unit / Parameter: ABSLLKfcl,t
Data unit: ha
Description: Area of final (post-deforestation) forest class fcl
deforested at time t within the leakage belt in the
baseline case
Source of data: , Equation calculated
Value applied: N/A
Justification of choice of data or description of
measurement methods and procedures applied:
Any Comment: N/A
Data Unit / Parameter: ABSLLKi,t
Data unit: ha
Description: Annual area of baseline deforestation in stratum i
within the leakage belt at year t;
Source of data: calculated , Equation Table 9.c
Value applied: N/A
Justification of choice of data or description of
measurement methods and procedures applied:
Any Comment: N/A
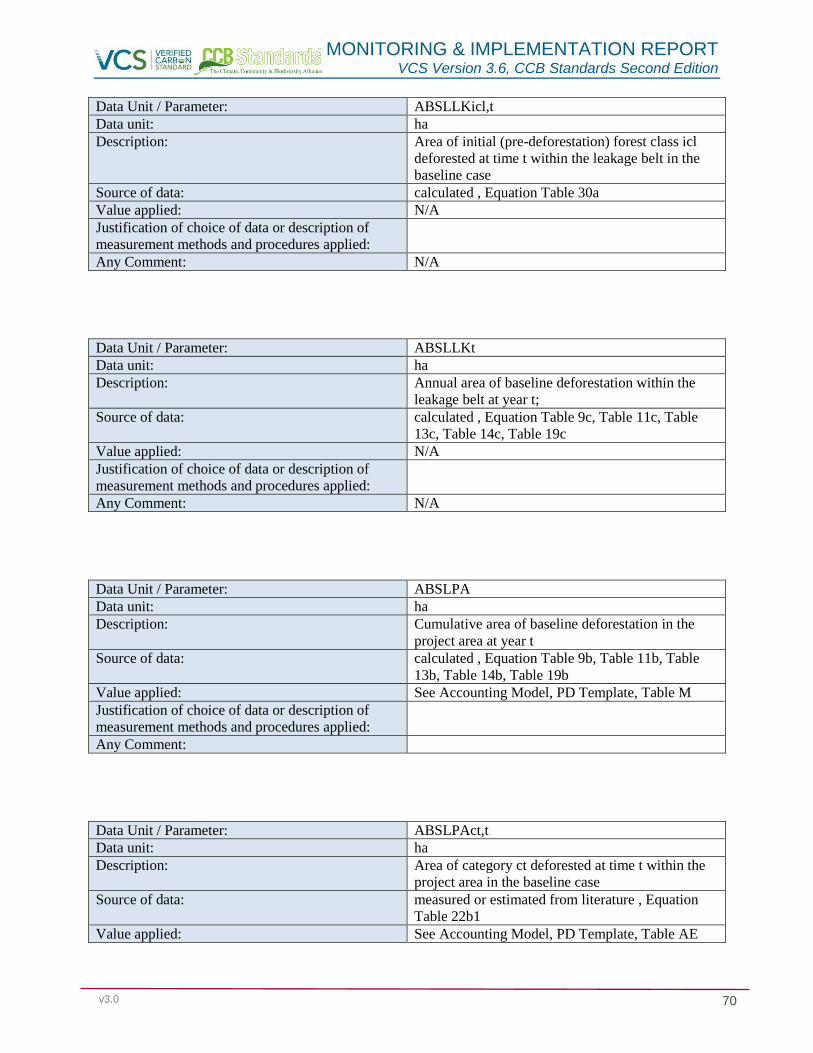
MONITORING & IMPLEMENTATION REPORT VCS Version 3.6, CCB Standards Second Edition
v3.0 70
Data Unit / Parameter: ABSLLKicl,t
Data unit: ha
Description: Area of initial (pre-deforestation) forest class icl
deforested at time t within the leakage belt in the
baseline case
Source of data: calculated , Equation Table 30a
Value applied: N/A
Justification of choice of data or description of
measurement methods and procedures applied:
Any Comment: N/A
Data Unit / Parameter: ABSLLKt
Data unit: ha
Description: Annual area of baseline deforestation within the
leakage belt at year t;
Source of data: calculated , Equation Table 9c, Table 11c, Table
13c, Table 14c, Table 19c
Value applied: N/A
Justification of choice of data or description of
measurement methods and procedures applied:
Any Comment: N/A
Data Unit / Parameter: ABSLPA
Data unit: ha
Description: Cumulative area of baseline deforestation in the
project area at year t
Source of data: calculated , Equation Table 9b, Table 11b, Table
13b, Table 14b, Table 19b
Value applied: See Accounting Model, PD Template, Table M
Justification of choice of data or description of
measurement methods and procedures applied:
Any Comment:
Data Unit / Parameter: ABSLPAct,t
Data unit: ha
Description: Area of category ct deforested at time t within the
project area in the baseline case
Source of data: measured or estimated from literature , Equation
Table 22b1
Value applied: See Accounting Model, PD Template, Table AE

MONITORING & IMPLEMENTATION REPORT VCS Version 3.6, CCB Standards Second Edition
v3.0 71
Justification of choice of data or description of
measurement methods and procedures applied:
Any Comment:
Data Unit / Parameter: ABSLPAct,t
Data unit: ha
Description: Area of category ct deforested at time t within the
project area in the baseline case
Source of data: calculated , Equation Table 22.b.1
Value applied: See Accounting Model, PD Template, Table AE
Justification of choice of data or description of
measurement methods and procedures applied:
Any Comment:
Data Unit / Parameter: ABSLPAi,t
Data unit: ha
Description: Annual area of baseline deforestation in stratum i
within the project area at year t;
Source of data: calculated , Equation Table 9b
Value applied: See Accounting Model, PD Template, Table I
Justification of choice of data or description of
measurement methods and procedures applied:
Any Comment:
Data Unit / Parameter: ABSLPAicl,t
Data unit: ha
Description: Area of initial (pre-deforestation) forest class icl
deforested at time t within the project area in the
baseline case
Source of data: calculated , Equation 10
Value applied: N/A
Justification of choice of data or description of
measurement methods and procedures applied:
Any Comment: N/A
Data Unit / Parameter: ABSLPAt
Data unit: ha

MONITORING & IMPLEMENTATION REPORT VCS Version 3.6, CCB Standards Second Edition
v3.0 72
Description: Annual area of baseline deforestation in the project
area at year t
Source of data: calculated , Equation Table 9b, Table 11b, Table
13b, Table 14b, Table 19b
Value applied: See Accounting Model, PD Template, Table I
Justification of choice of data or description of
measurement methods and procedures applied:
Any Comment:
Data Unit / Parameter: ABSLPAz,t
Data unit: ha
Description: Area of the zone z “deforested” at time t within the
project area in the baseline case; ha
Source of data: calculated , Equation 10
Value applied: N/A
Justification of choice of data or description of
measurement methods and procedures applied:
Any Comment: N/A
Data Unit / Parameter: ABSLRR
Data unit: ha
Description: cumulative area of baseline deforestation in the
reference region at year t
Source of data: calculated , Equation Table 9.a, Table 11a, Table
13a, Table 14a, Table 19a
Value applied: See Accounting Model, PD Template, Table L
Justification of choice of data or description of
measurement methods and procedures applied:
Any Comment:
Data Unit / Parameter: ABSLRRct,t
Data unit: ha
Description: Area of category ct deforested at time t within the
reference region in the baseline case
Source of data: measured or estimated from literature , Equation
Table 22.a.1
Value applied: N/A
Justification of choice of data or description of
measurement methods and procedures applied:
Any Comment: N/A
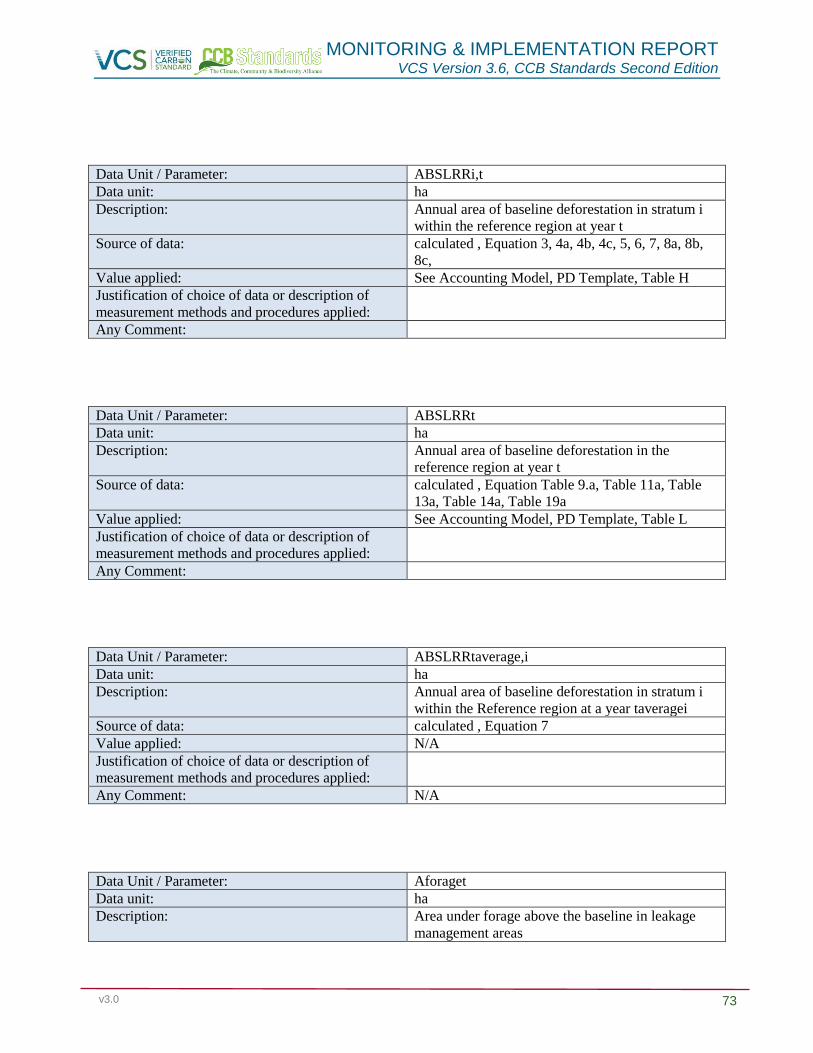
MONITORING & IMPLEMENTATION REPORT VCS Version 3.6, CCB Standards Second Edition
v3.0 73
Data Unit / Parameter: ABSLRRi,t
Data unit: ha
Description: Annual area of baseline deforestation in stratum i
within the reference region at year t
Source of data: calculated , Equation 3, 4a, 4b, 4c, 5, 6, 7, 8a, 8b,
8c,
Value applied: See Accounting Model, PD Template, Table H
Justification of choice of data or description of
measurement methods and procedures applied:
Any Comment:
Data Unit / Parameter: ABSLRRt
Data unit: ha
Description: Annual area of baseline deforestation in the
reference region at year t
Source of data: calculated , Equation Table 9.a, Table 11a, Table
13a, Table 14a, Table 19a
Value applied: See Accounting Model, PD Template, Table L
Justification of choice of data or description of
measurement methods and procedures applied:
Any Comment:
Data Unit / Parameter: ABSLRRtaverage,i
Data unit: ha
Description: Annual area of baseline deforestation in stratum i
within the Reference region at a year taveragei
Source of data: calculated , Equation 7
Value applied: N/A
Justification of choice of data or description of
measurement methods and procedures applied:
Any Comment: N/A
Data Unit / Parameter: Aforaget
Data unit: ha
Description: Area under forage above the baseline in leakage
management areas

MONITORING & IMPLEMENTATION REPORT VCS Version 3.6, CCB Standards Second Edition
v3.0 74
Source of data: calculated ex ante, measured ex post , Equation
Table 32
Value applied: N/A
Justification of choice of data or description of
measurement methods and procedures applied:
Any Comment: N/A
Data Unit / Parameter: Aoptimali
Data unit: ha
Description: Area of “optimal” forest land suitable for
conversion to non-forest land within stratum i
Source of data: calculated , Equation 5
Value applied: N/A
Justification of choice of data or description of
measurement methods and procedures applied:
Any Comment: N/A
Data Unit / Parameter: AP
Data unit: m2
Description: Plot area
Source of data: measured or estimated from literature , Equation
A3-13
Value applied: See section 5.3.5.1 of the Project Description
Justification of choice of data or description of
measurement methods and procedures applied:
Any Comment: Varies depending on carbon pool measured and
LULC type
Data Unit / Parameter: APDPAicl,t
Data unit: ha
Description: Areas of planned deforestation in forest class icl at
year t in the project area
Source of data: measured or estimated from literature , Equation
Table 25a
Value applied: N/A
Justification of choice of data or description of
measurement methods and procedures applied:
Any Comment: N/A

MONITORING & IMPLEMENTATION REPORT VCS Version 3.6, CCB Standards Second Edition
v3.0 75
Data Unit / Parameter: APFPA icl,t
Data unit: ha
Description: Annual area of planned fuel-wood and charcoal
activities in forest class icl at year t in the project
area
Source of data: calculated ex ante, measured ex post , Equation
Table 25, Table 26c
Value applied: N/A
Justification of choice of data or description of
measurement methods and procedures applied:
Any Comment: N/A
Data Unit / Parameter: APLPAicl,t
Data unit: ha
Description: Areas of planned logging activities in forest class
icl at year t in the project area
Source of data: calculated ex ante, measured ex post , Equation
Table 25b, Table 26b
Value applied: N/A
Justification of choice of data or description of
measurement methods and procedures applied:
Any Comment: N/A
Data Unit / Parameter: APNiPAicl,t
Data unit: ha
Description: Annual area of forest class icl with increasing
carbon stock without harvest at year t in the project
area
Source of data: calculated ex ante, measured ex post , Equation
Table 26a
Value applied: N/A
Justification of choice of data or description of
measurement methods and procedures applied:
Any Comment: N/A
Data Unit / Parameter: APSLKfcl,t
Data unit: ha
Description: Annual area of class fcl with decreasing carbon

MONITORING & IMPLEMENTATION REPORT VCS Version 3.6, CCB Standards Second Edition
v3.0 76
stock in leakage management areas in the project
case at year t
Source of data: measured ex post , Equation Table 30b
Value applied: N/A
Justification of choice of data or description of
measurement methods and procedures applied:
Any Comment: N/A
Data Unit / Parameter: ARRi
Data unit: ha
Description: Total forest area in stratum i within the reference
region at the project start date
Source of data: measured or estimated from literature , Equation
4.b, 8.c
Value applied: N/A
Justification of choice of data or description of
measurement methods and procedures applied:
Any Comment: N/A
Data Unit / Parameter: ARRi,t-1
Data unit: ha
Description: Area with forest cover in stratum i within the
reference region a year t-1
Source of data: calculated , Equation 3
Value applied: N/A
Justification of choice of data or description of
measurement methods and procedures applied:
Any Comment: N/A
Data Unit / Parameter: AUFPAicl,t
Data unit: ha
Description: Areas affected by forest fires in class icl in which
carbon stock recovery occurs at year t
Source of data: measured ex post , Equation Table 25e, Table 26e
Value applied: N/A
Justification of choice of data or description of
measurement methods and procedures applied:
Any Comment: N/A

MONITORING & IMPLEMENTATION REPORT VCS Version 3.6, CCB Standards Second Edition
v3.0 77
Data Unit / Parameter: B
Data unit: ha
Description: Area correct due to observed change predicted as
change
Source of data: measured or estimated from literature , Equation 9
Value applied: N/A
Justification of choice of data or description of
measurement methods and procedures applied:
Any Comment: N/A
Data Unit / Parameter: b
Data unit: dimensionless
Description: Estimated coefficient of the time variable (or slope
of the linear regression)
Source of data: calculated , Equation 4.a, 7, 8.a, 8.b
Value applied: N/A
Justification of choice of data or description of
measurement methods and procedures applied:
Any Comment: N/A
Data Unit / Parameter: BCEF
Data unit: dimensionless
Description: Biomass conversion and expansion factor for
conversion of merchantable volume to total
aboveground tree biomass
Source of data: measured or estimated from literature , Equation
A3-9, A3-36
Value applied: N/A
Justification of choice of data or description of
measurement methods and procedures applied:
Any Comment: N/A
Data Unit / Parameter: BEFpl
Data unit: dimensionless
Description: Biomass expansion factor for converting volumes
of extracted round wood to total above-ground
biomass (including bark), applicable to tree tr, in
plot pl
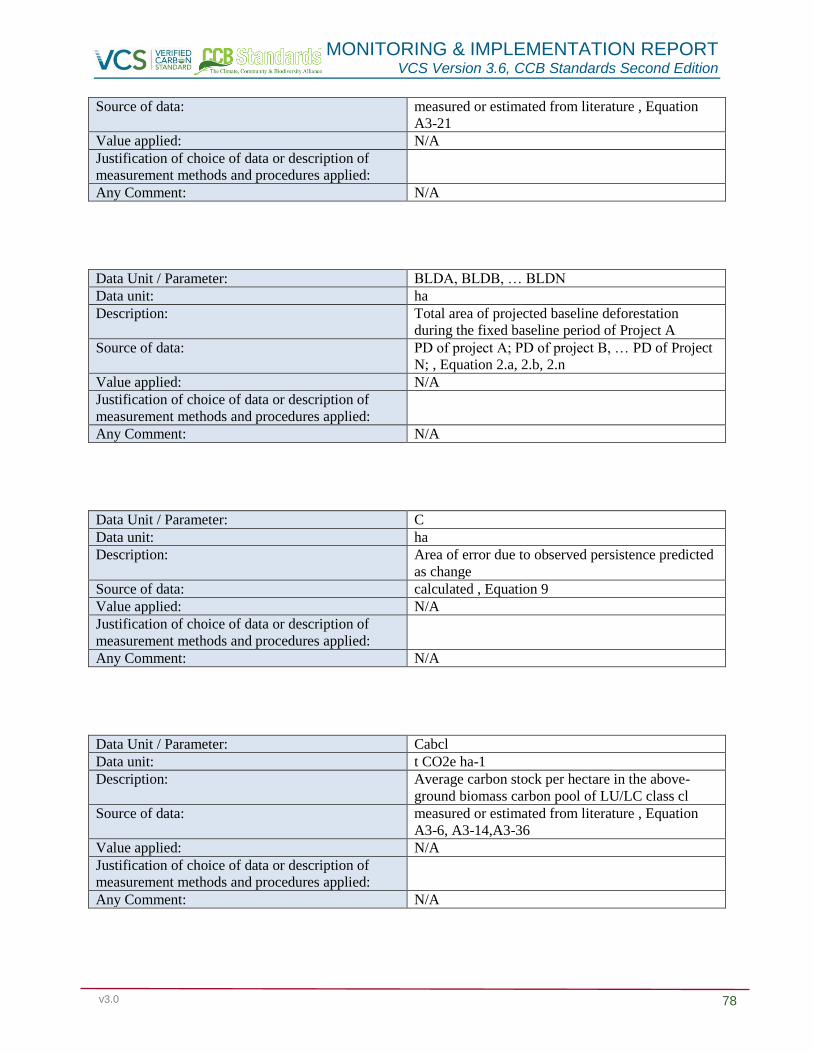
MONITORING & IMPLEMENTATION REPORT VCS Version 3.6, CCB Standards Second Edition
v3.0 78
Source of data: measured or estimated from literature , Equation
A3-21
Value applied: N/A
Justification of choice of data or description of
measurement methods and procedures applied:
Any Comment: N/A
Data Unit / Parameter: BLDA, BLDB, … BLDN
Data unit: ha
Description: Total area of projected baseline deforestation
during the fixed baseline period of Project A
Source of data: PD of project A; PD of project B, … PD of Project
N; , Equation 2.a, 2.b, 2.n
Value applied: N/A
Justification of choice of data or description of
measurement methods and procedures applied:
Any Comment: N/A
Data Unit / Parameter: C
Data unit: ha
Description: Area of error due to observed persistence predicted
as change
Source of data: calculated , Equation 9
Value applied: N/A
Justification of choice of data or description of
measurement methods and procedures applied:
Any Comment: N/A
Data Unit / Parameter: Cabcl
Data unit: t CO2e ha-1
Description: Average carbon stock per hectare in the above-
ground biomass carbon pool of LU/LC class cl
Source of data: measured or estimated from literature , Equation
A3-6, A3-14,A3-36
Value applied: N/A
Justification of choice of data or description of
measurement methods and procedures applied:
Any Comment: N/A

MONITORING & IMPLEMENTATION REPORT VCS Version 3.6, CCB Standards Second Edition
v3.0 79
Data Unit / Parameter: Cabfcl
Data unit: t CO2e ha-1
Description: Average carbon stock per hectare in the above-
ground biomass carbon pool of final post-
deforestation class fcl
Source of data: measured or estimated from literature , Equation
Table 16, Table 17
Value applied: See Accounting Model, PD Template, Tables X, Y,
Z, AA, AB, AC, AD
Justification of choice of data or description of
measurement methods and procedures applied:
Any Comment:
Data Unit / Parameter: Cabicl
Data unit: t CO2e ha-1
Description: Average carbon stock per hectare in the above-
ground biomass carbon pool of initial forest class
icl
Source of data: measured or estimated from literature , Equation
Table 15a, A3-38
Value applied: See Accounting Model, PD Template, Table V
Justification of choice of data or description of
measurement methods and procedures applied:
Any Comment:
Data Unit / Parameter: Cabntcl
Data unit: t CO2-e ha-1
Description: Average carbon stock per hectare in the above-
ground non-tree biomass carbon pool of LU/LC
class cl
Source of data: measured or estimated from literature , Equation
A3-7, A3-24
Value applied: N/A
Justification of choice of data or description of
measurement methods and procedures applied:
Any Comment: N/A
Data Unit / Parameter: Cabtcl

MONITORING & IMPLEMENTATION REPORT VCS Version 3.6, CCB Standards Second Edition
v3.0 80
Data unit: t CO2-e ha-1
Description: Average carbon stock per hectare in the above-
ground tree biomass carbon pool of LU/LC class cl
Source of data: measured or estimated from literature , Equation
A3-7
Value applied: N/A
Justification of choice of data or description of
measurement methods and procedures applied:
Any Comment: N/A
Data Unit / Parameter: Cabz
Data unit: t CO2-e ha-1
Description: Average carbon stock per hectare in the above-
ground biomass carbon pool per zone z
Source of data: measured or estimated from literature , Equation
Table 17
Value applied: N/A
Justification of choice of data or description of
measurement methods and procedures applied:
Any Comment: N/A
Data Unit / Parameter: Cacl
Data unit: tCO2-eha-1
Description: Average carbon stock per hectare in above-ground
biomass in LU/LC class cl
Source of data: , Equation A3-14
Value applied: N/A
Justification of choice of data or description of
measurement methods and procedures applied:
Any Comment: N/A
Data Unit / Parameter: Cbbcl
Data unit: t CO2-e ha-1
Description: Average carbon stock per hectare below-ground
biomass carbon pool of LU/LC class cl
Source of data: measured or estimated from literature , Equation
A3-6, A3-17
Value applied: N/A
Justification of choice of data or description of
measurement methods and procedures applied:

MONITORING & IMPLEMENTATION REPORT VCS Version 3.6, CCB Standards Second Edition
v3.0 81
Any Comment: N/A
Data Unit / Parameter: Cbbfcl
Data unit: t CO2-e ha-1
Description: Average carbon stock per hectare below-ground
biomass carbon pool of final post-deforestation
class fcl
Source of data: measured or estimated from literature , Equation
Table 16, Table 17
Value applied: See Accounting Model, PD Template, Tables X, Y,
Z, AA, AB, AC, AD
Justification of choice of data or description of
measurement methods and procedures applied:
Any Comment:
Data Unit / Parameter: Cbbicl
Data unit: t CO2-e ha-1
Description: Average carbon stock per hectare below-ground
biomass carbon pool of initial forest class icl
Source of data: measured or estimated from literature , Equation
Table 15
Value applied: See Accounting Model, PD Template, Table V
Justification of choice of data or description of
measurement methods and procedures applied:
Any Comment:
Data Unit / Parameter: Cbbntcl
Data unit: t CO2-e ha-1
Description: Average carbon stock per hectare below-ground
non-tree biomass carbon pool of LU/LC class cl
Source of data: measured or estimated from literature , Equation
A3-8
Value applied: N/A
Justification of choice of data or description of
measurement methods and procedures applied:
Any Comment: N/A

MONITORING & IMPLEMENTATION REPORT VCS Version 3.6, CCB Standards Second Edition
v3.0 82
Data Unit / Parameter: Cbbtcl
Data unit: t CO2-e ha-1
Description: Average carbon stock per hectare below-ground
tree biomass carbon pool of LU/LC class cl
Source of data: measured or estimated from literature , Equation
A3-8
Value applied: N/A
Justification of choice of data or description of
measurement methods and procedures applied:
Any Comment: N/A
Data Unit / Parameter: Cbbz
Data unit: t CO2-e ha-1
Description: Average carbon stock per hectare below-ground
tree biomass carbon pool per zone z
Source of data: measured or estimated from literature , Equation
Table 17
Value applied: N/A
Justification of choice of data or description of
measurement methods and procedures applied:
Any Comment: N/A
Data Unit / Parameter: Cdwcl
Data unit: t CO2-e ha-1
Description: Average carbon stock per hectare in the in the dead
wood biomass carbon pool of LU/LC class cl
Source of data: measured or estimated from literature , Equation
A3-6, A3-25
Value applied: N/A
Justification of choice of data or description of
measurement methods and procedures applied:
Any Comment: N/A
Data Unit / Parameter: Cdwfcl
Data unit: t CO2-e ha-1
Description: Average carbon stock per hectare in the in the dead
wood biomass carbon pool of final post-
deforestation class fcl
Source of data: measured or estimated from literature , Equation
Table 16, Table 17
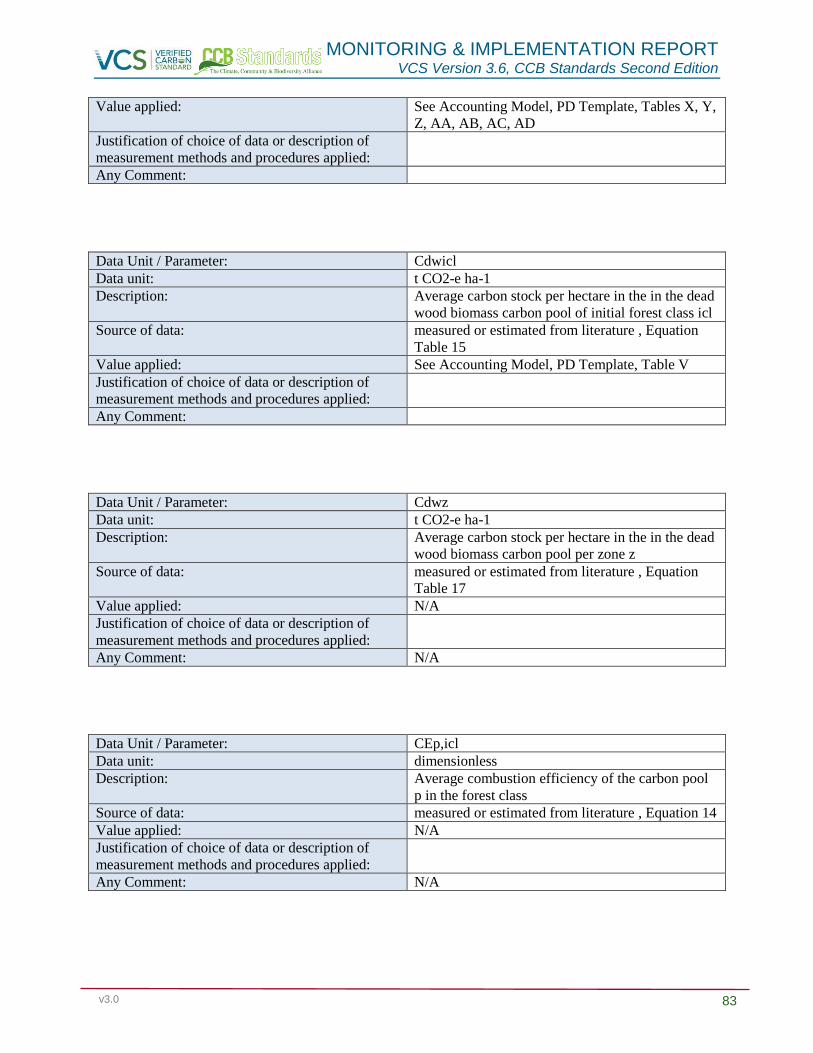
MONITORING & IMPLEMENTATION REPORT VCS Version 3.6, CCB Standards Second Edition
v3.0 83
Value applied: See Accounting Model, PD Template, Tables X, Y,
Z, AA, AB, AC, AD
Justification of choice of data or description of
measurement methods and procedures applied:
Any Comment:
Data Unit / Parameter: Cdwicl
Data unit: t CO2-e ha-1
Description: Average carbon stock per hectare in the in the dead
wood biomass carbon pool of initial forest class icl
Source of data: measured or estimated from literature , Equation
Table 15
Value applied: See Accounting Model, PD Template, Table V
Justification of choice of data or description of
measurement methods and procedures applied:
Any Comment:
Data Unit / Parameter: Cdwz
Data unit: t CO2-e ha-1
Description: Average carbon stock per hectare in the in the dead
wood biomass carbon pool per zone z
Source of data: measured or estimated from literature , Equation
Table 17
Value applied: N/A
Justification of choice of data or description of
measurement methods and procedures applied:
Any Comment: N/A
Data Unit / Parameter: CEp,icl
Data unit: dimensionless
Description: Average combustion efficiency of the carbon pool
p in the forest class
Source of data: measured or estimated from literature , Equation 14
Value applied: N/A
Justification of choice of data or description of
measurement methods and procedures applied:
Any Comment: N/A

MONITORING & IMPLEMENTATION REPORT VCS Version 3.6, CCB Standards Second Edition
v3.0 84
Data Unit / Parameter: CFdc
Data unit: tonnes C (tonne d. m.)-1
Description: Carbon fraction of the density class dc
Source of data: measured or estimated from literature , Equation
A3-30
Value applied: N/A
Justification of choice of data or description of
measurement methods and procedures applied:
Any Comment: N/A
Data Unit / Parameter: CFj
Data unit: tonnes C (tonne d. m.) -1
Description: Carbon fraction for tree tr, of species, group of
species or forest type j
Source of data: measured or estimated from literature , Equation
A3-11, A3-21, A3-24
Value applied: N/A
Justification of choice of data or description of
measurement methods and procedures applied:
Any Comment: N/A
Data Unit / Parameter: CFpl
Data unit: tonnes C (tonne d. m.) -1
Description: Carbon fraction of sample pl
Source of data: calculated , Equation A3-24
Value applied: N/A
Justification of choice of data or description of
measurement methods and procedures applied:
Any Comment: N/A
Data Unit / Parameter: Ci
Data unit:
Description: Cost to select and measure a plot of the LU/LC
class cl
Source of data: estimated , Equation A3-3; A3-4
Value applied: N/A
Justification of choice of data or description of
measurement methods and procedures applied:
Any Comment: N/A

MONITORING & IMPLEMENTATION REPORT VCS Version 3.6, CCB Standards Second Edition
v3.0 85
Data Unit / Parameter: cl
Data unit: dimensionless
Description: 1, 2, 3 … Cl LU/LC classes
Source of data: measured or estimated from literature , Equation
A3-3
Value applied: N/A
Justification of choice of data or description of
measurement methods and procedures applied:
Any Comment: N/A
Data Unit / Parameter: Clcl
Data unit: t CO2-e ha-1
Description: Average carbon stock per hectare in the litter
carbon pool of LU/LC class cl
Source of data: measured or estimated from literature , Equation
A3-6
Value applied: N/A
Justification of choice of data or description of
measurement methods and procedures applied:
Any Comment: N/A
Data Unit / Parameter: Cldwcl
Data unit: t CO2-e
Description: Average carbon stock per hectare in the lying dead
wood carbon pool of the LU/LC class cl
Source of data: measured or estimated from literature , Equation
A3-25, A3-30
Value applied: N/A
Justification of choice of data or description of
measurement methods and procedures applied:
Any Comment: N/A
Data Unit / Parameter: Cldwfcl
Data unit: t CO2-e
Description: Average carbon stock per hectare in the lying dead
wood carbon pool of final post-deforestation class
fcl
Source of data: measured or estimated from literature

MONITORING & IMPLEMENTATION REPORT VCS Version 3.6, CCB Standards Second Edition
v3.0 86
Value applied: N/A
Justification of choice of data or description of
measurement methods and procedures applied:
Any Comment: N/A
Data Unit / Parameter: Cldwicl
Data unit: t CO2-e
Description: Average carbon stock per hectare in the lying dead
wood carbon pool of initial forest class icl
Source of data: measured or estimated from literature
Value applied: N/A
Justification of choice of data or description of
measurement methods and procedures applied:
Any Comment: N/A
Data Unit / Parameter: Clfcl
Data unit: t CO2-e ha-1
Description: Average carbon stock per hectare in the litter
carbon pool of LU/LC class fcl
Source of data: measured or estimated from literature , Equation
Table 16, Table 17
Value applied: See Accounting Model, PD Template, Tables X, Y,
Z, AA, AB, AC, AD
Justification of choice of data or description of
measurement methods and procedures applied:
Any Comment:
Data Unit / Parameter: Clicl
Data unit: t CO2-e ha-1
Description: Average carbon stock per hectare in the litter
carbon pool of LU/LC class icl
Source of data: measured or estimated from literature , Equation
Table 15
Value applied: See Accounting Model, PD Template, Table V
Justification of choice of data or description of
measurement methods and procedures applied:
Any Comment:

MONITORING & IMPLEMENTATION REPORT VCS Version 3.6, CCB Standards Second Edition
v3.0 87
Data Unit / Parameter: Clz
Data unit: t CO2-e ha-1
Description: Average carbon stock per hectare in the litter
carbon pool per zone z
Source of data: measured or estimated from literature , Equation
Table 17
Value applied: N/A
Justification of choice of data or description of
measurement methods and procedures applied:
Any Comment: N/A
Data Unit / Parameter: Cp
Data unit: t CO2-e ha-1
Description: Average carbon stock per hectare in the carbon
pool p
Source of data: calculated , Equation Table 7b
Value applied: N/A
Justification of choice of data or description of
measurement methods and procedures applied:
Any Comment: N/A
Data Unit / Parameter: Cp,icl,t
Data unit: t CO2-e ha-1
Description: Average carbon stock per hectare in the carbon
pool p burnt at year t in the forest class icl;
Source of data: calculated , Equation 14
Value applied: N/A
Justification of choice of data or description of
measurement methods and procedures applied:
Any Comment: N/A
Data Unit / Parameter: Csdwcl
Data unit: t CO2-e ha-1
Description: Average carbon stock per hectare in the standing
dead wood carbon pool of the LU/LC class cl
Source of data: measured or estimated from literature , Equation
A3-25
Value applied: N/A
Justification of choice of data or description of
measurement methods and procedures applied:
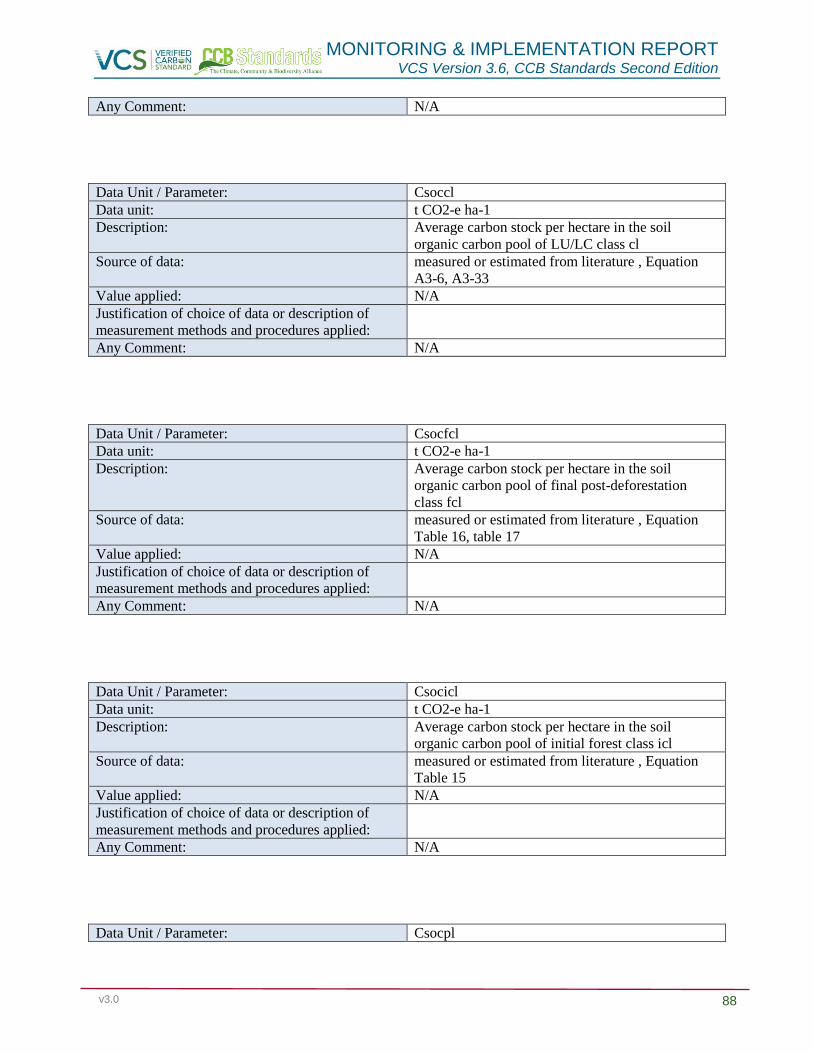
MONITORING & IMPLEMENTATION REPORT VCS Version 3.6, CCB Standards Second Edition
v3.0 88
Any Comment: N/A
Data Unit / Parameter: Csoccl
Data unit: t CO2-e ha-1
Description: Average carbon stock per hectare in the soil
organic carbon pool of LU/LC class cl
Source of data: measured or estimated from literature , Equation
A3-6, A3-33
Value applied: N/A
Justification of choice of data or description of
measurement methods and procedures applied:
Any Comment: N/A
Data Unit / Parameter: Csocfcl
Data unit: t CO2-e ha-1
Description: Average carbon stock per hectare in the soil
organic carbon pool of final post-deforestation
class fcl
Source of data: measured or estimated from literature , Equation
Table 16, table 17
Value applied: N/A
Justification of choice of data or description of
measurement methods and procedures applied:
Any Comment: N/A
Data Unit / Parameter: Csocicl
Data unit: t CO2-e ha-1
Description: Average carbon stock per hectare in the soil
organic carbon pool of initial forest class icl
Source of data: measured or estimated from literature , Equation
Table 15
Value applied: N/A
Justification of choice of data or description of
measurement methods and procedures applied:
Any Comment: N/A
Data Unit / Parameter: Csocpl
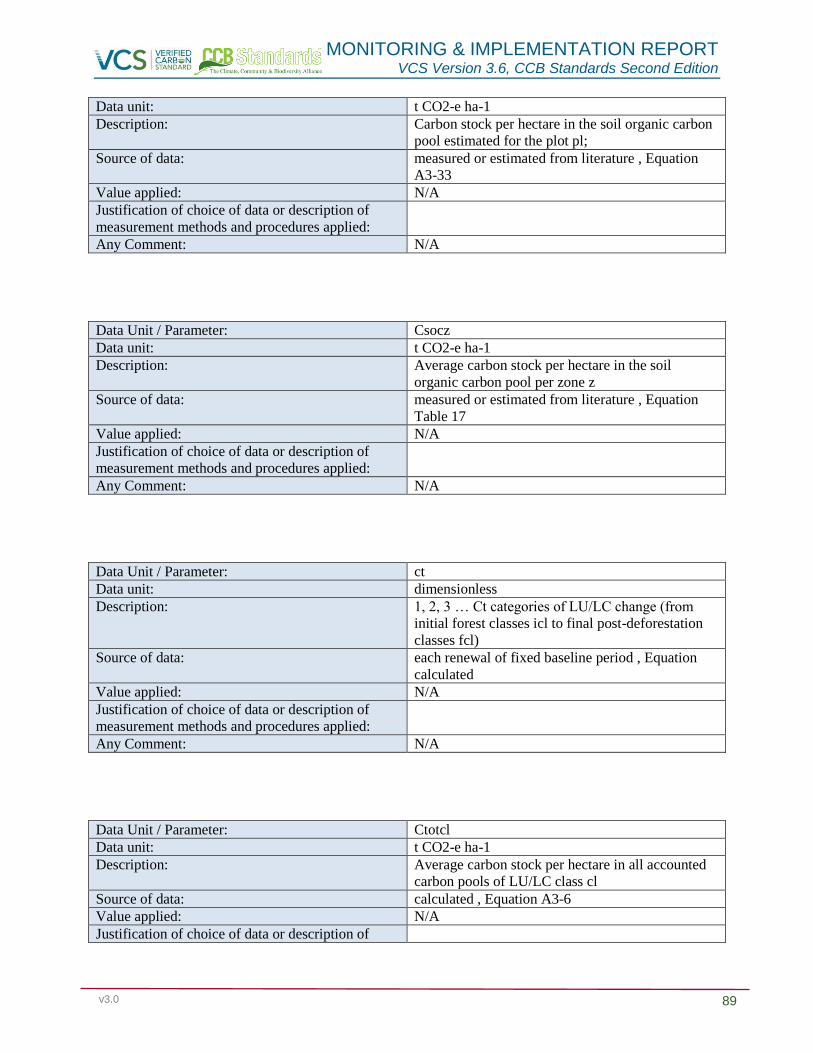
MONITORING & IMPLEMENTATION REPORT VCS Version 3.6, CCB Standards Second Edition
v3.0 89
Data unit: t CO2-e ha-1
Description: Carbon stock per hectare in the soil organic carbon
pool estimated for the plot pl;
Source of data: measured or estimated from literature , Equation
A3-33
Value applied: N/A
Justification of choice of data or description of
measurement methods and procedures applied:
Any Comment: N/A
Data Unit / Parameter: Csocz
Data unit: t CO2-e ha-1
Description: Average carbon stock per hectare in the soil
organic carbon pool per zone z
Source of data: measured or estimated from literature , Equation
Table 17
Value applied: N/A
Justification of choice of data or description of
measurement methods and procedures applied:
Any Comment: N/A
Data Unit / Parameter: ct
Data unit: dimensionless
Description: 1, 2, 3 … Ct categories of LU/LC change (from
initial forest classes icl to final post-deforestation
classes fcl)
Source of data: each renewal of fixed baseline period , Equation
calculated
Value applied: N/A
Justification of choice of data or description of
measurement methods and procedures applied:
Any Comment: N/A
Data Unit / Parameter: Ctotcl
Data unit: t CO2-e ha-1
Description: Average carbon stock per hectare in all accounted
carbon pools of LU/LC class cl
Source of data: calculated , Equation A3-6
Value applied: N/A
Justification of choice of data or description of
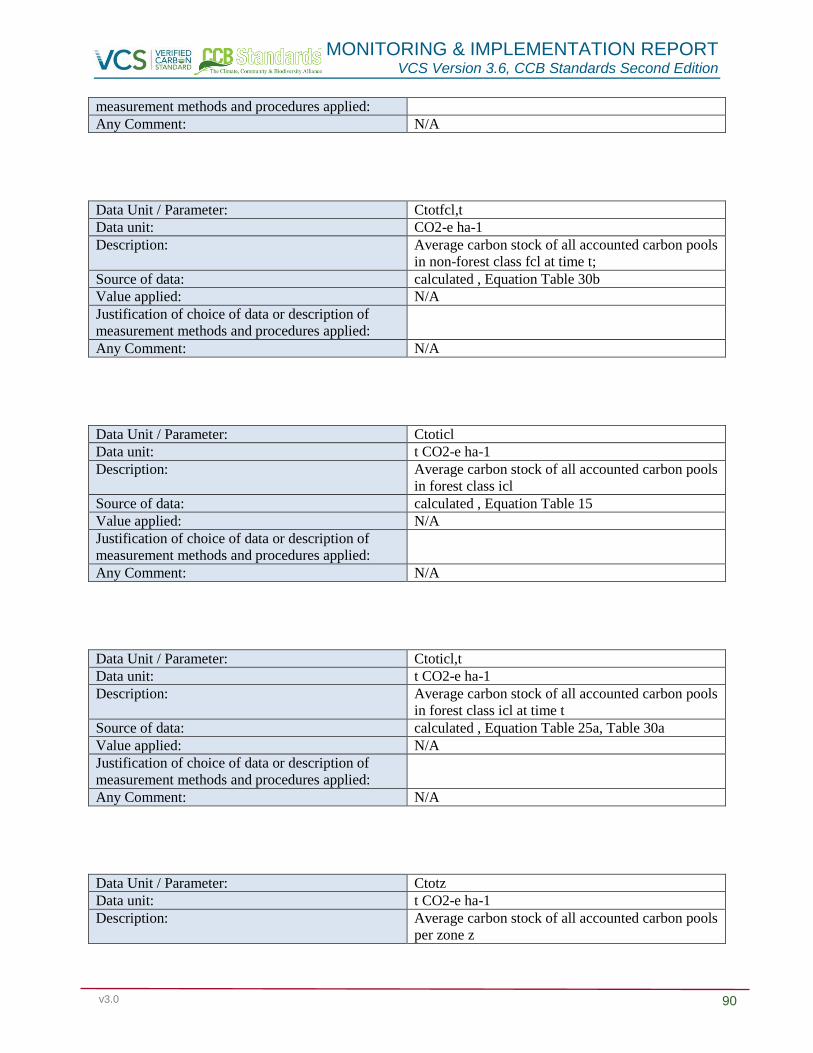
MONITORING & IMPLEMENTATION REPORT VCS Version 3.6, CCB Standards Second Edition
v3.0 90
measurement methods and procedures applied:
Any Comment: N/A
Data Unit / Parameter: Ctotfcl,t
Data unit: CO2-e ha-1
Description: Average carbon stock of all accounted carbon pools
in non-forest class fcl at time t;
Source of data: calculated , Equation Table 30b
Value applied: N/A
Justification of choice of data or description of
measurement methods and procedures applied:
Any Comment: N/A
Data Unit / Parameter: Ctoticl
Data unit: t CO2-e ha-1
Description: Average carbon stock of all accounted carbon pools
in forest class icl
Source of data: calculated , Equation Table 15
Value applied: N/A
Justification of choice of data or description of
measurement methods and procedures applied:
Any Comment: N/A
Data Unit / Parameter: Ctoticl,t
Data unit: t CO2-e ha-1
Description: Average carbon stock of all accounted carbon pools
in forest class icl at time t
Source of data: calculated , Equation Table 25a, Table 30a
Value applied: N/A
Justification of choice of data or description of
measurement methods and procedures applied:
Any Comment: N/A
Data Unit / Parameter: Ctotz
Data unit: t CO2-e ha-1
Description: Average carbon stock of all accounted carbon pools
per zone z
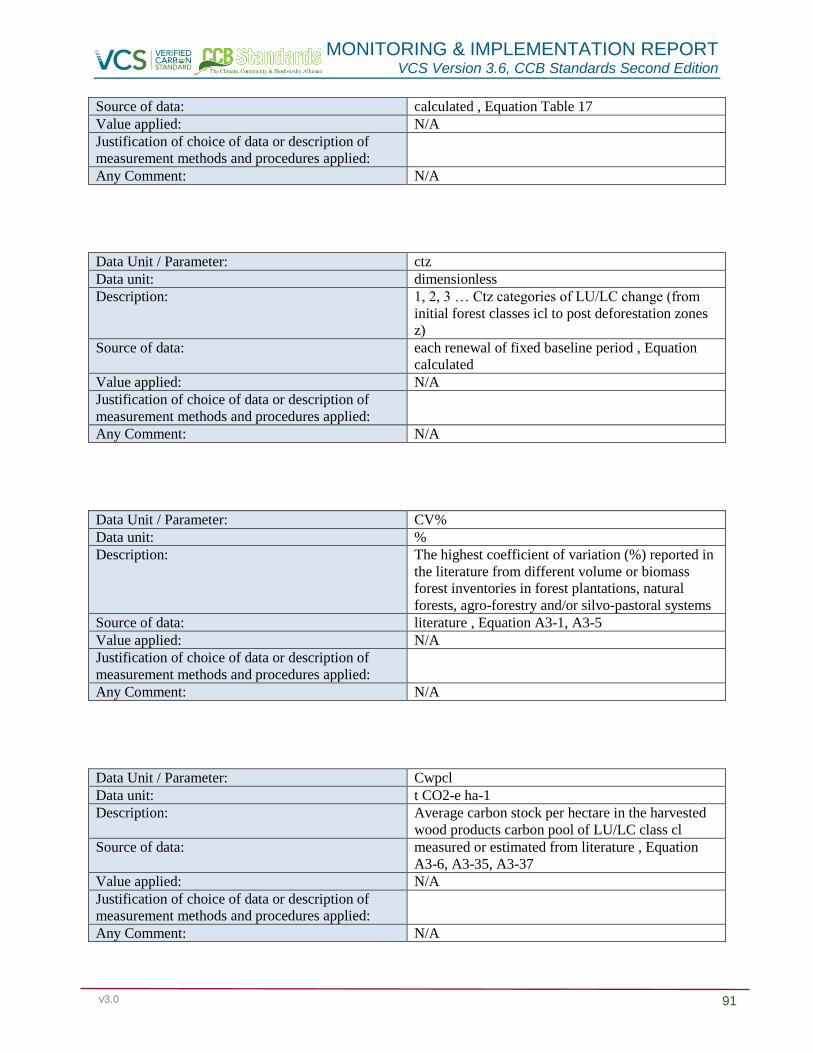
MONITORING & IMPLEMENTATION REPORT VCS Version 3.6, CCB Standards Second Edition
v3.0 91
Source of data: calculated , Equation Table 17
Value applied: N/A
Justification of choice of data or description of
measurement methods and procedures applied:
Any Comment: N/A
Data Unit / Parameter: ctz
Data unit: dimensionless
Description: 1, 2, 3 … Ctz categories of LU/LC change (from
initial forest classes icl to post deforestation zones
z)
Source of data: each renewal of fixed baseline period , Equation
calculated
Value applied: N/A
Justification of choice of data or description of
measurement methods and procedures applied:
Any Comment: N/A
Data Unit / Parameter: CV%
Data unit: %
Description: The highest coefficient of variation (%) reported in
the literature from different volume or biomass
forest inventories in forest plantations, natural
forests, agro-forestry and/or silvo-pastoral systems
Source of data: literature , Equation A3-1, A3-5
Value applied: N/A
Justification of choice of data or description of
measurement methods and procedures applied:
Any Comment: N/A
Data Unit / Parameter: Cwpcl
Data unit: t CO2-e ha-1
Description: Average carbon stock per hectare in the harvested
wood products carbon pool of LU/LC class cl
Source of data: measured or estimated from literature , Equation
A3-6, A3-35, A3-37
Value applied: N/A
Justification of choice of data or description of
measurement methods and procedures applied:
Any Comment: N/A

MONITORING & IMPLEMENTATION REPORT VCS Version 3.6, CCB Standards Second Edition
v3.0 92
Data Unit / Parameter: Cwpfcl
Data unit: t CO2-e ha-1
Description: Average carbon stock per hectare in the harvested
wood products carbon pool of final post-
deforestation class fcl
Source of data: only once at project start and when mandatory ,
Equation Table 16, Table 17
Value applied: See Accounting Model, PD Template, Tables X, Y,
Z, AA, AB, AC, AD
Justification of choice of data or description of
measurement methods and procedures applied:
Any Comment:
Data Unit / Parameter: Cwpicl
Data unit: t CO2-e ha-1
Description: Average carbon stock per hectare in the harvested
wood products carbon pool of initial forest class icl
Source of data: , Equation Table 15, A3-35,A3-36, A3-37, A3-39,
A3-40, A3-41
Value applied: See Accounting Model, PD Template, Table V
Justification of choice of data or description of
measurement methods and procedures applied:
Any Comment:
Data Unit / Parameter: Cwplt,icl,t
Data unit:
Description: Carbon stock in the long-term wood products
carbon pool at the time of deforestation t of the
initial forest class icl
Source of data: , Equation A3-37, A3-41
Value applied: N/A
Justification of choice of data or description of
measurement methods and procedures applied:
Any Comment: N/A
Data Unit / Parameter: Cwpmt,icl,t

MONITORING & IMPLEMENTATION REPORT VCS Version 3.6, CCB Standards Second Edition
v3.0 93
Data unit:
Description: Carbon stock in the medium-term wood products
carbon pool at the time of deforestation t of the
initial forest class icl
Source of data: , Equation A3-36, A3-40
Value applied: N/A
Justification of choice of data or description of
measurement methods and procedures applied:
Any Comment: N/A
Data Unit / Parameter: Cwpz
Data unit: t CO2-e ha-1
Description: Average carbon stock per hectare in the harvested
wood products carbon pool per zone z
Source of data: measured or estimated from literature , Equation
Table 17
Value applied: N/A
Justification of choice of data or description of
measurement methods and procedures applied:
Any Comment: N/A
Data Unit / Parameter: CXBw,icl,t
Data unit: t CO2-e ha-1
Description: Mean carbon stock per hectare of extracted
biomass carbon by class of wood product w from
forest class icl at time t
Source of data: measured or estimated from literature , Equation
A3-34, A3-35, A3-39
Value applied: N/A
Justification of choice of data or description of
measurement methods and procedures applied:
Any Comment: N/A
Data Unit / Parameter: d1, d2, ..., dn
Data unit: cm
Description: Diameters of intersecting pieces of dead wood
Source of data: measured or estimated from literature , Equation
A3-29
Value applied: N/A
Justification of choice of data or description of

MONITORING & IMPLEMENTATION REPORT VCS Version 3.6, CCB Standards Second Edition
v3.0 94
measurement methods and procedures applied:
Any Comment: N/A
Data Unit / Parameter: DBH
Data unit: cm
Description: Diameter at Breast Height
Source of data: measured or estimated from literature , Equation
A3-18
Value applied: See Forest Carbon Stock Inventory workbook
Justification of choice of data or description of
measurement methods and procedures applied:
Any Comment:
Data Unit / Parameter: DBI
Data unit: kg d.m. head-1 day-1
Description: Daily biomass intake
Source of data: measured or estimated from literature , Equation
A4-2, Table 31
Value applied: N/A
Justification of choice of data or description of
measurement methods and procedures applied:
Any Comment: N/A
Data Unit / Parameter: dc
Data unit: dimensionless
Description: 1, 2, 3 dead wood density classes
Source of data: defined , Equation A3-30
Value applied: N/A
Justification of choice of data or description of
measurement methods and procedures applied:
Any Comment: N/A
Data Unit / Parameter: DC
Data unit: dimensionless
Description: Total number of density classes (3)
Source of data: defined , Equation A3-30
Value applied: N/A

MONITORING & IMPLEMENTATION REPORT VCS Version 3.6, CCB Standards Second Edition
v3.0 95
Justification of choice of data or description of
measurement methods and procedures applied:
Any Comment: N/A
Data Unit / Parameter: Ddc
Data unit: tonnes d. m. m-3
Description: Dead wood density of class dc
Source of data: measured or estimated from literature , Equation
A3-30
Value applied: N/A
Justification of choice of data or description of
measurement methods and procedures applied:
Any Comment: N/A
Data Unit / Parameter: Dj
Data unit: t d.m.m-3
Description: Mean wood density of species j
Source of data: measured or estimated from literature , Equation
A3-34
Value applied: N/A
Justification of choice of data or description of
measurement methods and procedures applied:
Any Comment: N/A
Data Unit / Parameter: DLF
Data unit: %
Description: Displacement Leakage Factor
Source of data: defined
Value applied: 0.163
Justification of choice of data or description of
measurement methods and procedures applied:
Any Comment:
Data Unit / Parameter: Dm
Data unit: g cm-3
Description: Deadwood density
Source of data: measured or estimated from literature , Equation

MONITORING & IMPLEMENTATION REPORT VCS Version 3.6, CCB Standards Second Edition
v3.0 96
A3-28
Value applied: N/A
Justification of choice of data or description of
measurement methods and procedures applied:
Any Comment: N/A
Data Unit / Parameter: DMpl
Data unit: tonnes of d.m.
Description: Dry mass of sample pl;
Source of data: measured or estimated from literature , Equation
A3-24
Value applied: N/A
Justification of choice of data or description of
measurement methods and procedures applied:
Any Comment: N/A
Data Unit / Parameter: e
Data unit: dimensionless
Description: Euler number (2,71828)
Source of data: , Equation 4.b, 8.c
Value applied: N/A
Justification of choice of data or description of
measurement methods and procedures applied:
Any Comment: N/A
Data Unit / Parameter: E
Data unit: %
Description: allowable error ( 10% of the mean)
Source of data: , Equation A3-3
Value applied: See Uncertainty Estimates for Forest and Non-
forest carbon stocks in carbon stock workbooks
Justification of choice of data or description of
measurement methods and procedures applied:
Any Comment:
Data Unit / Parameter: E%
Data unit: %
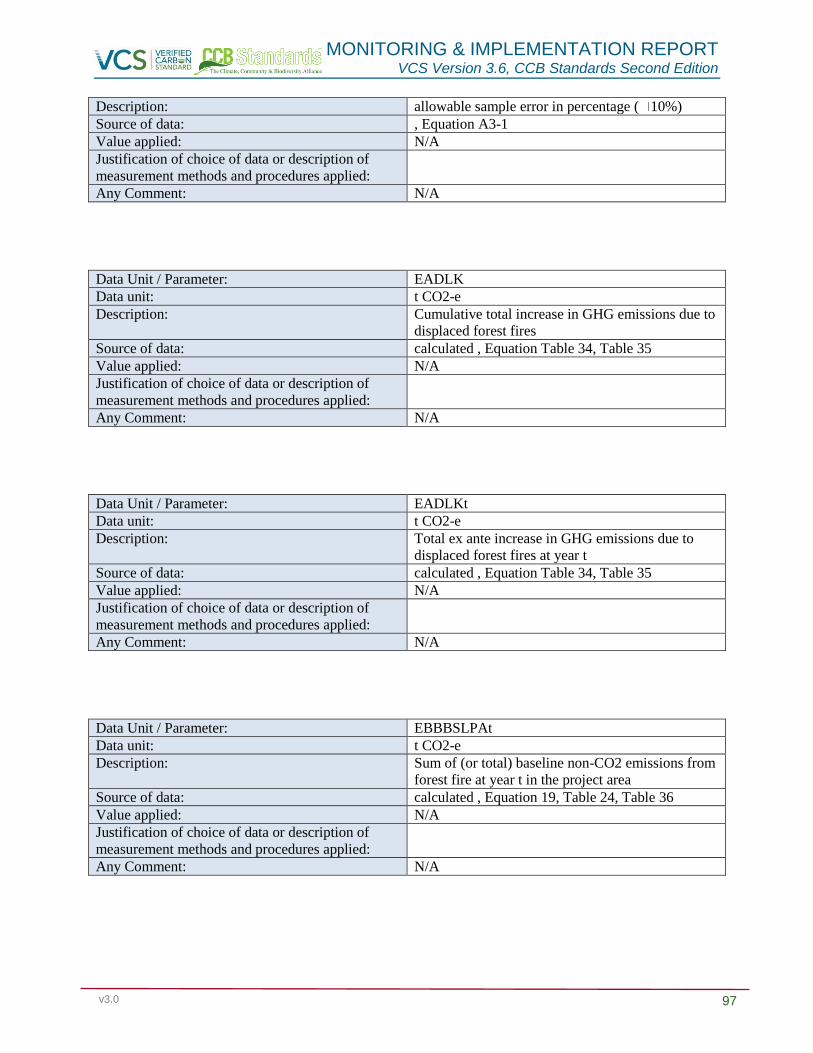
MONITORING & IMPLEMENTATION REPORT VCS Version 3.6, CCB Standards Second Edition
v3.0 97
Description: allowable sample error in percentage ( 10%)
Source of data: , Equation A3-1
Value applied: N/A
Justification of choice of data or description of
measurement methods and procedures applied:
Any Comment: N/A
Data Unit / Parameter: EADLK
Data unit: t CO2-e
Description: Cumulative total increase in GHG emissions due to
displaced forest fires
Source of data: calculated , Equation Table 34, Table 35
Value applied: N/A
Justification of choice of data or description of
measurement methods and procedures applied:
Any Comment: N/A
Data Unit / Parameter: EADLKt
Data unit: t CO2-e
Description: Total ex ante increase in GHG emissions due to
displaced forest fires at year t
Source of data: calculated , Equation Table 34, Table 35
Value applied: N/A
Justification of choice of data or description of
measurement methods and procedures applied:
Any Comment: N/A
Data Unit / Parameter: EBBBSLPAt
Data unit: t CO2-e
Description: Sum of (or total) baseline non-CO2 emissions from
forest fire at year t in the project area
Source of data: calculated , Equation 19, Table 24, Table 36
Value applied: N/A
Justification of choice of data or description of
measurement methods and procedures applied:
Any Comment: N/A
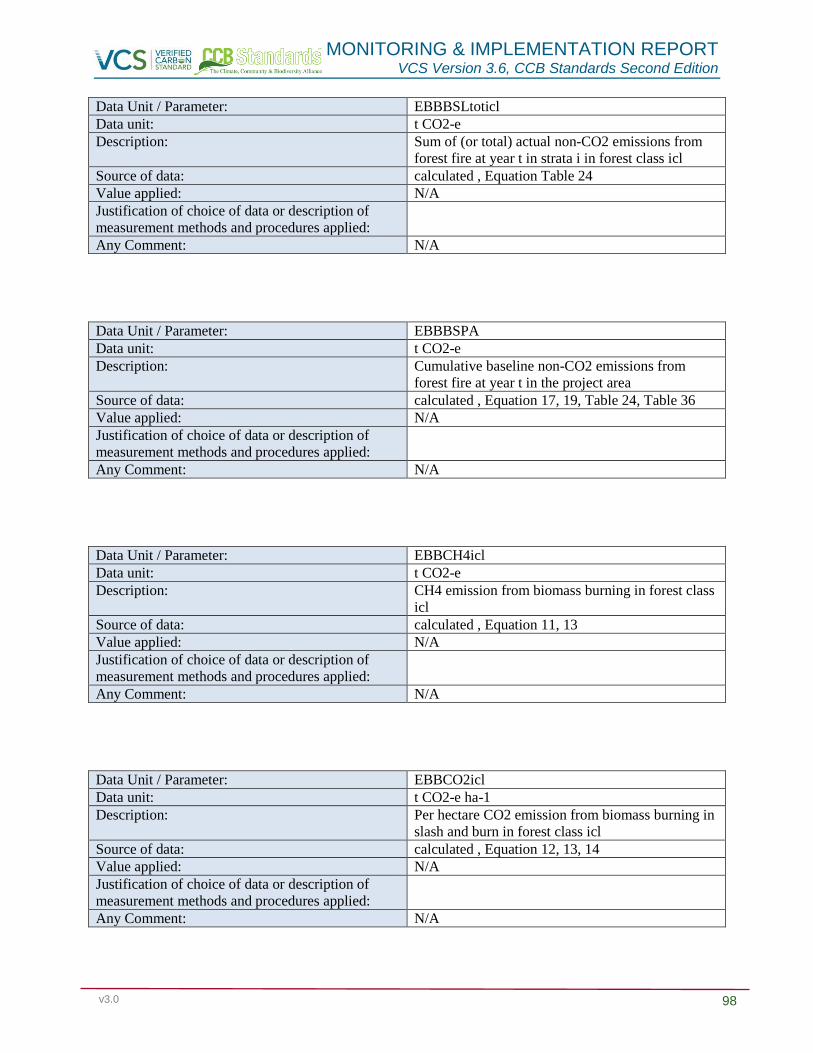
MONITORING & IMPLEMENTATION REPORT VCS Version 3.6, CCB Standards Second Edition
v3.0 98
Data Unit / Parameter: EBBBSLtoticl
Data unit: t CO2-e
Description: Sum of (or total) actual non-CO2 emissions from
forest fire at year t in strata i in forest class icl
Source of data: calculated , Equation Table 24
Value applied: N/A
Justification of choice of data or description of
measurement methods and procedures applied:
Any Comment: N/A
Data Unit / Parameter: EBBBSPA
Data unit: t CO2-e
Description: Cumulative baseline non-CO2 emissions from
forest fire at year t in the project area
Source of data: calculated , Equation 17, 19, Table 24, Table 36
Value applied: N/A
Justification of choice of data or description of
measurement methods and procedures applied:
Any Comment: N/A
Data Unit / Parameter: EBBCH4icl
Data unit: t CO2-e
Description: CH4 emission from biomass burning in forest class
icl
Source of data: calculated , Equation 11, 13
Value applied: N/A
Justification of choice of data or description of
measurement methods and procedures applied:
Any Comment: N/A
Data Unit / Parameter: EBBCO2icl
Data unit: t CO2-e ha-1
Description: Per hectare CO2 emission from biomass burning in
slash and burn in forest class icl
Source of data: calculated , Equation 12, 13, 14
Value applied: N/A
Justification of choice of data or description of
measurement methods and procedures applied:
Any Comment: N/A
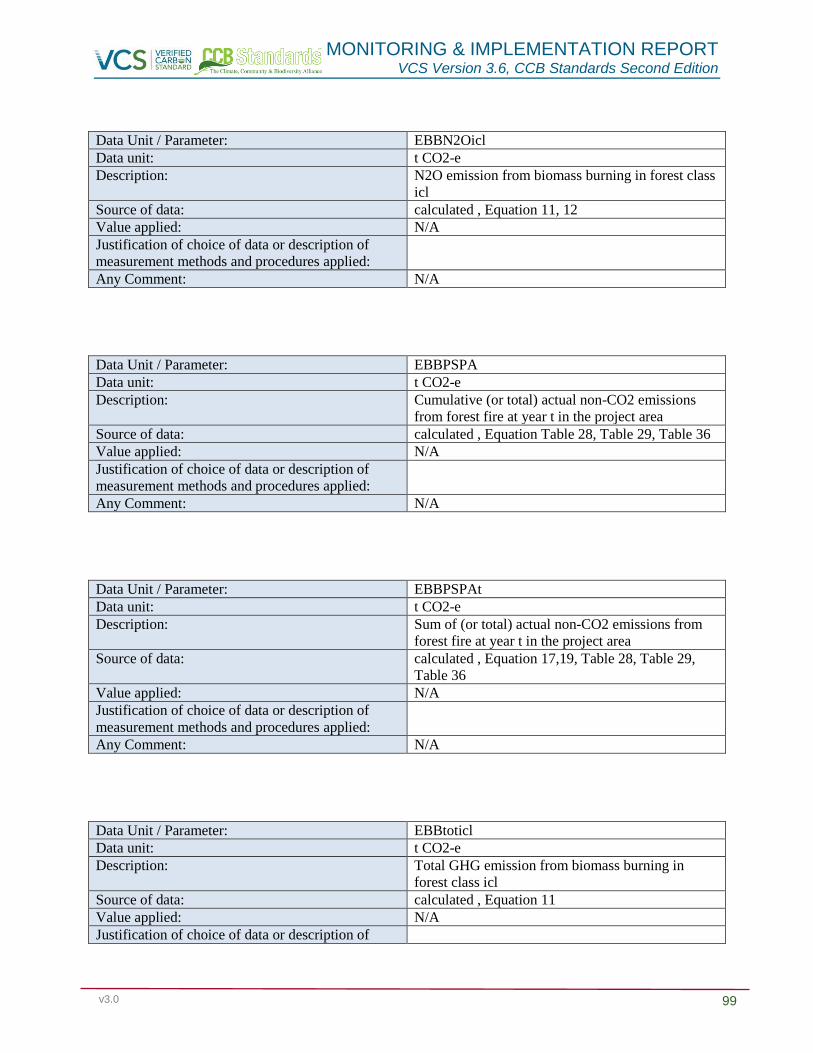
MONITORING & IMPLEMENTATION REPORT VCS Version 3.6, CCB Standards Second Edition
v3.0 99
Data Unit / Parameter: EBBN2Oicl
Data unit: t CO2-e
Description: N2O emission from biomass burning in forest class
icl
Source of data: calculated , Equation 11, 12
Value applied: N/A
Justification of choice of data or description of
measurement methods and procedures applied:
Any Comment: N/A
Data Unit / Parameter: EBBPSPA
Data unit: t CO2-e
Description: Cumulative (or total) actual non-CO2 emissions
from forest fire at year t in the project area
Source of data: calculated , Equation Table 28, Table 29, Table 36
Value applied: N/A
Justification of choice of data or description of
measurement methods and procedures applied:
Any Comment: N/A
Data Unit / Parameter: EBBPSPAt
Data unit: t CO2-e
Description: Sum of (or total) actual non-CO2 emissions from
forest fire at year t in the project area
Source of data: calculated , Equation 17,19, Table 28, Table 29,
Table 36
Value applied: N/A
Justification of choice of data or description of
measurement methods and procedures applied:
Any Comment: N/A
Data Unit / Parameter: EBBtoticl
Data unit: t CO2-e
Description: Total GHG emission from biomass burning in
forest class icl
Source of data: calculated , Equation 11
Value applied: N/A
Justification of choice of data or description of
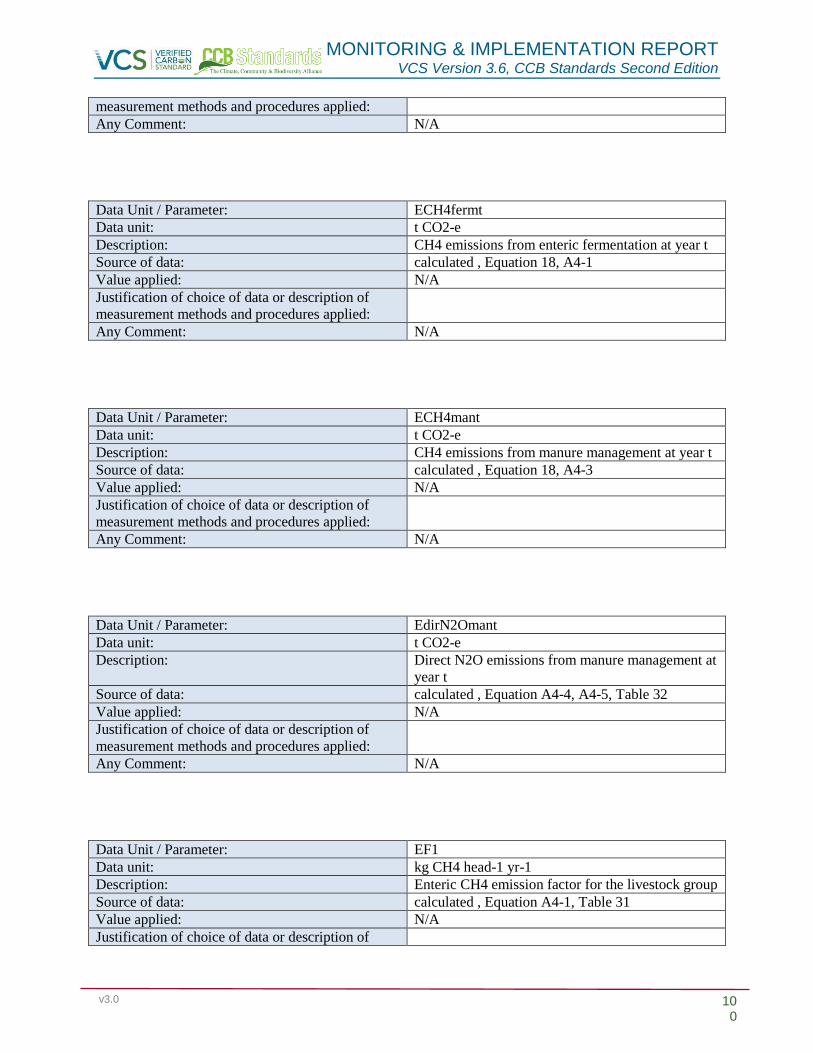
MONITORING & IMPLEMENTATION REPORT VCS Version 3.6, CCB Standards Second Edition
v3.0 100
measurement methods and procedures applied:
Any Comment: N/A
Data Unit / Parameter: ECH4fermt
Data unit: t CO2-e
Description: CH4 emissions from enteric fermentation at year t
Source of data: calculated , Equation 18, A4-1
Value applied: N/A
Justification of choice of data or description of
measurement methods and procedures applied:
Any Comment: N/A
Data Unit / Parameter: ECH4mant
Data unit: t CO2-e
Description: CH4 emissions from manure management at year t
Source of data: calculated , Equation 18, A4-3
Value applied: N/A
Justification of choice of data or description of
measurement methods and procedures applied:
Any Comment: N/A
Data Unit / Parameter: EdirN2Omant
Data unit: t CO2-e
Description: Direct N2O emissions from manure management at
year t
Source of data: calculated , Equation A4-4, A4-5, Table 32
Value applied: N/A
Justification of choice of data or description of
measurement methods and procedures applied:
Any Comment: N/A
Data Unit / Parameter: EF1
Data unit: kg CH4 head-1 yr-1
Description: Enteric CH4 emission factor for the livestock group
Source of data: calculated , Equation A4-1, Table 31
Value applied: N/A
Justification of choice of data or description of

MONITORING & IMPLEMENTATION REPORT VCS Version 3.6, CCB Standards Second Edition
v3.0 101
measurement methods and procedures applied:
Any Comment: N/A
Data Unit / Parameter: EF2
Data unit: kg CH4 head-1 yr-1
Description: Manure management CH4 emission factor for the
livestock group
Source of data: measured or estimated from literature , Equation
A4-3, Table 31
Value applied: N/A
Justification of choice of data or description of
measurement methods and procedures applied:
Any Comment: N/A
Data Unit / Parameter: EF3
Data unit: kg N2O-N (kg N-1) head-1 yr-1
Description: Emission factor for N2O emissions from manure
management for the livestock group
Source of data: measured or estimated from literature , Equation
A4-5, Table 31
Value applied: N/A
Justification of choice of data or description of
measurement methods and procedures applied:
Any Comment: N/A
Data Unit / Parameter: EF4
Data unit: kg N2O-N (kg NH3-N and NOx-N emitted)-1
head-1 yr-1
Description: Emission factor for N2O emissions from
atmospheric deposition of forage-sourced nitrogen
on soils and water surfaces
Source of data: measured or estimated from literature , Equation
A4-6, Table 31
Value applied: N/A
Justification of choice of data or description of
measurement methods and procedures applied:
Any Comment: N/A
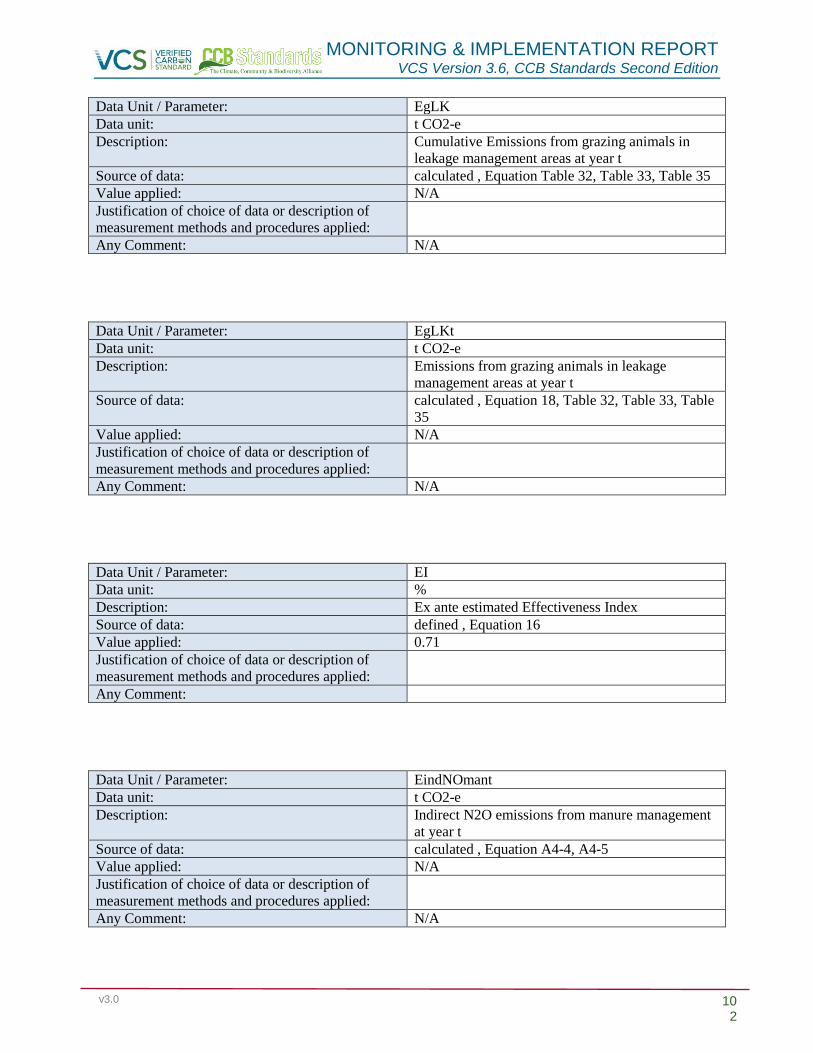
MONITORING & IMPLEMENTATION REPORT VCS Version 3.6, CCB Standards Second Edition
v3.0 102
Data Unit / Parameter: EgLK
Data unit: t CO2-e
Description: Cumulative Emissions from grazing animals in
leakage management areas at year t
Source of data: calculated , Equation Table 32, Table 33, Table 35
Value applied: N/A
Justification of choice of data or description of
measurement methods and procedures applied:
Any Comment: N/A
Data Unit / Parameter: EgLKt
Data unit: t CO2-e
Description: Emissions from grazing animals in leakage
management areas at year t
Source of data: calculated , Equation 18, Table 32, Table 33, Table
35
Value applied: N/A
Justification of choice of data or description of
measurement methods and procedures applied:
Any Comment: N/A
Data Unit / Parameter: EI
Data unit: %
Description: Ex ante estimated Effectiveness Index
Source of data: defined , Equation 16
Value applied: 0.71
Justification of choice of data or description of
measurement methods and procedures applied:
Any Comment:
Data Unit / Parameter: EindNOmant
Data unit: t CO2-e
Description: Indirect N2O emissions from manure management
at year t
Source of data: calculated , Equation A4-4, A4-5
Value applied: N/A
Justification of choice of data or description of
measurement methods and procedures applied:
Any Comment: N/A

MONITORING & IMPLEMENTATION REPORT VCS Version 3.6, CCB Standards Second Edition
v3.0 103
Data Unit / Parameter: ELK
Data unit: t CO2-e
Description: Cumulative sum of ex ante estimated leakage
emissions at year t
Source of data: calculated , Equation 19, Table 35, Table 36
Value applied: See Accounting Model, PD Template, Table AO
Justification of choice of data or description of
measurement methods and procedures applied:
Any Comment:
Data Unit / Parameter: ELKt
Data unit: t CO2-e
Description: Sum of ex ante estimated leakage emissions at year
t
Source of data: calculated , Equation 19, Table 35, Table 36
Value applied: See Accounting Model, PD Template, Table AO
Justification of choice of data or description of
measurement methods and procedures applied:
Any Comment:
Data Unit / Parameter: ELPMLK
Data unit: t CO2-e
Description: Cumulative total ex increase in GHG emissions due
to leakage prevention measures
Source of data: calculated , Equation Table 33
Value applied: See Accounting Model, PD Template, Table AO
Justification of choice of data or description of
measurement methods and procedures applied:
Any Comment:
Data Unit / Parameter: ELPMLKt
Data unit: t CO2-e
Description: Annual total increase in GHG emissions due to
leakage prevention measures at year t
Source of data: calculated , Equation Table 33
Value applied: See Accounting Model, PD Template, Table AO
Justification of choice of data or description of
measurement methods and procedures applied:

MONITORING & IMPLEMENTATION REPORT VCS Version 3.6, CCB Standards Second Edition
v3.0 104
Any Comment:
Data Unit / Parameter: EN2Omant
Data unit: t CO2-e
Description: N2O emissions from manure management at year t
Source of data: calculated , Equation 18, A4-4, Table 32
Value applied: N/A
Justification of choice of data or description of
measurement methods and procedures applied:
Any Comment: N/A
Data Unit / Parameter: ERCH4
Data unit: dimensionless
Description: Emission ratio for CH4 (IPCC default value =
0.012)
Source of data: defined , Equation 13
Value applied: N/A
Justification of choice of data or description of
measurement methods and procedures applied:
Any Comment: N/A
Data Unit / Parameter: ERN2O
Data unit: dimensionless
Description: Emission ratio for N2O (IPCC default value =
0.007)
Source of data: defined , Equation 12
Value applied: N/A
Justification of choice of data or description of
measurement methods and procedures applied:
Any Comment: N/A
Data Unit / Parameter: f(t)
Data unit:
Description: A function of time
Source of data: calculated , Equation 4.c
Value applied: N/A
Justification of choice of data or description of

MONITORING & IMPLEMENTATION REPORT VCS Version 3.6, CCB Standards Second Edition
v3.0 105
measurement methods and procedures applied:
Any Comment: N/A
Data Unit / Parameter: Fburnticl
Data unit: %
Description: Proportion of forest area burned during the
historical reference period in the forest class icl
Source of data: measured or estimated from literature , Equation
14, Table 23
Value applied: N/A
Justification of choice of data or description of
measurement methods and procedures applied:
Any Comment: N/A
Data Unit / Parameter: fcl
Data unit: dimensionless
Description: 1, 2, 3 … Fcl final (post-deforestation) non-forest
classes
Source of data: measured or estimated from literature
Value applied: N/A
Justification of choice of data or description of
measurement methods and procedures applied:
Any Comment: N/A
Data Unit / Parameter: fj(DBH,H)ab
Data unit: A3-10
Description: an allometric equation for species, or group of
species, or forest type j, linking above-ground tree
biomass (in kg tree-1) to diameter at breast height
(DBH) and possibly tree height (H).
Source of data: measured or estimated from literature
Value applied: N/A
Justification of choice of data or description of
measurement methods and procedures applied:
Any Comment: N/A
Data Unit / Parameter: fj(DBH,H)V

MONITORING & IMPLEMENTATION REPORT VCS Version 3.6, CCB Standards Second Edition
v3.0 106
Data unit:
Description: a commercial volume equation for species or
species group j, linking commercial volume to
diameter at breast height (DBH) and possibly tree
height (H)
Source of data: calculated , Equation A3-20
Value applied: N/A
Justification of choice of data or description of
measurement methods and procedures applied:
Any Comment: N/A
Data Unit / Parameter: Fracgas
Data unit: kg NH3-N and NOx-N emitted (Kg N)-1
Description: Fraction of managed livestock manure nitrogen that
volatilizes as NH3 and NOx in the manure
management phase
Source of data: calculated , Equation Table 31
Value applied: N/A
Justification of choice of data or description of
measurement methods and procedures applied:
Any Comment: N/A
Data Unit / Parameter: GWPCH4
Data unit: dimensionless
Description: Global Warming Potential for CH4 (IPCC default
value = 21 for the first commitment period)
Source of data: defined , Equation 13
Value applied: N/A
Justification of choice of data or description of
measurement methods and procedures applied:
Any Comment: N/A
Data Unit / Parameter: GWPN2O
Data unit: dimensionless
Description: Global Warming Potential for N2O (IPCC default
value = 310 for the first commitment period)
Source of data: defined , Equation 12
Value applied: N/A
Justification of choice of data or description of
measurement methods and procedures applied:

MONITORING & IMPLEMENTATION REPORT VCS Version 3.6, CCB Standards Second Edition
v3.0 107
Any Comment: N/A
Data Unit / Parameter: H
Data unit: meters
Description: Height of the tree
Source of data: measured or estimated from literature , Equation
A3-27
Value applied: N/A
Justification of choice of data or description of
measurement methods and procedures applied:
Any Comment: N/A
Data Unit / Parameter: L
Data unit: m
Description: Length of the line
Source of data: measured or estimated from literature , Equation
A3-29
Value applied: N/A
Justification of choice of data or description of
measurement methods and procedures applied:
Any Comment: N/A
Data Unit / Parameter: LTFw
Data unit:
Description: Fraction of wood products that are considered
permanent (i.e. carbon is stored for 100 years or
more); it may be assumed no carbon is released
Source of data: , Equation A3-36, A3- 40
Value applied: N/A
Justification of choice of data or description of
measurement methods and procedures applied:
Any Comment: N/A
Data Unit / Parameter: MTFw
Data unit:
Description: Fraction of wood products that are retired between
3 and 100 years
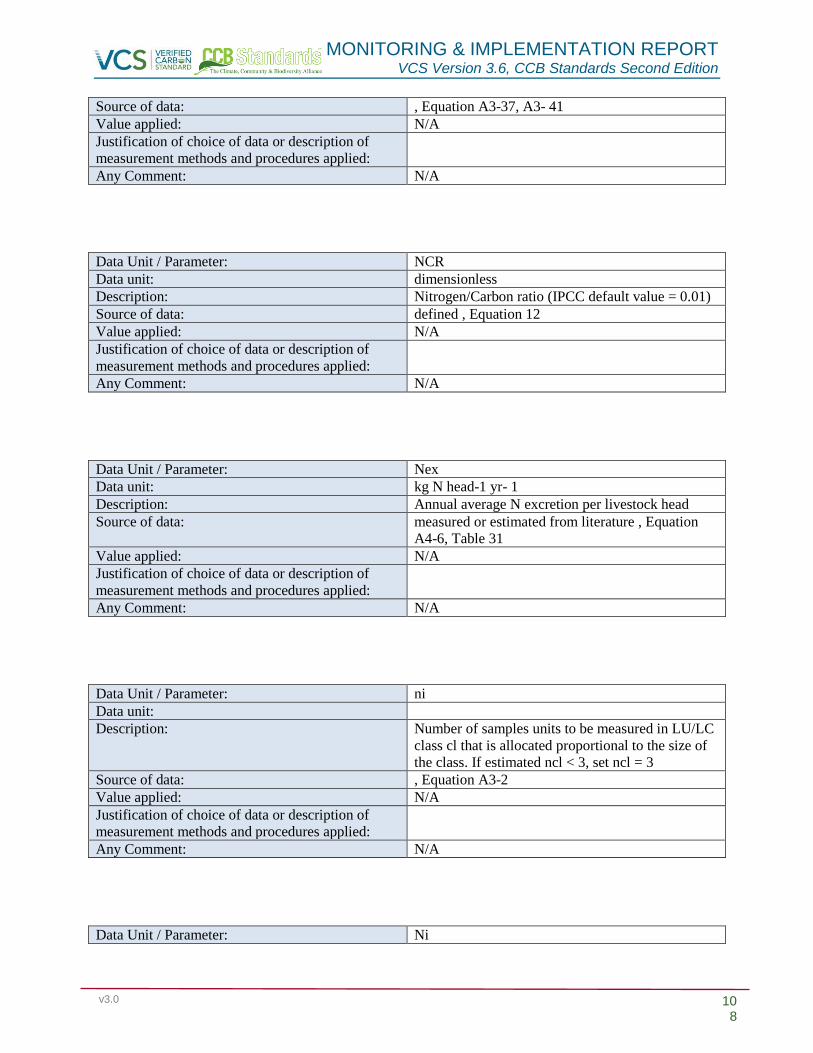
MONITORING & IMPLEMENTATION REPORT VCS Version 3.6, CCB Standards Second Edition
v3.0 108
Source of data: , Equation A3-37, A3- 41
Value applied: N/A
Justification of choice of data or description of
measurement methods and procedures applied:
Any Comment: N/A
Data Unit / Parameter: NCR
Data unit: dimensionless
Description: Nitrogen/Carbon ratio (IPCC default value = 0.01)
Source of data: defined , Equation 12
Value applied: N/A
Justification of choice of data or description of
measurement methods and procedures applied:
Any Comment: N/A
Data Unit / Parameter: Nex
Data unit: kg N head-1 yr- 1
Description: Annual average N excretion per livestock head
Source of data: measured or estimated from literature , Equation
A4-6, Table 31
Value applied: N/A
Justification of choice of data or description of
measurement methods and procedures applied:
Any Comment: N/A
Data Unit / Parameter: ni
Data unit:
Description: Number of samples units to be measured in LU/LC
class cl that is allocated proportional to the size of
the class. If estimated ncl < 3, set ncl = 3
Source of data: , Equation A3-2
Value applied: N/A
Justification of choice of data or description of
measurement methods and procedures applied:
Any Comment: N/A
Data Unit / Parameter: Ni

MONITORING & IMPLEMENTATION REPORT VCS Version 3.6, CCB Standards Second Edition
v3.0 109
Data unit:
Description: Maximum number of possible sample units for
LU/LC class cl, calculated by dividing the area of
class cl by the measurement plot area
Source of data: , Equation A3-2
Value applied: N/A
Justification of choice of data or description of
measurement methods and procedures applied:
Any Comment: N/A
Data Unit / Parameter: OFw
Data unit: dimensionless
Description: Fraction of wood products that will be emitted to
the atmosphere between 5 and 100 years of timber
harvest
Source of data: measured or estimated from literature , Equation
A3-35, A3-37
Value applied: N/A
Justification of choice of data or description of
measurement methods and procedures applied:
Any Comment: N/A
Data Unit / Parameter: p
Data unit: dimensionless
Description: Carbon pool that could burn (above-ground
biomass, dead wood, litter)
Source of data: defined , Equation 10
Value applied: N/A
Justification of choice of data or description of
measurement methods and procedures applied:
Any Comment: N/A
Data Unit / Parameter: Pburntp,icl
Data unit: %
Description: Average proportion of mass burnt in the carbon
pool p in the forest class icl;
Source of data: measured or estimated from literature , Equation 14
Value applied: N/A
Justification of choice of data or description of
measurement methods and procedures applied:
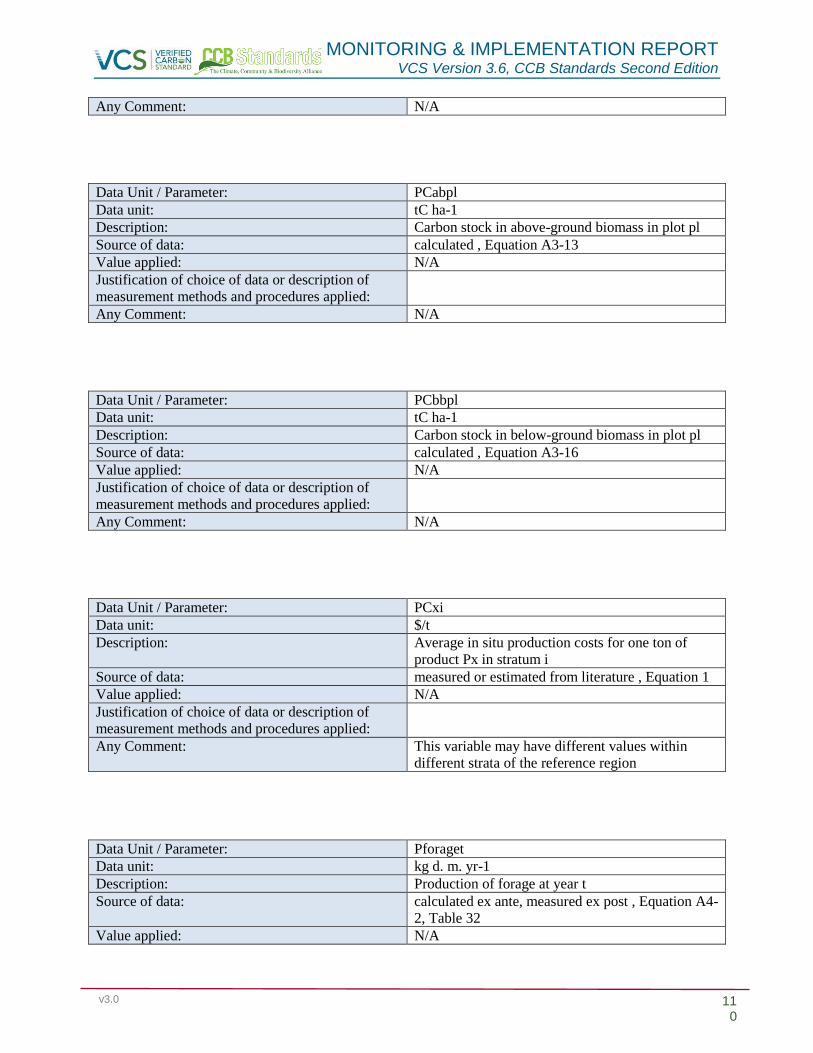
MONITORING & IMPLEMENTATION REPORT VCS Version 3.6, CCB Standards Second Edition
v3.0 110
Any Comment: N/A
Data Unit / Parameter: PCabpl
Data unit: tC ha-1
Description: Carbon stock in above-ground biomass in plot pl
Source of data: calculated , Equation A3-13
Value applied: N/A
Justification of choice of data or description of
measurement methods and procedures applied:
Any Comment: N/A
Data Unit / Parameter: PCbbpl
Data unit: tC ha-1
Description: Carbon stock in below-ground biomass in plot pl
Source of data: calculated , Equation A3-16
Value applied: N/A
Justification of choice of data or description of
measurement methods and procedures applied:
Any Comment: N/A
Data Unit / Parameter: PCxi
Data unit: $/t
Description: Average in situ production costs for one ton of
product Px in stratum i
Source of data: measured or estimated from literature , Equation 1
Value applied: N/A
Justification of choice of data or description of
measurement methods and procedures applied:
Any Comment: This variable may have different values within
different strata of the reference region
Data Unit / Parameter: Pforaget
Data unit: kg d. m. yr-1
Description: Production of forage at year t
Source of data: calculated ex ante, measured ex post , Equation A4-
2, Table 32
Value applied: N/A
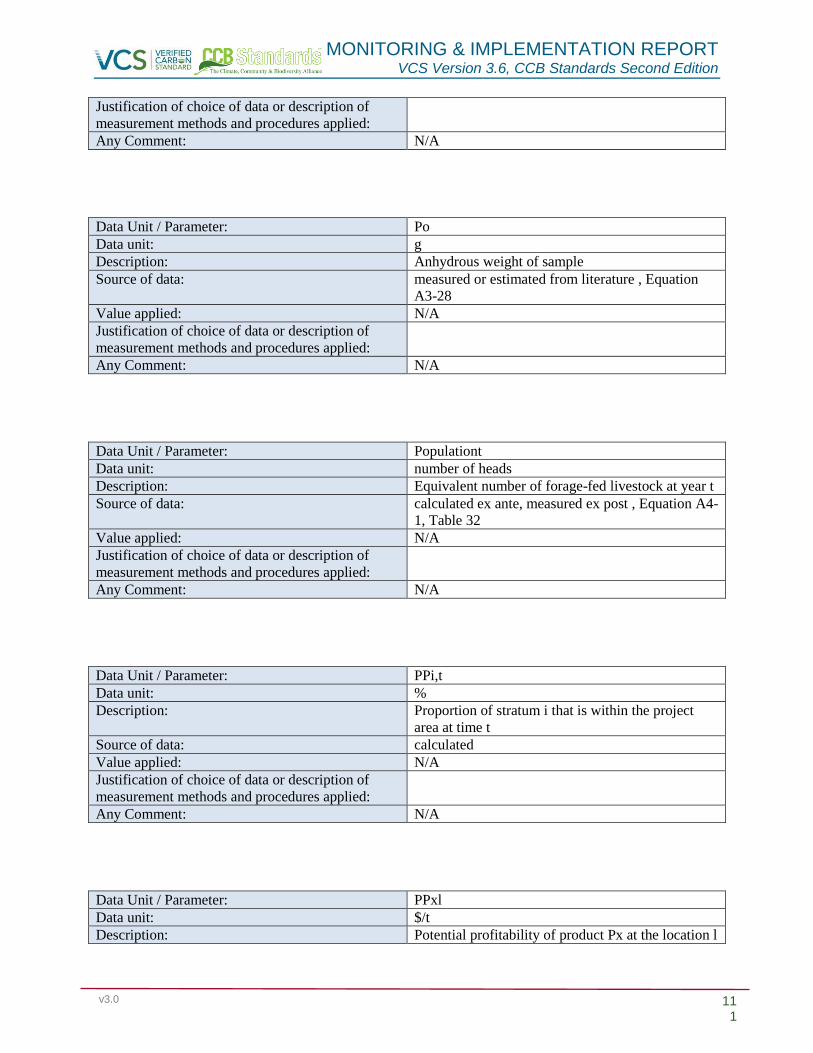
MONITORING & IMPLEMENTATION REPORT VCS Version 3.6, CCB Standards Second Edition
v3.0 111
Justification of choice of data or description of
measurement methods and procedures applied:
Any Comment: N/A
Data Unit / Parameter: Po
Data unit: g
Description: Anhydrous weight of sample
Source of data: measured or estimated from literature , Equation
A3-28
Value applied: N/A
Justification of choice of data or description of
measurement methods and procedures applied:
Any Comment: N/A
Data Unit / Parameter: Populationt
Data unit: number of heads
Description: Equivalent number of forage-fed livestock at year t
Source of data: calculated ex ante, measured ex post , Equation A4-
1, Table 32
Value applied: N/A
Justification of choice of data or description of
measurement methods and procedures applied:
Any Comment: N/A
Data Unit / Parameter: PPi,t
Data unit: %
Description: Proportion of stratum i that is within the project
area at time t
Source of data: calculated
Value applied: N/A
Justification of choice of data or description of
measurement methods and procedures applied:
Any Comment: N/A
Data Unit / Parameter: PPxl
Data unit: $/t
Description: Potential profitability of product Px at the location l

MONITORING & IMPLEMENTATION REPORT VCS Version 3.6, CCB Standards Second Edition
v3.0 112
(pixel or polygon)
Source of data: calculated , Equation 1
Value applied: N/A
Justification of choice of data or description of
measurement methods and procedures applied:
Any Comment: N/A
Data Unit / Parameter: Ps
Data unit: g
Description: Saturated weight of sample
Source of data: measured or estimated from literature , Equation
A3-28
Value applied: N/A
Justification of choice of data or description of
measurement methods and procedures applied:
Any Comment: N/A
Data Unit / Parameter: Px
Data unit: dimensionless
Description: Product x produced in the reference region
Source of data: measured or estimated from literature , Equation 1
Value applied: N/A
Justification of choice of data or description of
measurement methods and procedures applied:
Any Comment: N/A
Data Unit / Parameter: r1
Data unit: meters
Description: Radius at the base of the tree
Source of data: measured or estimated from literature , Equation
A3-27
Value applied: N/A
Justification of choice of data or description of
measurement methods and procedures applied:
Any Comment: N/A
Data Unit / Parameter: r2

MONITORING & IMPLEMENTATION REPORT VCS Version 3.6, CCB Standards Second Edition
v3.0 113
Data unit: meters
Description: Radius at the top of the tree
Source of data: measured or estimated from literature , Equation
A3-27
Value applied: N/A
Justification of choice of data or description of
measurement methods and procedures applied:
Any Comment: N/A
Data Unit / Parameter: RBSLRRi,t
Data unit: %
Description: Percentage of remaining forest area at year t -1 in
stratum i to be deforested at year t
Source of data: calculated , Equation 3
Value applied: See Accounting Model, PD Template, Table H
Justification of choice of data or description of
measurement methods and procedures applied:
Any Comment: Used as an alternative to ABSLRR i,t in baseline
approach "c"
Data Unit / Parameter: RFt
Data unit: %
Description: Risk factor used to calculate VCS buffer credits
Source of data: estimated , Equation 21
Value applied: See Accounting Model, Ex Post Reporting
Parameters
Justification of choice of data or description of
measurement methods and procedures applied:
Any Comment:
Data Unit / Parameter: Rj
Data unit: dimensionless
Description: Root-shoot ratio appropriate for species, group of
species or forest type j
Source of data: measured or estimated from literature , Equation
A3-18
Value applied: N/A
Justification of choice of data or description of
measurement methods and procedures applied:
Any Comment: N/A

MONITORING & IMPLEMENTATION REPORT VCS Version 3.6, CCB Standards Second Edition
v3.0 114
Data Unit / Parameter: Rj,pl,tr
Data unit: dimensionless
Description: Root-shoot ratio, applicable to tree tr of species j in
plot pl
Source of data: measured or estimated from literature , Equation
A3-22
Value applied: N/A
Justification of choice of data or description of
measurement methods and procedures applied:
Any Comment: N/A
Data Unit / Parameter: S$x
Data unit: $/t
Description: Selling price of product Px
Source of data: measured or estimated from literature , Equation 1
Value applied: N/A
Justification of choice of data or description of
measurement methods and procedures applied:
Any Comment: N/A
Data Unit / Parameter: Scl
Data unit:
Description: standard deviation of LU/LC class cl
Source of data: , Equation A3-4
Value applied: N/A
Justification of choice of data or description of
measurement methods and procedures applied:
Any Comment: N/A
Data Unit / Parameter: SLFw
Data unit: dimensionless
Description: Fraction of wood products that will be emitted to
the atmosphere within 5 years of timber harvest
Source of data: measured or estimated from literature , Equation
A3-35, A3-37
Value applied: N/A

MONITORING & IMPLEMENTATION REPORT VCS Version 3.6, CCB Standards Second Edition
v3.0 115
Justification of choice of data or description of
measurement methods and procedures applied:
Any Comment: N/A
Data Unit / Parameter: SPxl
Data unit: map
Description: Selling point l of product Px
Source of data: measured or estimated from literature , Equation 1
Value applied: N/A
Justification of choice of data or description of
measurement methods and procedures applied:
Any Comment: N/A
Data Unit / Parameter: STFw
Data unit:
Description: Fraction of wood products and waste that will be
emitted to the atmosphere within 3 years; all carbon
shall be assumed to be lost immediately;
dimensionless
Source of data: , Equation A3-35, A3-37, A3-40, A3-41
Value applied: N/A
Justification of choice of data or description of
measurement methods and procedures applied:
Any Comment: N/A
Data Unit / Parameter: t
Data unit: dimensionless
Description: 1, 2, 3 … T a year of the proposed project crediting
period
Source of data: defined , Equation almost all equations
Value applied: N/A
Justification of choice of data or description of
measurement methods and procedures applied:
Any Comment: N/A
Data Unit / Parameter: t*
Data unit: dimensionless

MONITORING & IMPLEMENTATION REPORT VCS Version 3.6, CCB Standards Second Edition
v3.0 116
Description: the year at which the area ABSLPAicl,t is
deforested in the baseline case
Source of data: defined , Equation 10, A3-34
Value applied: N/A
Justification of choice of data or description of
measurement methods and procedures applied:
Any Comment: N/A
Data Unit / Parameter: t1
Data unit: dimensionless
Description: Start date of the historical reference period
Source of data:
Value applied: N/A
Justification of choice of data or description of
measurement methods and procedures applied:
Any Comment: N/A
Data Unit / Parameter: t2
Data unit: dimensionless
Description: End date of the historical reference period
Source of data:
Value applied: N/A
Justification of choice of data or description of
measurement methods and procedures applied:
Any Comment: N/A
Data Unit / Parameter: Taveragei
Data unit: yr
Description: Number of years in which Aaveragei is deforested
in the baseline case
Source of data: calculated
Value applied: N/A
Justification of choice of data or description of
measurement methods and procedures applied:
Any Comment: N/A
Data Unit / Parameter: taveragei

MONITORING & IMPLEMENTATION REPORT VCS Version 3.6, CCB Standards Second Edition
v3.0 117
Data unit: yr
Description: Year at which Taveragei ends
Source of data: calculated , Equation 6, 7
Value applied: N/A
Justification of choice of data or description of
measurement methods and procedures applied:
Any Comment: N/A
Data Unit / Parameter: TBabj
Data unit: kg tree-1 or t tree-1
Description: above-ground biomass of a tree of species, or
species group, or forest type j
Source of data: calculated , Equation A3-10
Value applied: N/A
Justification of choice of data or description of
measurement methods and procedures applied:
Any Comment: N/A
Data Unit / Parameter: TBabtr
Data unit: kg tree-1 or t tree-1
Description: Above-ground biomass of tree tr
Source of data: calculated , Equation A3-11, A3-13, A3-21
Value applied: N/A
Justification of choice of data or description of
measurement methods and procedures applied:
Any Comment: N/A
Data Unit / Parameter: TCabtr
Data unit: kg C tree-1 or t C tree-1
Description: Carbon stock in above-ground biomass of tree tr
Source of data: calculated , Equation A3-11, A3-21
Value applied: N/A
Justification of choice of data or description of
measurement methods and procedures applied:
Any Comment: N/A
Data Unit / Parameter: TCbbtr
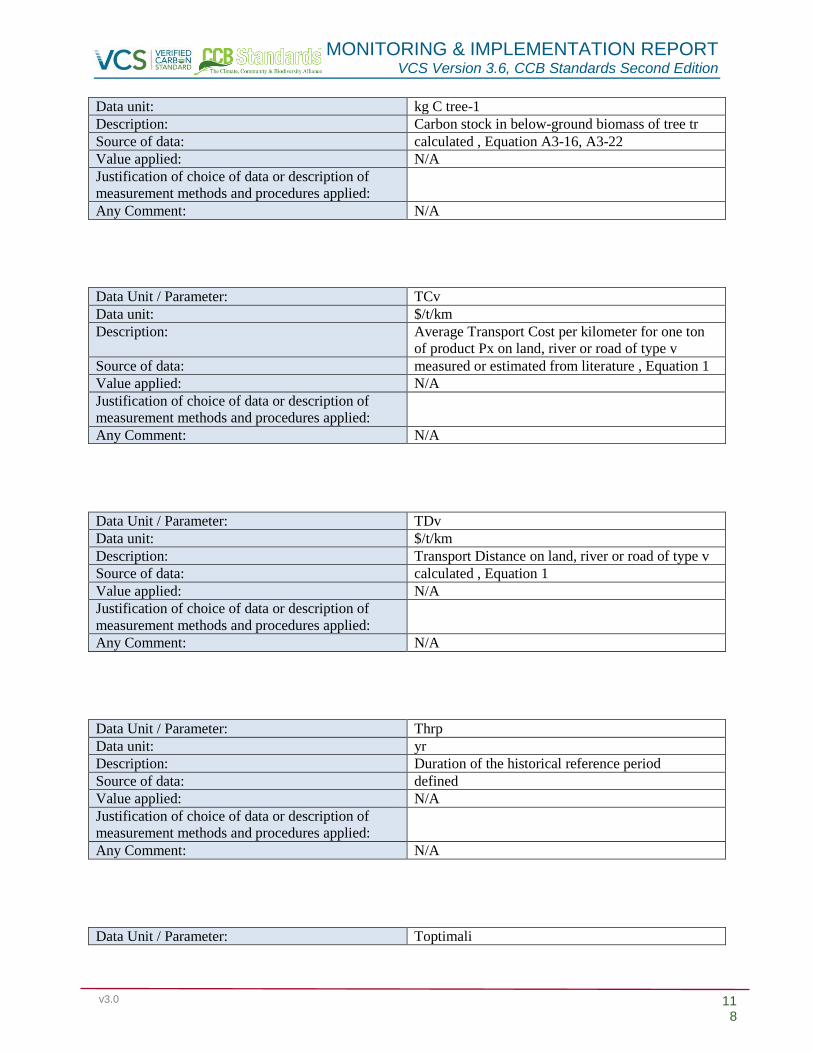
MONITORING & IMPLEMENTATION REPORT VCS Version 3.6, CCB Standards Second Edition
v3.0 118
Data unit: kg C tree-1
Description: Carbon stock in below-ground biomass of tree tr
Source of data: calculated , Equation A3-16, A3-22
Value applied: N/A
Justification of choice of data or description of
measurement methods and procedures applied:
Any Comment: N/A
Data Unit / Parameter: TCv
Data unit: $/t/km
Description: Average Transport Cost per kilometer for one ton
of product Px on land, river or road of type v
Source of data: measured or estimated from literature , Equation 1
Value applied: N/A
Justification of choice of data or description of
measurement methods and procedures applied:
Any Comment: N/A
Data Unit / Parameter: TDv
Data unit: $/t/km
Description: Transport Distance on land, river or road of type v
Source of data: calculated , Equation 1
Value applied: N/A
Justification of choice of data or description of
measurement methods and procedures applied:
Any Comment: N/A
Data Unit / Parameter: Thrp
Data unit: yr
Description: Duration of the historical reference period
Source of data: defined
Value applied: N/A
Justification of choice of data or description of
measurement methods and procedures applied:
Any Comment: N/A
Data Unit / Parameter: Toptimali

MONITORING & IMPLEMENTATION REPORT VCS Version 3.6, CCB Standards Second Edition
v3.0 119
Data unit: yr
Description: Number of years since the start of the AUD project
activity in which Aoptimal in stratum i is
deforested in the baseline case
Source of data: calculated
Value applied: N/A
Justification of choice of data or description of
measurement methods and procedures applied:
Any Comment: N/A
Data Unit / Parameter: toptimali
Data unit: yr
Description: Year at which Toptimali ends
Source of data: calculated , Equation 5, 6
Value applied: N/A
Justification of choice of data or description of
measurement methods and procedures applied:
Any Comment: N/A
Data Unit / Parameter: tr
Data unit: dimensionless
Description: 1, 2, 3, … TRpl number of trees in plot pl
Source of data: measured or estimated from literature , Equation
A3-13
Value applied: N/A
Justification of choice of data or description of
measurement methods and procedures applied:
Any Comment: N/A
Data Unit / Parameter: tst
Data unit: dimensionless
Description: t-student value for a 95% confidence level (initial
value t = 2)
Source of data: , Equation A3-1
Value applied: N/A
Justification of choice of data or description of
measurement methods and procedures applied:
Any Comment: N/A

MONITORING & IMPLEMENTATION REPORT VCS Version 3.6, CCB Standards Second Edition
v3.0 120
Data Unit / Parameter: Tsub-optimali
Data unit: yr
Description: Number of years in which Asub-optimali is
deforested in the baseline case
Source of data: calculated
Value applied: N/A
Justification of choice of data or description of
measurement methods and procedures applied:
Any Comment: N/A
Data Unit / Parameter: v
Data unit: dimensionless
Description: 1,2,3, …V type of surface on which transport
occurs
Source of data: measured or estimated from literature , Equation 1
Value applied: N/A
Justification of choice of data or description of
measurement methods and procedures applied:
Any Comment: N/A
Data Unit / Parameter: V1i,t; V2i,t; ...;Vni,t
Data unit:
Description: Variables included in a deforestation model
Source of data: measured or estimated from literature , Equation 8
Value applied: N/A
Justification of choice of data or description of
measurement methods and procedures applied:
Any Comment: Unit of each variable to be specified by the project
proponent
Data Unit / Parameter: VBCt
Data unit: t CO2-e
Description: Number of Buffer Credits deposited in the VCS
Buffer at time t;
Source of data: calculated , Equation 20, 21, Table 36
Value applied: See Accounting Model, PD Template Table AP
Justification of choice of data or description of
measurement methods and procedures applied:

MONITORING & IMPLEMENTATION REPORT VCS Version 3.6, CCB Standards Second Edition
v3.0 121
Any Comment:
Data Unit / Parameter: VCUt
Data unit: t CO2-e
Description: Number of Verified Carbon Units (VCUs) to be
made available for trade at time t
Source of data: calculated , Equation 20,Table 36
Value applied: See Accounting Model, PD Template Table AP
Justification of choice of data or description of
measurement methods and procedures applied:
Any Comment:
Data Unit / Parameter: VEF
Data unit: dimensionless
Description: Volume Expansion Factor
Source of data: measured or estimated from literature , Equation
A3-9
Value applied: N/A
Justification of choice of data or description of
measurement methods and procedures applied:
Any Comment: N/A
Data Unit / Parameter: VEXw,j,fcl,t
Data unit: m3
Description: Volume of timber for product class w, of species j,
extracted from within forest class fcl at time t
Source of data: measured or estimated from literature , Equation
A3-34
Value applied: N/A
Justification of choice of data or description of
measurement methods and procedures applied:
Any Comment: N/A
Data Unit / Parameter: VOB10
Data unit: m3
Description: Volume Over Bark above 10 cm DBH
Source of data: measured or estimated from literature , Equation

MONITORING & IMPLEMENTATION REPORT VCS Version 3.6, CCB Standards Second Edition
v3.0 122
A3-9
Value applied: N/A
Justification of choice of data or description of
measurement methods and procedures applied:
Any Comment: N/A
Data Unit / Parameter: VOB30
Data unit: m3
Description: Volume Over Bark above 30 cm DBH
Source of data: measured or estimated from literature , Equation
A3-9
Value applied: N/A
Justification of choice of data or description of
measurement methods and procedures applied:
Any Comment: N/A
Data Unit / Parameter: Volumedc
Data unit: m3
Description: Volume of lying dead wood in the density class dc
Source of data: measured or estimated from literature , Equation
A3-30
Value applied: N/A
Justification of choice of data or description of
measurement methods and procedures applied:
Any Comment: N/A
Data Unit / Parameter: Vpl
Data unit: m3 plot-1
Description: Commercial volume of plot pl
Source of data: , Equation A3-19
Value applied: N/A
Justification of choice of data or description of
measurement methods and procedures applied:
Any Comment: N/A
Data Unit / Parameter: Vtr
Data unit: m3

MONITORING & IMPLEMENTATION REPORT VCS Version 3.6, CCB Standards Second Edition
v3.0 123
Description: Commercial volume of tree tr
Source of data: measured or estimated from literature , Equation
A3-18, A3-21
Value applied: N/A
Justification of choice of data or description of
measurement methods and procedures applied:
Any Comment: N/A
Data Unit / Parameter: w
Data unit: dimensionless
Description: 1, 2, 3 … W Wood product class (sawn-wood,
wood-based panels, other industrial round-wood,
paper and paper board, and other);
Source of data: defined , Equation A3-34
Value applied: N/A
Justification of choice of data or description of
measurement methods and procedures applied:
Any Comment: N/A
Data Unit / Parameter: Wcl
Data unit:
Description: Ncl/N
Source of data: , Equation A3-4
Value applied: N/A
Justification of choice of data or description of
measurement methods and procedures applied:
Any Comment: N/A
Data Unit / Parameter: WWw
Data unit: dimensionless
Description: Wood waste for wood product class w. The fraction
immediately emitted through mill inefficiency
Source of data: measured or estimated from literature , Equation
A3-35, A3-37
Value applied: N/A
Justification of choice of data or description of
measurement methods and procedures applied:
Any Comment: N/A
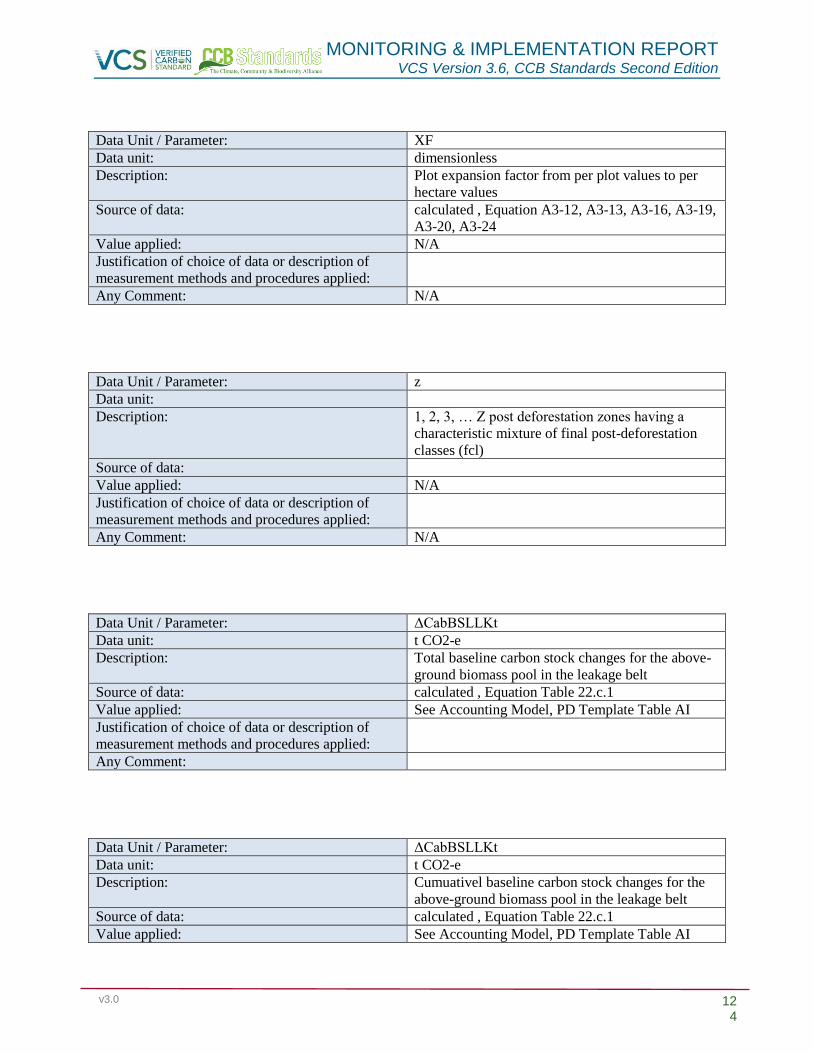
MONITORING & IMPLEMENTATION REPORT VCS Version 3.6, CCB Standards Second Edition
v3.0 124
Data Unit / Parameter: XF
Data unit: dimensionless
Description: Plot expansion factor from per plot values to per
hectare values
Source of data: calculated , Equation A3-12, A3-13, A3-16, A3-19,
A3-20, A3-24
Value applied: N/A
Justification of choice of data or description of
measurement methods and procedures applied:
Any Comment: N/A
Data Unit / Parameter: z
Data unit:
Description: 1, 2, 3, … Z post deforestation zones having a
characteristic mixture of final post-deforestation
classes (fcl)
Source of data:
Value applied: N/A
Justification of choice of data or description of
measurement methods and procedures applied:
Any Comment: N/A
Data Unit / Parameter: ΔCabBSLLKt
Data unit: t CO2-e
Description: Total baseline carbon stock changes for the above-
ground biomass pool in the leakage belt
Source of data: calculated , Equation Table 22.c.1
Value applied: See Accounting Model, PD Template Table AI
Justification of choice of data or description of
measurement methods and procedures applied:
Any Comment:
Data Unit / Parameter: ΔCabBSLLKt
Data unit: t CO2-e
Description: Cumuativel baseline carbon stock changes for the
above-ground biomass pool in the leakage belt
Source of data: calculated , Equation Table 22.c.1
Value applied: See Accounting Model, PD Template Table AI

MONITORING & IMPLEMENTATION REPORT VCS Version 3.6, CCB Standards Second Edition
v3.0 125
Justification of choice of data or description of
measurement methods and procedures applied:
Any Comment:
Data Unit / Parameter: ΔCabBSLPA
Data unit: t CO2-e
Description: Cumulative baseline carbon stock changes for the
above-ground biomass pool in the project area
Source of data: calculated , Equation Table 22.b.1
Value applied: See Accounting Model, PD Template Table AE
Justification of choice of data or description of
measurement methods and procedures applied:
Any Comment:
Data Unit / Parameter: ΔCabBSLPAt
Data unit: t CO2-e
Description: Total baseline carbon stock changes for the above-
ground biomass pool in the project area
Source of data: calculated , Equation Table 22.b.1
Value applied: See Accounting Model, PD Template Table AE
Justification of choice of data or description of
measurement methods and procedures applied:
Any Comment:
Data Unit / Parameter: ΔCabBSLRR
Data unit: t CO2-e
Description: Cumulative baseline carbon stock changes for the
above-ground biomass pool in the reference region
Source of data: calculated , Equation Table 22.a.1
Value applied: NA
Justification of choice of data or description of
measurement methods and procedures applied:
Any Comment:
Data Unit / Parameter: ΔCabBSLRRt
Data unit: t CO2-e
Description: Total baseline carbon stock changes for the above-
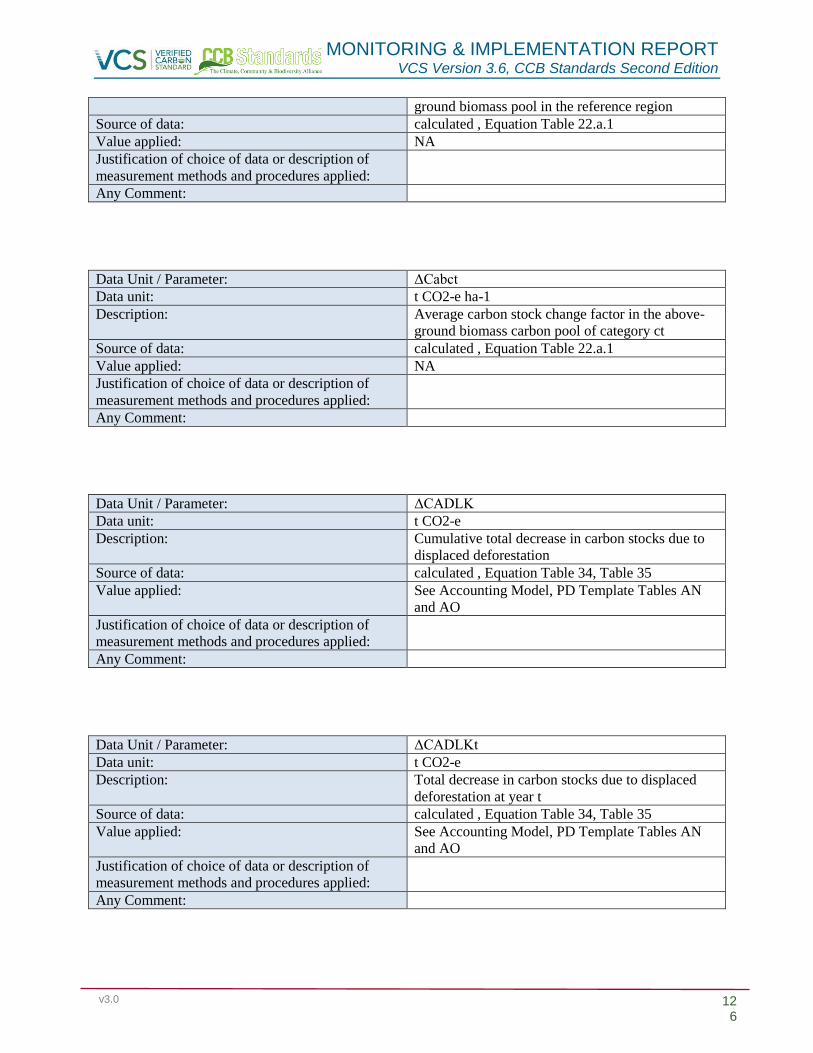
MONITORING & IMPLEMENTATION REPORT VCS Version 3.6, CCB Standards Second Edition
v3.0 126
ground biomass pool in the reference region
Source of data: calculated , Equation Table 22.a.1
Value applied: NA
Justification of choice of data or description of
measurement methods and procedures applied:
Any Comment:
Data Unit / Parameter: ΔCabct
Data unit: t CO2-e ha-1
Description: Average carbon stock change factor in the above-
ground biomass carbon pool of category ct
Source of data: calculated , Equation Table 22.a.1
Value applied: NA
Justification of choice of data or description of
measurement methods and procedures applied:
Any Comment:
Data Unit / Parameter: ΔCADLK
Data unit: t CO2-e
Description: Cumulative total decrease in carbon stocks due to
displaced deforestation
Source of data: calculated , Equation Table 34, Table 35
Value applied: See Accounting Model, PD Template Tables AN
and AO
Justification of choice of data or description of
measurement methods and procedures applied:
Any Comment:
Data Unit / Parameter: ΔCADLKt
Data unit: t CO2-e
Description: Total decrease in carbon stocks due to displaced
deforestation at year t
Source of data: calculated , Equation Table 34, Table 35
Value applied: See Accounting Model, PD Template Tables AN
and AO
Justification of choice of data or description of
measurement methods and procedures applied:
Any Comment:

MONITORING & IMPLEMENTATION REPORT VCS Version 3.6, CCB Standards Second Edition
v3.0 127
Data Unit / Parameter: ΔCbbct
Data unit: t CO2-e ha-1
Description: Average carbon stock change factor in the below-
ground biomass carbon pool of category ct
Source of data: calculated
Value applied: NA
Justification of choice of data or description of
measurement methods and procedures applied:
Any Comment:
Data Unit / Parameter: ΔCBSLLK
Data unit: t CO2-e
Description: Cumulative carbon stock changes in leakage
management areas in the baseline case
Source of data: calculated , Equation Table 21d, Table 30a, Table
30c
Value applied: See Accounting Model, MR Template Table BG
Justification of choice of data or description of
measurement methods and procedures applied:
Any Comment:
Data Unit / Parameter: ΔCBSLLKt
Data unit: t CO2-e
Description: Annual carbon stock changes in leakage
management areas in the baseline case at year t
Source of data: calculated , Equation Table 21d, Table 30a, Table
30c
Value applied: See Accounting Model, MR Template Table BG
Justification of choice of data or description of
measurement methods and procedures applied:
Any Comment:
Data Unit / Parameter: ΔCBSLPA
Data unit: t CO2-e
Description: Total baseline carbon stock changes in the project
area
Source of data: calculated , Equation Table 36
Value applied: See Accounting Model, PD Template Table AP

MONITORING & IMPLEMENTATION REPORT VCS Version 3.6, CCB Standards Second Edition
v3.0 128
Justification of choice of data or description of
measurement methods and procedures applied:
Any Comment:
Data Unit / Parameter: ΔCBSLPA
Data unit: t CO2-e
Description: Total net cumulative baseline carbon stock change
in final classes within the project area at year t
Source of data: calculated , Equation 10
Value applied: See Accounting Model, PD Template Table AP
Justification of choice of data or description of
measurement methods and procedures applied:
Any Comment:
Data Unit / Parameter: ΔCBSLPAf
Data unit: t CO2-e
Description: Total cumulative baseline carbon stock change in
final classes within the project area at year t
Source of data: calculated
Value applied: See Accounting Model, PD Template Table AP
Justification of choice of data or description of
measurement methods and procedures applied:
Any Comment:
Data Unit / Parameter: ΔCBSLPAft
Data unit: t CO2-e
Description: Total baseline carbon stock change in final classes
within the project area at year t
Source of data: calculated
Value applied: See Accounting Model, PD Template Table AP
Justification of choice of data or description of
measurement methods and procedures applied:
Any Comment:
Data Unit / Parameter: ΔCBSLPAft
Data unit: t CO2-e
Description: Total annual baseline carbon stock change in final

MONITORING & IMPLEMENTATION REPORT VCS Version 3.6, CCB Standards Second Edition
v3.0 129
classes within the project area at year t
Source of data: calculated
Value applied: See Accounting Model, PD Template Table AP
Justification of choice of data or description of
measurement methods and procedures applied:
Any Comment:
Data Unit / Parameter: ΔCBSLPAi
Data unit: t CO2-e
Description: Total cumulative baseline carbon stock change in
initial forest classes within the project area at year t
Source of data: calculated
Value applied: See Accounting Model, PD Template Table AP
Justification of choice of data or description of
measurement methods and procedures applied:
Any Comment:
Data Unit / Parameter: ΔCBSLPAit
Data unit: t CO2-e
Description: Total baseline carbon stock change in initial forest
classes within the project area at year t
Source of data: calculated
Value applied: See Accounting Model, PD Template Table AP
Justification of choice of data or description of
measurement methods and procedures applied:
Any Comment:
Data Unit / Parameter: ΔCBSLPAt
Data unit: t CO2-e
Description: Total baseline carbon stock change within the
project area at year t
Source of data: calculated , Equation 19, 21, Table 36
Value applied: See Accounting Model, PD Template Table AP
Justification of choice of data or description of
measurement methods and procedures applied:
Any Comment:

MONITORING & IMPLEMENTATION REPORT VCS Version 3.6, CCB Standards Second Edition
v3.0 130
Data Unit / Parameter: ΔCBSLt
Data unit: tCO2-e
Description: Total baseline carbon stock change at year t in the
project area
Source of data: calculated , Equation 16
Value applied: See Accounting Model, PD Template Table AP
Justification of choice of data or description of
measurement methods and procedures applied:
Any Comment:
Data Unit / Parameter: ΔCdwct
Data unit: t CO2-e ha-1
Description: Average carbon stock change factor in the dead
wood biomass carbon pool of category ct
Source of data: calculated
Value applied: See Accounting Model, PD Template Table AP
Justification of choice of data or description of
measurement methods and procedures applied:
Any Comment:
Data Unit / Parameter: ΔClct
Data unit: t CO2-e ha-1
Description: Average carbon stock change factor in the litter
carbon pool of category ct
Source of data: calculated
Value applied: See Accounting Model, PD Template
Justification of choice of data or description of
measurement methods and procedures applied:
Any Comment:
Data Unit / Parameter: ΔCLK
Data unit: t CO2-e
Description: Total cumulative decrease in carbon stocks within
the leakage belt at year t
Source of data: calculated , Equation Table 35, Table 36
Value applied: See Accounting Model, PD Template Tables AO
and AP
Justification of choice of data or description of
measurement methods and procedures applied:
Any Comment:
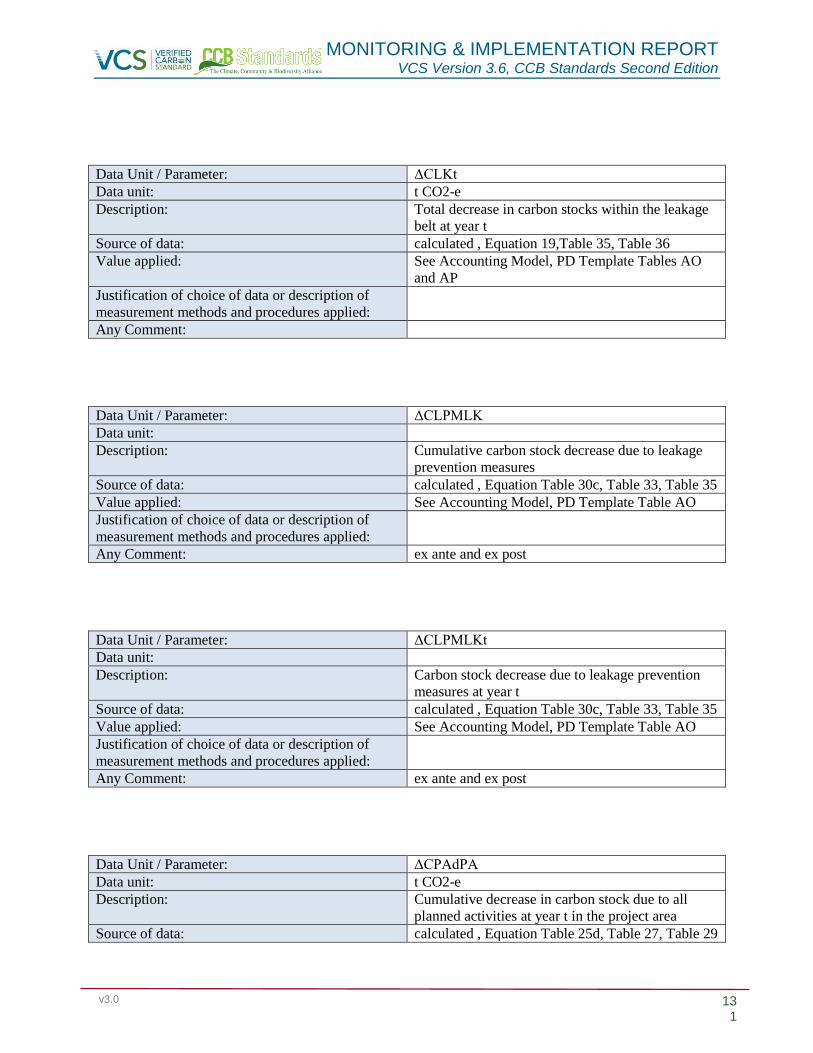
MONITORING & IMPLEMENTATION REPORT VCS Version 3.6, CCB Standards Second Edition
v3.0 131
Data Unit / Parameter: ΔCLKt
Data unit: t CO2-e
Description: Total decrease in carbon stocks within the leakage
belt at year t
Source of data: calculated , Equation 19,Table 35, Table 36
Value applied: See Accounting Model, PD Template Tables AO
and AP
Justification of choice of data or description of
measurement methods and procedures applied:
Any Comment:
Data Unit / Parameter: ΔCLPMLK
Data unit:
Description: Cumulative carbon stock decrease due to leakage
prevention measures
Source of data: calculated , Equation Table 30c, Table 33, Table 35
Value applied: See Accounting Model, PD Template Table AO
Justification of choice of data or description of
measurement methods and procedures applied:
Any Comment: ex ante and ex post
Data Unit / Parameter: ΔCLPMLKt
Data unit:
Description: Carbon stock decrease due to leakage prevention
measures at year t
Source of data: calculated , Equation Table 30c, Table 33, Table 35
Value applied: See Accounting Model, PD Template Table AO
Justification of choice of data or description of
measurement methods and procedures applied:
Any Comment: ex ante and ex post
Data Unit / Parameter: ΔCPAdPA
Data unit: t CO2-e
Description: Cumulative decrease in carbon stock due to all
planned activities at year t in the project area
Source of data: calculated , Equation Table 25d, Table 27, Table 29

MONITORING & IMPLEMENTATION REPORT VCS Version 3.6, CCB Standards Second Edition
v3.0 132
Value applied: See Accounting Model, PD Template Table AM
Justification of choice of data or description of
measurement methods and procedures applied:
Any Comment: ex ante and ex post
Data Unit / Parameter: ΔCPAdPAt
Data unit: t CO2-e
Description: Total decrease in carbon stock due to all planned
activities at year t in the project area
Source of data: calculated , Equation Table 26d, Table 27, Table 29
Value applied: See Accounting Model, PD Template Table AM
Justification of choice of data or description of
measurement methods and procedures applied:
Any Comment: ex ante and ex post
Data Unit / Parameter: ΔCPAiPA
Data unit: t CO2-e
Description: Cumulative increase in carbon stock due to all
planned activities at year t in the project area
Source of data: calculated , Equation Table 26d, Table 27, Table 29
Value applied: See Accounting Model, PD Template Table AM
Justification of choice of data or description of
measurement methods and procedures applied:
Any Comment: ex ante and ex post
Data Unit / Parameter: ΔCPAiPAt
Data unit: t CO2-e
Description: Total increase in carbon stock due to all planned
activities at year t in the project area
Source of data: calculated , Equation Table 25a
Value applied: NA
Justification of choice of data or description of
measurement methods and procedures applied:
Any Comment: ex ante and ex post
Data Unit / Parameter: ΔCPDdPA
Data unit: t CO2-e

MONITORING & IMPLEMENTATION REPORT VCS Version 3.6, CCB Standards Second Edition
v3.0 133
Description: Cumulative decrease in carbon stock due to
planned deforestation at year t in the project area
Source of data: calculated , Equation Table 25a
Value applied: NA
Justification of choice of data or description of
measurement methods and procedures applied:
Any Comment: ex ante and ex post
Data Unit / Parameter: ΔCPDdPAt
Data unit: t CO2-e
Description: Total decrease in carbon stock due to planned
deforestation at year t in the project area
Source of data: calculated , Equation Table 25c, Table 25d
Value applied: NA
Justification of choice of data or description of
measurement methods and procedures applied:
Any Comment: ex ante and ex post
Data Unit / Parameter: ΔCPFdPA
Data unit: t CO2-e
Description: Cumulative decrease in carbon stock due to
planned fuel-wood and charcoal activities at year t
in the project area
Source of data: calculated
Value applied: NA
Justification of choice of data or description of
measurement methods and procedures applied:
Any Comment: ex ante and ex post
Data Unit / Parameter: ΔCPFdPAt
Data unit: t CO2-e
Description: Total decrease in carbon stock due to planned fuel-
wood and charcoal activities at year t in the project
area
Source of data: calculated , Equation Table 25c, Table 25d
Value applied: NA
Justification of choice of data or description of
measurement methods and procedures applied:
Any Comment: ex ante and ex post

MONITORING & IMPLEMENTATION REPORT VCS Version 3.6, CCB Standards Second Edition
v3.0 134
Data Unit / Parameter: ΔCPFiPA
Data unit: t CO2-e
Description: Cumulative increase in carbon stock due to planned
fuel-wood and charcoal activities at year t in the
project area
Source of data: calculated , Equation Table 26c, Table 26d
Value applied: NA
Justification of choice of data or description of
measurement methods and procedures applied:
Any Comment: ex ante and ex post
Data Unit / Parameter: ΔCPFiPAt
Data unit: t CO2-e
Description: Total increase in carbon stock due to planned fuel-
wood and charcoal activities at year t in the project
area
Source of data: calculated , Equation Table 26c, Table 26d
Value applied: NA
Justification of choice of data or description of
measurement methods and procedures applied:
Any Comment: ex ante and ex post
Data Unit / Parameter: ΔCpicl,t=t*
Data unit: tCO2-e ha-1
Description: Average carbon stock change factor for carbon
pool p in the initial forest class icl applicable at
time t
Source of data: , Equation 10
Value applied: N/A
Justification of choice of data or description of
measurement methods and procedures applied:
Any Comment: N/A
Data Unit / Parameter: ΔCPLdPA
Data unit: t CO2-e
Description: Cumulative decrease in carbon stock due to
planned logging activities at year t in the project
area

MONITORING & IMPLEMENTATION REPORT VCS Version 3.6, CCB Standards Second Edition
v3.0 135
Source of data: calculated , Equation Table 25b, Table 25d
Value applied: NA
Justification of choice of data or description of
measurement methods and procedures applied:
Any Comment: ex ante and ex post
Data Unit / Parameter: ΔCPLdPAt
Data unit: t CO2-e
Description: Total decrease in carbon stock due to planned
logging activities at year t in the project area
Source of data: calculated , Equation Table 25b, Table 25d
Value applied: NA
Justification of choice of data or description of
measurement methods and procedures applied:
Any Comment: ex ante and ex post
Data Unit / Parameter: ΔCPLiPA
Data unit: t CO2-e
Description: Cumulative increase in carbon stock due to planned
logging activities at year t in the project area
Source of data: calculated , Equation Table 26b, Table 26d
Value applied: NA
Justification of choice of data or description of
measurement methods and procedures applied:
Any Comment: ex ante and ex post
Data Unit / Parameter: ΔCPLiPAt
Data unit: t CO2-e
Description: Total increase in carbon stock due to planned
logging activities at year t in the project area
Source of data: calculated , Equation Table 26b, Table 26d
Value applied: NA
Justification of choice of data or description of
measurement methods and procedures applied:
Any Comment: ex ante and ex post
Data Unit / Parameter: ΔCPNiPA

MONITORING & IMPLEMENTATION REPORT VCS Version 3.6, CCB Standards Second Edition
v3.0 136
Data unit: t CO2-e
Description: Cumulative increase in carbon stock due to planned
protection of growing forest classes in the project
area at year t
Source of data: calculated , Equation Table 26a, Table 26d
Value applied: NA
Justification of choice of data or description of
measurement methods and procedures applied:
Any Comment: ex ante and ex post
Data Unit / Parameter: ΔCPNiPAt
Data unit: t CO2-e
Description: Total increase in carbon stock due to planned
protection of growing forest classes in the project
area at year t
Source of data: calculated , Equation Table 26a, Table 26d
Value applied: NA
Justification of choice of data or description of
measurement methods and procedures applied:
Any Comment: ex ante and ex post
Data Unit / Parameter: ΔCPSLK
Data unit: t CO2-e
Description: Total cumulative carbon stock change in leakage
management areas in the project case
Source of data: calculated , Equation Table 30b, Table 30c
Value applied: NA
Justification of choice of data or description of
measurement methods and procedures applied:
Any Comment: ex ante and ex post
Data Unit / Parameter: ΔCPSLKt
Data unit: t CO2-e
Description: Total annual carbon stock change in leakage
management areas in the project case
Source of data: calculated , Equation Table 30b, Table 30c
Value applied: NA
Justification of choice of data or description of
measurement methods and procedures applied:
Any Comment: ex ante and ex post

MONITORING & IMPLEMENTATION REPORT VCS Version 3.6, CCB Standards Second Edition
v3.0 137
Data Unit / Parameter: ΔCPSPA
Data unit: t CO2-e
Description: Cumulative project carbon stock change within the
project area at year t
Source of data: calculated , Equation Table 27, Table 29, Table 36
Value applied: See Accounting Model, PD Template Table AP
Justification of choice of data or description of
measurement methods and procedures applied:
Any Comment: ex ante and ex post
Data Unit / Parameter: ΔCPSPAt
Data unit: t CO2-e
Description: Total project carbon stock change within the
project area at year t
Source of data: calculated , Equation 19, 21, Table 27, Table 29,
Table 36
Value applied: See Accounting Model, PD Template Table AP
Justification of choice of data or description of
measurement methods and procedures applied:
Any Comment: ex ante and ex post
Data Unit / Parameter: ΔCpt
Data unit: t CO2-e
Description: Carbon stock change factor applicable to pool p at
time t
Source of data: calculated , Equation Table 25d, Table 27, Table 29
Value applied: See Accounting Model, PD Template Table AM
Justification of choice of data or description of
measurement methods and procedures applied:
Any Comment:
Data Unit / Parameter: ΔCpz,t=t*
Data unit: tCO2-e ha-1
Description: Average carbon stock change factor for carbon
pool p in zone z applicable at time t = t*
Source of data: calculated , Equation 10
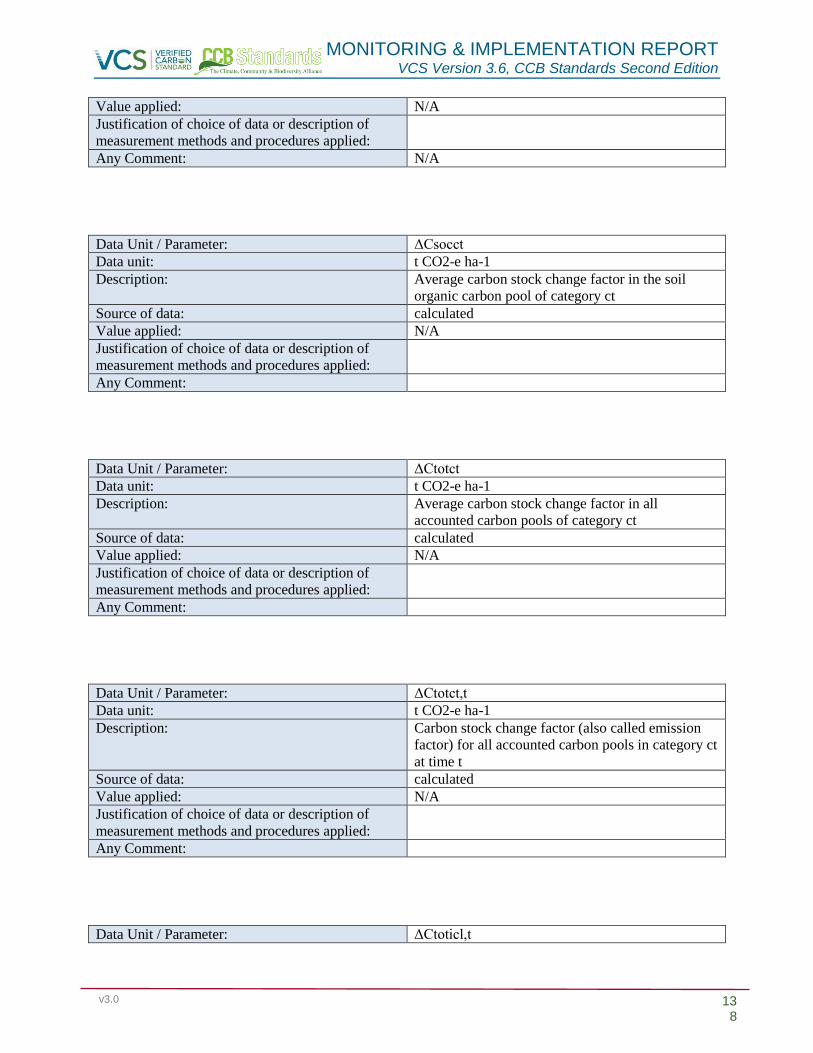
MONITORING & IMPLEMENTATION REPORT VCS Version 3.6, CCB Standards Second Edition
v3.0 138
Value applied: N/A
Justification of choice of data or description of
measurement methods and procedures applied:
Any Comment: N/A
Data Unit / Parameter: ΔCsocct
Data unit: t CO2-e ha-1
Description: Average carbon stock change factor in the soil
organic carbon pool of category ct
Source of data: calculated
Value applied: N/A
Justification of choice of data or description of
measurement methods and procedures applied:
Any Comment:
Data Unit / Parameter: ΔCtotct
Data unit: t CO2-e ha-1
Description: Average carbon stock change factor in all
accounted carbon pools of category ct
Source of data: calculated
Value applied: N/A
Justification of choice of data or description of
measurement methods and procedures applied:
Any Comment:
Data Unit / Parameter: ΔCtotct,t
Data unit: t CO2-e ha-1
Description: Carbon stock change factor (also called emission
factor) for all accounted carbon pools in category ct
at time t
Source of data: calculated
Value applied: N/A
Justification of choice of data or description of
measurement methods and procedures applied:
Any Comment:
Data Unit / Parameter: ΔCtoticl,t

MONITORING & IMPLEMENTATION REPORT VCS Version 3.6, CCB Standards Second Edition
v3.0 139
Data unit: t CO2-e ha-1
Description: Average carbon stock change of all accounted
carbon pools in forest class icl at time t
Source of data: calculated , Equation Table 25b, Table 25c, Table
25e, Table 25f, Table 26a, Table 26b, Table 26c,
Table 26e, Table 26f
Value applied: NA
Justification of choice of data or description of
measurement methods and procedures applied:
Any Comment:
Data Unit / Parameter: ΔCUDdPA
Data unit: t CO2-e
Description: Cumulative actual carbon stock change due to
unavoided unplanned deforestation at year t in the
project area
Source of data: calculated , Equation Table 27, Table 29
Value applied: See Accounting Model, PD Template Table AM
Justification of choice of data or description of
measurement methods and procedures applied:
Any Comment: ex ante and ex post
Data Unit / Parameter: ΔCUDdPAt
Data unit: t CO2-e
Description: Total actual carbon stock change due to unavoided
unplanned deforestation at year t in the project area
Source of data: calculated , Equation 16,Table 27 Table 29
Value applied: See Accounting Model, PD Template Table AM
Justification of choice of data or description of
measurement methods and procedures applied:
Any Comment: ex ante and ex post
Data Unit / Parameter: ΔCwpct
Data unit: t CO2-e ha-1
Description: Average carbon stock change factor in the
harvested wood products carbon pool of category ct
Source of data: calculated
Value applied: NA
Justification of choice of data or description of
measurement methods and procedures applied:
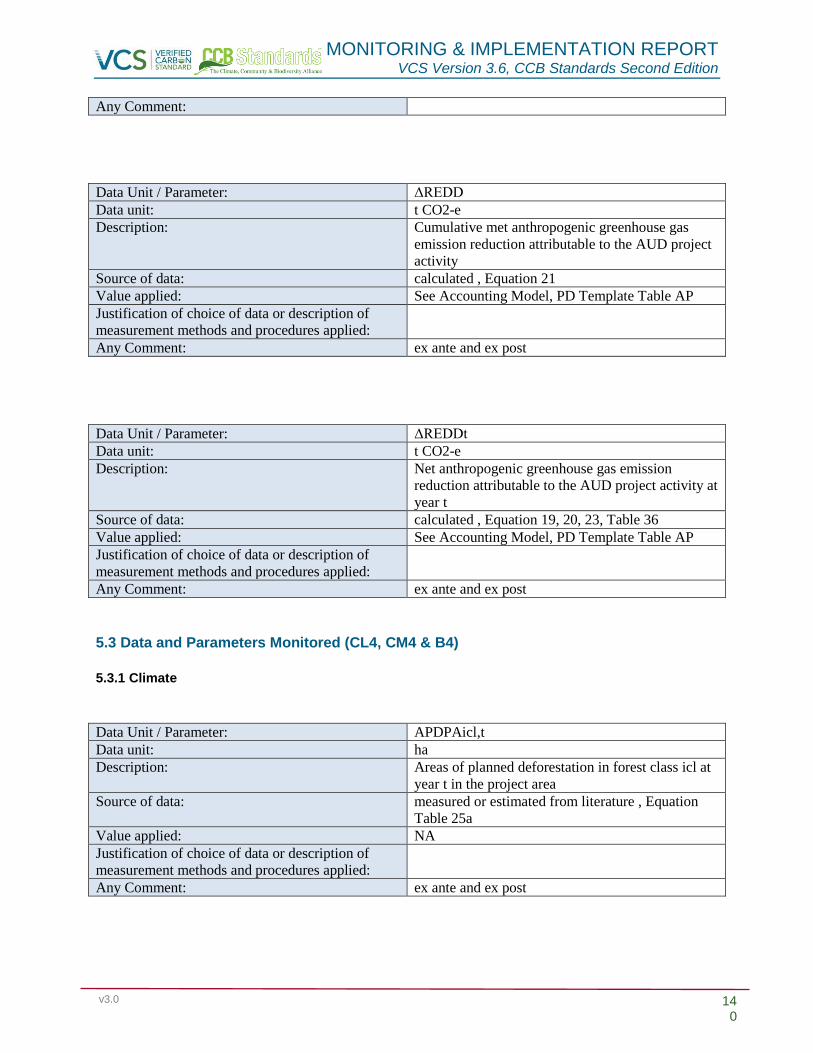
MONITORING & IMPLEMENTATION REPORT VCS Version 3.6, CCB Standards Second Edition
v3.0 140
Any Comment:
Data Unit / Parameter: ΔREDD
Data unit: t CO2-e
Description: Cumulative met anthropogenic greenhouse gas
emission reduction attributable to the AUD project
activity
Source of data: calculated , Equation 21
Value applied: See Accounting Model, PD Template Table AP
Justification of choice of data or description of
measurement methods and procedures applied:
Any Comment: ex ante and ex post
Data Unit / Parameter: ΔREDDt
Data unit: t CO2-e
Description: Net anthropogenic greenhouse gas emission
reduction attributable to the AUD project activity at
year t
Source of data: calculated , Equation 19, 20, 23, Table 36
Value applied: See Accounting Model, PD Template Table AP
Justification of choice of data or description of
measurement methods and procedures applied:
Any Comment: ex ante and ex post
5.3 Data and Parameters Monitored (CL4, CM4 & B4)
5.3.1 Climate
Data Unit / Parameter: APDPAicl,t
Data unit: ha
Description: Areas of planned deforestation in forest class icl at
year t in the project area
Source of data: measured or estimated from literature , Equation
Table 25a
Value applied: NA
Justification of choice of data or description of
measurement methods and procedures applied:
Any Comment: ex ante and ex post

MONITORING & IMPLEMENTATION REPORT VCS Version 3.6, CCB Standards Second Edition
v3.0 141
Data Unit / Parameter: APFPA icl,t
Data unit: ha
Description: Annual area of planned fuel-wood and charcoal
activities in forest class icl at year t in the project
area
Source of data: calculated ex ante, measured ex post , Equation
Table 25, Table 26c
Value applied: NA
Justification of choice of data or description of
measurement methods and procedures applied:
Any Comment: ex ante and ex post
Data Unit / Parameter: APLPAicl,t
Data unit: ha
Description: Areas of planned logging activities in forest class
icl at year t in the project area
Source of data: calculated ex ante, measured ex post , Equation
Table 25b, Table 26b
Value applied: NA
Justification of choice of data or description of
measurement methods and procedures applied:
Any Comment: ex ante and ex post
Data Unit / Parameter: APNiPAicl,t
Data unit: ha
Description: Annual area of forest class icl with increasing
carbon stock without harvest at year t in the project
area
Source of data: calculated ex ante, measured ex post , Equation
Table 26a
Value applied: NA
Justification of choice of data or description of
measurement methods and procedures applied:
Any Comment: ex ante and ex post
Data Unit / Parameter: CUCdPAt
Data unit: t CO2-e
Description: Total decrease in carbon stock due to catastrophic
events at year t in the project area
Source of data: calculated , Equation Table 25f, Table 25g
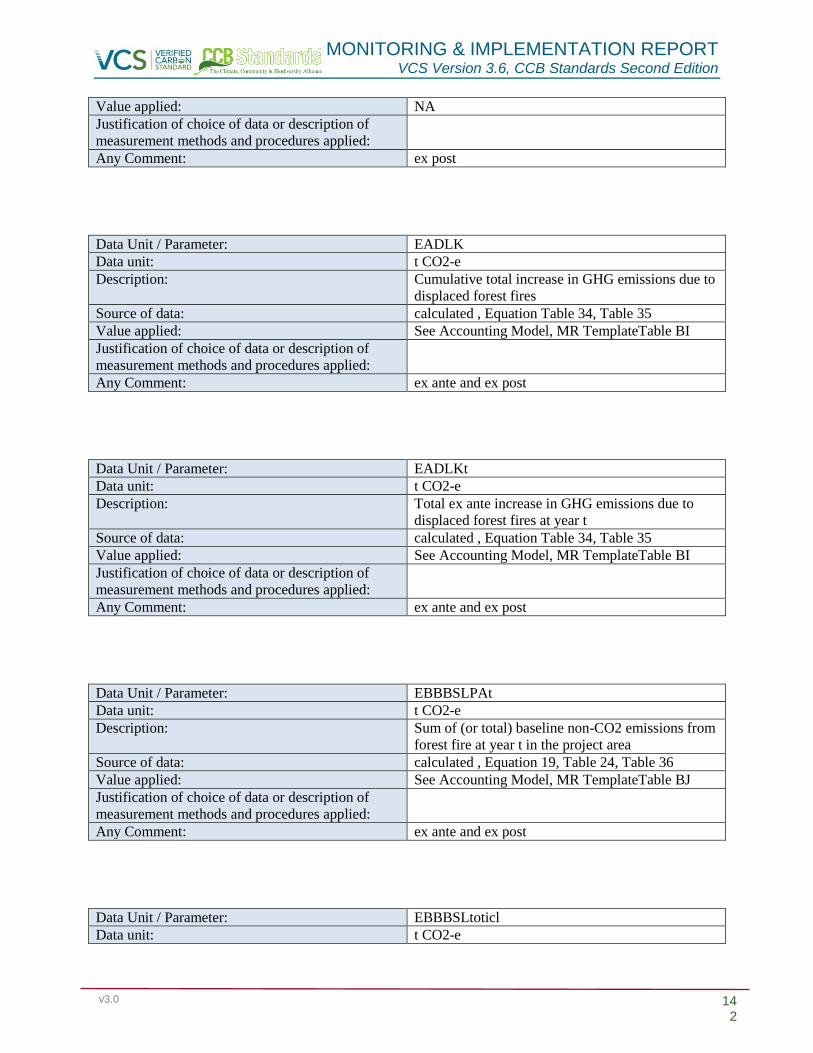
MONITORING & IMPLEMENTATION REPORT VCS Version 3.6, CCB Standards Second Edition
v3.0 142
Value applied: NA
Justification of choice of data or description of
measurement methods and procedures applied:
Any Comment: ex post
Data Unit / Parameter: EADLK
Data unit: t CO2-e
Description: Cumulative total increase in GHG emissions due to
displaced forest fires
Source of data: calculated , Equation Table 34, Table 35
Value applied: See Accounting Model, MR TemplateTable BI
Justification of choice of data or description of
measurement methods and procedures applied:
Any Comment: ex ante and ex post
Data Unit / Parameter: EADLKt
Data unit: t CO2-e
Description: Total ex ante increase in GHG emissions due to
displaced forest fires at year t
Source of data: calculated , Equation Table 34, Table 35
Value applied: See Accounting Model, MR TemplateTable BI
Justification of choice of data or description of
measurement methods and procedures applied:
Any Comment: ex ante and ex post
Data Unit / Parameter: EBBBSLPAt
Data unit: t CO2-e
Description: Sum of (or total) baseline non-CO2 emissions from
forest fire at year t in the project area
Source of data: calculated , Equation 19, Table 24, Table 36
Value applied: See Accounting Model, MR TemplateTable BJ
Justification of choice of data or description of
measurement methods and procedures applied:
Any Comment: ex ante and ex post
Data Unit / Parameter: EBBBSLtoticl
Data unit: t CO2-e

MONITORING & IMPLEMENTATION REPORT VCS Version 3.6, CCB Standards Second Edition
v3.0 143
Description: Sum of (or total) actual non-CO2 emissions from
forest fire at year t in strata i in forest class icl
Source of data: calculated , Equation Table 24
Value applied: NA
Justification of choice of data or description of
measurement methods and procedures applied:
Any Comment: ex ante and ex post
Data Unit / Parameter: EBBBSPA
Data unit: t CO2-e
Description: Cumulative baseline non-CO2 emissions from
forest fire at year t in the project area
Source of data: calculated , Equation 17, 19, Table 24, Table 36
Value applied: See Accounting Model, MR TemplateTable BJ
Justification of choice of data or description of
measurement methods and procedures applied:
Any Comment: ex ante and ex post
Data Unit / Parameter: EBBCH4icl
Data unit: t CO2-e
Description: CH4 emission from biomass burning in forest class
icl
Source of data: calculated , Equation 11, 13
Value applied: NA
Justification of choice of data or description of
measurement methods and procedures applied:
Any Comment: ex ante and ex post
Data Unit / Parameter: EBBN2Oicl
Data unit: t CO2-e
Description: N2O emission from biomass burning in forest class
icl
Source of data: calculated , Equation 11, 12
Value applied: NA
Justification of choice of data or description of
measurement methods and procedures applied:
Any Comment: ex ante and ex post

MONITORING & IMPLEMENTATION REPORT VCS Version 3.6, CCB Standards Second Edition
v3.0 144
Data Unit / Parameter: EBBPSPA
Data unit: t CO2-e
Description: Cumulative (or total) actual non-CO2 emissions
from forest fire at year t in the project area
Source of data: calculated , Equation Table 28, Table 29, Table 36
Value applied: See Accounting Model, MR TemplateTable BJ
Justification of choice of data or description of
measurement methods and procedures applied:
Any Comment: ex ante and ex post
Data Unit / Parameter: EBBPSPAt
Data unit: t CO2-e
Description: Sum of (or total) actual non-CO2 emissions from
forest fire at year t in the project area
Source of data: calculated , Equation 17,19, Table 28, Table 29,
Table 36
Value applied: See Accounting Model, MR TemplateTable BJ
Justification of choice of data or description of
measurement methods and procedures applied:
Any Comment: ex ante and ex post
Data Unit / Parameter: EBBtoticl
Data unit: t CO2-e
Description: Total GHG emission from biomass burning in
forest class icl
Source of data: calculated , Equation 11
Value applied: NA
Justification of choice of data or description of
measurement methods and procedures applied:
Any Comment: ex ante and ex post
Data Unit / Parameter: ΔCFCdPA
Data unit: t CO2-e
Description: Cumulative decrease in carbon stock due to forest
fires and catastrophic events at year t in the project
area
Source of data: calculated , Equation Table 25g, Table 27
Value applied: NA
Justification of choice of data or description of
measurement methods and procedures applied:

MONITORING & IMPLEMENTATION REPORT VCS Version 3.6, CCB Standards Second Edition
v3.0 145
Any Comment: ex post
Data Unit / Parameter: ΔCFCdPAt
Data unit: t CO2-e
Description: Total decrease in carbon stock due to forest fires
and catastrophic events at year t in the project area
Source of data: calculated , Equation Table 25g, Table 27
Value applied: NA
Justification of choice of data or description of
measurement methods and procedures applied:
Any Comment: ex post
Data Unit / Parameter: ΔCFCiPA
Data unit: t CO2-e
Description: Cumulative increase in carbon stock due to forest
fires and catastrophic events at year t in the project
area
Source of data: calculated , Equation Table 26g, Table 27
Value applied: NA
Justification of choice of data or description of
measurement methods and procedures applied:
Any Comment: ex post
Data Unit / Parameter: ΔCFCiPAt
Data unit: t CO2-e
Description: Total increase in carbon stock due to forest fires
and catastrophic events at year t in the project area
Source of data: calculated , Equation Table 26g, Table 27
Value applied: NA
Justification of choice of data or description of
measurement methods and procedures applied:
Any Comment: ex post
Data Unit / Parameter: ΔCLPMLK
Data unit:
Description: Cumulative carbon stock decrease due to leakage
prevention measures

MONITORING & IMPLEMENTATION REPORT VCS Version 3.6, CCB Standards Second Edition
v3.0 146
Source of data: calculated , Equation Table 30c, Table 33, Table 35
Value applied: See Accounting Model, MR TemplateTable BI
Justification of choice of data or description of
measurement methods and procedures applied:
Any Comment: ex ante and ex post
Data Unit / Parameter: ΔCLPMLKt
Data unit:
Description: Carbon stock decrease due to leakage prevention
measures at year t
Source of data: calculated , Equation Table 30c, Table 33, Table 35
Value applied: See Accounting Model, MR TemplateTable BI
Justification of choice of data or description of
measurement methods and procedures applied:
Any Comment: ex ante and ex post
Data Unit / Parameter: ΔCPAdPA
Data unit: t CO2-e
Description: Cumulative decrease in carbon stock due to all
planned activities at year t in the project area
Source of data: calculated , Equation Table 25d, Table 27, Table 29
Value applied: See Accounting Model, MR TemplateTable BH
Justification of choice of data or description of
measurement methods and procedures applied:
Any Comment: ex ante and ex post
Data Unit / Parameter: ΔCPAdPAt
Data unit: t CO2-e
Description: Total decrease in carbon stock due to all planned
activities at year t in the project area
Source of data: calculated , Equation Table 26d, Table 27, Table 29
Value applied: See Accounting Model, MR TemplateTable BH
Justification of choice of data or description of
measurement methods and procedures applied:
Any Comment: ex ante and ex post
Data Unit / Parameter: ΔCPAiPA

MONITORING & IMPLEMENTATION REPORT VCS Version 3.6, CCB Standards Second Edition
v3.0 147
Data unit: t CO2-e
Description: Cumulative increase in carbon stock due to all
planned activities at year t in the project area
Source of data: calculated , Equation Table 26d, Table 27, Table 29
Value applied: See Accounting Model, MR TemplateTable BH
Justification of choice of data or description of
measurement methods and procedures applied:
Any Comment: ex ante and ex post
Data Unit / Parameter: ΔCPAiPAt
Data unit: t CO2-e
Description: Total increase in carbon stock due to all planned
activities at year t in the project area
Source of data: calculated , Equation Table 25a
Value applied: NA
Justification of choice of data or description of
measurement methods and procedures applied:
Any Comment: ex ante and ex post
Data Unit / Parameter: ΔCPDdPA
Data unit: t CO2-e
Description: Cumulative decrease in carbon stock due to
planned deforestation at year t in the project area
Source of data: calculated , Equation Table 25a
Value applied: NA
Justification of choice of data or description of
measurement methods and procedures applied:
Any Comment: ex ante and ex post
Data Unit / Parameter: ΔCPDdPAt
Data unit: t CO2-e
Description: Total decrease in carbon stock due to planned
deforestation at year t in the project area
Source of data: calculated , Equation Table 25c, Table 25d
Value applied: NA
Justification of choice of data or description of
measurement methods and procedures applied:
Any Comment: ex ante and ex post
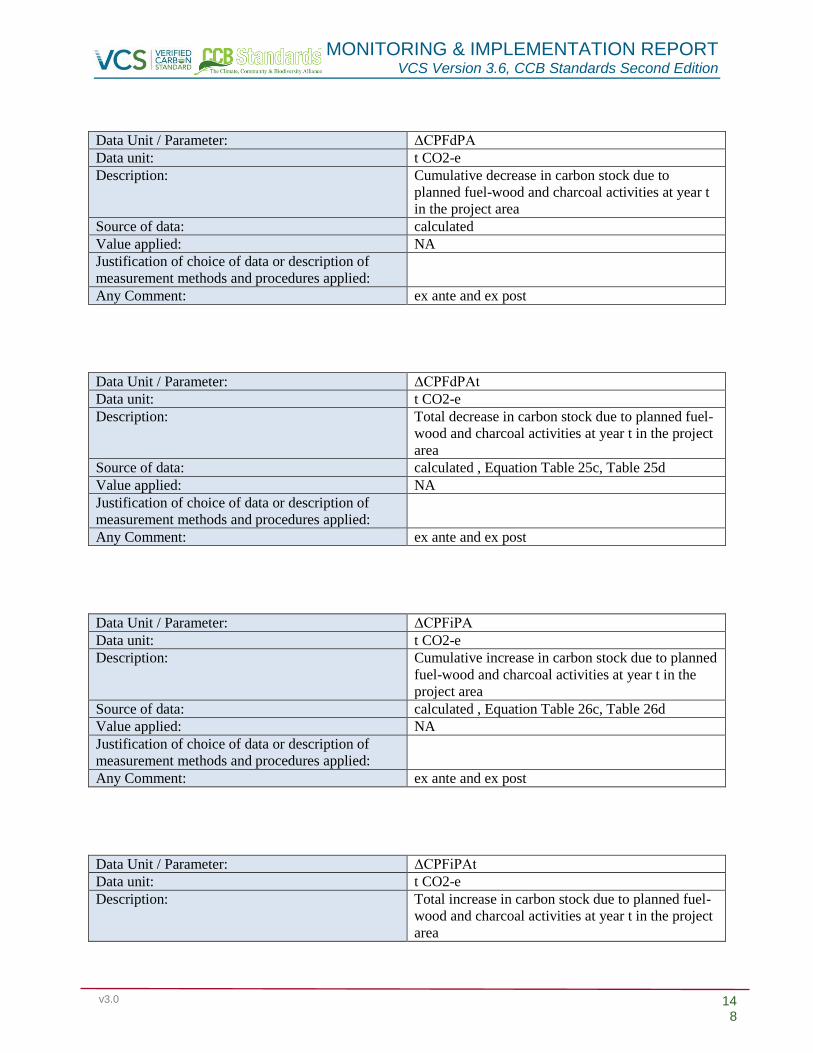
MONITORING & IMPLEMENTATION REPORT VCS Version 3.6, CCB Standards Second Edition
v3.0 148
Data Unit / Parameter: ΔCPFdPA
Data unit: t CO2-e
Description: Cumulative decrease in carbon stock due to
planned fuel-wood and charcoal activities at year t
in the project area
Source of data: calculated
Value applied: NA
Justification of choice of data or description of
measurement methods and procedures applied:
Any Comment: ex ante and ex post
Data Unit / Parameter: ΔCPFdPAt
Data unit: t CO2-e
Description: Total decrease in carbon stock due to planned fuel-
wood and charcoal activities at year t in the project
area
Source of data: calculated , Equation Table 25c, Table 25d
Value applied: NA
Justification of choice of data or description of
measurement methods and procedures applied:
Any Comment: ex ante and ex post
Data Unit / Parameter: ΔCPFiPA
Data unit: t CO2-e
Description: Cumulative increase in carbon stock due to planned
fuel-wood and charcoal activities at year t in the
project area
Source of data: calculated , Equation Table 26c, Table 26d
Value applied: NA
Justification of choice of data or description of
measurement methods and procedures applied:
Any Comment: ex ante and ex post
Data Unit / Parameter: ΔCPFiPAt
Data unit: t CO2-e
Description: Total increase in carbon stock due to planned fuel-
wood and charcoal activities at year t in the project
area

MONITORING & IMPLEMENTATION REPORT VCS Version 3.6, CCB Standards Second Edition
v3.0 149
Source of data: calculated , Equation Table 26c, Table 26d
Value applied: NA
Justification of choice of data or description of
measurement methods and procedures applied:
Any Comment: ex ante and ex post
Data Unit / Parameter: ΔCPLdPA
Data unit: t CO2-e
Description: Cumulative decrease in carbon stock due to
planned logging activities at year t in the project
area
Source of data: calculated , Equation Table 25b, Table 25d
Value applied: NA
Justification of choice of data or description of
measurement methods and procedures applied:
Any Comment: ex ante and ex post
Data Unit / Parameter: ΔCPLdPAt
Data unit: t CO2-e
Description: Total decrease in carbon stock due to planned
logging activities at year t in the project area
Source of data: calculated , Equation Table 25b, Table 25d
Value applied: NA
Justification of choice of data or description of
measurement methods and procedures applied:
Any Comment: ex ante and ex post
Data Unit / Parameter: ΔCPLiPA
Data unit: t CO2-e
Description: Cumulative increase in carbon stock due to planned
logging activities at year t in the project area
Source of data: calculated , Equation Table 26b, Table 26d
Value applied: NA
Justification of choice of data or description of
measurement methods and procedures applied:
Any Comment: ex ante and ex post
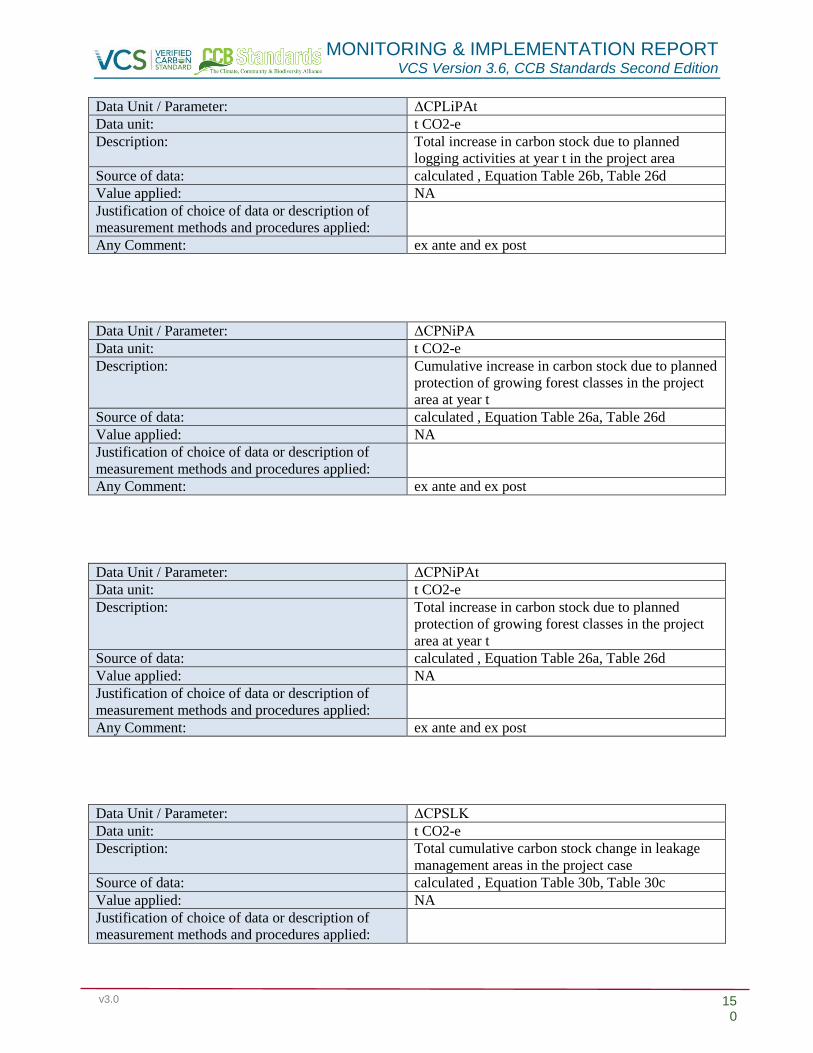
MONITORING & IMPLEMENTATION REPORT VCS Version 3.6, CCB Standards Second Edition
v3.0 150
Data Unit / Parameter: ΔCPLiPAt
Data unit: t CO2-e
Description: Total increase in carbon stock due to planned
logging activities at year t in the project area
Source of data: calculated , Equation Table 26b, Table 26d
Value applied: NA
Justification of choice of data or description of
measurement methods and procedures applied:
Any Comment: ex ante and ex post
Data Unit / Parameter: ΔCPNiPA
Data unit: t CO2-e
Description: Cumulative increase in carbon stock due to planned
protection of growing forest classes in the project
area at year t
Source of data: calculated , Equation Table 26a, Table 26d
Value applied: NA
Justification of choice of data or description of
measurement methods and procedures applied:
Any Comment: ex ante and ex post
Data Unit / Parameter: ΔCPNiPAt
Data unit: t CO2-e
Description: Total increase in carbon stock due to planned
protection of growing forest classes in the project
area at year t
Source of data: calculated , Equation Table 26a, Table 26d
Value applied: NA
Justification of choice of data or description of
measurement methods and procedures applied:
Any Comment: ex ante and ex post
Data Unit / Parameter: ΔCPSLK
Data unit: t CO2-e
Description: Total cumulative carbon stock change in leakage
management areas in the project case
Source of data: calculated , Equation Table 30b, Table 30c
Value applied: NA
Justification of choice of data or description of
measurement methods and procedures applied:

MONITORING & IMPLEMENTATION REPORT VCS Version 3.6, CCB Standards Second Edition
v3.0 151
Any Comment: ex ante and ex post
Data Unit / Parameter: ΔCPSLKt
Data unit: t CO2-e
Description: Total annual carbon stock change in leakage
management areas in the project case
Source of data: calculated , Equation Table 30b, Table 30c
Value applied: NA
Justification of choice of data or description of
measurement methods and procedures applied:
Any Comment: ex ante and ex post
Data Unit / Parameter: ΔCPSPA
Data unit: t CO2-e
Description: Cumulative project carbon stock change within the
project area at year t
Source of data: calculated , Equation Table 27, Table 29, Table 36
Value applied: See Accounting Model, MR TemplateTables BH
and BJ
Justification of choice of data or description of
measurement methods and procedures applied:
Any Comment: ex ante and ex post
Data Unit / Parameter: ΔCPSPAt
Data unit: t CO2-e
Description: Total project carbon stock change within the
project area at year t
Source of data: calculated , Equation 19, 21, Table 27, Table 29,
Table 36
Value applied: See Accounting Model, MR TemplateTables BH
and BJ
Justification of choice of data or description of
measurement methods and procedures applied:
Any Comment: ex ante and ex post
Data Unit / Parameter: ΔCUCdPA
Data unit: t CO2-e
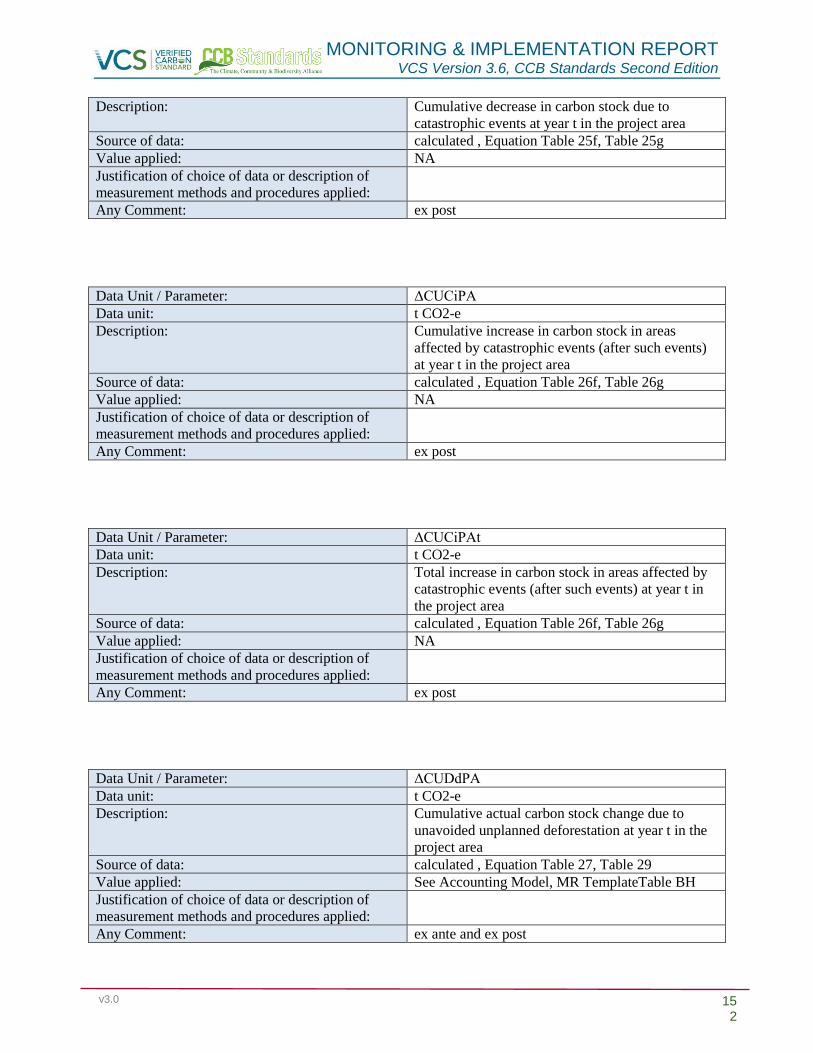
MONITORING & IMPLEMENTATION REPORT VCS Version 3.6, CCB Standards Second Edition
v3.0 152
Description: Cumulative decrease in carbon stock due to
catastrophic events at year t in the project area
Source of data: calculated , Equation Table 25f, Table 25g
Value applied: NA
Justification of choice of data or description of
measurement methods and procedures applied:
Any Comment: ex post
Data Unit / Parameter: ΔCUCiPA
Data unit: t CO2-e
Description: Cumulative increase in carbon stock in areas
affected by catastrophic events (after such events)
at year t in the project area
Source of data: calculated , Equation Table 26f, Table 26g
Value applied: NA
Justification of choice of data or description of
measurement methods and procedures applied:
Any Comment: ex post
Data Unit / Parameter: ΔCUCiPAt
Data unit: t CO2-e
Description: Total increase in carbon stock in areas affected by
catastrophic events (after such events) at year t in
the project area
Source of data: calculated , Equation Table 26f, Table 26g
Value applied: NA
Justification of choice of data or description of
measurement methods and procedures applied:
Any Comment: ex post
Data Unit / Parameter: ΔCUDdPA
Data unit: t CO2-e
Description: Cumulative actual carbon stock change due to
unavoided unplanned deforestation at year t in the
project area
Source of data: calculated , Equation Table 27, Table 29
Value applied: See Accounting Model, MR TemplateTable BH
Justification of choice of data or description of
measurement methods and procedures applied:
Any Comment: ex ante and ex post

MONITORING & IMPLEMENTATION REPORT VCS Version 3.6, CCB Standards Second Edition
v3.0 153
Data Unit / Parameter: ΔCUDdPAt
Data unit: t CO2-e
Description: Total actual carbon stock change due to unavoided
unplanned deforestation at year t in the project area
Source of data: calculated , Equation 16,Table 27 Table 29
Value applied: See Accounting Model, MR TemplateTable BH
Justification of choice of data or description of
measurement methods and procedures applied:
Any Comment: ex ante and ex post
Data Unit / Parameter: ΔCUFdPA
Data unit: t CO2-e
Description: Cumulative otal decrease in carbon stock due to
unplanned (and planned – where applicable) forest
fires in the project area
Source of data: calculated , Equation Table 25e, Table 25g
Value applied: NA
Justification of choice of data or description of
measurement methods and procedures applied:
Any Comment: ex post
Data Unit / Parameter: ΔCUFdPAt
Data unit: t CO2-e
Description: Total decrease in carbon stock due to unplanned
(and planned – where applicable) forest fires at
year t in the project area
Source of data: calculated , Equation Table 25e, Table 25g
Value applied: NA
Justification of choice of data or description of
measurement methods and procedures applied:
Any Comment: ex post
Data Unit / Parameter: ΔCUFiPA
Data unit: t CO2-e
Description: Cumulative increase in carbon stock in areas
affected by forest fires (after such events) in the
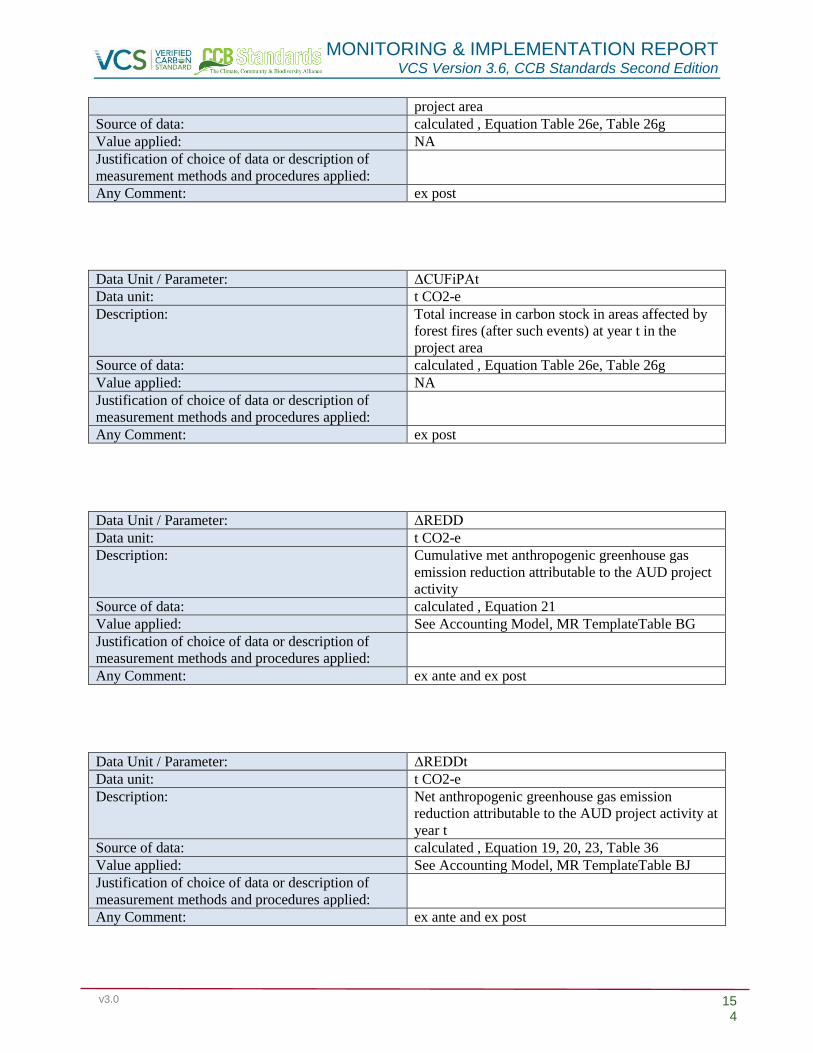
MONITORING & IMPLEMENTATION REPORT VCS Version 3.6, CCB Standards Second Edition
v3.0 154
project area
Source of data: calculated , Equation Table 26e, Table 26g
Value applied: NA
Justification of choice of data or description of
measurement methods and procedures applied:
Any Comment: ex post
Data Unit / Parameter: ΔCUFiPAt
Data unit: t CO2-e
Description: Total increase in carbon stock in areas affected by
forest fires (after such events) at year t in the
project area
Source of data: calculated , Equation Table 26e, Table 26g
Value applied: NA
Justification of choice of data or description of
measurement methods and procedures applied:
Any Comment: ex post
Data Unit / Parameter: ΔREDD
Data unit: t CO2-e
Description: Cumulative met anthropogenic greenhouse gas
emission reduction attributable to the AUD project
activity
Source of data: calculated , Equation 21
Value applied: See Accounting Model, MR TemplateTable BG
Justification of choice of data or description of
measurement methods and procedures applied:
Any Comment: ex ante and ex post
Data Unit / Parameter: ΔREDDt
Data unit: t CO2-e
Description: Net anthropogenic greenhouse gas emission
reduction attributable to the AUD project activity at
year t
Source of data: calculated , Equation 19, 20, 23, Table 36
Value applied: See Accounting Model, MR TemplateTable BJ
Justification of choice of data or description of
measurement methods and procedures applied:
Any Comment: ex ante and ex post

MONITORING & IMPLEMENTATION REPORT VCS Version 3.6, CCB Standards Second Edition
v3.0 155
5.3.2 Community (CM4)
Project
Activity
Group
Number Project
Activity
Indicator Frequency Data
Source/
Reference
Monitoring
Result
Resource
Protection,
Governance,
and
Monitoring
3 Registered
land into
PINFOR or
PINPEP
# hectares of
lands FUNDAECO
helped to register
with
PINFOR/PINPEP
Annually PINFOR/PI
NPEP
database
7891.37
Resource
Protection,
Governance,
and
Monitoring
12 Protection
and
management
of
community
water
sources
# hectares of
water source
protected
Annually conservation
agreements,
watershed
protection
database
14101.21
Resource
Protection,
Governance,
and
Monitoring
14 Conflict
resolution
roundtable
# meetings
participated in on
roundtable
Annually meeting
records/
reports/
minutes
6
Resource
Protection,
Governance,
and
Monitoring
14 Conflict
resolution
roundtable
Records of
meetings
Annually records 6
Sustainable
Enterprises
25 FUNDAECO
nurseries
# nurseries
established
Annually nurseries
database
1
Sustainable
Enterprises
27 Community
nurseries
# nurseries
established
Annually nurseries
database/
nurseries
contracts
12
Sustainable
Enterprises
30 Hire
agroforestry
promoters/te
chnician
from the
project
region
# agroforestry
promotors hired
from the project
region
Annually invoices/
agreements
19
Sustainable 21 plantations
for timber
# of farmers
supported for
Annually agroforestry 107

MONITORING & IMPLEMENTATION REPORT VCS Version 3.6, CCB Standards Second Edition
v3.0 156
Enterprises production timber plantations database
Sustainable
Enterprises
18 Creation of
agroforestry
plots
# farmers
participating in
agroforestry
projects
Annually agroforestry
database
137
Sustainable
Enterprises
22 Reforestatio
n and
Agroforestry
PINFOR or
PINPEP
# landowners
participating in
program
Annually 107
Sustainable
Enterprises
30 Hire
agroforestry
promoters
from project
region
# agroforestry
promotors hired
from project region
Annually payrolls
(planillas)
19
Sustainable
Enterprises
27 Community
nurseries
# community
entrepeneurs
Annually invoices/agr
eements
12
Sustainable
Enterprises
23 Construction
of
ecotourism
sites
# of ecotourism
sites established
Annually ecotourism
infraestrcutu
re
investments
inventory
1
Sustainable
Enterprises
Support to
women in
sustainable
enterprises
productive
projects
# of women
supported
Annually records 50
Sustainable
Enterprises
22 Reforestatio
n and
Agroforestry
PINFOR or
PINPEP
$ per hectare of
benefits for
landowners in
program
Annually PINFOR/PI
NPEP
databas
Q15,600.00
Community
Empowerme
nt &
Inclusivenes
s
33 Legalized
private and
community
land
# hectares newly
registered in both
local and national
land registry
Annually database for
land
legalization
6358.92
Community
Empowerme
nt &
39 Creation of
health
facilities:
# of women clinics
and communitary
first-aid cabinets
Annually database for
sexual and
reproductive
12
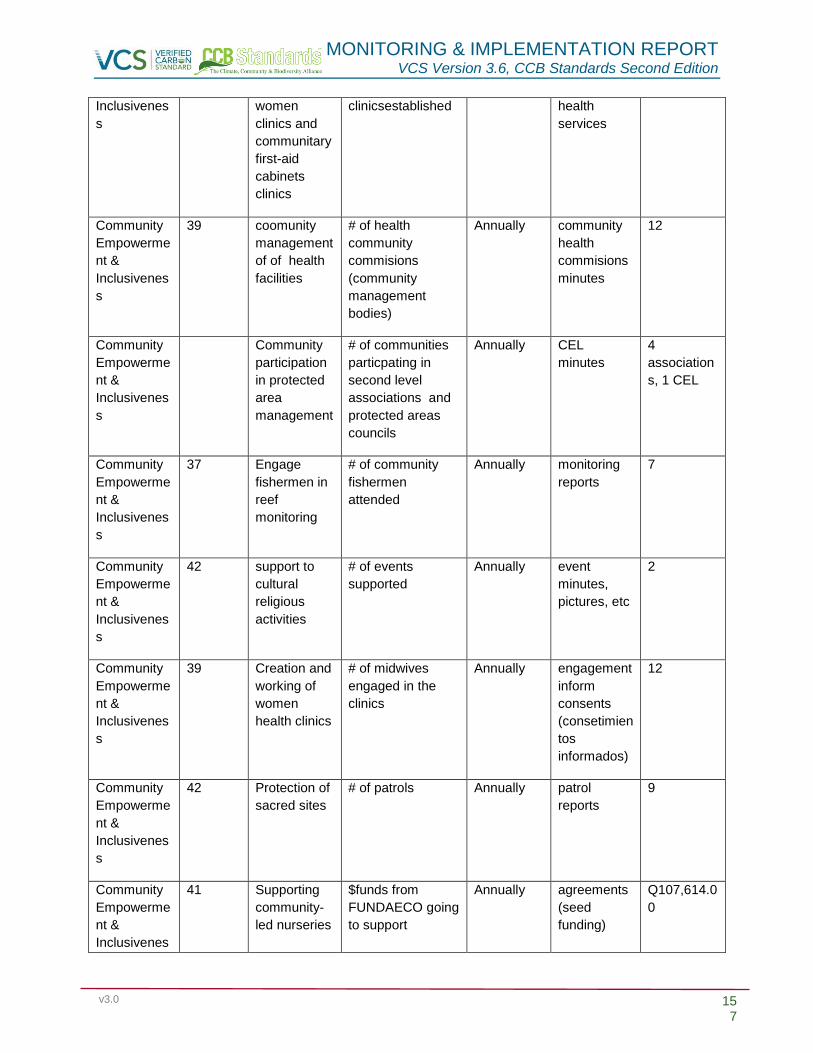
MONITORING & IMPLEMENTATION REPORT VCS Version 3.6, CCB Standards Second Edition
v3.0 157
Inclusivenes
s
women
clinics and
communitary
first-aid
cabinets
clinics
clinicsestablished health
services
Community
Empowerme
nt &
Inclusivenes
s
39 coomunity
management
of of health
facilities
# of health
community
commisions
(community
management
bodies)
Annually community
health
commisions
minutes
12
Community
Empowerme
nt &
Inclusivenes
s
Community
participation
in protected
area
management
# of communities
particpating in
second level
associations and
protected areas
councils
Annually CEL
minutes
4
association
s, 1 CEL
Community
Empowerme
nt &
Inclusivenes
s
37 Engage
fishermen in
reef
monitoring
# of community
fishermen
attended
Annually monitoring
reports
7
Community
Empowerme
nt &
Inclusivenes
s
42 support to
cultural
religious
activities
# of events
supported
Annually event
minutes,
pictures, etc
2
Community
Empowerme
nt &
Inclusivenes
s
39 Creation and
working of
women
health clinics
# of midwives
engaged in the
clinics
Annually engagement
inform
consents
(consetimien
tos
informados)
12
Community
Empowerme
nt &
Inclusivenes
s
42 Protection of
sacred sites
# of patrols Annually patrol
reports
9
Community
Empowerme
nt &
Inclusivenes
41 Supporting
community-
led nurseries
$funds from
FUNDAECO going
to support
Annually agreements
(seed
funding)
Q107,614.0
0

MONITORING & IMPLEMENTATION REPORT VCS Version 3.6, CCB Standards Second Edition
v3.0 158
s nuerseries
Education 45 Train
community
members on
marine
biodiversity
and
monitoring
# of community
members attended
Annually training
reports
7
Education 47 Provision of
health
services
# of workshops
held
Annually workshops
reports
135
Education 47 Provision of
health
services
# outreach events
held within
communities
Annually event
reports
3
Education 47 Provision of
health
services
# peer-to-peer
health educators
Annually volunteering
agreements
6
Education 48 Training and
workshops
on
agroforestry
production
and care
# farmers
attended
Annually logbook,
sworkshops
reports/parti
cipants lists
51
Education 55 Provide
access to
FUNDAECO
agronomist
# of
landowners/comm
unities attended
Annually logbooks 132
Education 56 Teaching
new designs
for
handicrafts
# of people
attended
Annually workshop
reports/parti
cipants lists
50
Education 56 Teaching
new designs
for
handicrafts
# of workshops
held
Annually workshop
reports/parti
cipants lists
2
Education 59 Training on
how to
manage a
business
(organization
# of people
participated
Annually workshop
reports/parti
cipants lists
84

MONITORING & IMPLEMENTATION REPORT VCS Version 3.6, CCB Standards Second Edition
v3.0 159
al skills)
Education 59 Training on
how to
manage a
business
(organization
al skills)
# of trainings held Annually workshop
reports/parti
cipants lists
5
Education 62 General
community
training
# of people
participated
Annually workshop
reports/parti
cipants lists
52
Education 62 General
community
training
# of trainings held Annually workshop
reports/parti
cipants lists
3
Education 63 Training for
ecotourism
services
# of ecotourism
vendors and
ecotourism staff
participated
Annually workshop
reports/parti
cipants lists
15
Education 63 Training for
ecotourism
services
# of trainings held Annually workshop
reports/parti
cipants lists
2
Education 45 Train
community
members on
marine
biodiversity
and
monitoring
# of community
members attended
Annually training
reports
7
Education 47 Provision of
health
services
# of workshops
held
Annually training
report/partici
pants lists
135
Education 47 Provision of
health
services
# outreach events
held within
communities
Annually training
report/partici
pants lists
3
Education 47 Provision of
health
services
# peer-to-peer
health educators
Annually volunteering
agreements
6
Education 48 Training and
workshops
on
agroforestry
# of people
attended
Annually training
reports/parti
cipants list
51

MONITORING & IMPLEMENTATION REPORT VCS Version 3.6, CCB Standards Second Edition
v3.0 160
production
and care
Education 48 Training and
workshops
on
agroforestry
production
and care
# of workshops
held
Annually training
reports/parti
cipants list
4
Education 50 Environment
al education
for schools
# schools
participating with
FUNDAECO
Annually event
reports/parti
cipants list
24 schools,
942
students
Education 50 Environment
al education
for schools
# students visiting
ecotourism
centers
Annually event
reports/parti
cipants list
4071
Education 51 Environment
al education
for interested
communities
# workshops or
events held
Annually event
reports/parti
cipants list
10
Education 56 Teaching
new designs
for
handicrafts
# of people
attended
Annually training
reports/parti
cipants list
50
Education 56 Teaching
new designs
for
handicrafts
# of workshops
held
Annually training
reports/parti
cipants list
2
Education 58 Training on
ecotourism
services
# people trained Annually training
reports/parti
cipants list
15
Education 59 Training on
how to
manage a
business
(organization
al skills)
# trainings held Annually training
reports/parti
cipants list
5
Education 62 General
community
training
# trainings held Annually training
reports/parti
cipants list
3
Improved
Access to
21 plantations
for timber
# of farmers
supported for
Annually agroforestry
database
107

MONITORING & IMPLEMENTATION REPORT VCS Version 3.6, CCB Standards Second Edition
v3.0 161
Resources production timber plantations
Improved
Access to
Resources
70 PINFOR or
PINPEP
payments
# families
receiving
PINFOR/PINPEP
payments
Annually PINFOR/PI
NPEP
database
158
Improved
Access to
Resources
71 support to
management
plan
implementati
on for
PINFOR or
PINPEP
# landowners
FUNDAECO
helped with
management
plans devised
Annually PINPEP/PIN
FOR files
with forestry
regent
158
Improved
Access to
Resources
72 Legal
services
#
landowners/comm
unities
FUNDAECO
assisted with legal
services
Annually denonciatio
n records
1
Improved
Access to
Resources
73 Process and
travel
logisitics for
land
legalization
# landowners,
individuals,
communities
FUNDAECO
assisted with
transportation and
logistics for land
legalization
Annually activity
report
9
communitie
s
Improved
Access to
Resources
76 Provision of
health
services
# of patients
treated
Annually sexual and
reproductive
health
database
15832
Improved
Access to
Resources
76 Provision of
health
services
# of women using
contraceptive
methods
Annually sexual and
reproductive
health
database
1041
Improved
Access to
Resources
76 Provision of
health
services
# of communities
with access to
services
Annually sexual and
reproductive
health
database
103
Improved
Access to
Resources
78 Agroforestry
stock for new
and existing
# seedlings/plants
provided for new
plots
Annually nurseries
database
295975

MONITORING & IMPLEMENTATION REPORT VCS Version 3.6, CCB Standards Second Edition
v3.0 162
plots
Improved
Access to
Resources
82 Nursery
establishmen
t
# nurseries
established
Annually nurseries
contracts
12
Improved
Access to
Resources
83 Buy nursery
stock from
communities
# plants bought by
FUNDAECO
Annually nurseries
contracts/inv
oices
295975
Improved
Access to
Resources
84 Protection
and
management
of
community
water
sources
# hectares of
water source
protected
Annually conservation
agreements,
patrol
reports
14101.21
Improved
Access to
Resources
86 Provide
access to
FUNDEACO
agronomist
# of
communities/lando
wners receiving
access to
agronomist
Annually logbooks,
agroforestry
contracts
107
Improved
Access to
Resources
95 Plant new
plantations
for timber to
mitigate
demand for
illegal
logging
# hectares with
plantations for
future demand
Annually agroforestry
database
271.89
Error! Not a valid link.
5.3.3 Biodiversity (B4)
Project
Activity
Group
Number Project
Activity
Indicator Frequency Data
Source/Refer
ence
Monitoring
Result
Resource
Protection,
Governance
, and
Monitoring
1 Legalized
private and
community
land
# hectares
newly
registered in
both local
and national
land registry
Annually land
legalization
database
6368.52

MONITORING & IMPLEMENTATION REPORT VCS Version 3.6, CCB Standards Second Edition
v3.0 163
Resource
Protection,
Governance
, and
Monitoring
3 Registered
land into
PINFOR or
PINPEP
# hectares
of lands
FUNDAECO
helped to
register with
PINFOR/PI
NPEP
Annually PINFOR/PIN
PEP
database
7891.37
Resource
Protection,
Governance
, and
Monitoring
7 Engage
fishermen to
reef
monitoring
# of
workshops
held
Annually monitoring
reports
5
Resource
Protection,
Governance
, and
Monitoring
7 Engage
fishermen to
reef
monitoring
amount of
coastline
surveyed
Annually monitoring
reports
21.83ha
Resource
Protection,
Governance
, and
Monitoring
8 Implementat
ion of fishing
restriction
zones
#of fishing
restriction
zones
Annually community
agreements/t
echnical
reports
4
Resource
Protection,
Governance
, and
Monitoring
9 Purchase
land for
protection
# of
hectares
purchased
Annually land
aquisition
files
733.38
Resource
Protection,
Governance
, and
Monitoring
10 Manage
protected
areas
# of
hectares
managed, #
of patrols
Annually patrol reports,
logbooks
1800 patrols
Resource
Protection,
Governance
, and
Monitoring
11 Creation of
protected
areas
Records of
FUNDAECO
's
input/assista
nce in
creation of
protected
areas
Annually meetings
records
6, 1
sobrevuelo
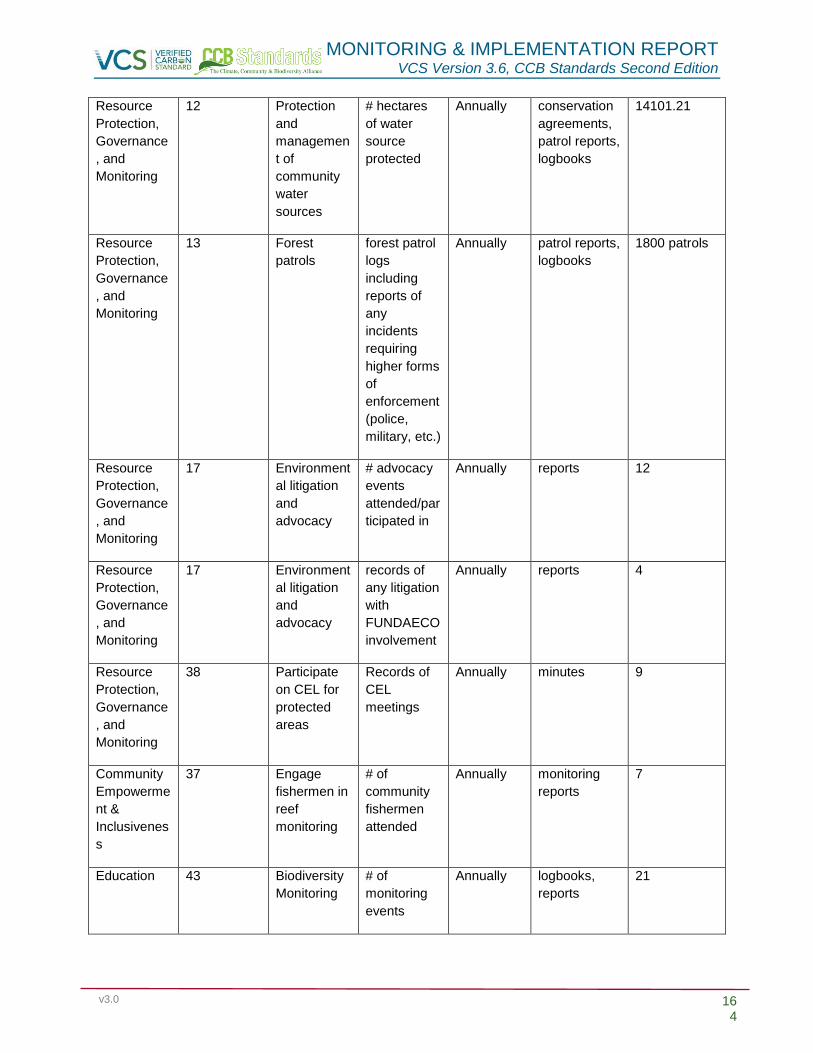
MONITORING & IMPLEMENTATION REPORT VCS Version 3.6, CCB Standards Second Edition
v3.0 164
Resource
Protection,
Governance
, and
Monitoring
12 Protection
and
managemen
t of
community
water
sources
# hectares
of water
source
protected
Annually conservation
agreements,
patrol reports,
logbooks
14101.21
Resource
Protection,
Governance
, and
Monitoring
13 Forest
patrols
forest patrol
logs
including
reports of
any
incidents
requiring
higher forms
of
enforcement
(police,
military, etc.)
Annually patrol reports,
logbooks
1800 patrols
Resource
Protection,
Governance
, and
Monitoring
17 Environment
al litigation
and
advocacy
# advocacy
events
attended/par
ticipated in
Annually reports 12
Resource
Protection,
Governance
, and
Monitoring
17 Environment
al litigation
and
advocacy
records of
any litigation
with
FUNDAECO
involvement
Annually reports 4
Resource
Protection,
Governance
, and
Monitoring
38 Participate
on CEL for
protected
areas
Records of
CEL
meetings
Annually minutes 9
Community
Empowerme
nt &
Inclusivenes
s
37 Engage
fishermen in
reef
monitoring
# of
community
fishermen
attended
Annually monitoring
reports
7
Education 43 Biodiversity
Monitoring
# of
monitoring
events
Annually logbooks,
reports
21

MONITORING & IMPLEMENTATION REPORT VCS Version 3.6, CCB Standards Second Edition
v3.0 165
Education 45 Engage
community
members on
marine
biodiversity
and
monitoring
# of
community
members
attended
Annually reports,
participants
lists
7
Education 45 Marine
biodiversity
monitoring
# of
monitoring
events
Annually reports,
participants
lists
6
Education 46 Support
university
research on
marine
sciences
# of
research
expeditions
conducted
Annually reports,
participants
lists
5
Education 46 Support
university
research on
marine
sciences
# of
students
participating
in research
with
FUNDAECO
Annually reports,
participants
lists
60
Education 46 Support
university
research on
marine
sciences
types of
research
activities
conducted
Annually support
letters,
research
reports
4
Education 50 Environment
al education
for schools
# schools
participating
with
FUNDAECO
Annually reports,
participants
lists
24 schools,
942
participants
Education 50 Environment
al education
for schools
# students
visiting
ecotourism
centers
Annually reports,
participants
lists
4071
Education 51 Environment
al education
for
interested
communities
#
communities
participating
in
environment
al education
opportunitie
s
Annually reports,
participants
lists
15
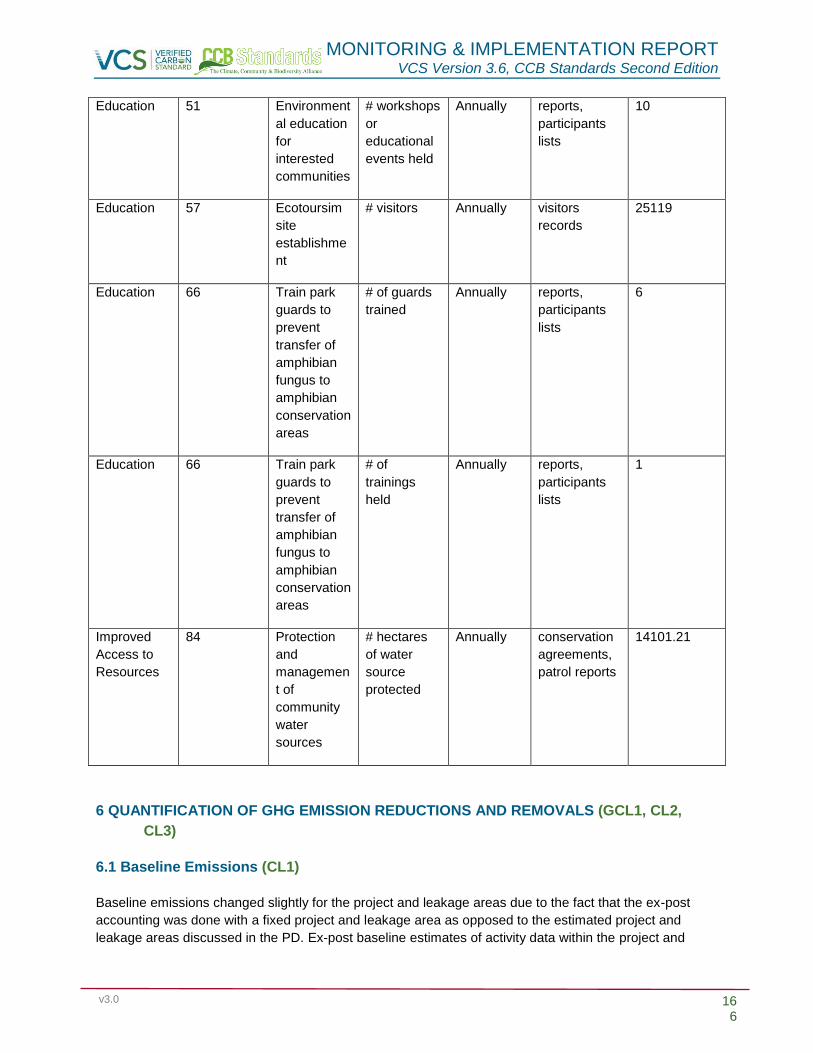
MONITORING & IMPLEMENTATION REPORT VCS Version 3.6, CCB Standards Second Edition
v3.0 166
Education 51 Environment
al education
for
interested
communities
# workshops
or
educational
events held
Annually reports,
participants
lists
10
Education 57 Ecotoursim
site
establishme
nt
# visitors Annually visitors
records
25119
Education 66 Train park
guards to
prevent
transfer of
amphibian
fungus to
amphibian
conservation
areas
# of guards
trained
Annually reports,
participants
lists
6
Education 66 Train park
guards to
prevent
transfer of
amphibian
fungus to
amphibian
conservation
areas
# of
trainings
held
Annually reports,
participants
lists
1
Improved
Access to
Resources
84 Protection
and
managemen
t of
community
water
sources
# hectares
of water
source
protected
Annually conservation
agreements,
patrol reports
14101.21
6 QUANTIFICATION OF GHG EMISSION REDUCTIONS AND REMOVALS (GCL1, CL2,
CL3)
6.1 Baseline Emissions (CL1)
Baseline emissions changed slightly for the project and leakage areas due to the fact that the ex-post
accounting was done with a fixed project and leakage area as opposed to the estimated project and
leakage areas discussed in the PD. Ex-post baseline estimates of activity data within the project and

MONITORING & IMPLEMENTATION REPORT VCS Version 3.6, CCB Standards Second Edition
v3.0 167
leakage areas were calculated by applying the baseline model estimates of end land use to the defined
boundaries for the project and leakage areas. The project area is comprised of smaller parcels with
different land owners and Project Activity Instance start dates. The baseline data were extracted on a
parcel-level and the deforestation estimates were adjusted based off of the PAI start dates. For the
baseline estimates of end-land use in the leakage area, the estimates were calculated across the entire
area. Where needed for partial years between LULC change predictions or observations, LULC change
was interpolated as described in the PD.
Baseline emissions estimates using ex-post project and leakage areas are included in the tables below.
For the monitoring and implementation period, the selected carbon pools, carbon stocks, and reference
area all remained the same.
Area deforested per forest class icl within the reference region
Total baseline deforestation in the reference region
IDicl ABSLRRt ABSLRR
Name Very Humid Forest
Humid Forest
annual cumulative
Project year t ha ha ha ha
1 4,663 10,728 15,392 15,392
2 7,987 12,517 20,503 35,895
3 9,927 10,576 20,503 56,399
4 11,113 9,391 20,503 76,902
5 11,481 9,023 20,503 97,405
6 11,622 8,881 20,503 117,909
7 11,653 8,850 20,503 138,412
8 11,755 8,749 20,503 158,916
9 11,555 8,949 20,503 179,419
10 11,322 9,182 20,503 199,923
11 11,226 9,278 20,503 220,426
12 11,578 8,925 20,503 240,929
13 12,166 8,337 20,503 261,433
14 12,218 8,286 20,503 281,936
15 12,200 8,304 20,503 302,440
16 12,578 7,925 20,503 322,943
17 13,070 7,433 20,503 343,447
18 13,760 6,743 20,503 363,950
19 14,726 5,778 20,503 384,454
20 15,513 4,991 20,503 404,957
21 16,343 4,161 20,503 425,460
22 15,088 5,416 20,503 445,964
23 14,551 5,953 20,503 466,467
24 18,274 2,229 20,503 486,971
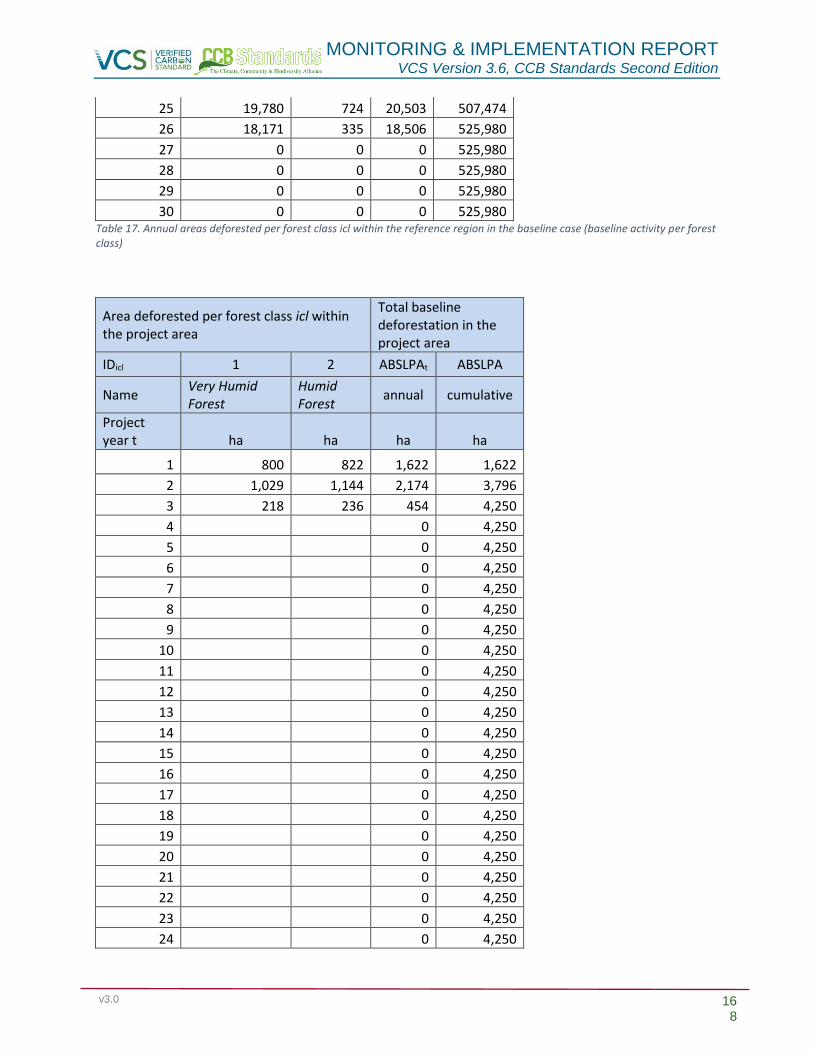
MONITORING & IMPLEMENTATION REPORT VCS Version 3.6, CCB Standards Second Edition
v3.0 168
25 19,780 724 20,503 507,474
26 18,171 335 18,506 525,980
27 0 0 0 525,980
28 0 0 0 525,980
29 0 0 0 525,980
30 0 0 0 525,980 Table 17. Annual areas deforested per forest class icl within the reference region in the baseline case (baseline activity per forest class)
Area deforested per forest class icl within the project area
Total baseline deforestation in the project area
IDicl 1 2 ABSLPAt ABSLPA
Name Very Humid Forest
Humid Forest
annual cumulative
Project year t ha ha ha ha
1 800 822 1,622 1,622
2 1,029 1,144 2,174 3,796
3 218 236 454 4,250
4 0 4,250
5 0 4,250
6 0 4,250
7 0 4,250
8 0 4,250
9 0 4,250
10 0 4,250
11 0 4,250
12 0 4,250
13 0 4,250
14 0 4,250
15 0 4,250
16 0 4,250
17 0 4,250
18 0 4,250
19 0 4,250
20 0 4,250
21 0 4,250
22 0 4,250
23 0 4,250
24 0 4,250

MONITORING & IMPLEMENTATION REPORT VCS Version 3.6, CCB Standards Second Edition
v3.0 169
25 0 4,250
26 0 4,250
27 0 4,250
28 0 4,250
29 0 4,250
30 0 4,250 Table 18. Annual areas deforested per forest class icl within the project area in the baseline case (baseline activity per forest class)
Area deforested per forest class icl within the leakage belt area
Total baseline deforestation in the leakage belt area
IDicl 1 2 ABSLLKt ABSLLK
Name Very Humid Forest
Humid Forest
annual cumulative
Projtect year t ha ha ha ha
1 534 684 1,218 1,218
2 679 976 1,655 2,873
3 133 199 332 3,205
4 0 3,205
5 0 3,205
6 0 3,205
7 0 3,205
8 0 3,205
9 0 3,205
10 0 3,205
11 0 3,205
12 0 3,205
13 0 3,205
14 0 3,205
15 0 3,205
16 0 3,205
17 0 3,205
18 0 3,205
19 0 3,205
20 0 3,205
21 0 3,205
22 0 3,205
23 0 3,205
24 0 3,205
25 0 3,205
26 0 3,205
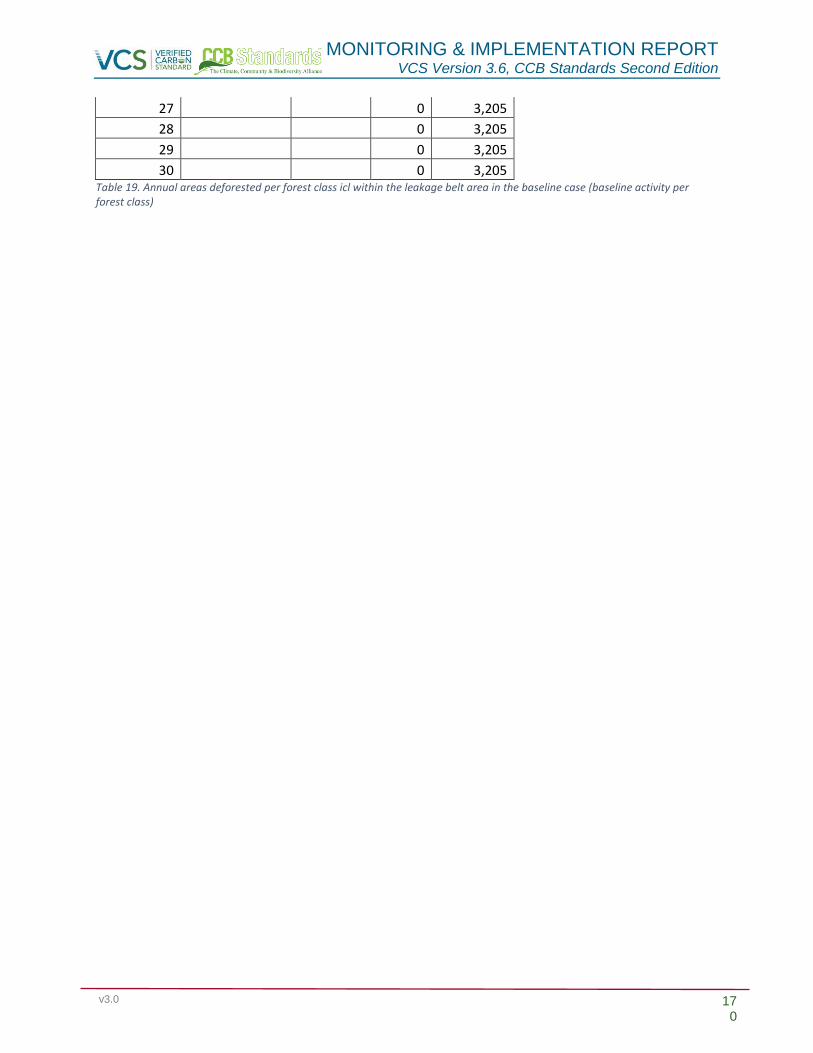
MONITORING & IMPLEMENTATION REPORT VCS Version 3.6, CCB Standards Second Edition
v3.0 170
27 0 3,205
28 0 3,205
29 0 3,205
30 0 3,205 Table 19. Annual areas deforested per forest class icl within the leakage belt area in the baseline case (baseline activity per forest class)

MONITORING & IMPLEMENTATION REPORT VCS Version 3.6, CCB Standards Second Edition
v3.0 171
Activity data per LU/LC category ct within the reference region Total baseline deforestation in the reference region
IDct 4 5 6 7 8 9 10 11 ABSLRRt ABSLRR
Name W
ate
r
Urb
an
We
tlan
d
Per
man
ent
Agr
icu
ltu
re
An
nu
al
Agr
icu
ltu
re
Pas
ture
Shru
bs
Oth
er
no
n-
fore
st
annual
cumulative
Project year t ha ha ha ha ha ha ha ha ha ha
1 0 6 0 4,073 182 9,528 1,450 152 15,392 15,392
2 0 8 0 6,003 186 11,247 1,392 1,667 20,503 35,895
3 0 5 0 3,209 1,119 9,173 1,453 5,545 20,503 56,399
4 0 1 0 2,341 1,219 8,843 1,537 6,563 20,503 76,902
5 0 0 0 1,582 1,610 8,870 1,643 6,799 20,503 97,405
6 0 0 0 1,344 2,597 8,825 2,111 5,627 20,503 117,909
7 0 0 0 1,080 3,078 8,488 2,986 4,871 20,503 138,412
8 0 0 0 1,002 3,580 6,177 5,513 4,232 20,503 158,916
9 0 0 0 908 4,042 4,025 8,084 3,445 20,503 179,419
10 0 0 0 806 4,039 3,228 9,508 2,922 20,503 199,923
11 0 0 0 692 3,820 2,758 10,876 2,357 20,503 220,426
12 0 0 0 610 3,745 2,278 11,780 2,090 20,503 240,929

MONITORING & IMPLEMENTATION REPORT VCS Version 3.6, CCB Standards Second Edition
v3.0 172
13 0 0 0 577 3,646 1,911 12,491 1,879 20,503 261,433
14 0 0 0 562 3,579 1,682 13,094 1,586 20,503 281,936
15 0 0 0 513 3,400 1,469 13,765 1,357 20,503 302,440
16 0 0 0 425 2,870 1,139 15,046 1,023 20,503 322,943
17 0 0 0 377 2,528 875 15,850 873 20,503 343,447
18 0 0 0 336 2,411 720 16,182 854 20,503 363,950
19 0 0 0 373 3,407 680 15,104 940 20,503 384,454
20 0 0 0 580 5,458 751 12,661 1,053 20,503 404,957
21 0 0 0 592 8,028 695 9,660 1,529 20,503 425,460
22 0 0 0 664 7,884 629 10,069 1,258 20,503 445,964
23 0 0 0 1,122 3,699 1,125 13,101 1,456 20,503 466,467
24 0 0 0 1,071 934 923 16,799 777 20,503 486,971
25 0 0 0 1,670 864 808 16,966 195 20,503 507,474
26 0 0 0 896 459 118 16,911 111 18,495 525,969
27 0 0 0 0 0 0 0 0 0 525,969
28 0 0 0 0 0 0 0 0 0 525,969
29 0 0 0 0 0 0 0 0 0 525,969

MONITORING & IMPLEMENTATION REPORT VCS Version 3.6, CCB Standards Second Edition
v3.0 173
30 0 0 0 0 0 0 0 0 0 525,969
Table 20. Baseline activity data for LU/LC change categories (ct) in reference region.
Activity data per LU/LC category ct within the project area Total baseline deforestation in the project area
IDct 4 5 6 7 8 9 10 11 ABSLPAt ABSLPA
Name W
ate
r
Urb
an
We
tlan
d
Per
man
ent
Agr
icu
ltu
re
An
nu
al
Agr
icu
ltu
re
Pas
ture
Shru
bs
Oth
er n
on
-fo
rest
annual
cumulative
Project year t ha ha ha ha ha ha ha ha ha ha
1 0 0 0 9 100 837 677 0 1,622 1,622
2 0 0 0 12 137 900 1,121 4 2,174 3,796
3 0 0 0 2 26 164 262 1 454 4,250
4 0 4,250
5 0 4,250
6 0 4,250
7 0 4,250
8 0 4,250
9 0 4,250
10 0 4,250

MONITORING & IMPLEMENTATION REPORT VCS Version 3.6, CCB Standards Second Edition
v3.0 174
11 0 4,250
12 0 4,250
13 0 4,250
14 0 4,250
15 0 4,250
16 0 4,250
17 0 4,250
18 0 4,250
19 0 4,250
20 0 4,250
21 0 4,250
22 0 4,250
23 0 4,250
24 0 4,250
25 0 4,250
26 0 4,250
27 0 4,250

MONITORING & IMPLEMENTATION REPORT VCS Version 3.6, CCB Standards Second Edition
v3.0 175
28 0 4,250
29 0 4,250
30 0 4,250
Table 21. Baseline activity data for LU/LC change categories (ct) in project area.
Activity data per LU/LC category ct within the leakage belt Total baseline deforestation in the
leakage belt
IDct 4 5 6 7 8 9 10 11 ABSLLKt ABSLLK
Name W
ate
r
Urb
an
We
tlan
d
Per
man
ent
Agr
icu
ltu
re
An
nu
al
Agr
icu
ltu
re
Pas
ture
Shru
bs
Oth
er n
on
-fo
rest
annual
cumulative
Project year t ha ha ha ha ha ha ha ha ha ha
1 0 0 0 15 72 498 632 0 1,218 1,218
2 0 0 0 11 112 488 1,042 2 1,655 2,873
3 0 0 0 2 21 78 231 1 332 3,205
4 0 3,205
5 0 3,205
6 0 3,205
7 0 3,205
8 0 3,205

MONITORING & IMPLEMENTATION REPORT VCS Version 3.6, CCB Standards Second Edition
v3.0 176
9 0 3,205
10 0 3,205
11 0 3,205
12 0 3,205
13 0 3,205
14 0 3,205
15 0 3,205
16 0 3,205
17 0 3,205
18 0 3,205
19 0 3,205
20 0 3,205
21 0 3,205
22 0 3,205
23 0 3,205
24 0 3,205
25 0 3,205

MONITORING & IMPLEMENTATION REPORT VCS Version 3.6, CCB Standards Second Edition
v3.0 177
26 0 3,205
27 0 3,205
28 0 3,205
29 0 3,205
30 0 3,205
Table 22. Baseline activity data for LU/LC change categories (ct) in leakage belt.

MONITORING & IMPLEMENTATION REPORT VCS Version 3.6, CCB Standards Second Edition
v3.0 178
6.2 Project Emissions (CL2)
In order to calculate the emissions released in the project area, a 2014 LULC map was created, as described in section 5.1.2.1. Landsat data was
pre-processed for use in the 2014 LULC map and was classified using the same classes used in the 2001-2010 LULC maps.
6.2.1 Observed LULC Changes
Emissions from the project area are quantified using the LULC transitions in the project area, 2014 LULC relative to the 2010 benchmark map.
The LULC transitions that occurred within this time period were assumed to be distributed linearly from 2010-2014 and were interpolated based off
of each Project Activity Instance start date to the end of the first monitoring period so as to accurately account for the project’s emissions
reductions. The monitoring results of activity data in the project area are summarized below for this time period. These transitions are calculated in
Fundaeco VM0015 Accounting Model v1.46.xlsm. As shown in table 23, the total amount of forest converted to pasture and cropland in the
project area adjusted by the PAI start dates was 1,250 hectares. There were no emissions associated with any of the implemented project
activities.
Activity data per LU/LC category ct within the project area Total ex post deforestation in the project area
IDct 4 5 6 7 8 9 10 11 ABSLPAt ABSLPA
Nam
e
Wat
er
Urb
an
We
tlan
d
Per
man
ent
agri
cult
ure
An
nu
al
agri
cult
ure
Pas
ture
Shru
bs
Oth
er n
on
-fo
rest
ann
ual
cum
ula
tive
Project year t
ha ha ha ha ha ha ha ha ha ha
1 6 1 2 7 46 136 279 1 479 479
2 8 1 2 10 61 181 371 2 636 1,115
3 2 0 1 2 13 38 78 0 135 1,250
4 0 1,250
5 0 1,250
6 0 1,250
7 0 1,250
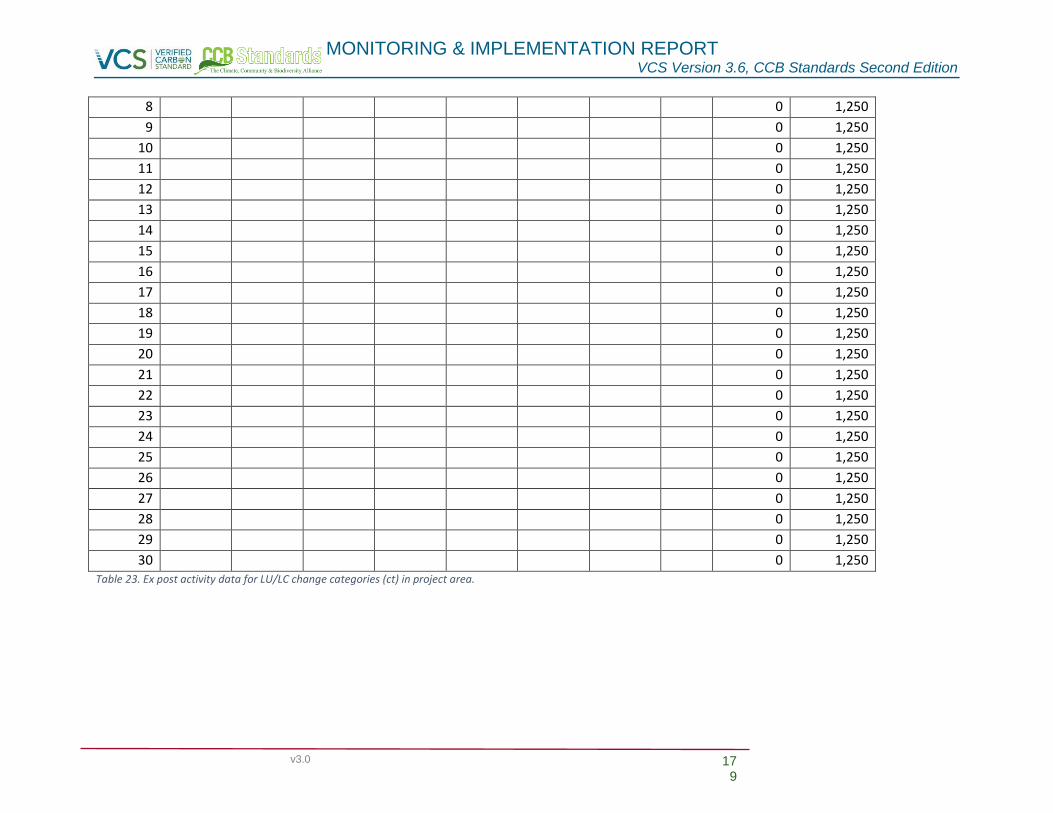
MONITORING & IMPLEMENTATION REPORT VCS Version 3.6, CCB Standards Second Edition
v3.0 179
8 0 1,250
9 0 1,250
10 0 1,250
11 0 1,250
12 0 1,250
13 0 1,250
14 0 1,250
15 0 1,250
16 0 1,250
17 0 1,250
18 0 1,250
19 0 1,250
20 0 1,250
21 0 1,250
22 0 1,250
23 0 1,250
24 0 1,250
25 0 1,250
26 0 1,250
27 0 1,250
28 0 1,250
29 0 1,250
30 0 1,250 Table 23. Ex post activity data for LU/LC change categories (ct) in project area.

MONITORING & IMPLEMENTATION REPORT VCS Version 3.6, CCB Standards Second Edition
v3.0 180
Project year t
Total carbon stock decrease due to unplanned activities
Total carbon stock increase due to planned activities
Total carbon stock decrease due to unavoided unplanned
deforestation
Total carbon stock change in the project scenario
annual cumulative annual cumulative annual cumulative annual cumulative
∆CPAdPAt ∆CPAdPA ∆CPAiPAt ∆CPAiPA ∆CUDdPAt ∆CUDdPA ∆CPSPAt ∆CPSPA
tCO2e tCO2e tCO2e tCO2e tCO2e tCO2e tCO2e tCO2e
1 221,949 221,949 0 0 744,625 744,625 0
2 301,737 523,686 0 0 1,024,242 1,768,867 0
3 64,137 587,823 0 0 214,798 1,983,664 0
4 587,823 0 0 1,983,664 0
5 587,823 0 0 1,983,664 0
6 587,823 0 0 1,983,664 0
7 587,823 0 0 1,983,664 0
8 587,823 0 0 1,983,664 0
9 587,823 0 0 1,983,664 0
10 587,823 0 0 1,983,664 0
11 587,823 0 0 1,983,664 0
12 587,823 0 0 1,983,664 0
13 587,823 0 0 1,983,664 0
14 587,823 0 0 1,983,664 0
15 587,823 0 0 1,983,664 0
16 587,823 0 0 1,983,664 0
17 587,823 0 0 1,983,664 0
18 587,823 0 0 1,983,664 0
19 587,823 0 0 1,983,664 0
20 587,823 0 0 1,983,664 0
21 587,823 0 0 1,983,664 0
22 587,823 0 0 1,983,664 0

MONITORING & IMPLEMENTATION REPORT VCS Version 3.6, CCB Standards Second Edition
v3.0 181
23 587,823 0 0 1,983,664 0
24 587,823 0 0 1,983,664 0
25 587,823 0 0 1,983,664 0
26 587,823 0 0 1,983,664 0
27 587,823 0 0 1,983,664 0
28 587,823 0 0 1,983,664 0
29 587,823 0 0 1,983,664 0
30 587,823 0 0 1,983,664 0 Table 24. Ex post estimated net carbon stock change in the project area under the project scenario.

MONITORING & IMPLEMENTATION REPORT VCS Version 3.6, CCB Standards Second Edition
v3.0 182
6.3 Leakage (CL3)
Leakage from activity displacement was monitored within the leakage belt. Ex-post emissions were quantified using the LULC transitions in the
leakage area, for the 2014 LULC map relative to the 2010 benchmark map. The LULC transitions that occurred within this time period were
assumed to be distributed linearly from 2010-2014 and were interpolated based off of the Project Start Date to the end of the first monitoring
period so as to accurately account for activity-shifting leakage emissions.
6.3.1 Leakage Belt
As specified by section 1.1.3 of the applicable methodology, VM0015 version 1.1 Methodology for Avoided Unplanned Deforestation,
the creation of a leakage belt is required and subject to monitoring, reporting and verification, especially if there is not a jurisdictional
system already in place. The leakage area is defined within VM0015 version 1.1 as consisting of the forested land areas surrounding
the project area in which baseline activities could be displaced due to project activities implemented in the project area.
To define the boundaries of the leakage belt, the mobility analysis (Option II) was selected from the possibilities outlined in the
methodology. A participatory rural appraisal was carried out by FUNDAECO in the form of a socioeconomic baseline study (see Base
socioeconómica - Altelia.pdf). Within this study, a variety of questions were asked in interviews with local community members
throughout the Project Zone.
Two questions which concerned direct deforestation by community agents were used to carry out the mobility analysis. These
questions asked the interviewees how far they would be willing to walk in order to obtain wood (i.e. for building etc.) and how far they
would be willing to walk in order to obtain firewood.
Reponses for these two questions were collected and then averaged separately (see Fundaeco Leakage Data.docx and Leakage -
Agents Mobility v1.1.xlsx). According to the results, community agents would be willing to walk an average of approximately 2.6
kilometers for wood and 1.6 kilometers for firewood. To exercise conservativeness, the greater of the two averages (2.6 kilometers)
was used as the maximum distance one would be willing to walk for wood resources and thus, the maximum distance for the leakage
belt boundaries. Roads, trails and pathways were considered the routes on which agents would travel in order to reach wood
resources.
A 2.6 kilometer buffer was created around all roads, trails and pathways that existed within the Project Area. In this buffering process,
an area was created where any part of a road, trail or pathway existing inside the project area acted as a central point from which 2.6
kilometers extended outward. In many instances, these buffered areas overlapped the Project Area and thus would be subject to the
MONITORING & IMPLEMENTATION REPORT VCS Version 3.6, CCB Standards Second Edition
v3.0 183
project activities which inhibited deforestation by agents for purposes of wood collection. These buffered areas which overlapped the
project area were not considered part of the leakage area.
The Leakage Area Limits included both the forest and non-forest areas within the buffer extending outward from the Project Area
boundaries. The forested areas within Leakage Area Limits are not subject to project activity implementation and thus would be
susceptible to leakage. Therefore, the forest areas falling within the 2.6 kilometer buffer outside of the project area boundaries were
uniquely exported and designated as the Leakage Area.
The figure below shows the Leakage Area limits and the results of the analysis described above.

MONITORING & IMPLEMENTATION REPORT VCS Version 3.6, CCB Standards Second Edition
v3.0 184
Figure 10. Map of the Leakage Area Limits and the baseline forest map.
Figure 11 below shows shows the Leakage Area, which consists of only forest within the Leakage Area Limits.

MONITORING & IMPLEMENTATION REPORT VCS Version 3.6, CCB Standards Second Edition
v3.0 185
Figure 11. Map of the Leakage Area, consisting of only the forest areas within the Leakage Area Limits above.
6.3.2 Leakage Emissions
Any ex-post emissions in the leakage belt that were found to exceed the baseline estimate were considered to be a result of leakage due to
activity displacement. The results of carbon stock and emissions monitoring within the leakage belt are summarized in the tables below. It is
estimated that there were 1,598 hectares deforested due to activity displacement leakage, however, the emissions due to leakage were not found
to exceed the baseline leakage emissions estimates, thus the total emissions from activity-shifting leakage was 0 tons. The only emissions from
leakage occurred to the default market effects leakage, calculated as 20% of the gross ex-post emissions reductions, and shown in Table 27.

MONITORING & IMPLEMENTATION REPORT VCS Version 3.6, CCB Standards Second Edition
v3.0 186
Activity data per LU/LC category ct within the leakage belt Total ex post deforestation in the leakage belt
IDct 4 5 6 7 8 9 10 11 ABSLLKt ABSLLK
Name W
ate
r
Urb
an
We
tlan
d
Per
man
ent
agri
cult
ure
An
nu
al a
gric
ult
ure
Pas
ture
Shru
bs
Oth
er n
on
-fo
rest
annual cumulative
Project year t
ha ha ha ha ha ha ha ha ha ha
1 4 2 0 34 41 219 311 2 612 612
2 5 3 0 46 54 291 413 2 813 1,426
3 1 1 0 10 11 61 87 0 172 1,598
4 0 1,598
5 0 1,598
6 0 1,598
7 0 1,598
8 0 1,598
9 0 1,598
10 0 1,598
11 0 1,598
12 0 1,598
13 0 1,598
14 0 1,598
15 0 1,598
16 0 1,598
17 0 1,598
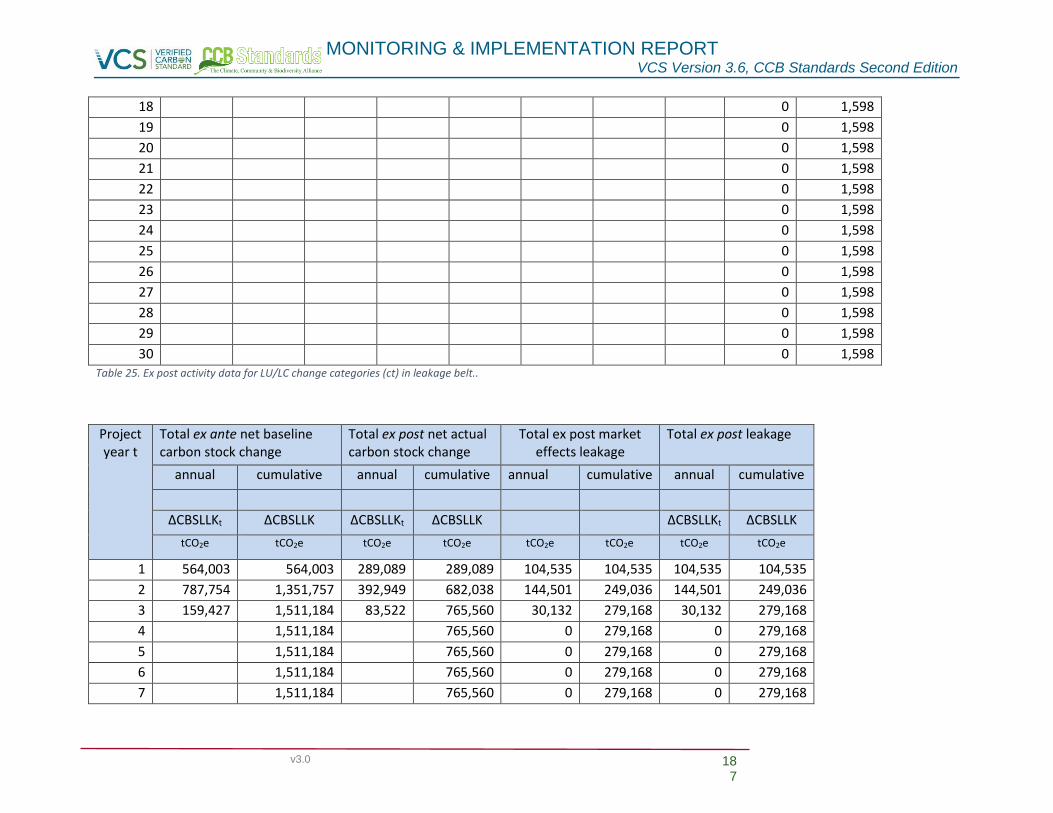
MONITORING & IMPLEMENTATION REPORT VCS Version 3.6, CCB Standards Second Edition
v3.0 187
18 0 1,598
19 0 1,598
20 0 1,598
21 0 1,598
22 0 1,598
23 0 1,598
24 0 1,598
25 0 1,598
26 0 1,598
27 0 1,598
28 0 1,598
29 0 1,598
30 0 1,598 Table 25. Ex post activity data for LU/LC change categories (ct) in leakage belt..
Project year t
Total ex ante net baseline carbon stock change
Total ex post net actual carbon stock change
Total ex post market effects leakage
Total ex post leakage
annual cumulative annual cumulative annual cumulative annual cumulative
∆CBSLLKt ∆CBSLLK ∆CBSLLKt ∆CBSLLK ∆CBSLLKt ∆CBSLLK
tCO2e tCO2e tCO2e tCO2e tCO2e tCO2e tCO2e tCO2e
1 564,003 564,003 289,089 289,089 104,535 104,535 104,535 104,535
2 787,754 1,351,757 392,949 682,038 144,501 249,036 144,501 249,036
3 159,427 1,511,184 83,522 765,560 30,132 279,168 30,132 279,168
4 1,511,184 765,560 0 279,168 0 279,168
5 1,511,184 765,560 0 279,168 0 279,168
6 1,511,184 765,560 0 279,168 0 279,168
7 1,511,184 765,560 0 279,168 0 279,168

MONITORING & IMPLEMENTATION REPORT VCS Version 3.6, CCB Standards Second Edition
v3.0 188
8 1,511,184 765,560 0 279,168 0 279,168
9 1,511,184 765,560 0 279,168 0 279,168
10 1,511,184 765,560 0 279,168 0 279,168
11 1,511,184 765,560 0 279,168 0 279,168
12 1,511,184 765,560 0 279,168 0 279,168
13 1,511,184 765,560 0 279,168 0 279,168
14 1,511,184 765,560 0 279,168 0 279,168
15 1,511,184 765,560 0 279,168 0 279,168
16 1,511,184 765,560 0 279,168 0 279,168
17 1,511,184 765,560 0 279,168 0 279,168
18 1,511,184 765,560 0 279,168 0 279,168
19 1,511,184 765,560 0 279,168 0 279,168
20 1,511,184 765,560 0 279,168 0 279,168
21 1,511,184 765,560 0 279,168 0 279,168
22 1,511,184 765,560 0 279,168 0 279,168
23 1,511,184 765,560 0 279,168 0 279,168
24 1,511,184 765,560 0 279,168 0 279,168
25 1,511,184 765,560 0 279,168 0 279,168
26 1,511,184 765,560 0 279,168 0 279,168
27 1,511,184 765,560 0 279,168 0 279,168
28 1,511,184 765,560 0 279,168 0 279,168
29 1,511,184 765,560 0 279,168 0 279,168
30 1,511,184 765,560 0 279,168 0 279,168 Table 26. Baseline activity data for LU/LC change categories (ct) in leakage belt

MONITORING & IMPLEMENTATION REPORT VCS Version 3.6, CCB Standards Second Edition
v3.0 189
Project year t
Total ex post GHG emissions from increase grazing
activities
Total ex post estimated increase in GHG emissions due to displaced
forest fires
Total ex post estimated decrease
in carbon stocks due to displaced
deforestation
Carbon stock decrease due to
leakage prevention measures
Total net carbon stock change due to
leakage
Total net increase in emissions due to
leakage
annual cumulative annual cumulative annual cumulative annual cumulative annual cumulative annual cumulative
∆EgLK
t ∆EgLK ∆EADLK
t ∆EADLK ∆CADLK
t ∆CADLK ∆CLPMLK
t ∆CLPML
K ∆CLKt ∆CLK ELKt ELK
tCO2e tCO2e tCO2e tCO2e tCO2e tCO2e tCO2e tCO2e tCO2e tCO2e tCO2e tCO2e
1 0 0 0 0 104,535 104,535 0 0 104,535
104,535 104,535
104,535
2 0 0 0 0 144,501 249,036 0 0 144,501
249,036 144,501
249,036
3 0 0 0 0 30,132 279,168 0 0 30,132 279,168 30,132 279,168
4 0 0 0 0 0 279,168 0 0 0 279,168 0 279,168
5 0 0 0 0 0 279,168 0 0 0 279,168 0 279,168
6 0 0 0 0 0 279,168 0 0 0 279,168 0 279,168
7 0 0 0 0 0 279,168 0 0 0 279,168 0 279,168
8 0 0 0 0 0 279,168 0 0 0 279,168 0 279,168
9 0 0 0 0 0 279,168 0 0 0 279,168 0 279,168
10 0 0 0 0 0 279,168 0 0 0 279,168 0 279,168
11 0 0 0 0 0 279,168 0 0 0 279,168 0 279,168
12 0 0 0 0 0 279,168 0 0 0 279,168 0 279,168
13 0 0 0 0 0 279,168 0 0 0 279,168 0 279,168
14 0 0 0 0 0 279,168 0 0 0 279,168 0 279,168
15 0 0 0 0 0 279,168 0 0 0 279,168 0 279,168
16 0 0 0 0 0 279,168 0 0 0 279,168 0 279,168
17 0 0 0 0 0 279,168 0 0 0 279,168 0 279,168
18 0 0 0 0 0 279,168 0 0 0 279,168 0 279,168
19 0 0 0 0 0 279,168 0 0 0 279,168 0 279,168

MONITORING & IMPLEMENTATION REPORT VCS Version 3.6, CCB Standards Second Edition
v3.0 190
20 0 0 0 0 0 279,168 0 0 0 279,168 0 279,168
21 0 0 0 0 0 279,168 0 0 0 279,168 0 279,168
22 0 0 0 0 0 279,168 0 0 0 279,168 0 279,168
23 0 0 0 0 0 279,168 0 0 0 279,168 0 279,168
24 0 0 0 0 0 279,168 0 0 0 279,168 0 279,168
25 0 0 0 0 0 279,168 0 0 0 279,168 0 279,168
26 0 0 0 0 0 279,168 0 0 0 279,168 0 279,168
27 0 0 0 0 0 279,168 0 0 0 279,168 0 279,168
28 0 0 0 0 0 279,168 0 0 0 279,168 0 279,168
29 0 0 0 0 0 279,168 0 0 0 279,168 0 279,168
30 0 0 0 0 0 279,168 0 0 0 279,168 0 279,168 Table 27. Ex post estimated total leakage.

MONITORING & IMPLEMENTATION REPORT VCS Version 3.6, CCB Standards Second Edition
v3.0 191
6.4 Summary of GHG Emission Reductions and Removals (CL1, CL2)
Net GHG emission reductions were quantified using equation 19 of the methodology and calculated in the
Accounting model (Fundaeco VM0015 Accounting Model v1.46.xlsm). The full calculation of net
emissions reductions, taking into account the differences between the baseline scenario, the ex-post
project emissions and the leakage emissions is shown in MR tables section of the accounting model,
Table BJ. Vintages were established by year, 2014 vintages were prorated based on the monitoring date.
Net GHG emissions reductions are presented in Table 28 and VCUs are shown in Table 29 per
equations 20 and 21 of the methodology. The risk rating remains at 13%, unchanged since validation.
Table 28. Total ex –post estimated emissions reductions.
Years Estimated GHG emission reductions or
removals (tO2e)
2012 350,193
2013 484,078
2014 100,943
Total estimated VCUs 935,214
Table 29.VCUs; Total ex-post estimated emissions reductions, net of the allocation to the buffer pool.
6.5 Climate Change Adaptation Benefits (GL1)
The project is not seeking Gold Level verification for climate change adaption benefits this monitoring
period.
Years Emission reductions
from avoided
deforestation
(tCO2e)
Project emissions
(tCO2e)
Leakage emissions
(tCO2e)
Estimated net GHG
emission reductions
or removals (tCO2e)
2012 744,625 221,949 0 418,141
2013 1,024,242 301,737 0 578,004
2014 214,798 64,137 0 120,528
Total
1,983,664 587,823 0 1,116,673

MONITORING & IMPLEMENTATION REPORT VCS Version 3.6, CCB Standards Second Edition
v3.0 192
7 COMMUNITY
7.1 Net Positive Community Impacts (CM2 & CM4)
A study on the drivers of deforestation in the Sarstun Motagua Region identifies the lack of economic and
employment opportunities as the strongest factor for deforestation in the region where the REDD+ Project
is located. This underlying driver can be tackled improving two basic conditions that will then trigger
positive long-term impacts: a) Access to Resources and Economic Opportunities, and b) Education.
Other factors such as the lack of laws and law enforcement were recognized as well and need to be
addressed not only trough forest protection in the field, but also through the litigation and the guarantee of
a legal protection status for the most vulnerable forests.
Also, the study indicated the importance of the demand of the communities to participate in avoiding deforestation; because if local communities are not involved the development of the project, then the project will hardly be successful. Since most of the communities participating in the proposed project have organized groups and other links, it is important to always considerate them in order to create catalytic impacts.
7.1.1 Resource Protection
Lack of Law and Law enforcement were mentioned as factors in the drivers of deforestation analysis, and
they were also mentioned during the workshops carried out during project development at various
conflict-resolution roundtable meetings which meet annually (Table 30 ).
Protection, Control and Surveillance:
Even when part of the project is located in protected areas, the Guatemalan government does not enough
budget to hire the number of park guards needed to cover the project area surface, or to finance the
control and surveillance activities. Therefore several forests without control and surveillance are more
vulnerable to deforestation. During the reporting period, the project hired more park guards in order to
increase presence in vulnerable areas and provided equipment, supplies and fuel to develop patrolling
activities. This program was implemented with the National Council of Protected Areas (CONAP) and the
Nature Protection Department of the National Police (DIPRONA). During the reporting period 14101 ha
of watersheds were protected as important water source for communities and towns in the project zone.
(Table 30)
Establishment of Nature Reserves:
This activity includes actions such as: conservation agreements with local communities; protection of
individual and community forest through forest incentives PINFOR and PINPEP; and land acquisition as
a strategy used to protect highly threatened forests, where there is need of immediate action; and also for
strategically located forests, which protection can avoid the deforestation of other threatened lands, by
stopping or reducing access. During the reporting period 7891ha of forest were registered in the forest
incentive programs PINFOR and PINPEP
Environmental Litigation and Advocacy:
In order to deter illegal logging and illegal deforestation, FUNDAECO sought to strengthen forestry and
protected area law enforcement in the project region. This was carried out through legal complaints and
selective litigation in relevant or precedent setting cases.

MONITORING & IMPLEMENTATION REPORT VCS Version 3.6, CCB Standards Second Edition
v3.0 193
FUNDAECO worked closely with the National Police, the Public Prosecutor Office (“Ministerio Público”)
and the local Courts in order to ensure proper follow-up to high priority cases. In addition, legal advice
was provided to forest owners seeking counsel or assistance, in cases where their forests might be
threatened. Also in order to reduce conflicts around land and forest, the project fostered a constant
dialogue through the Conflict Resoluction Rentable; FUNDAECO participated in 6 meetings during the
reporting period.
Lobbying efforts were concentrated mainly in the Declaration by the National Congress of Sierra Caral
and Sierra Santa Cruz Protected Area. FUNDAECO is lobbying Government Agencies in order to ensure
their overall support to project activities and more particularly to programs in the region that will leverage
public funds in support of the project, such as the PINFOR-PROBOSQUE and PINPEP Forest Subsidy
Programs, as described below in Table 30.
Finally, as the project encompasses the removal of technical staff in government agencies, lobbying
actions ensure that entrant public officials are informed of the project, understand its importance, and
support its successful implementation over the years. Monitoring results for this project activity group are
presented below.
Project
Activity
Group
Number Project
Activity
Indicator Frequency Data Source/
Reference
Monitoring
Result
Resource
Protection,
Governance,
and
Monitoring
3 Registered
land into
PINFOR or
PINPEP
# hectares of
lands
FUNDAECO
helped to
register with
PINFOR/PINPEP
Annually PINFOR/PINPEP
database
7891.37
Resource
Protection,
Governance,
and
Monitoring
12 Protection
and
management
of
community
water
sources
# hectares of
water source
protected
Annually conservation
agreements,
watershed
protection
database
14101.21
Resource
Protection,
Governance,
and
Monitoring
14 Conflict
resolution
roundtable
# meetings
participated in on
roundtable
Annually meeting records/
reports/ minutes
6
Resource
Protection,
Governance,
and
Monitoring
14 Conflict
resolution
roundtable
Records of
meetings
Annually records 6
Table 30. Resource Protection and Governance monitoring records.

MONITORING & IMPLEMENTATION REPORT VCS Version 3.6, CCB Standards Second Edition
v3.0 194
7.1.2 Sustainable Enterprise
Access to resources covered the first part of the productive cycle, leading to long-term impacts if
economic activities become sustainable in the long term. FUNDAECO experience is that funding is not
enough, over the time and in scale, if people do not have the ability and the conditions to be self-
sufficient. In this sense, the project supports local enterprise so that stakeholders are presented with
opportunities to become economically empowered through sustainable activity.
The project supported agroforestry producers, handcraft producers and people giving ecotourism services
through the creation of avenues to assist in selling products and services as well as the provision of
services to show how to sustainably manage economic activity. FUNDAECO has directly hired 19
individuals from the project region as agroforestry promotors and technicians, and has also enrolled 107
landowners in the project region in PINPEP or PINFOR reforestation and agroforestry programs during
the reporting period, Through enrollment into these programs, beneficiaries are receiving or will receive
Q15,600.00 per hectare of benefits. for participating landowners (Table 31). In providing alternative
sources of revenue to participants in the project, FUNDAECO aids in economically empowering the local
communities through sustainable practices.
Other activities under this program include support for marketing and branding of products and
ecotourism sites as well as access to markets. The project especially aimed to support women in
sustainable enterprise and in since project commencement, has support 50 women in achieving
sustainable production goals (see Table 31).
The project also produced plants in community nurseries, which are given to farmers as part of the
Access to Resources Program. The project has supported the established of 12 nurseries by local or
community entrepreneurs.
With long-term support from FUNDAECO, stakeholders and local enterprise currently experience and
look forward to continued economic empowerment through sustainable activities. More detailed
monitoring results for this project activity group are presented below.
Project
Activity
Group
Number Project
Activity
Indicator Frequency Data Source/
Reference
Monitoring
Result
Sustainable Enterprises
25 FUNDAECO nurseries
# nurseries established
Annually nurseries database
1
Sustainable Enterprises
27 Community nurseries
# nurseries established
Annually nurseries database/ nurseries contracts
12
Sustainable Enterprises
30 Hire agroforestry promoters/technician from the project region
# agroforestry promotors hired from the project region
Annually invoices/ agreements
19

MONITORING & IMPLEMENTATION REPORT VCS Version 3.6, CCB Standards Second Edition
v3.0 195
Sustainable Enterprises
21 plantations for timber production
# of farmers supported for timber plantations
Annually agroforestry database
107
Sustainable Enterprises
18 Creation of agroforestry plots
# farmers participating in agroforestry projects
Annually agroforestry database
137
Sustainable Enterprises
22 Reforestation and Agroforestry PINFOR or PINPEP
# landowners participating in program
Annually 107
Sustainable Enterprises
30 Hire agroforestry promoters from project region
# agroforestry promotors hired from project region
Annually payrolls (planillas)
19
Sustainable Enterprises
27 Community nurseries
# community entrepreneurs
Annually invoices/agreements
12
Sustainable Enterprises
23 Construction of ecotourism sites
# of ecotourism sites established
Annually ecotourism infrastructure investments inventory
1
Sustainable Enterprises
Support to women in sustainable enterprises productive projects
# of women supported
Annually Records 50
Sustainable Enterprises
22 Reforestation and Agroforestry PINFOR or PINPEP
$ per hectare of benefits for landowners in program
Annually PINFOR/PINPEP database
Q15,600.00
Table 31. Sustainable enterprises monitoring records.

MONITORING & IMPLEMENTATION REPORT VCS Version 3.6, CCB Standards Second Edition
v3.0 196
7.1.3 Community Empowerment and Inclusiveness
FUNDAECO’s experience has demonstrated that to include communities in the management of natural
resources decision, means not only the respect communities Rights but also to trigger a positive effect
that raises awareness on nature values and services, and guarantees nature conservation in the long
term.
Land legalization
Land tenure was mention as a deforestation factor, and was one of the main demands from communities
during the consultation. The project supports communities in the legal process to obtain their land titles,
and works closely with all institutions involved in the process such as municipalities, FONTIERRA and
MICAI. The project has already registered roughly 6,359 hectares into local and national databases for
legal land registration (Table 32). Land legalization increases engagement in the fight against
deforestation and enables new communities to integrate their forest into the project to generate VCUs,
and also to present these forests to the national incentives forest program.
Participatory Protected Area Governance and Management
With support from the Project, and in close coordination with CONAP, FUNDAECO fosters the
participatory governance and management of protected areas in the project region. This was done by
supporting the establishment and continued operation of a series of formal mechanisms and local
governance bodies that ensure the participation of local stakeholders, communities and resource users in
management decision making.
In protected areas across the region, Local Executive Councils or Local Advisory Councils (as established
in each Protected Area’s Decree of establishment), which integrate both Government Officials, Municipal
Authorities and Community representatives, are conveyed and supported.; also, “Protected Area Inter-
Communal Councils”, or General Assemblies of communities located within a given protected area, are
also being established (locations not formally established), conveyed and supported. Four associations
and 1 CEL participated in protected area management and helped to serve in protected area councils
(Table 32).
Likewise, Resource User Associations, such as fishermen associations or specific resource managers
(such as Xate Producers) were supported, in order to ensure their direct participation in management
activities for each resource. In exchange for their support, 7 fishermen have participated in reef
monitoring in the project area (Table 32). Strengthening community involvement in protected area
governance and maintenance allows for direct inclusion of local stakeholders into project happenings.
Other groups were also supported for their direct participation and involvement: 12 local health
commissions are directly administrating community health facilities (Clínicas Comunitarias de la Mujer),
and 12 midwives are enrolled to increase their skills and are using the health facilities and equipment
provided by the Project to provide their services.
These mechanisms support conflict resolution, participatory planning, self-regulation and strong
endorsement to key management decisions in support of forest conservation across the region.
Monitoring results for this project activity group are presented below.
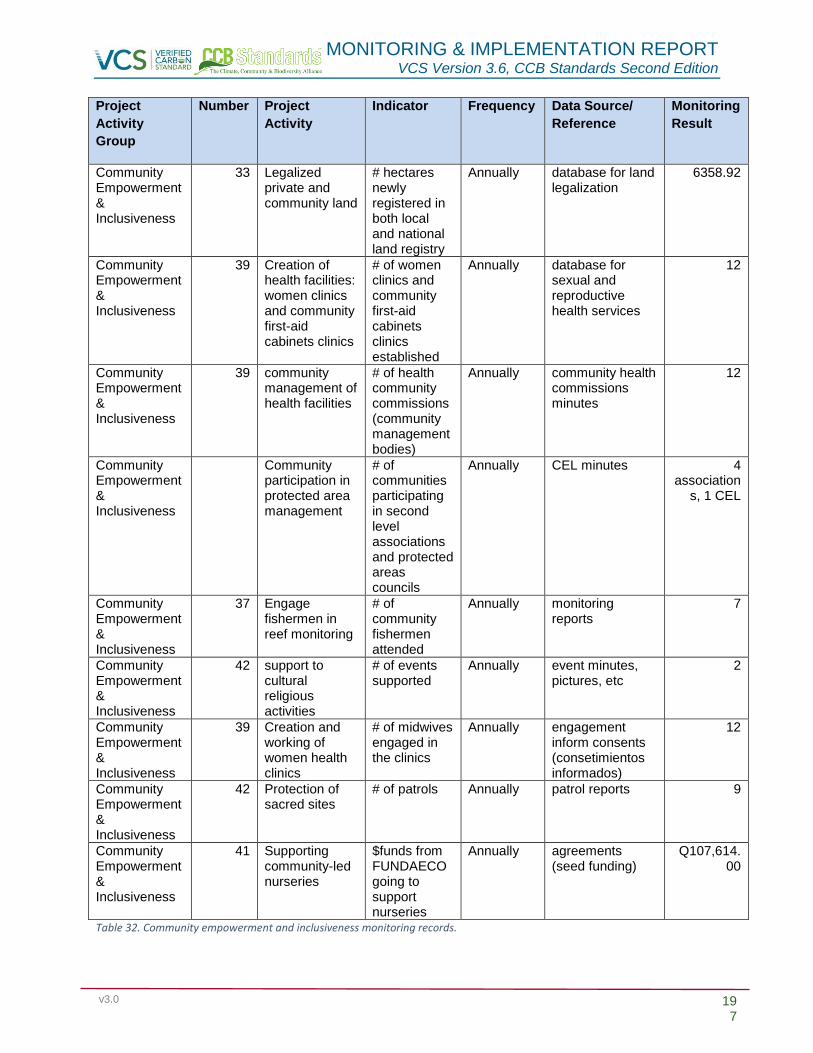
MONITORING & IMPLEMENTATION REPORT VCS Version 3.6, CCB Standards Second Edition
v3.0 197
Project
Activity
Group
Number Project
Activity
Indicator Frequency Data Source/
Reference
Monitoring
Result
Community Empowerment & Inclusiveness
33 Legalized private and community land
# hectares newly registered in both local and national land registry
Annually database for land legalization
6358.92
Community Empowerment & Inclusiveness
39 Creation of health facilities: women clinics and community first-aid cabinets clinics
# of women clinics and community first-aid cabinets clinics established
Annually database for sexual and reproductive health services
12
Community Empowerment & Inclusiveness
39 community management of health facilities
# of health community commissions (community management bodies)
Annually community health commissions minutes
12
Community Empowerment & Inclusiveness
Community participation in protected area management
# of communities participating in second level associations and protected areas councils
Annually CEL minutes 4 association
s, 1 CEL
Community Empowerment & Inclusiveness
37 Engage fishermen in reef monitoring
# of community fishermen attended
Annually monitoring reports
7
Community Empowerment & Inclusiveness
42 support to cultural religious activities
# of events supported
Annually event minutes, pictures, etc
2
Community Empowerment & Inclusiveness
39 Creation and working of women health clinics
# of midwives engaged in the clinics
Annually engagement inform consents (consetimientos informados)
12
Community Empowerment & Inclusiveness
42 Protection of sacred sites
# of patrols Annually patrol reports 9
Community Empowerment & Inclusiveness
41 Supporting community-led nurseries
$funds from FUNDAECO going to support nurseries
Annually agreements (seed funding)
Q107,614.00
Table 32. Community empowerment and inclusiveness monitoring records.

MONITORING & IMPLEMENTATION REPORT VCS Version 3.6, CCB Standards Second Edition
v3.0 198
7.1.4 Education
Education can influence multiples situations; access to better job opportunities, decision making in family economy, and decision making in natural resources management, which implies that it can generate multiple positive impacts. Therefore in the project, education as a project activity has several approaches.
Education for opportunities The project provides direct training and education opportunities to youth, especially to women. This allows youngsters to develop new capacities for the implementation of sustainable productive activities that a have a good potential in the project area, such as; ecotourism, agroforestry and sale of agroforestry products and forest protection. Past training events participation has included: 50 attendees at an annual workshop for designing handicrafts, 85 attendees at an annual workshop for managing a business and 15
attendees at an annual workshop for training for ecotourism services (Table 33).
In terms of the youth, 24 schools with a total of 942 students participated in environmental education programs and 4,071 students were recorded as visiting ecotourism centers in the last year which were set
up by the project (Table 33).
Education for Life
Education triggers to a life change not only because technical capacities are increased, but because people can envision different paths to their future. As explained in the community section, conditions without the project, girls living in the project region are turned in to moms at a very young age, condemning them and their families to poverty.
The project tackles this situation by supporting girls to finish elementary school and continue to high school and accompanying benefited girls with integral education on girl and women rights, especially family planning rights. In addition to the many opportunities for agroforestry, handicraft and small business training available for women, the project has carried out events to educate about health and health services, especially concerning women. In the past year, the project team give and organized 135 talks on sexual and reproductive rights and heath, 3 health outreach events were held within communities in the project, and 6 contracts were signed for peer-to-peer health educators acting as volunteers in their communities. Please see the table below for more details.
Education for Resource Management Communities are willing to take the best decisions that guarantee natural resources in the long term as well as reduce emissions from deforestation; therefore the project provides training that creates the ability and capacity of communities to implement sustainable resource management techniques. These have included at least 10 workshops specific to marine biodiversity monitoring, agroforestry production and care as well as ecotourism.
Education positive impacts
Widespread awareness among women and families of reproductive rights and health Increased access to health information and care within the project zone Widespread access to community capacity building and educational opportunities Recognition and assistance in protection of significant traditional, cultural, spiritual, and religious
sites.
Monitoring results for this project activity group are presented in the table below.
Project Activity
Number Project Activity Indicator Frequency Data Source/ Monitoring
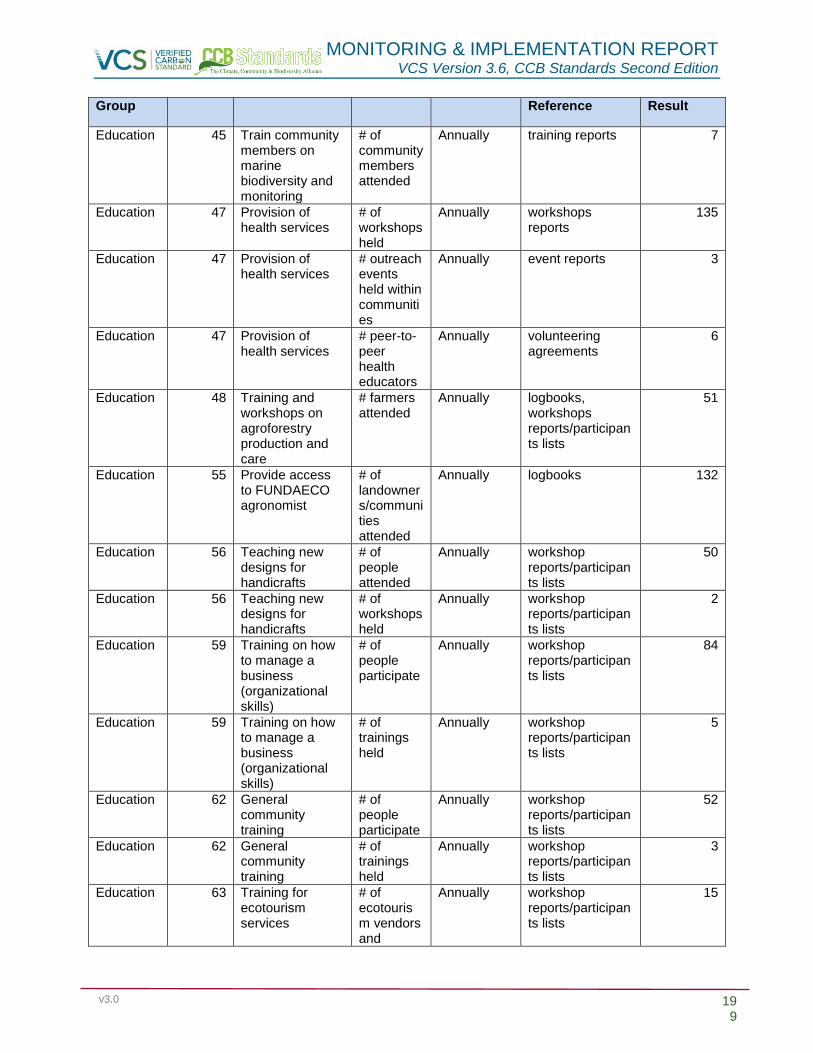
MONITORING & IMPLEMENTATION REPORT VCS Version 3.6, CCB Standards Second Edition
v3.0 199
Group Reference Result
Education 45 Train community members on marine biodiversity and monitoring
# of community members attended
Annually training reports 7
Education 47 Provision of health services
# of workshops held
Annually workshops reports
135
Education 47 Provision of health services
# outreach events held within communities
Annually event reports 3
Education 47 Provision of health services
# peer-to-peer health educators
Annually volunteering agreements
6
Education 48 Training and workshops on agroforestry production and care
# farmers attended
Annually logbooks, workshops reports/participants lists
51
Education 55 Provide access to FUNDAECO agronomist
# of landowners/communities attended
Annually logbooks 132
Education 56 Teaching new designs for handicrafts
# of people attended
Annually workshop reports/participants lists
50
Education 56 Teaching new designs for handicrafts
# of workshops held
Annually workshop reports/participants lists
2
Education 59 Training on how to manage a business (organizational skills)
# of people participate
Annually workshop reports/participants lists
84
Education 59 Training on how to manage a business (organizational skills)
# of trainings held
Annually workshop reports/participants lists
5
Education 62 General community training
# of people participate
Annually workshop reports/participants lists
52
Education 62 General community training
# of trainings held
Annually workshop reports/participants lists
3
Education 63 Training for ecotourism services
# of ecotourism vendors and
Annually workshop reports/participants lists
15

MONITORING & IMPLEMENTATION REPORT VCS Version 3.6, CCB Standards Second Edition
v3.0 200
ecotourism staff participate
Education 63 Training for ecotourism services
# of trainings held
Annually workshop reports/participants lists
2
Education 45 Train community members on marine biodiversity and monitoring
# of community members attended
Annually training reports 7
Education 47 Provision of health services
# of workshops held
Annually training report/participants lists
135
Education 47 Provision of health services
# outreach events held within communities
Annually training report/participants lists
3
Education 47 Provision of health services
# peer-to-peer health educators
Annually volunteering agreements
6
Education 48 Training and workshops on agroforestry production and care
# of people attended
Annually training reports/participants list
51
Education 48 Training and workshops on agroforestry production and care
# of workshops held
Annually training reports/participants list
4
Education 50 Environmental education for schools
# schools participating with FUNDAECO
Annually event reports/participants list
24 schools, 942
students
Education 50 Environmental education for schools
# students visiting ecotourism centers
Annually event reports/participants list
4071
Education 51 Environmental education for interested communities
# workshops or events held
Annually event reports/participants list
10
Education 56 Teaching new designs for handicrafts
# of people attended
Annually training reports/participants list
50
Education 56 Teaching new designs for handicrafts
# of workshops held
Annually training reports/participants list
2
Education 58 Training on ecotourism services
# people trained
Annually training reports/participants list
15

MONITORING & IMPLEMENTATION REPORT VCS Version 3.6, CCB Standards Second Edition
v3.0 201
Education 59 Training on how to manage a business (organizational skills)
# trainings held
Annually training reports/participants list
5
Education 62 General community training
# trainings held
Annually training reports/participants list
3
Table 33. Education monitoring records.
7.1.5 Access to Resources
People depend on the expansion of agriculture and need land for growing crops. The experience of
FUNDAECO in the region has showed that people deforest because they need land to expand their crops
and where yields barely produce incomes to local farmers.
Implementing a model where people don’t depend on extracting timber for their household or expanding
agricultural lands for the culture of crops with low productivity yields (that can barely feed them and give
them a little extra money) requires the provision of conditions and resources that guarantee sustainable
livelihoods. During the consultation, people asked for support to implement new and more productive
crops. Some of them are individuals and some others are already organized in producers associations,
that although they have achieved some success, they still needed training and funding or to start working.
With more than 20 years of work in the region FUNDAECO with some communities, have experienced with alternative economic activities, and found several that well accepted by people and that profit from the natural potential of the region; ecotourism, forestry and agroforestry.
Livelihoods Under this program, the project ensures supplies and conditions to help local farmers in the initial but fundamental phases for sustainable livelihoods. The idea is to support the whole production cycle so at the end communities or individuals are not only producing quality products that can be sold and generate incomes; the impact is not only that people generate sufficient household income but that pressure over the forest will be reduced. Through the creation of nurseries and provision of more than 295,000 plants/seedlings, FUNDAECO has helped to support 107 beneficiaries through the whole production cycle so that associated costs are less burdensome and stakeholders have room to make more sustainable choices (Table 34).
The project also supports individuals and communities to access to the forest incentives program –PINFOR and PINPEP/PROBOSQUE. Currently, there are 158 families receiving payments from PINFOR
and PINPEP/PRBOSQUE as a result of the project (Table 34). FUNDAECO has assisted numerous
landowners in establishing management plans and has also assisted with legal and logistical services to
help landowners successfully register in incentive programs (Table 34). Traditionally, through the
preparation of forest inventories, management plans as well as the legal files requires by the programs, the overall costs cannot be paid by poor people. The hope is that with support from FUNDAECO, these programs are more accessible to local stakeholders.
Natural resources The need for timber and firewood is recognized and integrated in the project. Therefore the project supports legal access to firewood and family wood needs, and also supports plantations for sustainable timber production. Currently, there are 107 farmers who are being supported by FUNDAECO for
sustainable timber production (See Table 34).
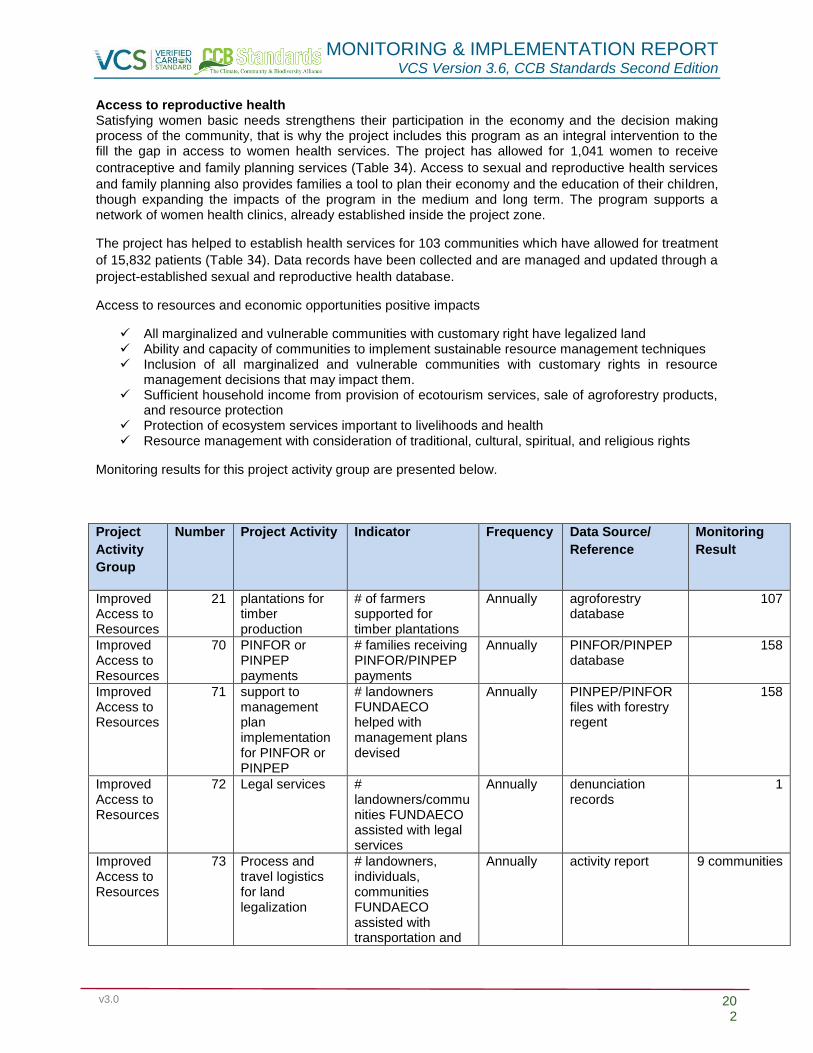
MONITORING & IMPLEMENTATION REPORT VCS Version 3.6, CCB Standards Second Edition
v3.0 202
Access to reproductive health Satisfying women basic needs strengthens their participation in the economy and the decision making process of the community, that is why the project includes this program as an integral intervention to the fill the gap in access to women health services. The project has allowed for 1,041 women to receive
contraceptive and family planning services (Table 34). Access to sexual and reproductive health services
and family planning also provides families a tool to plan their economy and the education of their children, though expanding the impacts of the program in the medium and long term. The program supports a network of women health clinics, already established inside the project zone.
The project has helped to establish health services for 103 communities which have allowed for treatment
of 15,832 patients (Table 34). Data records have been collected and are managed and updated through a
project-established sexual and reproductive health database.
Access to resources and economic opportunities positive impacts
All marginalized and vulnerable communities with customary right have legalized land Ability and capacity of communities to implement sustainable resource management techniques Inclusion of all marginalized and vulnerable communities with customary rights in resource
management decisions that may impact them. Sufficient household income from provision of ecotourism services, sale of agroforestry products,
and resource protection Protection of ecosystem services important to livelihoods and health Resource management with consideration of traditional, cultural, spiritual, and religious rights
Monitoring results for this project activity group are presented below.
Project
Activity
Group
Number Project Activity Indicator Frequency Data Source/
Reference
Monitoring
Result
Improved Access to Resources
21 plantations for timber production
# of farmers supported for timber plantations
Annually agroforestry database
107
Improved Access to Resources
70 PINFOR or PINPEP payments
# families receiving PINFOR/PINPEP payments
Annually PINFOR/PINPEP database
158
Improved Access to Resources
71 support to management plan implementation for PINFOR or PINPEP
# landowners FUNDAECO helped with management plans devised
Annually PINPEP/PINFOR files with forestry regent
158
Improved Access to Resources
72 Legal services # landowners/communities FUNDAECO assisted with legal services
Annually denunciation records
1
Improved Access to Resources
73 Process and travel logistics for land legalization
# landowners, individuals, communities FUNDAECO assisted with transportation and
Annually activity report 9 communities
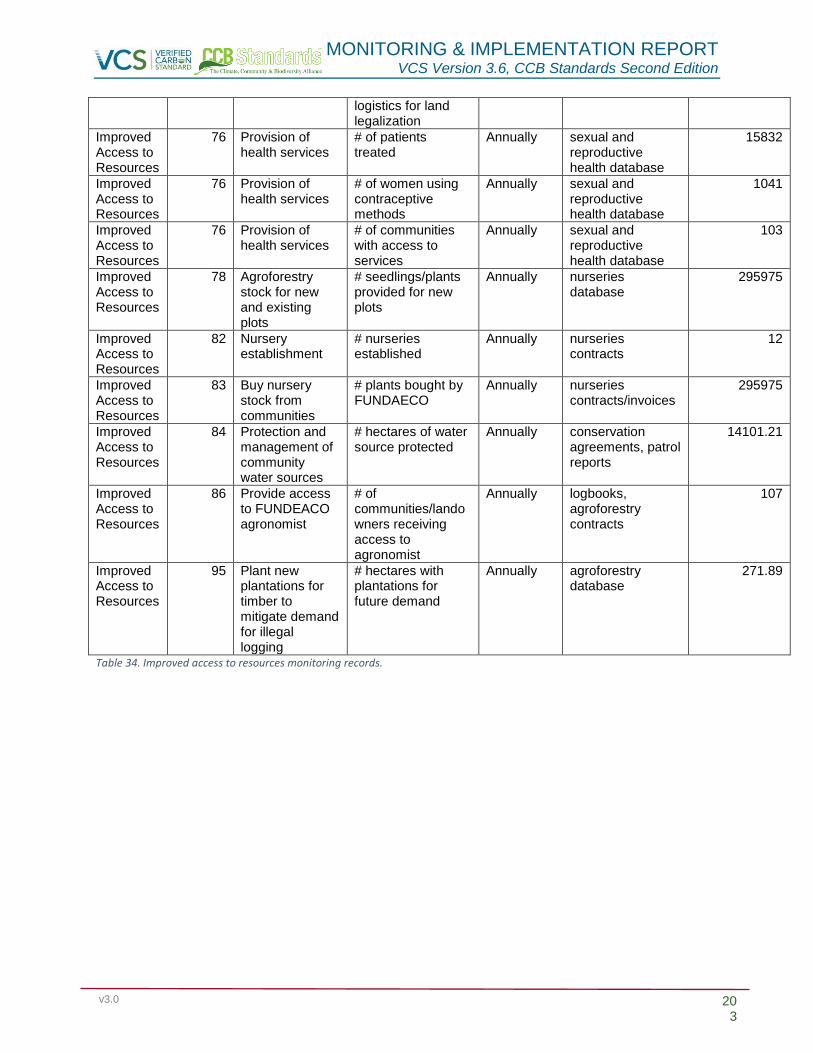
MONITORING & IMPLEMENTATION REPORT VCS Version 3.6, CCB Standards Second Edition
v3.0 203
logistics for land legalization
Improved Access to Resources
76 Provision of health services
# of patients treated
Annually sexual and reproductive health database
15832
Improved Access to Resources
76 Provision of health services
# of women using contraceptive methods
Annually sexual and reproductive health database
1041
Improved Access to Resources
76 Provision of health services
# of communities with access to services
Annually sexual and reproductive health database
103
Improved Access to Resources
78 Agroforestry stock for new and existing plots
# seedlings/plants provided for new plots
Annually nurseries database
295975
Improved Access to Resources
82 Nursery establishment
# nurseries established
Annually nurseries contracts
12
Improved Access to Resources
83 Buy nursery stock from communities
# plants bought by FUNDAECO
Annually nurseries contracts/invoices
295975
Improved Access to Resources
84 Protection and management of community water sources
# hectares of water source protected
Annually conservation agreements, patrol reports
14101.21
Improved Access to Resources
86 Provide access to FUNDEACO agronomist
# of communities/landowners receiving access to agronomist
Annually logbooks, agroforestry contracts
107
Improved Access to Resources
95 Plant new plantations for timber to mitigate demand for illegal logging
# hectares with plantations for future demand
Annually agroforestry database
271.89
Table 34. Improved access to resources monitoring records.
MONITORING & IMPLEMENTATION REPORT VCS Version 3.6, CCB Standards Second Edition
v3.0 204
7.2 Negative Offsite Stakeholder impacts (CM3 & CM4)
It is expected that the implementation of the REDD+ Project will continue to impact positively the
stakeholders and their communities. However, through a deep analysis exercise with the project team
and a compilation of the main concerns expressed by the communities during the Free, Prior and
Informed Consent process, the team of the project has identified potential negative impacts and their
mitigation measures.
A main concern of most of the stakeholders is that the REDD+ Project will affect their ownership of the
land, if these doubts are not clarified in time, it could propitiate a snowball effect causing nonconformity in
the project and the possible case of cancellation of contracts. As a mitigation measure, these doubts were
clarified during the FPIC meetings and it is constantly reminded that carbon contracts will not cause the
loss of land titles.
If there is inadequate surveillance a case of leakage could occur; on one hand there may be cases of
unregulated logging in a nonparticipating community in the project by members of a participating
community, and, on the other hand, external people could be lodging inside a property of a project
partner. These potential negative impacts are mitigated by successfully implementing the control and
surveillance plan and the law reinforce and litigation actions.
Another possible negative impact related to the livelihood of a percentage of the community working in
sawmills, where the misunderstanding of unemployment caused by the REDD+ Project may trigger
dissatisfaction and disappointment in the project. That is why, during the implementation of the project it
has been relevant to explain and clarify that sawmill workers may ask for Extraction and Transportation
Permits to continue their work under the parameters of the law.
The communities identified as a potential negative impact the reduction of their access to timber and
firewood extraction. Therefore, the REDD+ is supporting the establishment of forest plantation that can
provide this resource in the future. In addition, the project strengthens the processes of education and
awareness to reduce cutting of trees for firewood, promoting the use of Licenses for Family Consumption
authorized in the National Forest and Protected Areas Laws. In addition, the project promotes tree
planting of fast-growing and high energy trees. Finally, it promotes the adoption of new alternative
practices for cooking.
8 BIODIVERSITY
8.1 Net Positive Biodiversity Impacts (B2 & B4)
In evaluating the net benefits to biodiversity as a result of project activities, the theory of change
framework consisting of the problem flow analysis and impact assessment was considered in addition to
the historical LULC analysis and the results of LULC modeling. All these factors combined to provide us
with quantitative and qualitative assessments of biodiversity benefits across the project’s lifetime.
Through a historical analysis of land cover change within the reference region, over the past decade,
roughly 55,800 hectares of forest have been lost annually, and the modeled baseline scenario predicts
that 4,250 hectares of forest will be lost annually over the next 30 years in the project area without project
intervention. Conversely, project activities are expected to substantially reduce deforestation within the
project area over this same time frame. As discussed earlier, the reduction in deforestation and forest
degradation is the most effective method to reduce threats to biodiversity and improve ecosystem
function across the project area. The project has and will continue to increase forest connectivity, protect
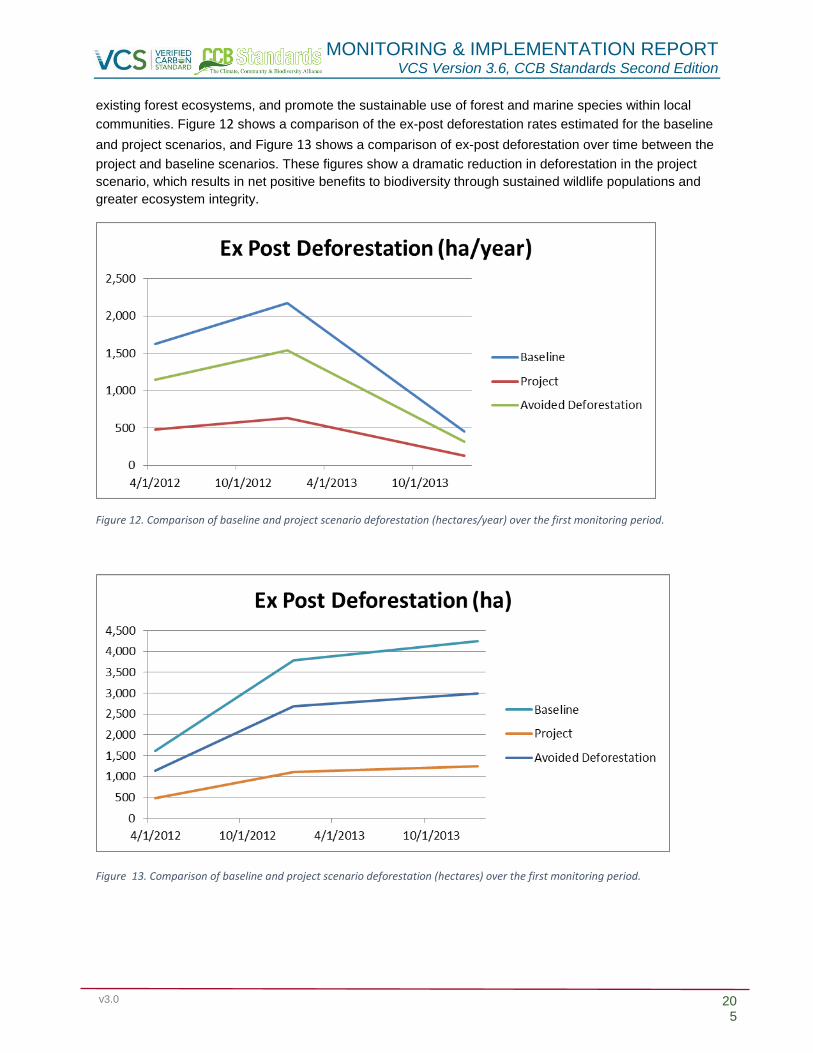
MONITORING & IMPLEMENTATION REPORT VCS Version 3.6, CCB Standards Second Edition
v3.0 205
existing forest ecosystems, and promote the sustainable use of forest and marine species within local
communities. Figure 12 shows a comparison of the ex-post deforestation rates estimated for the baseline
and project scenarios, and Figure 13 shows a comparison of ex-post deforestation over time between the
project and baseline scenarios. These figures show a dramatic reduction in deforestation in the project
scenario, which results in net positive benefits to biodiversity through sustained wildlife populations and
greater ecosystem integrity.
Figure 12. Comparison of baseline and project scenario deforestation (hectares/year) over the first monitoring period.
Figure 13. Comparison of baseline and project scenario deforestation (hectares) over the first monitoring period.
MONITORING & IMPLEMENTATION REPORT VCS Version 3.6, CCB Standards Second Edition
v3.0 206
8.1.1 Resource Protection
In the without project scenario, the exploitation of forests, water sources, and fisheries would continue un-
checked, which would create severe negative impacts on biodiversity within the project zone. In order to
address these threats, the project is implementing activities such as the patrolling and enforcement of
protected area laws, the management of water sources, and implementation of fish restoration zones.
The project has deployed 1800 forest patrols annually and has implemented 4 fishing restricted zones
(Table 35). The project has carried out 5 workshops to engage local fishermen in reef monitoring (Table
35) in order to ensure protection and enforcement of laws in these marine zones.
As shown in the Theory of Change matrix (TOC Activity Matrix v1.14.xlsm), these project activities are
designed to protect these valuable resources through legal enforcement, and by increasing community
awareness and respect for resource integrity and land titles. In particular, the patrolling of protected area
core zones serves to enhance biodiversity throughout the project area in addition to maintaining critical
project biodiversity HCVs.
Activities regarding governance have been designed to fill an existing void in the local and national
governments capacity to enact meaningful land use management and land tenure systems throughout
the region. In the without-project scenario, this lack of governance capacity would create further stress on
biodiversity through the expansion of illegal settlements, an increase in land disputes, and a lack of
political willpower to promote conservation measures. FUNDAECO has designed activities that enable
historically established and vulnerable populations to receive land tenure rights while discouraging the
establishment of new illegal settlements within forested areas. As evidence, the project has legalized
approximately 6,369 hectares of private community land in local and national registries (Table 35). This
allows well-established communities and individuals who previously had no legal rights to their land to
invest in their land and forests without the fear of being displaced. FUNDAECO has purchased roughly
734 hectares with the direct intent of forest protection (Table 35).
Additionally, FUNDAECO is an active participant in environmental litigation on a national level and serves
on the boards of numerous protected areas in order to advocate for further environmental protection at
the local and national level. FUNDAECO has attended and/or participated in 12 environmental litigation
advocacy events in the past year (Table 35). All of these actions serve to strengthen local capacity and
reduce deforestation and degradation pressures within the project area, which result in positive benefits
for biodiversity within the project area and project zone.
Monitoring results for this project activity group are presented in the table below.

MONITORING & IMPLEMENTATION REPORT VCS Version 3.6, CCB Standards Second Edition
v3.0 207
Project
Activity
Group
Number Project
Activity
Indicator Frequency Data Source/
Reference
Monitoring
Results
Resource Protection, Governance, and Monitoring
1 Legalized private and community land
# hectares newly registered in both local and national land registry
Annually land legalization database
6368.52
Resource Protection, Governance, and Monitoring
3 Registered land into PINFOR or PINPEP
# hectares of lands FUNDAECO helped to register with PINFOR/PINPEP
Annually PINFOR/PINPEP database
7891.37
Resource Protection, Governance, and Monitoring
7 Engage fishermen to reef monitoring
# of workshops held
Annually monitoring reports 5
Resource Protection, Governance, and Monitoring
7 Engage fishermen to reef monitoring
amount of coastline surveyed
Annually monitoring reports 21.83ha
Resource Protection, Governance, and Monitoring
8 Implementation of fishing restriction zones
#of fishing restriction zones
Annually community agreements/technical reports
4
Resource Protection, Governance, and Monitoring
9 Purchase land for protection
# of hectares purchased
Annually land aquisition files 733.38
Resource Protection, Governance, and Monitoring
10 Manage protected areas
# of hectares managed, # of patrols
Annually patrol reports, logbooks
1800 patrols
Resource Protection, Governance, and Monitoring
11 Creation of protected areas
Records of FUNDAECO's input/assistance in creation of protected areas
Annually meetings records 6, 1 sobrevuelo

MONITORING & IMPLEMENTATION REPORT VCS Version 3.6, CCB Standards Second Edition
v3.0 208
Resource Protection, Governance, and Monitoring
12 Protection and management of community water sources
# hectares of water source protected
Annually conservation agreements, patrol reports, logbooks
14101.21
Resource Protection, Governance, and Monitoring
13 Forest patrols
forest patrol logs including reports of any incidents requiring higher forms of enforcement (police, military, etc.)
Annually patrol reports, logbooks
1800 patrols
Resource Protection, Governance, and Monitoring
17 Environmental litigation and advocacy
# advocacy events attended/participated in
Annually reports 12
Resource Protection, Governance, and Monitoring
17 Environmental litigation and advocacy
records of any litigation with FUNDAECO involvement
Annually reports 4
Resource Protection, Governance, and Monitoring
38 Participate on CEL for protected areas
Records of CEL meetings
Annually minutes 9
Table 35. Resource protection and governance monitoring records.
8.1.1 Empowerment and Inclusiveness
The engagement of local communities in project activities is an important factor in creating biodiversity
benefits. By encouraging local participation in biodiversity monitoring activities, community members can
gain a greater appreciation and awareness of the importance of biodiversity within the project zone.
Additionally, participants in monitoring activities may be able to come away from this work feeling invested
in the survival and health of different ecosystems and species.
The project’s biodiversity goals centered on community empowerment and inclusiveness focused on the
engagement of fishermen to monitor and protect vulnerable marine shoreline. The project engaged 7
fishermen to participate in communal reef monitoring (Table 36). Through increased participation and
investment in project activities, community members support and understand the project’s biodiversity

MONITORING & IMPLEMENTATION REPORT VCS Version 3.6, CCB Standards Second Edition
v3.0 209
initiatives and goals in addition to gaining a broader understanding of the importance of biodiversity in a
local, regional, and global context. Monitoring results for this project activity group are presented below.
Project
Activity
Group
Number Project
Activity
Indicator Frequency Data Source/
Reference
Monitoring
Result
Community Empowerment & Inclusiveness
37 Engage fishermen in reef monitoring
# of community fishermen attended
Annually monitoring reports
7
Table 36. Community empowerment and inclusiveness monitoring records.
8.1.2 Education
Project activities that are of an educational nature are essential to maintaining and protecting biodiversity
within the project zone. FUNDAECO is implementing activities that are aimed at biodiversity and
environmental education on local, national, and global scales. FUNDAECO has developed ecotourism
sites in several locations along the coast and plans to further enhance the facilities at these sites in order
to draw in local and foreign visitors who are interested in learning about the unique ecosystems and
species in this region of Guatemala. The ecotourism sites established by the project drew 25,119 visitors
annually (Table 37).
Educational initiatives are also being implemented in coordination with public schools so that
schoolchildren will be taught the importance of conservation, endangered species, and environmental
stewardship. The project has enrolled 24 schools to participate in environmental education programs
(Table 37). By teaching these fundamental concepts to young children, the project cultivates a better
understanding of and relationship with the natural world in the next generation. Project activities also
support the university research and study of biodiversity within the project area; 5 marine biodiversity
research trips have been conducted involving 60 university students (Table 37). By deepening the
knowledge of species and ecosystem dynamics within the Caribbean coast of Guatemala, FUNDAECO
contributes to the global scientific community and brings awareness to the importance of this region’s
biodiversity on a global level.
Additionally, FUNDAECO has taken steps to protect and enhance the populations of endangered
amphibian populations within the project area through educational initiatives. Forest patrols are trained in
techniques to prevent the possible introduction or spread of a fungus that can wreak havoc on amphibian
species. A training session was held in which 6 park guards were adequately taught to handle the fungus
in the event of an issue (Table 37). By taking conservative measures to protect endangered species,
FUNDAECO is ensuring that no project activities have unintended negative impacts on HCVs. Monitoring
results for this project activity group are presented in the table below.
Project
Activity
Group
Num
ber
Project Activity Indicator Frequency Data
Source/Referen
ce
Monitoring
Results
Education 43 Biodiversity Monitoring
# of monitoring events
Annually logbooks, reports
21
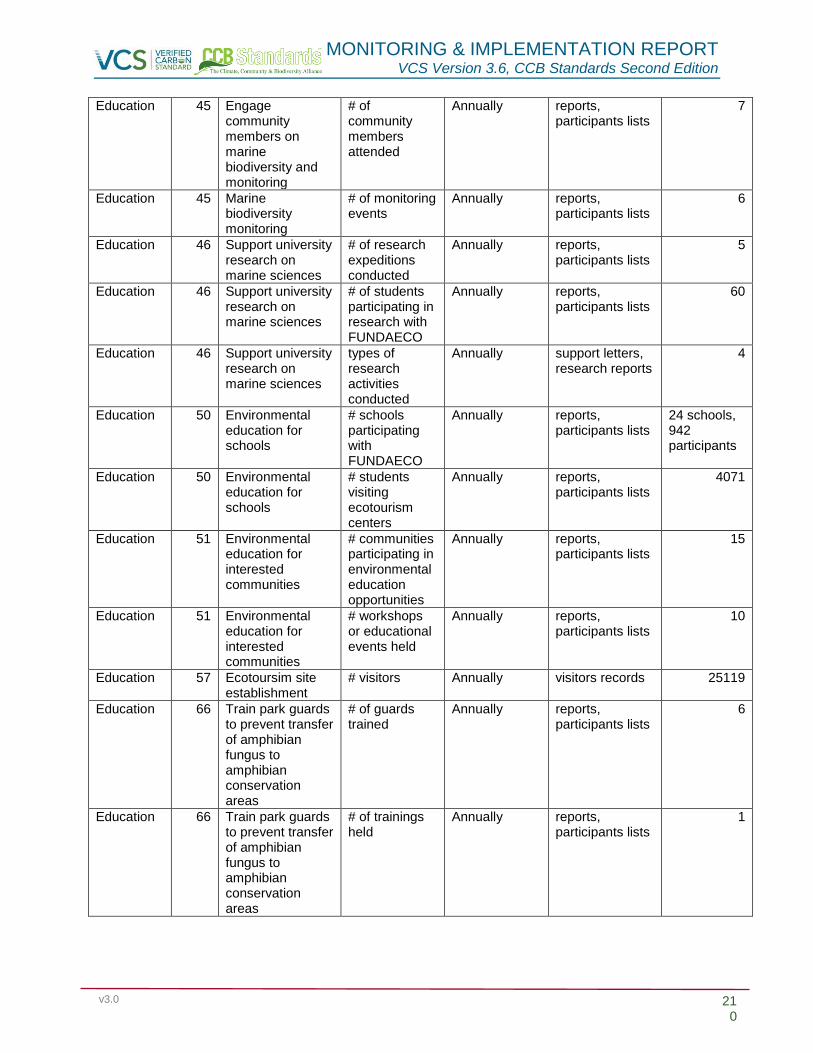
MONITORING & IMPLEMENTATION REPORT VCS Version 3.6, CCB Standards Second Edition
v3.0 210
Education 45 Engage community members on marine biodiversity and monitoring
# of community members attended
Annually reports, participants lists
7
Education 45 Marine biodiversity monitoring
# of monitoring events
Annually reports, participants lists
6
Education 46 Support university research on marine sciences
# of research expeditions conducted
Annually reports, participants lists
5
Education 46 Support university research on marine sciences
# of students participating in research with FUNDAECO
Annually reports, participants lists
60
Education 46 Support university research on marine sciences
types of research activities conducted
Annually support letters, research reports
4
Education 50 Environmental education for schools
# schools participating with FUNDAECO
Annually reports, participants lists
24 schools, 942 participants
Education 50 Environmental education for schools
# students visiting ecotourism centers
Annually reports, participants lists
4071
Education 51 Environmental education for interested communities
# communities participating in environmental education opportunities
Annually reports, participants lists
15
Education 51 Environmental education for interested communities
# workshops or educational events held
Annually reports, participants lists
10
Education 57 Ecotoursim site establishment
# visitors Annually visitors records 25119
Education 66 Train park guards to prevent transfer of amphibian fungus to amphibian conservation areas
# of guards trained
Annually reports, participants lists
6
Education 66 Train park guards to prevent transfer of amphibian fungus to amphibian conservation areas
# of trainings held
Annually reports, participants lists
1

MONITORING & IMPLEMENTATION REPORT VCS Version 3.6, CCB Standards Second Edition
v3.0 211
Table 37. Education monitoring records.
8.1.3 Access to Resources
Through the analysis of agents and drivers of deforestation (see CNCG SM drivers of
deforestation_final_1.pdf and Brief on Agents and Drivers v2.docx) FUNDAECO has been able to identify
that a large contributing factor to land use change and forest loss is due to a lack of economic
opportunities and resources for people within the project zone. As discussed previously, most
communities within the project zone live in extreme poverty with limited access to water, electricity,
education, and healthcare. Many of these families survive through subsistence agriculture and will turn to
illegal logging, cattle ranching, or agriculture expansion in order to take advantage of any economic
opportunities available. Many subsistence farmers do not have the technical knowledge or financial
means to improve the systems of agricultural production on their existing property, and may resort to
clearing more land to increase their agricultural outputs.
During the reporting period, FUNDAECO worked to provide these farmers with the resources needed to
create improved and diversified agroforestry systems with their existing cropland. Farmers that
participated in these programs received free or subsidized nursery stock to establish their agroforestry
plots, in addition to land use planning guidance from FUNDAECO staff.
Land use planning has been aimed at creating diversified income for farmers (i.e. growing rubber and
pepper), while also providing basic needs such as food, timber and fuelwood. These agroforestry plans
have also been designed to create a structurally and biologically diverse farming system, so as to provide
a more habitable environment for native flora and fauna. As a result, approximately 14,101 hectares
worth of water sources have been protected (Table 38).
During the reporting period, farmers gained access to technical expertise from agroforestry specialists on
methods for improving agricultural yields from cash crops such as pepper, rambutan, rubber, and
cardamom. Through the implementation of these diversified agroforestry production models, FUNDAECO
improved livelihoods, while reducing deforestation pressure throughout the project area. For example, by
encouraging farmers to plant fast-growing native trees for timber on their land, these farmers are able to
harvest trees whenever necessary without needing to resort to illegal logging. Additionally, farmers who
grow cash crops with improved nutrient cycling techniques increased their income from the same area of
land without needing to resort to deforestation to increase crop yields.
FUNDAECO is also provided access to legal counsel for landowners without official land title, and to
reduce barriers to participation in payment for ecosystem services programs such as PINFOR and
PINPEP during the reporting period. Many farmers and landowners within the project zone have little
formal education and no financial means to engage in the process of land legalization without assistance.
FUNDAECO helped families and communities to become recognized title-holders to their land on the
local and national levels by providing documentation and legal counsel services to those needing support.
Additionally, FUNDAECO has been registering and providing land management planning and
documentation services to any farmers wanting to participate in government sponsored PINFOR and
PINPEP programs during the reporting period. These programs provide incentives for farmers to preserve
any forest on their property, however there are numerous forms including a land management plan that
must be prepared for a property to be enrolled. Many farmers do not have the technical skills to be able to
prepare this documentation on their own, and as such can work with FUNDAECO to be able to gain
access to these alternative income sources. By providing consultation services and legal resources to
farmers and communities throughout the project zone, FUNDAECO is effectively reducing deforestation

MONITORING & IMPLEMENTATION REPORT VCS Version 3.6, CCB Standards Second Edition
v3.0 212
pressures tied to land tenure problems and a lack of economic opportunities. Overall, these activities
have a net positive effect on biodiversity within the project area and project zone. Monitoring results for
this project activity group are presented below.
Project
Activity
Group
Number Project
Activity
Indicator Frequency Data Source/
Reference
Monitoring
Result
Improved Access to Resources
84 Protection and management of community water sources
# hectares of water source protected
Annually conservation agreements, patrol reports
14101.21
Table 38. Improved access to resources monitoring records.
8.2 Negative Offsite Biodiversity Impacts (B3 & B4)
All project activities have been analyzed for any potential negative effects on biodiversity within the
project area and project zone. Negative biodiversity impacts for REDD+ projects are most often
associated with deforestation-related activities shifting to areas outside the project area, but can come
about from the misuse of pesticides and fertilizers as well as ineffective waste management techniques.
As discussed in the Project Description Document, other potential risks to project biodiversity benefits
include lack of governance capacity resulting in unclear land tenure, changes in local economic
conditions that may increase deforestation pressure, and the possibility for displaced forest loss outside
of the project area.
FUNDAECO has taken steps to mitigate all potential harmful impacts on biodiversity benefits as a direct
and indirect result of project activities. Agroforestry project activities adhere to standard USAID protocols
on the safe and judicious use and disposal of pesticides and fertilizers in addition to banning the use of
GMO’s and invasive species as part of project activities (see Plan General de BPA 2016.docx, EG-
PERSUAP-Final_Oct2012.docx, Consultoria Selvin Perez doc Final 10062014.docx). Due to existing
agricultural markets and increased economic incentives for small-scale farmers, FUNDAECO does use
several non-native species in its agroforestry programs, including rubber, cardamom, rambutan, and
pepper. However, these species are non-invasive and were introduced into Guatemala as agricultural
species over 50 years ago. The Guatemalan government considers these species to be “naturalized” and
to pose no threats to biodiversity within the country. A detailed justification and analysis of non-native
species use in FUNDAECO agroforestry programs can be found in Consultoria Selvin Perez doc Final
10062014.docx. In order to further reduce any risks to biodiversity benefits through the use of non-native
species in agroforestry programs, FUNDAECO engages landowners in land-management and planning
activities to diversify agricultural commodities across an ownership and to avoid monoculture plantations.
Farmers are encouraged to promote a more structurally diverse and natural agroforestry system that is
able to support native flora and fauna as opposed to structurally and biologically homogenous plantations
(see Consultoria Selvin Perez doc Final 10062014.docx).
Any potential indirect negative impacts on biodiversity caused by project activities are also being
minimized and mitigated through FUNDAECO programs. In order to avoid possible activity-shifting
deforestation from the project area into the project zone as a result of project activities, FUNDAECO is
engaging with landowners throughout the project zone to support land legalization efforts, enroll
landowners into PINFOR and PINPEP programs, and eventually incorporate additional landowners with
forest area into the grouped project over time. This serves and will continue to serve to minimize
deforestation pressures that could result in further biodiversity loss.

MONITORING & IMPLEMENTATION REPORT VCS Version 3.6, CCB Standards Second Edition
v3.0 213
FUNDAECO has also taken steps to ensure that biodiversity HCVs are not negatively impacted by project
activities. By preventing deforestation within the project area, FUNDAECO is effectively protecting the
majority of biodiversity HCVs identified in Section 2.4.2. However, potential negative effects on HCVs as
a result of project activities include the spread of fungal diseases to IUCN endangered amphibian species
during forest patrol activities. To prevent the spread of any harmful amphibian diseases throughout the
project area, forest patrols have been instructed in appropriate decontamination methods for shoes or
clothing. While the spread of these diseases through forest patrol activities is unlikely, extra measures are
being taken to protect vulnerable wildlife populations.

MONITORING & IMPLEMENTATION REPORT VCS Version 3.6, CCB Standards Second Edition
v3.0 214
9 REFERENCES
Bibby, C.J. 1999. Making the most of birds as environmental indicators. In: Adams, N.J. & Slotow, R.H.
(eds) Proc. 22 Int. Ornithol. Congr., Durban. Ostrich 70 (1): 81–88.
Canterbury, Grant E., Thomas E. Martin, Daniel R. Petit, Lisa J. Petit, and David F. Bradford. "Bird
Communities and Habitat as Ecological Indicators of Forest Condition in Regional Monitoring."
Conservation Biology 14.2 (2000): 544-58. Web. 2016.
Carignan, V., and M. Villard. 2002. Selecting indicator species to monitor ecological integrity: a review.
Environmental Monitoring and Assessment 78:45–61. "Climate-Data.org." Temperature, Climate Graph,
Climate Table - Climate-Data.org. N.p., 09 Aug. 2015. Web. 2016.
Hijmans, Robert, Susan Cameron, and Juan Para. "International Journal of ClimatologyVolume 25, Issue
15, Version of Record Online: 30 NOV 2005." Very High Resolution Interpolated Climate Surfaces for
Global Land Areas - Hijmans - 2005 - International Journal of Climatology - Wiley Online Library. N.p.,
n.d. Web. 02 Dec. 2016.
Ministerio de Agricultura, Ganadería y Alimentación (MAGA, Ministry of Agriculture, Livestock, and Food).
2001. Sistema de Información Geográfico (SIG-MAGA, Geographic Information System).
<http://www.ign.gob.gt/> (last accessed 2016).
Richards, M. and Panfil, S.N. 2011. Social and Biodiversity Impact Assessment (SBIA) Manual for
REDD+ Projects: Part 1 – Core Guidance for Project Proponents. Climate, Community & Biodiversity
Alliance, Forest Trends, Fauna & Flora International, and Rainforest Alliance. Washington, DC.
Simmons, C S. Clasificación De Reconocimiento De Los Suelos De La República De Guatemala.
Guatemala: Editorial del Ministerio de Educación Pública, "Jose de Pineda Ibarra", 1959. Print.
Stotz, D.F., Fitzpatrick, J.W., Parker, T.A., Moskovitz, D.K., 1996. Neotropical Birds: Ecology and
Conservation. Univ. Chicago Press, Chicago.
Sutherland, W. J., A. S. Pullin, P. M. Dolman, and T. M. Knight. 2004. The need for evidence-based
conservation. TRENDS in Ecology and Evolution 19(6):305-308.