Red RiveR Floodway opeRation RepoRt
25
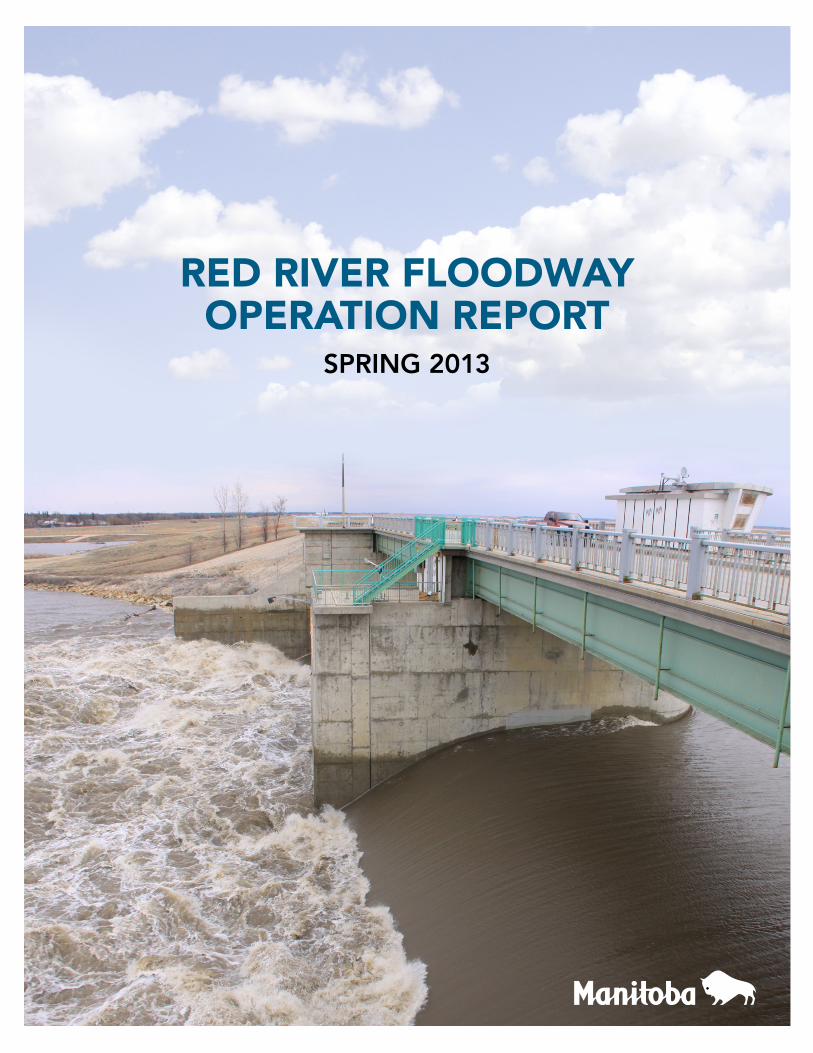
RED RIVER FLOODWAY OPERATION REPORT SPRING 2013
Transcript of Red RiveR Floodway opeRation RepoRt
Red RiveR Floodway opeRation RepoRt
Spring 2013
RED RIVER FLOODWAY OPERATION REPORT
SPRING 2013
June 28, 2013
Hydrologic Forecasting and Water Management Branch Water Management and Structures Division Manitoba Infrastructure and Transportation
Printed on Recycled Paper
EXECUTIVE SUMMARY
The 2013 Red River spring flood resulted from well above average winter snow fall in the Red River Valley. Early forecasts from the USGS estimated that the peak flow at Emerson could reach the level seen in the 2009 flood. However, compared to recent flood events such as the 2009 and 2011 flood events, the 2013 natural spring flood was a relatively minor event. In comparison, the 2009 peak flow measured along the Red River at Emerson was approximately 88,000 cfs whereas the 2013 peak flow measured at Emerson was approximately 45,000 cfs.
The 2013 Red River spring run-off event occurred later than is typical due to below normal temperatures for most of the month of April. The first ice break-up along the Red River from Emerson to Winnipeg started to occur around April 26th. Red River Floodway gate operations began on April 29th at 6:05 PM and the gates were operated for 40 days ending at 8:10 AM on June 8th. During this period of operation, 44 discrete gate adjustments were made as required at various times throughout any 24 hour period. In the spring of 2013, 450,000 acre-feet of water were diverted around the City of Winnipeg with a peak flow of 15,700 cfs. The Red River Floodway has been operated in 29 of the past 45 years to prevent spring flooding since its first year of operation in 1969.
The Assiniboine River flows in the spring flood of 2013 were also quite manageable
when compared to the flows seen in 2011. The natural Assiniboine River contribution at James Avenue peaked at 20,100 cfs on May 25th. The observed flow along the Assiniboine River at Headingley reached a maximum of 8,800 cfs due to operation of the Shellmouth Dam and Portage Diversion.
In spring 2013, operation of the floodway was successful in protecting the City of Winnipeg while minimizing upstream impacts through normal operation in accordance with Rule 1 of the Floodway Rules of Operation. Rule 1 requires that natural levels are maintained on the Red River at the floodway inlet. In concert with operation of the Portage Diversion and Shellmouth Reservoir, operation of the floodway reduced the flood crest in the City of Winnipeg by 6.33 feet at the peak natural flow.
Page ii
TABLE OF CONTENTS
Page EXECUTIVE SUMMARY ....................................................................................................... i TABLE OF CONTENTS ........................................................................................................... ii 1.0 INTRODUCTION .............................................................................................................. 1 2.0 2013 SPRING RUNOFF..................................................................................................... 1 3.0 THE RED RIVER FLOODWAY ....................................................................................... 1 4.0 OPERATION OF THE FLOODWAY IN SPRING 2013 .................................................. 2
4.1 General Observations ................................................................................................ 2 4.2 Public Communication in 2013 Flood ....................................................................... 3 4.3 Ice Conditions in 2013............................................................................................... 4 4.4 Assiniboine River Flow Contribution ....................................................................... 4 4.5 Floodway Maintenance and Efficiency ..................................................................... 5
5.0 CONCLUSIONS................................................................................................................. 6
TABLES
Table 1: 2013 Spring Floodway Gate Operations
FIGURES
Figure 1: Recorded and Natural River Levels at James Avenue 2013 Figure 2: Recorded and Natural Levels at Floodway Entrance 2013
APPENDICES
Appendix A: Red River Floodway Rules of Operation Appendix B: Computation of Natural Flows and Levels
June 28, 2013
Page 1
1.0 INTRODUCTION
On April 20, 2005, The Red River Floodway Act was proclaimed in force. Subsection 11(1) of this Act states that:
�On or before June 30 of any year in which the government operates the floodway during spring flooding to regulate the river level, the director must provide the minister with a report about the operation containing the information the minister requires.� The following report details operation of the Red River Floodway in the spring runoff
period of 2013 as required by section 11(1) of The Red River Floodway Act and includes the information specified in section 3(1) of The Red River Floodway Regulation.
Within this report, all flows and levels are shown in imperial units. Flows can be
converted from cubic feet per second (cfs) to cubic metres per second (m3/s) by dividing by 35.3148. River levels can be converted from feet to metres by dividing by a factor of 3.28084.
Manitoba Infrastructure and Transportation (MIT) gratefully acknowledges Water Survey
Canada (WSC) for providing the provisional flows used in the report.
2.0 2013 SPRING RUNOFF
The 2013 Red River spring flood resulted from well above average winter snow fall in the Red River Valley. Early forecasts from the USGS estimated that the peak flow at Emerson could reach the level seen in the 2009 flood. However, compared to recent flood events such as the 2009 and 2011 flood events, the 2013 natural spring flood was a relatively minor event. In comparison, the 2009 peak flow measured along the Red River at Emerson was approximately 88,000 cfs whereas the 2013 peak flow measured at Emerson was approximately 45,000 cfs.
The 2013 Red River spring run-off event occurred later than is typical due to below normal temperatures for most of the month of April. The first ice break-up along the Red River from Emerson to Winnipeg started to occur around April 26th. Typically, a late thaw can result in rapid melt and high run-off volumes; however the spring thaw was long and drawn out due to favourable weather conditions in April with minimal precipitation. By the time temperatures increased enough to melt snow rapidly, much of the snow had already melted. Additionally, the crests of the water levels in the Manitoba tributaries occurred before the arrival of the crest along the Red River coming from the United States. These factors resulted in favorable conditions along the main stem of the Red River in Manitoba. As a result, measured peaks along the Red River were below forecasted levels. Crests in Manitoba occurred on May 3rd at the floodway inlet and on May 7th at Emerson.
3.0 THE RED RIVER FLOODWAY
Following the historic flood of 1950 in the City of Winnipeg, work began on the design and construction of a series of flood control measures including Shellmouth Reservoir, Portage Diversion, and the Red River Floodway to protect the City from significant flood events. All
June 28, 2013
Page 2
were intended to be operated in concert to reduce flood flows and thus, minimize flood damages in the City of Winnipeg.
Operation of the floodway is guided by a set of rules (Appendix A) intended to provide
balanced flood protection to the City of Winnipeg without artificially affecting properties south (i.e. upstream) of the inlet. Rule 1 requires that natural levels not be exceeded upstream of the floodway inlet structure as long as water levels within the City of Winnipeg are less than 24.5 ft James Avenue. The natural water level on the Red River at the floodway entrance is defined as the water level that would have occurred at this location in the late 1950s if Shellmouth Reservoir, Portage Diversion, Assiniboine River dikes, Winnipeg dikes, and the Red River Floodway were not in place.
During the 2013 spring floodway operation, the natural water levels upstream of the inlet
were calculated with the relationship developed by Acres Manitoba Limited in 2004 [�Re-Computation of Natural Water Levels at the Floodway Inlet (Final Report)�, April 2004]. This relationship requires two input values: the natural flow in the Red River downstream of the Assiniboine River (at James Avenue) and the natural flow of the Assiniboine River into the Red River. These data along with the natural and actual water levels on the Red River at the floodway inlet are shown for the 2013 spring flood in Appendix B, Table 2. Real-time water level and flow data to guide the operations are obtained at a number of sites including the Red River at James Avenue or Chief Peguis Bridge, above and below the Inlet Control Structure, floodway channel, Assiniboine River at Headingley, Portage Diversion, Sturgeon Creek, and La Salle River along with estimates of un-gauged flow from small streams or overland runoff in the Winnipeg area.
4.0 OPERATION OF THE FLOODWAY IN SPRING 2013
4.1 General Observations
Floodway operation began the evening of April 29th, two days after ice had released upstream of the inlet control structure and floodway inlet areas. On the 29th, water had already begun to spill into the floodway prior to operation of the gates. The Red River Floodway gates were operated in accordance with normal operating procedures to reduce river levels in the City of Winnipeg. Operation of the floodway during open water in 2013 followed normal protocol and was consistent with experience in past spring floods.
The computation of natural water levels at the inlet control structure requires calculation
of the natural flow at James Avenue. Natural flow is determined by adjusting the actual flow for the effects of the flood control works. Under open water conditions, the actual flow is determined from the discharge rating curve for the Red River at James Avenue using Water Survey of Canada levels collected at station 05OC015. The City of Winnipeg also operates a gauge at the same location as the Water Survey of Canada gauge for their flood reponse purposes. Early in the 2013 spring flood it was discovered that both the Water Survey of Canada and the City of Winnipeg water level gauges were reading incorrect water levels due to siltation and debris in the gauge well. While efforts were being made to fix the problem with the gauges, the City of Winnipeg was able to provide calculated water levels for James Avenue by adjusting gauge readings taken at the Provencher Bridge. On May 3rd, WSC set up a temporary gauge at
June 28, 2013
Page 3
the former site of the Harbour Masters Building (currently a construction site) to be used as the James Avenue water level gauge for the rest of the duration of the spring flood.
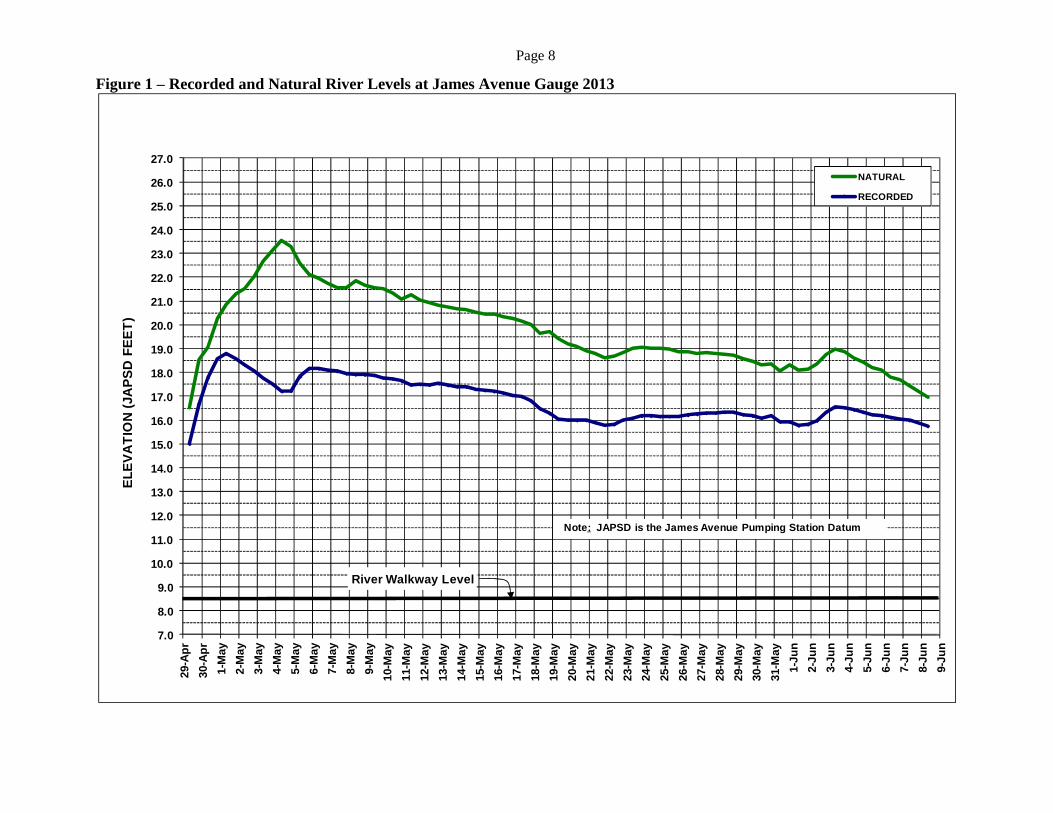
James Avenue water levels increased to a peak of 18.78 ft under open water conditions in
the morning of May 1st and then decreased for three days as the natural level upstream of the floodway crested at midday on May 4th. The peak natural flow at James Avenue in Winnipeg would have occurred at midday on May 4th and was calculated to be approximately 77,000 cfs. This peak flow would have resulted in a James Avenue level of 23.54 ft. Operation of the floodway, Portage Diversion and Shellmouth Dam lowered the James Avenue water level during the peak natural flow by 6.33 ft to 17.21 ft and prevented millions of dollars of damage. A second crest of 18.21 ft was observed at James Avenue on May 6th as flows along the Assiniboine increased.
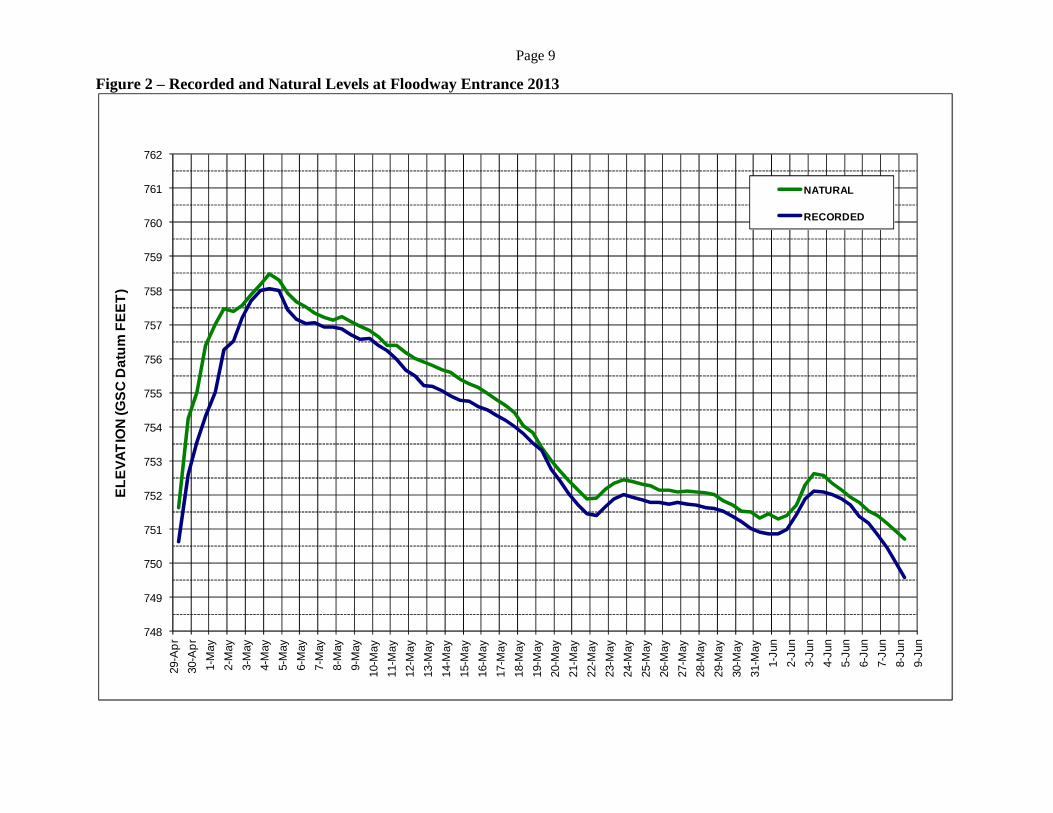
Overall, in the spring of 2013, approximately 450,000 acre-feet of water was diverted
around the City of Winnipeg with a peak flow of 15,700 cfs. The peak recorded level at the floodway entrance (Water Survey Canada station 05OC026) was 758.05 ft in the morning of May 4th; 0.43 ft lower than the computed natural peak level of 758.48 ft. The recorded river level at the floodway entrance was maintained an average of 0.42 ft below the computed natural level throughout the 40 days of floodway operation.
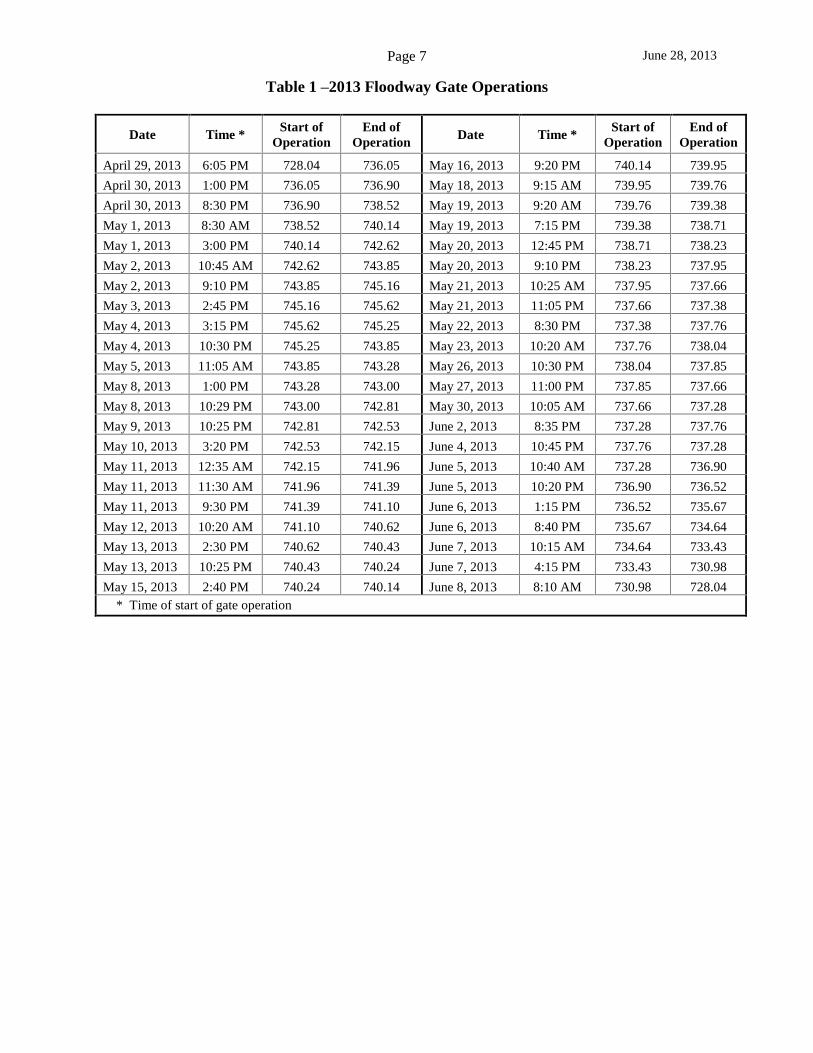
During operation, the floodway gates were adjusted in small increments to follow the
natural rise and drop in water levels. This was done to avoid large gate raises and drops that may have caused sudden changes in water levels above and below the floodway control structure. Table 1 lists the gate operations that occurred during operation of the floodway in the spring of 2013.
Figure 1 shows the recorded and natural water levels for the Red River in Winnipeg at James Avenue during the period of operation. Figure 2 shows the recorded and natural water levels for the Red River upstream of the floodway entrance. 4.2 Public Communication in 2013 Flood
An email database has been developed and maintained in accordance with the recommendations of the 2010 Public Review of the Red River Floodway Rules of Operation. The database includes municipal staff from the City of Winnipeg, Town of Morris, R.M. of East St. Paul, R.M. of West St. Paul, City of Selkirk, R.M. of St. Clements, R.M. of St. Andrews, R.M. of Springfield, R.M. of MacDonald, and the R.M. of Richot. Three notification emails were distributed. The first email was distributed at 10:30 AM, April 29th, providing notice of the planned floodway operation at 6:00 PM, April 29th. The second email was distributed at 7:45 PM, April 29th, confirming the initial operation was completed as planned. The third email was distributed at 3:10 PM, June 8th, informing the stakeholders on the contact list that floodway operations were complete for the Spring 2013 flood.
An information phone line (1-204-284-4550) was also maintained with the most recent
information on the operation of the Red River Floodway.
June 28, 2013
Page 4
4.3 Ice Conditions in 2013
Ice was present on the Red River until the end of April due to below normal temperatures for most of the month of April. Despite the late spring thaw, ice break-up conditions were favourable along the Red River for the 2013 spring flood. On April 27th the City of Winnipeg reported that ice along the Red River was dissipating in various locations in the city including downstream of the floodway. The City of Winnipeg also reported that ice was starting to pile up one mile upstream of the floodway gates in the evening of the 27th. South of Winnipeg, ice break-up was reported on the 27th along the Red River in regions near Emerson, St. Jean, and Morris. By April 28th ice had cleared out of the city and the ice build-up above the floodway had cleared out during the night of the 27th. South of the city, Emerson and Aubigny were clear of ice on the 27th and flowing ice was observed at Ste. Agathe. North of Winnipeg it was reported that the ice had all cleared out the Red River all the way downstream to Peltz Drive north of Selkirk. On April 29th, all reaches of the Red River were reported to be clear of ice except for at Netley Creek.
Ice jamming was an issue along the Assiniboine River upstream of the Portage Diversion. Attempts were made to direct the ice flows into the diversion with some difficulty on April 30th. It was attempted to maintain the flow on the Assiniboine River at 5,000 cfs to prevent ice jams forming. A surge of water (8,000 cfs peak) was allowed through the bascule gates over a 24 hour period from night of the 30th to alleviate some of the build up of hydraulic head upstream of the Portage Diversion reservoir. Minor ice jamming occurred downstream of Portage la Prairie but did not cause any damages. By May 2nd the ice was flowing freely through the diversion gates and the river was clear of ice from the Portage Diversion reservoir to Holland. 4.4 Assiniboine River Flow Contribution The Assiniboine River flow volumes that occurred during the spring flood of 2013 were quite manageable when compared to the flows seen in 2011. The natural Assiniboine River contribution at James Avenue peaked at 20,100 cfs on May 25th. The observed flow along the Assiniboine River at Headingley reached a maximum of 8,800 cfs due to operation of the Shellmouth Dam and Portage Diversion. The highest reductions in flows at James Avenue due to Shellmouth Dam operations occurred on May 25-26th when the Red River flows at James Avenue were reduced by approximately 6,800 cfs.
On May 1st, the Portage Diversion water level gauge (05LL019) was damaged by ice. As a result there are sections in the provisional water level and flow data provided by Water Survey Canada that had to be estimated. Upon review of the estimated provisional data for May 2nd it was found that the flows estimated by Water Survey Canada during this period diverged greatly from the flow rates calculated by the Portage Diversion operators. To resolve this discrepancy, engineers and technicians from Manitoba Infrastructure and Transportation and Water Survey Canada reviewed the real-time data from gauges along the Assiniboine River near Holland and Portage La Prairie (gauges 05MH005 and 05MJ003) in conjunction with information provided by the Portage Diversion operators which included the flow rates calculated using the Portage Diversion gate equation and field observations of ice jamming in the Portage Reservoir and
June 28, 2013
Page 5
Portage Diversion. Based on this joint review it was determined that the initial provisional peak flow estimate of 8,500 cfs in the diversion on May 2nd was too low and that the estimated peak flow could be reasonably raised to approximately 12,400 cfs. Increasing the estimate is further supported by the fact the failsafe at the end of the diversion was breached. This typically occurs at flows in excess of 15,000 cfs. The presence of ice in the channel may have created a backwater effect that contributed to the failsafe breach. With all available information considered, a peak flow of 12,400 cfs during this period is considered a reasonable but conservative estimate. 4.5 Floodway Maintenance and Efficiency
In recent years, most notably in 2009 and 2010, the observed floodway conveyance has been slightly lower than the expected design conveyance. The growth of willows in the floodway channel was identified as one possible cause. The willow growth was most significant from the floodway inlet to the Trans Canada Highway, with willows reaching heights of 10 feet in some areas. During the winter of 2012/2013, the Manitoba Floodway Authority mowed all the willows from the floodway inlet to the floodway outlet. The maintenance measures helped to maintain the improvements to flow efficiency that were observed in the floodway during the 2011 flood.
June 28, 2013
Page 6
5.0 CONCLUSIONS
In summary:
During the spring of 2013, the Red River Floodway was operated for 40 days and, in combination with other related flood control measures such as operation of the Portage Diversion and storage of flood waters in Shellmouth Reservoir, reduced the flood crest in the City of Winnipeg by 6.33 feet during the peak natural flow;
Operation of the Red River Floodway began at 6:05 PM on April 29, 2013, and concluded at 8:10 AM on June 8, 2013. During this period, 44 discrete gate adjustments were made as required;
Recorded water levels upstream of the inlet were maintained below natural levels throughout
floodway operation in the spring of 2013, and on average were 0.42 feet lower than natural levels;
The crest at the floodway inlet was 758.05 feet; 0.43 feet lower than the computed natural
peak level of 758.48 feet; Pre-flood willow clearing by the Manitoba Floodway Authority helped to maintain the
floodway flow efficiency to the efficiency levels seen in 2011. During spring 2013, 450,000 acre-feet of water were diverted around the City of Winnipeg
with a peak flow of 15,700 cfs.
June 28, 2013
Page 7
Table 1 �2013 Floodway Gate Operations
Date Time * Start of
Operation End of
Operation Date Time *
Start of Operation
End of Operation
April 29, 2013 6:05 PM 728.04 736.05 May 16, 2013 9:20 PM 740.14 739.95
April 30, 2013 1:00 PM 736.05 736.90 May 18, 2013 9:15 AM 739.95 739.76
April 30, 2013 8:30 PM 736.90 738.52 May 19, 2013 9:20 AM 739.76 739.38
May 1, 2013 8:30 AM 738.52 740.14 May 19, 2013 7:15 PM 739.38 738.71
May 1, 2013 3:00 PM 740.14 742.62 May 20, 2013 12:45 PM 738.71 738.23
May 2, 2013 10:45 AM 742.62 743.85 May 20, 2013 9:10 PM 738.23 737.95
May 2, 2013 9:10 PM 743.85 745.16 May 21, 2013 10:25 AM 737.95 737.66
May 3, 2013 2:45 PM 745.16 745.62 May 21, 2013 11:05 PM 737.66 737.38
May 4, 2013 3:15 PM 745.62 745.25 May 22, 2013 8:30 PM 737.38 737.76
May 4, 2013 10:30 PM 745.25 743.85 May 23, 2013 10:20 AM 737.76 738.04
May 5, 2013 11:05 AM 743.85 743.28 May 26, 2013 10:30 PM 738.04 737.85
May 8, 2013 1:00 PM 743.28 743.00 May 27, 2013 11:00 PM 737.85 737.66
May 8, 2013 10:29 PM 743.00 742.81 May 30, 2013 10:05 AM 737.66 737.28
May 9, 2013 10:25 PM 742.81 742.53 June 2, 2013 8:35 PM 737.28 737.76
May 10, 2013 3:20 PM 742.53 742.15 June 4, 2013 10:45 PM 737.76 737.28
May 11, 2013 12:35 AM 742.15 741.96 June 5, 2013 10:40 AM 737.28 736.90
May 11, 2013 11:30 AM 741.96 741.39 June 5, 2013 10:20 PM 736.90 736.52
May 11, 2013 9:30 PM 741.39 741.10 June 6, 2013 1:15 PM 736.52 735.67
May 12, 2013 10:20 AM 741.10 740.62 June 6, 2013 8:40 PM 735.67 734.64
May 13, 2013 2:30 PM 740.62 740.43 June 7, 2013 10:15 AM 734.64 733.43
May 13, 2013 10:25 PM 740.43 740.24 June 7, 2013 4:15 PM 733.43 730.98
May 15, 2013 2:40 PM 740.24 740.14 June 8, 2013 8:10 AM 730.98 728.04 * Time of start of gate operation
Page 8
Figure 1 � Recorded and Natural River Levels at James Avenue Gauge 2013
7.0
8.0
9.0
10.0
11.0
12.0
13.0
14.0
15.0
16.0
17.0
18.0
19.0
20.0
21.0
22.0
23.0
24.0
25.0
26.0
27.0
29-A
pr
30-A
pr
1-M
ay
2-M
ay
3-M
ay
4-M
ay
5-M
ay
6-M
ay
7-M
ay
8-M
ay
9-M
ay
10-M
ay
11-M
ay
12-M
ay
13-M
ay
14-M
ay
15-M
ay
16-M
ay
17-M
ay
18-M
ay
19-M
ay
20-M
ay
21-M
ay
22-M
ay
23-M
ay
24-M
ay
25-M
ay
26-M
ay
27-M
ay
28-M
ay
29-M
ay
30-M
ay
31-M
ay
1-Ju
n
2-Ju
n
3-Ju
n
4-Ju
n
5-Ju
n
6-Ju
n
7-Ju
n
8-Ju
n
9-Ju
n
EL
EV
AT
ION
(JA
PS
D F
EE
T)
NATURAL
RECORDED
River Walkway Level
Note: JAPSD is the James Avenue Pumping Station Datum
Page 9
Figure 2 � Recorded and Natural Levels at Floodway Entrance 2013
748
749
750
751
752
753
754
755
756
757
758
759
760
761
762
29-A
pr
30-A
pr
1-M
ay
2-M
ay
3-M
ay
4-M
ay
5-M
ay
6-M
ay
7-M
ay
8-M
ay
9-M
ay
10-M
ay
11-M
ay
12-M
ay
13-M
ay
14-M
ay
15-M
ay
16-M
ay
17-M
ay
18-M
ay
19-M
ay
20-M
ay
21-M
ay
22-M
ay
23-M
ay
24-M
ay
25-M
ay
26-M
ay
27-M
ay
28-M
ay
29-M
ay
30-M
ay
31-M
ay
1-Ju
n
2-Ju
n
3-Ju
n
4-Ju
n
5-Ju
n
6-Ju
n
7-Ju
n
8-Ju
n
9-Ju
n
EL
EV
AT
ION
(GS
C D
atu
m F
EE
T)
NATURAL
RECORDED

APPENDIX A
Red River Floodway Rules of Operation
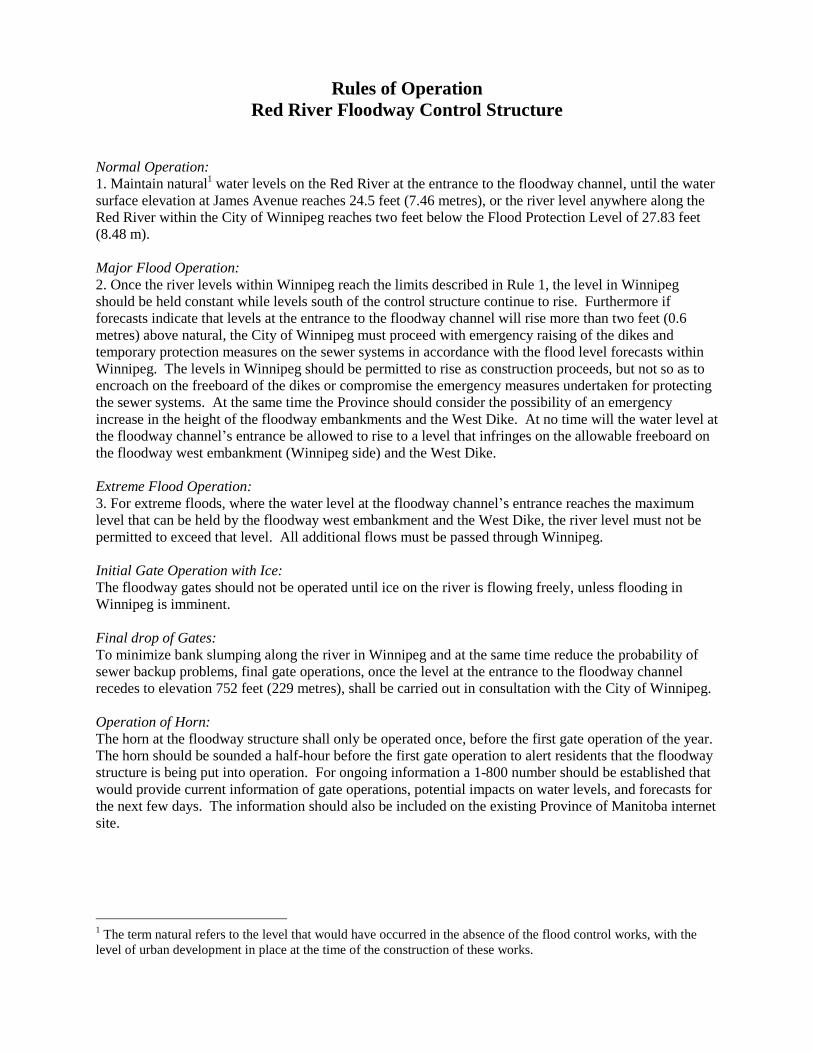
Rules of Operation Red River Floodway Control Structure
Normal Operation: 1. Maintain natural1 water levels on the Red River at the entrance to the floodway channel, until the water surface elevation at James Avenue reaches 24.5 feet (7.46 metres), or the river level anywhere along the Red River within the City of Winnipeg reaches two feet below the Flood Protection Level of 27.83 feet (8.48 m). Major Flood Operation: 2. Once the river levels within Winnipeg reach the limits described in Rule 1, the level in Winnipeg should be held constant while levels south of the control structure continue to rise. Furthermore if forecasts indicate that levels at the entrance to the floodway channel will rise more than two feet (0.6 metres) above natural, the City of Winnipeg must proceed with emergency raising of the dikes and temporary protection measures on the sewer systems in accordance with the flood level forecasts within Winnipeg. The levels in Winnipeg should be permitted to rise as construction proceeds, but not so as to encroach on the freeboard of the dikes or compromise the emergency measures undertaken for protecting the sewer systems. At the same time the Province should consider the possibility of an emergency increase in the height of the floodway embankments and the West Dike. At no time will the water level at the floodway channel�s entrance be allowed to rise to a level that infringes on the allowable freeboard on the floodway west embankment (Winnipeg side) and the West Dike. Extreme Flood Operation: 3. For extreme floods, where the water level at the floodway channel�s entrance reaches the maximum level that can be held by the floodway west embankment and the West Dike, the river level must not be permitted to exceed that level. All additional flows must be passed through Winnipeg. Initial Gate Operation with Ice: The floodway gates should not be operated until ice on the river is flowing freely, unless flooding in Winnipeg is imminent. Final drop of Gates: To minimize bank slumping along the river in Winnipeg and at the same time reduce the probability of sewer backup problems, final gate operations, once the level at the entrance to the floodway channel recedes to elevation 752 feet (229 metres), shall be carried out in consultation with the City of Winnipeg. Operation of Horn: The horn at the floodway structure shall only be operated once, before the first gate operation of the year. The horn should be sounded a half-hour before the first gate operation to alert residents that the floodway structure is being put into operation. For ongoing information a 1-800 number should be established that would provide current information of gate operations, potential impacts on water levels, and forecasts for the next few days. The information should also be included on the existing Province of Manitoba internet site.
1 The term natural refers to the level that would have occurred in the absence of the flood control works, with the level of urban development in place at the time of the construction of these works.
Emergency Operation to Reduce Sewer Backup in Winnipeg 4(1) This rule defines the circumstances under which the Minister of Manitoba Infrastructure and Transportation (�the Minister�) may determine that emergency operation of the floodway is necessary to prevent widespread basement flooding and resulting risk to health and damage to property within the City of Winnipeg. 4(2) This rule applies after the spring crest from snowmelt runoff at Winnipeg, whenever high river levels substantially impair the capacity of Winnipeg�s combined sewer system. 4(3) As long as the Department of Manitoba Infrastructure and Transportation (�the Department�) forecasts that river levels for the next 10 days will be below 14 feet James Avenue Pumping Station Datum (JAPSD), the Department will not operate the floodway control structure. 4(4) When the Department forecasts that river levels for the next 10 days are expected to rise to 14 feet JAPSD or higher, the Department will prepare a report that describes:
(a) The basis of the Department�s river level forecasts and its risk assessment; (b) The risk of basement flooding in Winnipeg, including the following factors:
(i) The predicted peak river level in the next 10 days; (ii) The length of time the Department forecasts the river level will be at 14 feet JAPSD
or higher;
(iii) The risk of an intense rainfall event in Winnipeg in the next 10 days; (c) The benefits and costs of floodway operation, including:
(i) The extent of basement flooding and damage to property expected from various combinations of intense rainfall events and high river levels;
(ii) The risk to the health of Winnipeg residents from sewer back-up; (iii) Economic loss and damage caused by artificial flooding south of the inlet control
structure;
(iv) Impacts of operation on fish and wildlife and their habitat and on water quality;
(v) The risks and potential costs of riverbank instability that may be caused by artificial river level changes, both upstream and downstream of the inlet control structure;
(vi) During construction of the floodway expansion, costs and risks associated with any
resulting delays of that construction, including the potential average annual expected damages associated with an additional period of risk of a flood event that would exceed the current capacity of the floodway;
(vii) Such other benefits and costs of operation of which the Department is aware at the
time of the preparation of the report, excluding benefits associated with recreational or tourism activities or facilities; and
(d) measures that may be taken to mitigate the costs and impacts of the operation under
consideration, including:
(i) minimizing the rate at which river levels are changed both upstream and downstream of the floodway inlet control structure;
(ii) providing means to assure fish passage. 4(5) The Department will present a draft of the report prepared under rule 4(4) to the Floodway Operation Review Committee and provide an opportunity for the Committee to provide input, before finalizing the report and making recommendations respecting floodway operation. 4(6) The Department will not recommend operation of the floodway unless the expected benefits of doing so clearly and substantially outweigh the expected costs. 4(7) The Department will present its report and recommendations to the Minister, who, subject to rule 4(8), will make a decision respecting floodway operation based on his or her consideration of the report. 4(8) The Department will not operate the floodway control structure under this rule:
(a) to raise river levels immediately upstream of the control structure to an elevation higher than 760 feet above sea level;
(b) to achieve a river level of less than 9 feet JAPSD; or (c) except in circumstances of extreme urgency, to lower river levels more than one foot per day.
4(9) The Department will issue a news release announcing a decision to operate the floodway at least 24 hours before commencing operation. 4(10) The Department will ensure every reasonable effort is made to personally notify landowners who may be directly affected by flooding due to floodway operation in advance of the operation. 4(11) The Department will sound the horn at the floodway inlet control structure one-half hour before operation commences. 4(12) The Department will maintain a program of compensation for damages suffered by landowners arising from flooding caused by floodway operation under this rule.
APPENDIX B
Computation of Natural Flows and Levels
Computation of Natural Flows and Levels On the Red and Assiniboine Rivers
Table 2 in the main report lists the natural flows on the Red River below the confluence with the Assiniboine River and on the Assiniboine River at the Forks. This Appendix describes how those flows were determined, and explains how the relationships developed in the Acres 2004 study were applied to compute the natural level at the floodway entrance. Table B-1 lists the recorded and computed flows and levels for each time step. Columns 1 to 7 list the flows used in computing the natural flows on the Assiniboine River, and columns 8 to 10 list the flows used for computing the natural flows on the Red River. NATURAL ASSINIBOINE RIVER FLOW The natural flows on the Assiniboine River are altered by operation of the Shellmouth Dam, the Portage Diversion, and by the presence of dikes along the Assiniboine River. The Shellmouth Dam can decrease flows below natural levels by adjusting the control gates so that reservoir outflows are lower than the inflows. In this case the reservoir levels rise, and excess water is stored behind the dam. The Portage Diversion can be used to reduce flows in the lower Assiniboine River by diverting some of the river flow north to Lake Manitoba. The Assiniboine River dikes were constructed to prevent overflows from the river onto the surrounding lands. Because of the height of the river and the slope of the land much of this overflow did not return to the Assiniboine River. Therefore, the dikes have the effect of increasing flows entering Winnipeg on the Assiniboine River during periods of high flow. Referring to Table B-1, column 1 lists the flow reductions at Winnipeg resulting from storage behind the Shellmouth Dam. It is important to recognize that these flow changes at the dam take some time to reach Winnipeg. The Department uses the Muskingum routing procedure to compute this flow attenuation. Column 2 shows the flows diverted to Lake Manitoba via the Portage Diversion. Again the flows are routed to Winnipeg to apply the time delay. Column 3 shows the recorded flows at the hydrometric station at Headingley. These first three columns are summed to determine the total natural flow before applying the natural breakouts that would have occurred if the dikes were not in place. Column 4 lists the computed breakouts that would have occurred at those flows if the dikes had not been constructed. Column 5 lists the computed natural flows at Headingley. These are computed by adding the three adjustments to the recorded flows at Headingley.

There is some additional local inflow entering the Assiniboine River between Headingley and the Forks. Most of this flow is recorded on Sturgeon Creek. In column 6 the recorded flows on Sturgeon Creek are increased to include unmeasured local inflows. Finally columns 5 and 6 are added together to give the computed natural flows of the Assiniboine River at the Forks, as listed in column 7. NATURAL RED RIVER FLOW On the Red River the primary flow adjustment is caused by the Red River Floodway. During periods of extensive flooding there can also be a flow change resulting from changes in the storage of floodwaters on the land, but as long as flood levels at the floodway entrance are held at natural that change would be negligible. Column 8 lists the recorded flows in the floodway channel, and column 9 shows the recorded flows at James Avenue. Column 10 sums the flows in those two columns and adds the three flow adjustments on the Assiniboine River to give the total natural flow on the Red River at James Avenue, which is downstream of the Forks. NATURAL RIVER LEVELS AT THE FLOODWAY INLET Table B-2 is a reproduction of Table 4-7 from the Acres report �Re-Computation of Natural Water Levels at the Floodway Inlet (Final Report), April 2004�. The table provides natural elevations at the inlet based upon the relative contribution of natural flow at the Forks from the Red and Assiniboine Rivers. The combined flow is represented by the values in the left-hand column entitled Red River at James Avenue. The Assiniboine River Contribution amount is shown across the top and is the flow in the Assiniboine River at the Forks. The natural water level at the inlet can vary by a few feet dependent upon the amount of flow coming from the Assiniboine River (Assiniboine River Contribution). This phenomenon is referred to as a variable backwater effect. This concept can be illustrated by using the example of 100,000 cfs flow for the Red River at James Avenue in various combinations of Red and Assiniboine River flows. One combination could have 95,000 cfs as Red River flow upstream of the Forks and 5,000 cfs as Assiniboine River Contribution; this combination results in a level at the inlet of 765.6 feet as shown in Table B-2. Similarly, another combination, while still yielding a total James Avenue flow of 100,000 cfs, could be 70,000 cfs as Red River flow upstream of the Forks and 30,000 cfs as Assiniboine River Contribution; the resulting inlet level would be 762.9 feet. The difference in the inlet water elevation between these two flow combinations is 2.7 feet, with the lower elevation occurring when there is relatively more flow on the Assiniboine River. Natural levels are determined by using the natural Red River flows at James Avenue listed in column 10 of Table B-1, and the natural Assiniboine River flows listed in column 7 of Table B-1 and interpolating between the values listed in Table B-2 to determine the natural levels. These natural levels are listed in column 13 of Table B-1. For comparison, column 14 of Table B-1

lists the recorded levels at the floodway inlet (station 05OC026). Similar levels for James Avenue in Winnipeg are provided in columns 11 and 12.
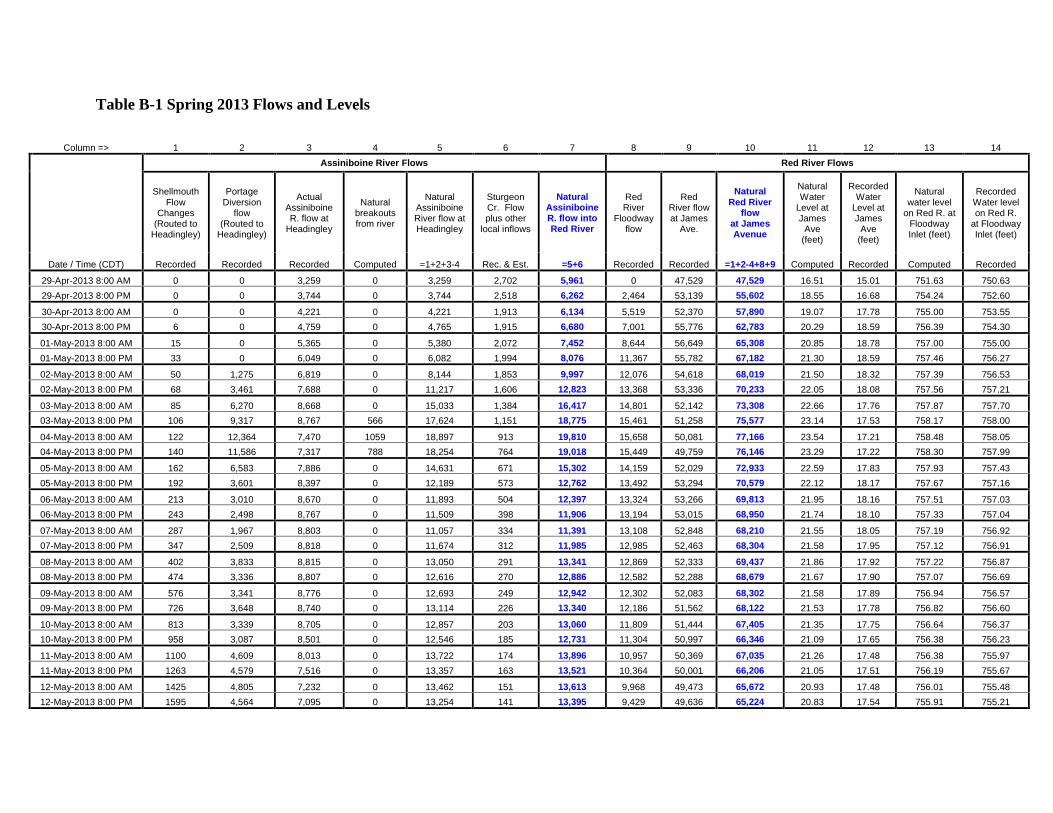
Table B-1 Spring 2013 Flows and Levels
Column => 1 2 3 4 5 6 7 8 9 10 11 12 13 14
Assiniboine River Flows Red River Flows
Shellmouth Flow
Changes (Routed to
Headingley)
Portage Diversion
flow (Routed to
Headingley)
Actual Assiniboine R. flow at
Headingley
Natural breakouts from river
Natural Assiniboine River flow at Headingley
Sturgeon Cr. Flow plus other
local inflows
Natural Assiniboine R. flow into Red River
Red River
Floodway flow
Red River flow at James
Ave.
Natural Red River
flow at James Avenue
Natural Water
Level at James
Ave (feet)
Recorded Water
Level at James
Ave (feet)
Natural water level
on Red R. at Floodway Inlet (feet)
Recorded Water level on Red R.
at Floodway Inlet (feet)
Date / Time (CDT) Recorded Recorded Recorded Computed =1+2+3-4 Rec. & Est. =5+6 Recorded Recorded =1+2-4+8+9 Computed Recorded Computed Recorded
29-Apr-2013 8:00 AM 0 0 3,259 0 3,259 2,702 5,961 0 47,529 47,529 16.51 15.01 751.63 750.63
29-Apr-2013 8:00 PM 0 0 3,744 0 3,744 2,518 6,262 2,464 53,139 55,602 18.55 16.68 754.24 752.60
30-Apr-2013 8:00 AM 0 0 4,221 0 4,221 1,913 6,134 5,519 52,370 57,890 19.07 17.78 755.00 753.55
30-Apr-2013 8:00 PM 6 0 4,759 0 4,765 1,915 6,680 7,001 55,776 62,783 20.29 18.59 756.39 754.30
01-May-2013 8:00 AM 15 0 5,365 0 5,380 2,072 7,452 8,644 56,649 65,308 20.85 18.78 757.00 755.00
01-May-2013 8:00 PM 33 0 6,049 0 6,082 1,994 8,076 11,367 55,782 67,182 21.30 18.59 757.46 756.27
02-May-2013 8:00 AM 50 1,275 6,819 0 8,144 1,853 9,997 12,076 54,618 68,019 21.50 18.32 757.39 756.53
02-May-2013 8:00 PM 68 3,461 7,688 0 11,217 1,606 12,823 13,368 53,336 70,233 22.05 18.08 757.56 757.21
03-May-2013 8:00 AM 85 6,270 8,668 0 15,033 1,384 16,417 14,801 52,142 73,308 22.66 17.76 757.87 757.70
03-May-2013 8:00 PM 106 9,317 8,767 566 17,624 1,151 18,775 15,461 51,258 75,577 23.14 17.53 758.17 758.00
04-May-2013 8:00 AM 122 12,364 7,470 1059 18,897 913 19,810 15,658 50,081 77,166 23.54 17.21 758.48 758.05
04-May-2013 8:00 PM 140 11,586 7,317 788 18,254 764 19,018 15,449 49,759 76,146 23.29 17.22 758.30 757.99
05-May-2013 8:00 AM 162 6,583 7,886 0 14,631 671 15,302 14,159 52,029 72,933 22.59 17.83 757.93 757.43
05-May-2013 8:00 PM 192 3,601 8,397 0 12,189 573 12,762 13,492 53,294 70,579 22.12 18.17 757.67 757.16
06-May-2013 8:00 AM 213 3,010 8,670 0 11,893 504 12,397 13,324 53,266 69,813 21.95 18.16 757.51 757.03
06-May-2013 8:00 PM 243 2,498 8,767 0 11,509 398 11,906 13,194 53,015 68,950 21.74 18.10 757.33 757.04
07-May-2013 8:00 AM 287 1,967 8,803 0 11,057 334 11,391 13,108 52,848 68,210 21.55 18.05 757.19 756.92
07-May-2013 8:00 PM 347 2,509 8,818 0 11,674 312 11,985 12,985 52,463 68,304 21.58 17.95 757.12 756.91
08-May-2013 8:00 AM 402 3,833 8,815 0 13,050 291 13,341 12,869 52,333 69,437 21.86 17.92 757.22 756.87
08-May-2013 8:00 PM 474 3,336 8,807 0 12,616 270 12,886 12,582 52,288 68,679 21.67 17.90 757.07 756.69
09-May-2013 8:00 AM 576 3,341 8,776 0 12,693 249 12,942 12,302 52,083 68,302 21.58 17.89 756.94 756.57
09-May-2013 8:00 PM 726 3,648 8,740 0 13,114 226 13,340 12,186 51,562 68,122 21.53 17.78 756.82 756.60
10-May-2013 8:00 AM 813 3,339 8,705 0 12,857 203 13,060 11,809 51,444 67,405 21.35 17.75 756.64 756.37
10-May-2013 8:00 PM 958 3,087 8,501 0 12,546 185 12,731 11,304 50,997 66,346 21.09 17.65 756.38 756.23
11-May-2013 8:00 AM 1100 4,609 8,013 0 13,722 174 13,896 10,957 50,369 67,035 21.26 17.48 756.38 755.97
11-May-2013 8:00 PM 1263 4,579 7,516 0 13,357 163 13,521 10,364 50,001 66,206 21.05 17.51 756.19 755.67
12-May-2013 8:00 AM 1425 4,805 7,232 0 13,462 151 13,613 9,968 49,473 65,672 20.93 17.48 756.01 755.48
12-May-2013 8:00 PM 1595 4,564 7,095 0 13,254 141 13,395 9,429 49,636 65,224 20.83 17.54 755.91 755.21
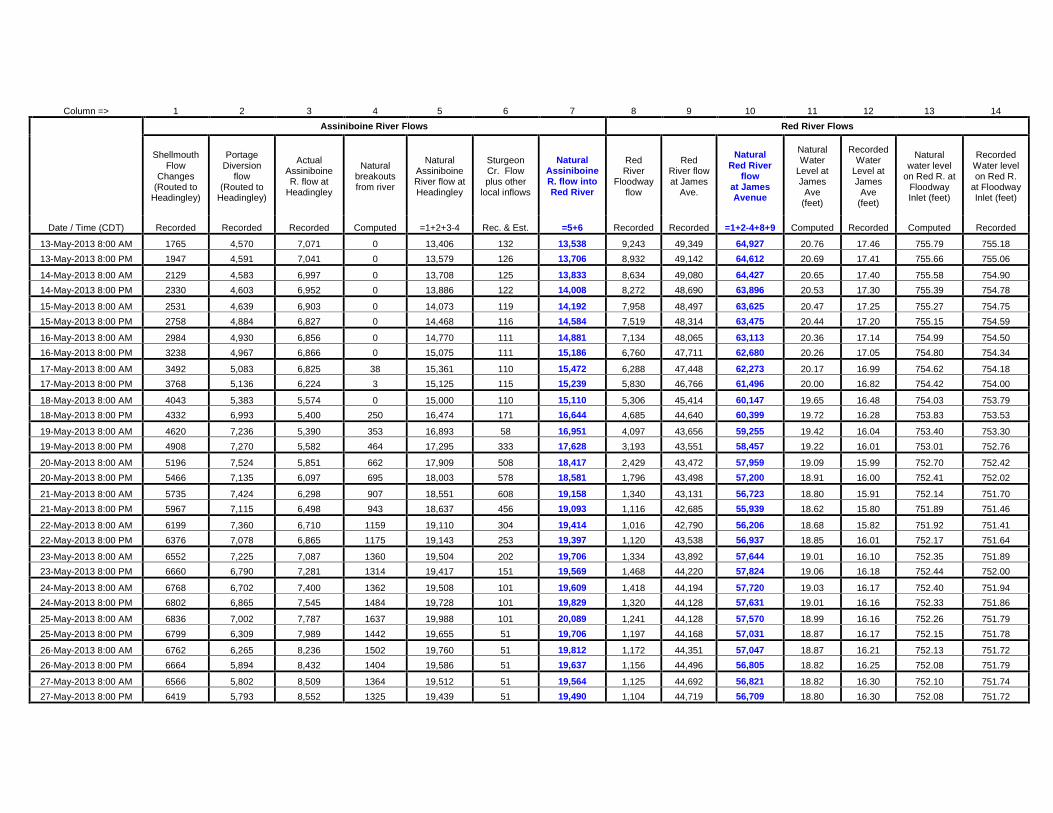
Column => 1 2 3 4 5 6 7 8 9 10 11 12 13 14
Assiniboine River Flows Red River Flows
Shellmouth Flow
Changes (Routed to
Headingley)
Portage Diversion
flow (Routed to
Headingley)
Actual Assiniboine R. flow at
Headingley
Natural breakouts from river
Natural Assiniboine River flow at Headingley
Sturgeon Cr. Flow plus other
local inflows
Natural Assiniboine R. flow into Red River
Red River
Floodway flow
Red River flow at James
Ave.
Natural Red River
flow at James Avenue
Natural Water
Level at James
Ave (feet)
Recorded Water
Level at James
Ave (feet)
Natural water level
on Red R. at Floodway Inlet (feet)
Recorded Water level on Red R.
at Floodway Inlet (feet)
Date / Time (CDT) Recorded Recorded Recorded Computed =1+2+3-4 Rec. & Est. =5+6 Recorded Recorded =1+2-4+8+9 Computed Recorded Computed Recorded
13-May-2013 8:00 AM 1765 4,570 7,071 0 13,406 132 13,538 9,243 49,349 64,927 20.76 17.46 755.79 755.18
13-May-2013 8:00 PM 1947 4,591 7,041 0 13,579 126 13,706 8,932 49,142 64,612 20.69 17.41 755.66 755.06
14-May-2013 8:00 AM 2129 4,583 6,997 0 13,708 125 13,833 8,634 49,080 64,427 20.65 17.40 755.58 754.90
14-May-2013 8:00 PM 2330 4,603 6,952 0 13,886 122 14,008 8,272 48,690 63,896 20.53 17.30 755.39 754.78
15-May-2013 8:00 AM 2531 4,639 6,903 0 14,073 119 14,192 7,958 48,497 63,625 20.47 17.25 755.27 754.75
15-May-2013 8:00 PM 2758 4,884 6,827 0 14,468 116 14,584 7,519 48,314 63,475 20.44 17.20 755.15 754.59
16-May-2013 8:00 AM 2984 4,930 6,856 0 14,770 111 14,881 7,134 48,065 63,113 20.36 17.14 754.99 754.50
16-May-2013 8:00 PM 3238 4,967 6,866 0 15,075 111 15,186 6,760 47,711 62,680 20.26 17.05 754.80 754.34
17-May-2013 8:00 AM 3492 5,083 6,825 38 15,361 110 15,472 6,288 47,448 62,273 20.17 16.99 754.62 754.18
17-May-2013 8:00 PM 3768 5,136 6,224 3 15,125 115 15,239 5,830 46,766 61,496 20.00 16.82 754.42 754.00
18-May-2013 8:00 AM 4043 5,383 5,574 0 15,000 110 15,110 5,306 45,414 60,147 19.65 16.48 754.03 753.79
18-May-2013 8:00 PM 4332 6,993 5,400 250 16,474 171 16,644 4,685 44,640 60,399 19.72 16.28 753.83 753.53
19-May-2013 8:00 AM 4620 7,236 5,390 353 16,893 58 16,951 4,097 43,656 59,255 19.42 16.04 753.40 753.30
19-May-2013 8:00 PM 4908 7,270 5,582 464 17,295 333 17,628 3,193 43,551 58,457 19.22 16.01 753.01 752.76
20-May-2013 8:00 AM 5196 7,524 5,851 662 17,909 508 18,417 2,429 43,472 57,959 19.09 15.99 752.70 752.42
20-May-2013 8:00 PM 5466 7,135 6,097 695 18,003 578 18,581 1,796 43,498 57,200 18.91 16.00 752.41 752.02
21-May-2013 8:00 AM 5735 7,424 6,298 907 18,551 608 19,158 1,340 43,131 56,723 18.80 15.91 752.14 751.70
21-May-2013 8:00 PM 5967 7,115 6,498 943 18,637 456 19,093 1,116 42,685 55,939 18.62 15.80 751.89 751.46
22-May-2013 8:00 AM 6199 7,360 6,710 1159 19,110 304 19,414 1,016 42,790 56,206 18.68 15.82 751.92 751.41
22-May-2013 8:00 PM 6376 7,078 6,865 1175 19,143 253 19,397 1,120 43,538 56,937 18.85 16.01 752.17 751.64
23-May-2013 8:00 AM 6552 7,225 7,087 1360 19,504 202 19,706 1,334 43,892 57,644 19.01 16.10 752.35 751.89
23-May-2013 8:00 PM 6660 6,790 7,281 1314 19,417 151 19,569 1,468 44,220 57,824 19.06 16.18 752.44 752.00
24-May-2013 8:00 AM 6768 6,702 7,400 1362 19,508 101 19,609 1,418 44,194 57,720 19.03 16.17 752.40 751.94
24-May-2013 8:00 PM 6802 6,865 7,545 1484 19,728 101 19,829 1,320 44,128 57,631 19.01 16.16 752.33 751.86
25-May-2013 8:00 AM 6836 7,002 7,787 1637 19,988 101 20,089 1,241 44,128 57,570 18.99 16.16 752.26 751.79
25-May-2013 8:00 PM 6799 6,309 7,989 1442 19,655 51 19,706 1,197 44,168 57,031 18.87 16.17 752.15 751.78
26-May-2013 8:00 AM 6762 6,265 8,236 1502 19,760 51 19,812 1,172 44,351 57,047 18.87 16.21 752.13 751.72
26-May-2013 8:00 PM 6664 5,894 8,432 1404 19,586 51 19,637 1,156 44,496 56,805 18.82 16.25 752.08 751.79
27-May-2013 8:00 AM 6566 5,802 8,509 1364 19,512 51 19,564 1,125 44,692 56,821 18.82 16.30 752.10 751.74
27-May-2013 8:00 PM 6419 5,793 8,552 1325 19,439 51 19,490 1,104 44,719 56,709 18.80 16.30 752.08 751.72
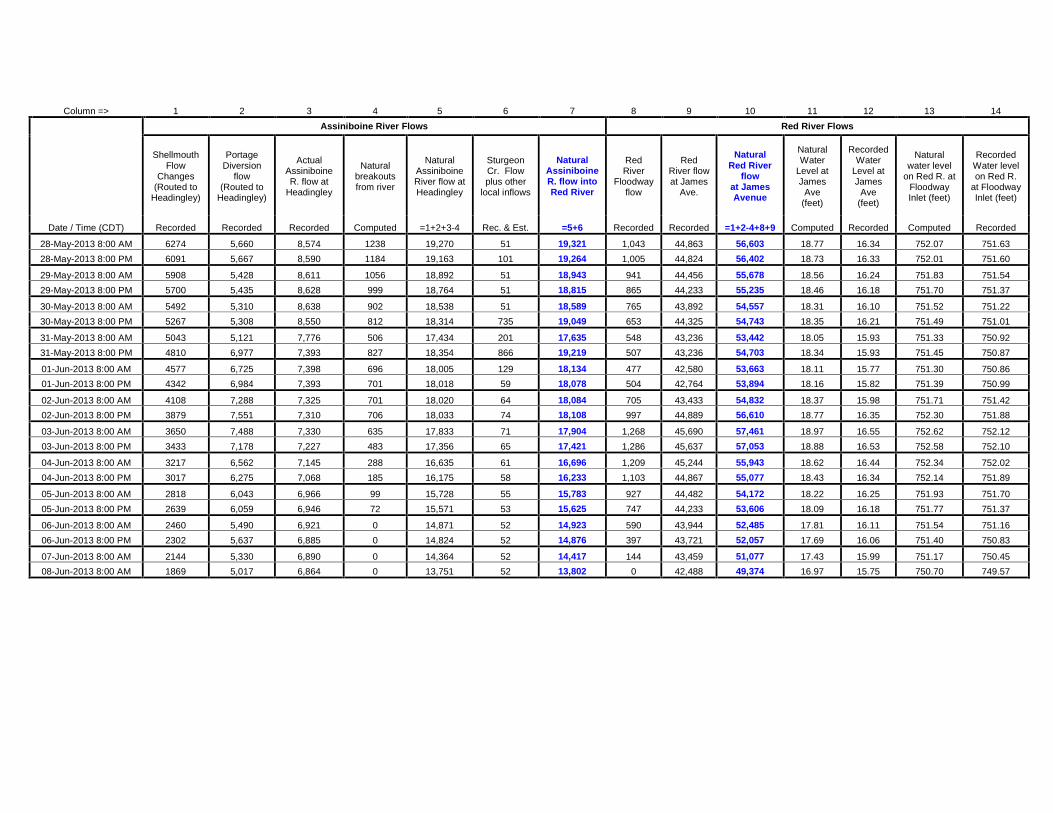
Column => 1 2 3 4 5 6 7 8 9 10 11 12 13 14
Assiniboine River Flows Red River Flows
Shellmouth Flow
Changes (Routed to
Headingley)
Portage Diversion
flow (Routed to
Headingley)
Actual Assiniboine R. flow at
Headingley
Natural breakouts from river
Natural Assiniboine River flow at Headingley
Sturgeon Cr. Flow plus other
local inflows
Natural Assiniboine R. flow into Red River
Red River
Floodway flow
Red River flow at James
Ave.
Natural Red River
flow at James Avenue
Natural Water
Level at James
Ave (feet)
Recorded Water
Level at James
Ave (feet)
Natural water level
on Red R. at Floodway Inlet (feet)
Recorded Water level on Red R.
at Floodway Inlet (feet)
Date / Time (CDT) Recorded Recorded Recorded Computed =1+2+3-4 Rec. & Est. =5+6 Recorded Recorded =1+2-4+8+9 Computed Recorded Computed Recorded
28-May-2013 8:00 AM 6274 5,660 8,574 1238 19,270 51 19,321 1,043 44,863 56,603 18.77 16.34 752.07 751.63
28-May-2013 8:00 PM 6091 5,667 8,590 1184 19,163 101 19,264 1,005 44,824 56,402 18.73 16.33 752.01 751.60
29-May-2013 8:00 AM 5908 5,428 8,611 1056 18,892 51 18,943 941 44,456 55,678 18.56 16.24 751.83 751.54
29-May-2013 8:00 PM 5700 5,435 8,628 999 18,764 51 18,815 865 44,233 55,235 18.46 16.18 751.70 751.37
30-May-2013 8:00 AM 5492 5,310 8,638 902 18,538 51 18,589 765 43,892 54,557 18.31 16.10 751.52 751.22
30-May-2013 8:00 PM 5267 5,308 8,550 812 18,314 735 19,049 653 44,325 54,743 18.35 16.21 751.49 751.01
31-May-2013 8:00 AM 5043 5,121 7,776 506 17,434 201 17,635 548 43,236 53,442 18.05 15.93 751.33 750.92
31-May-2013 8:00 PM 4810 6,977 7,393 827 18,354 866 19,219 507 43,236 54,703 18.34 15.93 751.45 750.87
01-Jun-2013 8:00 AM 4577 6,725 7,398 696 18,005 129 18,134 477 42,580 53,663 18.11 15.77 751.30 750.86
01-Jun-2013 8:00 PM 4342 6,984 7,393 701 18,018 59 18,078 504 42,764 53,894 18.16 15.82 751.39 750.99
02-Jun-2013 8:00 AM 4108 7,288 7,325 701 18,020 64 18,084 705 43,433 54,832 18.37 15.98 751.71 751.42
02-Jun-2013 8:00 PM 3879 7,551 7,310 706 18,033 74 18,108 997 44,889 56,610 18.77 16.35 752.30 751.88
03-Jun-2013 8:00 AM 3650 7,488 7,330 635 17,833 71 17,904 1,268 45,690 57,461 18.97 16.55 752.62 752.12
03-Jun-2013 8:00 PM 3433 7,178 7,227 483 17,356 65 17,421 1,286 45,637 57,053 18.88 16.53 752.58 752.10
04-Jun-2013 8:00 AM 3217 6,562 7,145 288 16,635 61 16,696 1,209 45,244 55,943 18.62 16.44 752.34 752.02
04-Jun-2013 8:00 PM 3017 6,275 7,068 185 16,175 58 16,233 1,103 44,867 55,077 18.43 16.34 752.14 751.89
05-Jun-2013 8:00 AM 2818 6,043 6,966 99 15,728 55 15,783 927 44,482 54,172 18.22 16.25 751.93 751.70
05-Jun-2013 8:00 PM 2639 6,059 6,946 72 15,571 53 15,625 747 44,233 53,606 18.09 16.18 751.77 751.37
06-Jun-2013 8:00 AM 2460 5,490 6,921 0 14,871 52 14,923 590 43,944 52,485 17.81 16.11 751.54 751.16
06-Jun-2013 8:00 PM 2302 5,637 6,885 0 14,824 52 14,876 397 43,721 52,057 17.69 16.06 751.40 750.83
07-Jun-2013 8:00 AM 2144 5,330 6,890 0 14,364 52 14,417 144 43,459 51,077 17.43 15.99 751.17 750.45
08-Jun-2013 8:00 AM 1869 5,017 6,864 0 13,751 52 13,802 0 42,488 49,374 16.97 15.75 750.70 749.57
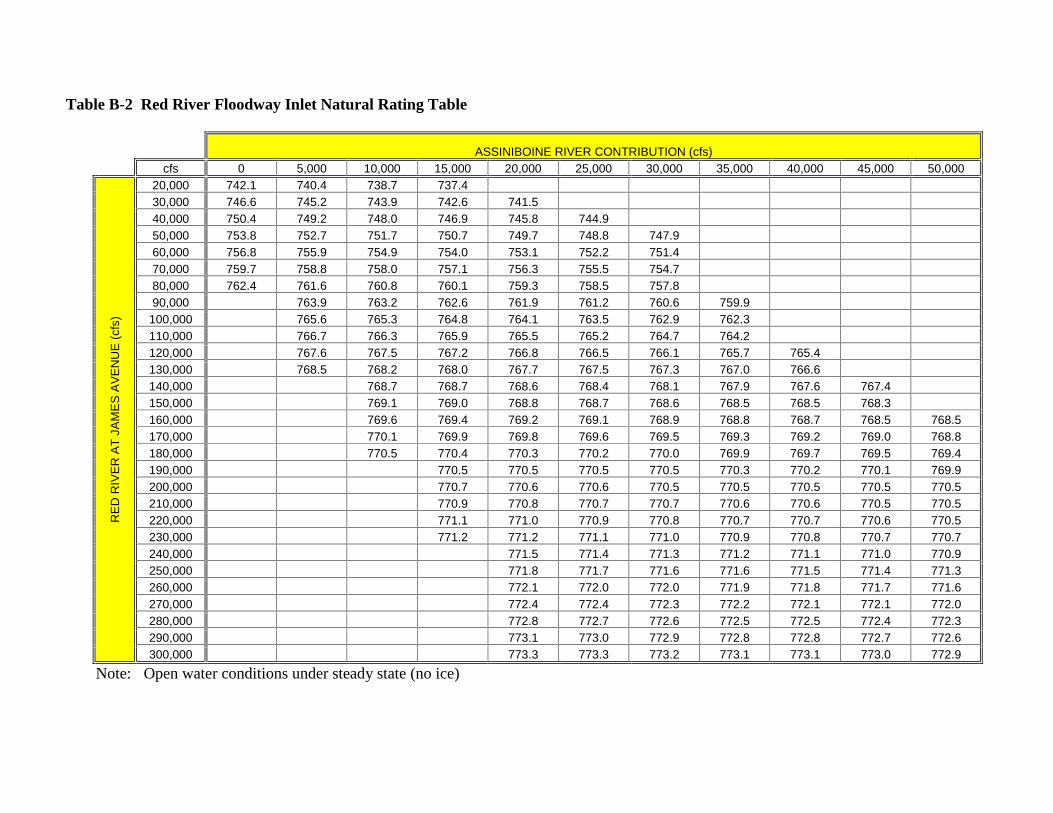
Table B-2 Red River Floodway Inlet Natural Rating Table
ASSINIBOINE RIVER CONTRIBUTION (cfs)
cfs 0 5,000 10,000 15,000 20,000 25,000 30,000 35,000 40,000 45,000 50,000
RE
D R
IVE
R A
T J
AM
ES
AV
EN
UE
(cf
s)
20,000 742.1 740.4 738.7 737.4 30,000 746.6 745.2 743.9 742.6 741.5 40,000 750.4 749.2 748.0 746.9 745.8 744.9 50,000 753.8 752.7 751.7 750.7 749.7 748.8 747.9 60,000 756.8 755.9 754.9 754.0 753.1 752.2 751.4 70,000 759.7 758.8 758.0 757.1 756.3 755.5 754.7 80,000 762.4 761.6 760.8 760.1 759.3 758.5 757.8 90,000 763.9 763.2 762.6 761.9 761.2 760.6 759.9
100,000 765.6 765.3 764.8 764.1 763.5 762.9 762.3 110,000 766.7 766.3 765.9 765.5 765.2 764.7 764.2 120,000 767.6 767.5 767.2 766.8 766.5 766.1 765.7 765.4 130,000 768.5 768.2 768.0 767.7 767.5 767.3 767.0 766.6 140,000 768.7 768.7 768.6 768.4 768.1 767.9 767.6 767.4 150,000 769.1 769.0 768.8 768.7 768.6 768.5 768.5 768.3 160,000 769.6 769.4 769.2 769.1 768.9 768.8 768.7 768.5 768.5 170,000 770.1 769.9 769.8 769.6 769.5 769.3 769.2 769.0 768.8 180,000 770.5 770.4 770.3 770.2 770.0 769.9 769.7 769.5 769.4 190,000 770.5 770.5 770.5 770.5 770.3 770.2 770.1 769.9 200,000 770.7 770.6 770.6 770.5 770.5 770.5 770.5 770.5 210,000 770.9 770.8 770.7 770.7 770.6 770.6 770.5 770.5 220,000 771.1 771.0 770.9 770.8 770.7 770.7 770.6 770.5 230,000 771.2 771.2 771.1 771.0 770.9 770.8 770.7 770.7 240,000 771.5 771.4 771.3 771.2 771.1 771.0 770.9 250,000 771.8 771.7 771.6 771.6 771.5 771.4 771.3 260,000 772.1 772.0 772.0 771.9 771.8 771.7 771.6 270,000 772.4 772.4 772.3 772.2 772.1 772.1 772.0 280,000 772.8 772.7 772.6 772.5 772.5 772.4 772.3 290,000 773.1 773.0 772.9 772.8 772.8 772.7 772.6 300,000 773.3 773.3 773.2 773.1 773.1 773.0 772.9
Note: Open water conditions under steady state (no ice)