Red Lion - 1 mile, Brackley, NN137AB Understanding ...
17
Red Lion - 1 mile, Brackley, NN137AB Understanding Demographics Describing Red Lion - 1 mile, Brackley, NN137AB In Relation To United Kingdom Package Contents Map Showing your area Understanding the demographics of your area Understanding the Residential Profile by Mosaic UK Understanding the Top 3 Mosaic UK Groups Daytime Population Profile by Mosaic UK Population Growth Explanation - Population Projections Explanation - Mosaic Explanation - Mosaic Daytime Explanation - Census Creation Date: 07 May, 2015
Transcript of Red Lion - 1 mile, Brackley, NN137AB Understanding ...

Red Lion - 1 mile, Brackley, NN137ABUnderstanding Demographics
DescribingRed Lion - 1 mile, Brackley, NN137AB
In Relation ToUnited Kingdom
Package Contents
Map Showing your areaUnderstanding the demographics of your areaUnderstanding the Residential Profile by Mosaic UKUnderstanding the Top 3 Mosaic UK GroupsDaytime Population Profile by Mosaic UKPopulation GrowthExplanation - Population ProjectionsExplanation - MosaicExplanation - Mosaic DaytimeExplanation - Census
Creation Date: 07 May, 2015

Describing Red Lion - 1 mile, Brackley, NN137AB in relation to United KingdomCreation Date: 07/05/15
Geography Selection:
1 mile radius around Red Lion - 1 mile, Brackley, NN137AB
Boundary Colour
1 mile radius
Source: Crown Copyright Reserved. Copyright Experian
2012.
Date: 07/05/15
There are 12,992 people living within Red Lion - 1 mile, Brackley, NN137AB, of which 6,508 are male and 6,484 are female. Within this population 6,925 are economically active, whilst 2,341 are classed as economically inactive.81.70% of houses are owner occupied whilst 7.62% are privately rented. The three highest Mosaic groups are G Careers and Kids, F Suburban Mindsets and M Industrial Heritage.The population of the area is expected to change by 8.28% by 2017.

Describing 1 Miles: Red Lion - 1 mile, Brackley, NN137AB in relation to UK Creation Date: May 7, 2015
Area BaseTotal Households 5,373 27,112,349
Total Population 12,992 63,115,915
Total Males 6,508 31,109,048
Total Females 6,484 32,006,867
The current year estimates show a total resident population of 12,992 in the study area, compared to 63,115,915 in the base selection. When looking at the population of households there are 5,373 in your area and 27,112,349 in your base selection. This was split by 49.90% of the population being female and 50.10% being male in the study area.
Source: Experian Current year estimates (Mid-year 2012).
Age Bands Area Base
Under 15 2,657 10,970,564
15-19 762 3,786,773
20-24 628 4,365,284
25-34 1,603 8,551,784
35-44 2,131 8,456,376
45-54 2,014 8,867,221
55-64 1,343 7,255,971
65+ 1,854 10,861,942
Source: Experian Age and Gender Estimates (2012).
Chart explanation: The chart above represents the Index* value. This indicates the over or under representation of the area selection relative to the base.
The highest proportion fell into age band Under 15 with a count of 2,657 representing 20.45% in the study area. The smallest proportion was in age band 20-24 with a count of 628 which represents 4.83%. In the study area the most over represented age band in comparison to the base selection is 35-44 with an index value of 122. The band that is most under represented is 20-24 with an index of 70, where an index* of 100 represents the national average.
*An index of 100 indicates that the variable shown is represented at the same level in the area as it is across the whole area (base). An index of 200 would show that it has twice the representation.

Ethnic Mix Area Base
White 11,916 52,481,255
Mixed 92 673,743
Asian or Asian British 72 2,328,784
Black or Black British 51 1,147,400
Chinese or Other 31 472,190
Source: ONS Census Data (2001).
Chart explanation: The chart above represents the Index* value. This indicates the over or under representation of the area selection relative to the base.
The ONS data shows the ethnic make up of your area is as follows:
97.98% White 0.76% Mixed 0.59% Asian or Asian British 0.42% Black or Black British 0.25% Chinese or Other
Compare this to your base ethnic diversity as follows:
91.91% White 1.18% Mixed 4.08% Asian or Asian British 2.01% Black or Black British 0.83% Chinese or Other
In the study area the largest ethnic group is White taking up 97.98% of the population with a count of 11,916. This is in comparison to the selected base with 91.91% of the population being White. The smallest ethnic representation in the study area was Chinese or Other with a count of 31, compare this to the base selection where the smallest group was Chinese or Other with a count of 472,190.
Social Grade Area BaseAB Higher & intermediate manage/admin/prof 2,712 11,697,217C1 Supervisory, cleric, junior manage/admin/prof 2,882 12,741,084C2 Skilled manual workers 2,137 9,977,173D Semi-skilled and unskilled manual workers 1,230 6,836,899E On state benefit, unemployed, lowest grade workers 1,058 8,983,966
Source: Experian Current Year Estimates based on ONS Census Data (2012).
Chart explanation: The chart above represents the Index* value. This indicates the over or under representation of the area selection relative to the base.
*An index of 100 indicates that the variable shown is represented at the same level in the area as it is across the whole area (base). An index of 200 would show that it has twice the representation.
Within your area social grade C1 forms the largest proportion with 2,882 people falling into this group, which is 28.76% of the overall distribution. The smallest proportion falls into grade E with a count of 1,058 taking up 10.56%. When comparing this to the selected base the most over represented grade is AB with an index* count of 116, whereas the most under represented group is E with an index count of 59.

Economically Active Area BaseEmployee 5,553 23,599,501
Self employed with employees 273 1,369,452
Self employed without employees 753 2,454,603
Unemployed 127 2,081,789
Full-time students 219 1,260,418
Economically Inactive
Retired 1,023 6,217,979
Student 292 2,528,733
Looking after home/ family 628 2,908,572
Permanently sick/ disabled 224 2,483,308
Other 174 1,413,384
Source: Experian Current Year Estimates based on ONS Census Data (2012).
Chart explanation: The chart above represents the Index* value. This indicates the over or under representation of the area selection relative to the base.
Economically Active Economically Inactive
Economic activity within the study area shows that 42.74% of the population are employed, this is 5,553 people, compare this to your base where 37.39% are employed. The smallest economically active group is Unemployed representing 0.98%, compare this to the selected base where this group represents 3.30%. When analysing index* values the most over represented group is Self employed without employees with an index of 136, taking up 5.79%. When considering economic inactivity the largest proportion in the study area belongs to the Retired group with a count of 1,023 representing 7.87%. The smallest inactive group is Other with 174 which is 1.34%. When looking at the index values the group that is most over represented is Looking after home/ family with an index of 143, representing 4.83%.
*An index of 100 indicates that the variable shown is represented at the same level in the area as it is across the whole area (base). An index of 200 would show that it has twice the representation.

Dwelling Type Area BaseDetached 1,646 4,831,803
Semi-detached 1,294 6,637,289
Bungalow 507 2,222,919
Terraced (including end-terrace) 915 7,114,420
Flat, maisonette or apartment 451 4,163,738
Source: Experian ConsumerView Household Directory 2011.
Chart explanation: The chart above represents the Index* value. This indicates the over or under representation of the area selection relative to the base.
Tenure Area BaseOwned (HH) 3,920 16,724,882
Social Rented (HH) 433 4,885,741
Private Rented (HH) 366 2,345,327
Source: ONS Census Data (2001).
Chart explanation: The chart above represents the Index* value. This indicates the over or under representation of the area selection relative to the base.

1,294 households within your area live in a Semi-detached dwelling, this is 26.89%. Compare this to a figure of 6,637,289 in your base making up 26.58%. The smallest number of households live in a Terraced (including end-terrace) dwelling, this is 451 households and makes up 9.37%. When analysing the index* figures, we can deduce that the most over represented dwelling type is Detached with a figure of 177, this makes up 34.19% in the study area.When considering the tenure of households we can see that the largest proportion are Owned with a figure of 3,920 making up 81.70%. The smallest amount fall into the Private rented at 7.62%. When looking at the index figures the most over represented tenure type is Owned with an index of 120, 81.70% of households fall into this category in the study area.
*An index of 100 indicates that the variable shown is represented at the same level in the area as it is across the whole area (base). An index of 200 would show that it has twice the representation.
Household Income Area Base£14,999 or Less 697 5,441,958
£15,000 to £19,999 240 1,924,494
£20,000 to £29,999 799 4,914,874
£30,000 to £39,999 806 3,885,649
£40,000 to £49,999 577 3,041,965
£50,000 to £59,999 471 1,858,483
£60,000 to £69,999 429 1,176,779
£70,000 to £99,999 538 1,647,083
£100,000 to £149,999 200 797,626
£150,000 or Over 55 281,258
Source: Income Band Distributions (2012).
Chart explanation: The chart above represents the Index* value. This indicates the over or under representation of the area selection relative to the base.
937 households within your area have an income of £19,999 or less, this forms 19.46% of the overall distribution. The smallest count is 55 and these fall into household income band £150,000 or Over making up 1.15%. When using your base as a comparison the biggest majority fall into the income band £14,999 or less which makes up 21.79% of the overall view.When using index* figures as a guide we can see that the income band £60,000 to £69,999 is over represented making up 9% with an index of 189, the most under represented banding is £15,000 to £19,999 with a figure of 65 making up 5% of the distribution.
Index* - An index of 100 indicates that the variable shown is represented at the same level in the area as it is across the whole area (base). An index of 200 would show that it has twice the representation.

Explanation of Mosaic UK Mosaic UK classifies all consumers in the United Kingdom by allocating them to one of 67 Types and 15 Groups. The 15 Groups are shown below as a profile. They provide a summary of the detailed picture painted of UK consumers in terms of their socio-economic and socio-cultural behaviour.
Mosaic UK Group Short Area BaseA Alpha Territory 112 2,215,050
B Professional Rewards 1,320 5,488,431
C Rural Solitude 49 2,794,015
D Small Town Diversity 1,271 5,517,643
E Active Retirement 397 2,282,560
F Suburban Mindsets 3,107 7,846,414
G Careers and Kids 3,829 3,553,190
H New Homemakers 377 2,735,186
I Ex-Council Community 506 6,208,842
J Claimant Cultures 0 3,752,716
K Upper Floor Living 0 3,133,950
L Elderly Needs 425 2,433,392
M Industrial Heritage 1,321 4,865,836
N Terraced Melting Pot 110 4,576,202
O Liberal Opinions 71 5,305,677
Totals 12,992 63,115,915
Source: Experian Mosaic UK Classification (2012).
Chart explanation: The chart above represents the index* value. This indicates the over or under representation of the area selection relative to the base.
The largest majority belong to Mosaic Group G Careers and Kids with a count of 3,829 representing 29.47% of the overall distribution, in comparison to the base where 5.63% fall into this group. The smallest proportion fall into Mosaic Group J Claimant Cultures with a count of 0 which represents 0.00%. The index* figures indicate that the most over represented group is G Careers and Kids taking up 29.47%, in contrast the most under represented group is J Claimant Cultures which takes up 0.00%.
*An index of 100 indicates that the variable shown is represented at the same level in the area as it is across the whole area (base). An index of 200 would show that it has twice the representation.

29.47% - G Careers and Kids Families with young children where both parents are likely to earn solid incomes providing for a comfortable modern home.
Families Young children Good incomes Comfortable homes Home life balance Ethical products Consumer credit Reliant on cars Internet and telephone banking New buildings
23.92% - F Suburban Mindsets Maturing families on mid-range incomes living a moderate lifestyle in suburban semis.
Manual and white collar Married Middle age Children Leafy suburbs Comfortable affordable housing Home improvement Family life Industrious Mainstream brands
10.17% - M Industrial Heritage Families and couples owning affordable older style housing in communities historically dependent on manufacturing.
Traditional Married Below average incomes Approaching retirement Outgrown homes Personal responsibility Manufacturing industries Careful with money Reliant on cars Manual skills

Explanation of Mosaic UK Mosaic UK classifies all consumers in the United Kingdom by allocating them to one of 67 Types and 15 Groups. The 15 Groups are shown below as a profile. They provide a summary of the detailed picture painted of UK consumers in terms of their socio-economic and socio-cultural behaviour.
Mosaic UK Group Area BaseA Alpha Territory 136 1,801,226
B Professional Rewards 1,263 4,557,882
C Rural Solitude 260 2,314,454
D Small Town Diversity 985 4,647,552
E Active Retirement 246 2,028,125
F Suburban Mindsets 1,803 6,261,027
G Careers and Kids 1,865 2,743,200
H New Homemakers 374 2,203,602
I Ex-Council Community 417 4,844,785
J Claimant Cultures 28 2,724,125
K Upper Floor Living 39 2,425,084
L Elderly Needs 268 2,113,631
M Industrial Heritage 903 4,004,192
N Terraced Melting Pot 173 3,542,417
O Liberal Opinions 151 4,641,553
Totals 8,911 50,852,855
Source: Experian Mosaic UK Daytime Classification (2012).
(Table displays population age 16 and over.) Chart explanation: The chart above represents the Index* value. This indicates the over or under representation of the area selection relative to the base.
The largest number belong to Mosaic Group G Careers and Kids with a count of 1,865 representing 20.93% of the overall distribution, in comparison to the base where 5.39% fall into this group. The smallest proportion fall into Mosaic Group J Claimant Cultures with a count of 28 which represents 0.32%. The index* figures indicate that the most over represented group is G Careers and Kids taking up 20.93%, in contrast the most under represented group is J Claimant Cultures which takes up 0.32%.
*An index of 100 indicates that the variable shown is represented at the same level in the area as it is across the whole area (base). An index of 200 would show that it has twice the representation.
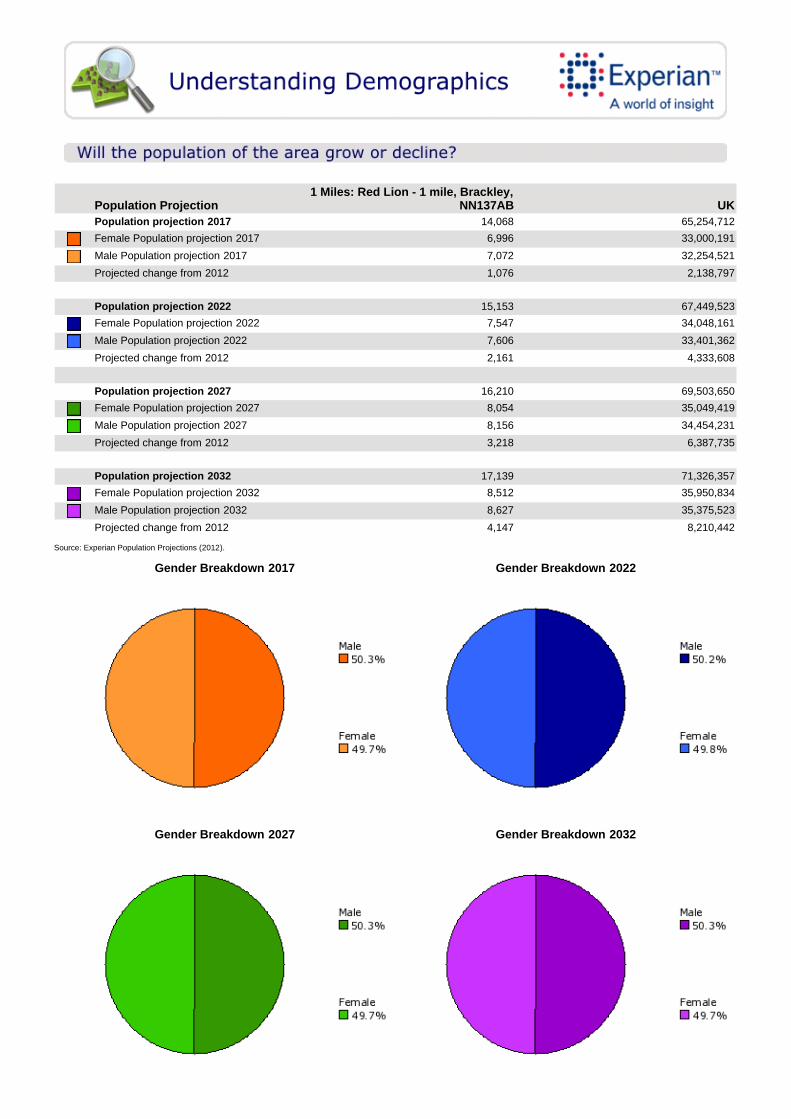
Population Projection1 Miles: Red Lion - 1 mile, Brackley,
NN137AB UK Population projection 2017 14,068 65,254,712
Female Population projection 2017 6,996 33,000,191
Male Population projection 2017 7,072 32,254,521
Projected change from 2012 1,076 2,138,797
Population projection 2022 15,153 67,449,523
Female Population projection 2022 7,547 34,048,161
Male Population projection 2022 7,606 33,401,362
Projected change from 2012 2,161 4,333,608
Population projection 2027 16,210 69,503,650
Female Population projection 2027 8,054 35,049,419
Male Population projection 2027 8,156 34,454,231
Projected change from 2012 3,218 6,387,735
Population projection 2032 17,139 71,326,357
Female Population projection 2032 8,512 35,950,834
Male Population projection 2032 8,627 35,375,523
Projected change from 2012 4,147 8,210,442
Source: Experian Population Projections (2012).
Gender Breakdown 2017 Gender Breakdown 2022
Gender Breakdown 2027 Gender Breakdown 2032

% Population Change (Male) % Population Change (Female)
For 2012 the total population estimate is 12,992, this is divided into 50.10% male and 49.90% female. By 2017 the population is expected to have changed to 14,068, this is a projected change of 8.28% over five years, and the gender split is predicted to be 49.73% female and 50.27% male. In the five years to 2022 the population is estimated to change to 15,153, this is a further 7.71% change, and is expected to be divided into 49.81% female and 50.19% male. By 2027 the population is expected to be 16,210, a further change of 6.98%, and split into 49.69% female and 50.31% male. By 2032 the population is expected to be 17,139, a change of 5.73%, and divided into 49.66% female and 50.34% male.

Population change is an important element in fluctuations in consumer demand. Our population projections give a valuable insight into future demand in local areas, enabling you to predict future business performance, and plan accordingly.
The data is particularly useful if you are targeting specific age/gender ranges - for example, child care nurseries can find sites where the number of children is set to increase, and football clubs can target areas expecting growth in the number of teenagers.
Projections of residential population are available for each year from 2012 to 2032. These are split by gender and 18 age bands.

Data Components
Classification Data62% of the information used to build Mosaic UK is sourced from a combination of data that includes Experian's UK Consumer Dynamics Database, which provides consumer demographic information for the UK's 47 million adults and 24 million households. The database is built from an unrivalled variety of privacy-compliant public and Experian proprietary data and statistical models. These include the edited Electoral Roll, Council Tax property valuations, house sale prices, self-reported lifestyle surveys and other compiled consumer data. The remaining 38% of the data is sourced from the Census current year estimates that Experian has produced by utilising its wealth of data assets to track change in the key 2001 Census variables. All of the information used to build Mosaic is continuously updated. This enables Experian to verify and update the classification twice a year.
Descriptive DataThe key to understanding the behaviour of each Mosaic UK type is the richness of the descriptive data. Experian owns and sources a number of authoritative sources of media and market research that allows us to build a rich picture of the nation's social-cultural diversity.
ResolutionThe Mosaic UK classification is built by one of the world's most experienced consumer segmentation modelling teams. The latest version of Mosaic UK classifies all individuals, households or postcodes in the UK into a set of homogenous lifestyle types.
The Mosaic Family Tree
The Mosaic UK family tree illustrates the major demographic and lifestyle polarities between the groups and types, and shows how the Mosaic types relate to each other.

Mosaic Daytime provides small area estimates of the daytime population. This provides valuable information for retailers who rely on the surrounding 'weekday daytime population' for a significant proportion of their trade.
2012 mid-year estimates are available for each United Kingdom Output Area (OA) and Postal Sector. In addition, estimates are provided split down by the (residential) Mosaic UK groups and types. This allows existing Mosaic UK profiles of products and services to be combined with the 'small area' Mosaic Daytime population profiles to estimate market sizes.
Mosaic Daytime is created using the following key inputs:
Experian's 2012 mid-year estimates of residential population at OA level.
2001 Census Origin-Destination (O-D) data relating to travel to work (and place of study for Scotland) at OA-to-OA level.
See Travel to work questions asked across UK.
The Experian 2012 mid-year population estimates are split into sub-groups compatible with the 2001 Census O-D data, for example:
All people aged 16-74 in employment (not including full-time students).
All people aged 16-74 in employment (including full-time students).
For each sub-group, it is determined whether they are most likely to be:
Located somewhere outside their home (or residential OA) during the day, or
At home (or residential OA) during the day.
This takes into account the OA-to-OA 'Travel to Work' 2001 Census data.
For sub-groups which are likely to be away from home during the day, and where sufficient 2001 Census data on travel patterns exists, a reallocation from 'Origin OAs' to 'Destination OAs' is undertaken. The OA level Mosaic UK Profile of the 2012 population sub-group is allocated to each 'Destination OA' using probabilities derived from the 2001 Census O-D data. These estimated flows are then aggregated to 'Destination OA' level to create the OA level data. Finally, data is accumulated from OA level to Postal Sector level to create the Postal Sector level dataset.
What is the 2001 Census?
The Census is a government survey which is conducted every 10 years and covers the whole country. The information is collected on a single day. The government use the information to plan what local infrastructure is required in the future such as schools and hospitals
Why choose Census data from Experian?
Experian has extensive experience of handling the complexities of Census information. For the last 30 years, we have provided Census information to the public and private sector, processing information from all over the world, including the UK, United States, Western Europe, Australia and the Far East. Our demographic forecasting team provides population projection data to central and local government. This supports decisions on the provision of local services and amenities throughout the UK.
Experian is one of only six suppliers approved by the Office of National Statistics (ONS) following the release of Census 2001.
We were one of the first Census bureaux to create a complete national UK dataset by combining information from the ONS for England and Wales with data from the General Register Office (GRO) for Scotland and the Northern Ireland Statistics and Research Agency (NISRA).
Experian is a source supplier and partner to JICPOPS (Joint Industry Committee for Population Standards), whose purpose is to establish best practice for the provision of all demographic and geographic data in the UK.

Census Glossary of terms:
Age
Age is derived from the date of birth question and is the age at the person's last birthday
Ethnic Group
The Ethnic group question records people's perceived ethnic group and cultural background. Although the questions differ between the different parts of the UK, the same detailed codes are used across the UK to code the write-in responses.
Social Grade
Social Grade is the socio-economic classification used by the Market Research and Marketing Industries. Although it is not possible to allocate Social Grade precisely from information collected in the Census, the Market Research Society has developed a method for using Census information to provide a good approximation of Social Grade. Most output by Social Grade is for people aged 16 and over in households. They are classified by the Social Grade of their Household Reference Person.
Economic Activity
The Economic Activity questions apply only to people aged 16 to 74. They relate to whether or not a person was working or looking for work in the week before Census. The concept of Economic Activity is compatible with the International Labour Organisation (ILO) definition of economic status.
Dwelling
A household's accommodation (a household space) is defined as being in a shared dwelling if it has accommodation type 'part of a converted or shared house', not all the rooms (including bathroom and toilet, if any) are behind a door that only that household can use and there is at least one other such household space at the same address with which it can be combined to form the shared dwelling. If any of these conditions is not met, the household space forms an unshared dwelling. Therefore a dwelling can consist of one household space (an unshared dwelling) or two or more household space (a shared dwelling).
Tenure
The tenure of a household is derived from the response to the question asking whether the household owns or rents its accommodation and, if rented, from the response to the question asking who is the landlord.
Census output is Crown copyright and is reproduced with the permission of the Controller of the HMSO and the Queen’s Printer for Scotland.
Data from the Expenditure and Food Survey has been made available by the Office for National Statistics and has been used by permission. The ONS do not bear any responsibility for the analysis or interpretation of the data reported here.