RECYCLING—NONFERROUS M...impurities such as magnesium, zinc, and lithium more than triple the UBC...
22
1 RECYCLING—NONFERROUS METALS By Gerald R. Smith Introduction Aluminum 1 Recycling, a significant factor in the supply Metal recovered from both new and old of many of the key metals used in our society, scrap reached an historic high of approximately provides environmental benefits in terms of 3.1 million tons in 1994, according to data energy savings, reduced volumes of waste, and derived by the USBM from its "Aluminum reduced emissions associated with the energy Scrap" survey. Of the 95 companies and/or savings. plants to which monthly or annual survey The estimated value of recycled nonferrous requests were sent, 79 responded, representing metals in 1994 was about $9.3 billion and is an 90% of the total scrap consumed shown in table increasingly important component of economic 2. activity in the United States. Table 1 shows According to figures released by the salient U.S. recycling statistics for selected Aluminum Association Inc., the Can Manufac- metals. Table 1 also shows salient U.S. turers Institute, and the Institute of Scrap apparent supply and recycling statistics for Recycling Industries Inc. a record 64.7 billion selected metals. aluminum beverage cans were recycled in the As part of its Commodities and Materials United States during 1994. The recycling rate, Program, the U.S. Bureau of Mines (USBM) based on the number of cans shipped during the provides information and analysis on more than year, was 65.4%, more than 2% higher than the 100 raw and/or processed minerals. Collected 1993 recycling rate of 63.1%. According to the data are assessed by commodity specialists, and organizations' joint press release, every information is disseminated to government, aluminum beverage can produced in 1994 had industry, and academia through consultative an average of 54.1% post-consumer recycled services and more than 100 recurring content, a far higher percentage than any other publications. This publication examines and beverage container. reports on minerals and materials trends as well Imco Recycling Inc. announced plans to as environmental aspects of the entire life cycle increase capacity at its used beverage can of minerals use. (UBC) recycling plant in Uhrichsville, OH. The USBM Research Directorate conducted The $2.5-million expansion was expected to research in 1994 on recycling of consumer increase annual capacity at the plant by 25%, to products, advanced materials, copper processing 152,000 tons per year. Imco also announced waste, and metallurgical residues and effluents the purchase of Phoenix Smelting Corp., owner currently discarded. The Bureau also of Metal Resources Inc., which operated an conducted research on impurity control during aluminum recycling plant in Loudon, TN. The recycling and design for reuse or waste 54,000-ton-per-year recycling plant was near minimization. To increase the efficiency of Imco's Rockwood, TN, facility. recycling, the USBM investigated the control of Alcan Aluminum Corp. announced plans to impurities such as magnesium, zinc, and lithium more than triple the UBC processing capacity at in aluminum scrap and the removal of copper its Oswego, NY, aluminum rolling complex. from ferrous scrap. The USBM also Upon completion of the $23 million expansion investigated methods to remove heavy-metal project, the recycling unit reportedly would contaminants from mineral processing and have the capacity to recycle 5 billion UBC's manufacturing waste and to stabilize those heavy metals not removed. Because of the increasing importance of recycling to domestic metal supply and the intense public interest, the USBM initiated this separate chapter on nonferrous metal recycling as part of its Annual Report series in 1991. A separate chapter on iron and steel scrap already had been part of this series for many years. The focus of this chapter is on aluminum, copper, lead, tin, and zinc recycling. 2 3 4 (75,000 tons) per year. (See tables 2, 3, and 5 4.) The London Metal Exchange (LME) reported that aluminum alloy ingot held at its U.S. warehouses at yearend 1994 increased to 1,100 tons, a slight increase from the 980 tons of alloy held at yearend 1993. Prices.—Purchase prices for aluminum scrap, as quoted by American Metal Market (AMM), fluctuated during the year and closed the year at significantly higher levels than those at the beginning of the year. The yearend price ranges for selected types of aluminum scrap were as follows: mixed low copper-content aluminum clips, 69 to 70 cents per pound; old sheet and cast, 63 to 65 cents per pound; and clean, dry aluminum turnings, 64 to 65 cents per pound. Prices for aluminum UBC's also trended upward and closed at approximately twice the level of that at the beginning of the year. Aluminum producers' buying price range for processed and delivered UBC's, as quoted by AMM, began the year at 33 to 37 cents per pound. The price range at the end of the year narrowed and increased to 70 to 72 cents per pound. The yearend indicator prices, as published by AMM, for selected secondary aluminum ingots also increased compared with those of the previous year and were as follows: alloy 380 (1% zinc content), 98.98 cents per pound; alloy 360 (0.6% copper content), 102.79 cents per pound; alloy 413 (0.6% copper content), 102.51 cents per pound; and alloy 319, 102.30 cents per pound. Metals Week published an annual average U.S. price of 74.71 cents per pound for A-380 alloy (3% zinc content). The average annual LME cash price for a similar aluminum 380 alloy was 65.90 cents per pound. Foreign Trade.—Exports of aluminum scrap increased in 1994, reversing a 4-year downward trend. Japan continued to be the principal destination of exported scrap, accounting for almost 35% of the total. Imports for consumption increased compared with those of the previous year. Canada remained the major shipping country to the United States, supplying 55% of the total aluminum scrap imports in 1994. (See tables 5 and 6.) World Review.—According to preliminary estimates published by the World Bureau of Metal Statistics in June 1995, world production of secondary aluminum increased to 6.3 million tons in 1994 from the revised 1993 production figure of 6.1 million tons. According to Aluminum Can Recycling Europe, 69,700 tons of aluminum UBC's were recycled in Europe, representing a recycling rate of 30%. The four countries with the highest individual recycling rates were Sweden (90%), Switzerland (83%), Iceland (80%), and Austria (65%). 6 The recycling rate for aluminum UBC's in
Transcript of RECYCLING—NONFERROUS M...impurities such as magnesium, zinc, and lithium more than triple the UBC...
1
RECYCLING—NONFERROUS METALSBy Gerald R. Smith
Introduction Aluminum1
Recycling, a significant factor in the supply Metal recovered from both new and oldof many of the key metals used in our society, scrap reached an historic high of approximatelyprovides environmental benefits in terms of 3.1 million tons in 1994, according to dataenergy savings, reduced volumes of waste, and derived by the USBM from its "Aluminumreduced emissions associated with the energy Scrap" survey. Of the 95 companies and/orsavings. plants to which monthly or annual survey
The estimated value of recycled nonferrous requests were sent, 79 responded, representingmetals in 1994 was about $9.3 billion and is an 90% of the total scrap consumed shown in tableincreasingly important component of economic 2.activity in the United States. Table 1 shows According to figures released by thesalient U.S. recycling statistics for selected Aluminum Association Inc., the Can Manufac-metals. Table 1 also shows salient U.S. turers Institute, and the Institute of Scrapapparent supply and recycling statistics for Recycling Industries Inc. a record 64.7 billionselected metals. aluminum beverage cans were recycled in the
As part of its Commodities and Materials United States during 1994. The recycling rate,Program, the U.S. Bureau of Mines (USBM) based on the number of cans shipped during theprovides information and analysis on more than year, was 65.4%, more than 2% higher than the100 raw and/or processed minerals. Collected 1993 recycling rate of 63.1%. According to thedata are assessed by commodity specialists, and organizations' joint press release, everyinformation is disseminated to government, aluminum beverage can produced in 1994 hadindustry, and academia through consultative an average of 54.1% post-consumer recycledservices and more than 100 recurring content, a far higher percentage than any otherpublications. This publication examines and beverage container.reports on minerals and materials trends as well Imco Recycling Inc. announced plans toas environmental aspects of the entire life cycle increase capacity at its used beverage canof minerals use. (UBC) recycling plant in Uhrichsville, OH.
The USBM Research Directorate conducted The $2.5-million expansion was expected toresearch in 1994 on recycling of consumer increase annual capacity at the plant by 25%, toproducts, advanced materials, copper processing 152,000 tons per year. Imco also announcedwaste, and metallurgical residues and effluents the purchase of Phoenix Smelting Corp., ownercurrently discarded. The Bureau also of Metal Resources Inc., which operated anconducted research on impurity control during aluminum recycling plant in Loudon, TN. Therecycling and design for reuse or waste 54,000-ton-per-year recycling plant was nearminimization. To increase the efficiency of Imco's Rockwood, TN, facility.recycling, the USBM investigated the control of Alcan Aluminum Corp. announced plans toimpurities such as magnesium, zinc, and lithium more than triple the UBC processing capacity atin aluminum scrap and the removal of copper its Oswego, NY, aluminum rolling complex.from ferrous scrap. The USBM also Upon completion of the $23 million expansioninvestigated methods to remove heavy-metal project, the recycling unit reportedly wouldcontaminants from mineral processing and have the capacity to recycle 5 billion UBC'smanufacturing waste and to stabilize thoseheavy metals not removed.
Because of the increasing importance ofrecycling to domestic metal supply and theintense public interest, the USBM initiated thisseparate chapter on nonferrous metal recyclingas part of its Annual Report series in 1991. Aseparate chapter on iron and steel scrap alreadyhad been part of this series for many years. Thefocus of this chapter is on aluminum, copper,lead, tin, and zinc recycling.
2
3
4
(75,000 tons) per year. (See tables 2, 3, and5
4.)The London Metal Exchange (LME)
reported that aluminum alloy ingot held at itsU.S. warehouses at yearend 1994 increased to1,100 tons, a slight increase from the 980 tonsof alloy held at yearend 1993.
Prices.—Purchase prices for aluminumscrap, as quoted by American Metal Market(AMM), fluctuated during the year and closedthe year at significantly higher levels than those
at the beginning of the year. The yearend priceranges for selected types of aluminum scrapwere as follows: mixed low copper-contentaluminum clips, 69 to 70 cents per pound; oldsheet and cast, 63 to 65 cents per pound; andclean, dry aluminum turnings, 64 to 65 centsper pound. Prices for aluminum UBC's alsotrended upward and closed at approximatelytwice the level of that at the beginning of theyear. Aluminum producers' buying price rangefor processed and delivered UBC's, as quoted byAMM, began the year at 33 to 37 cents perpound. The price range at the end of the yearnarrowed and increased to 70 to 72 cents perpound.
The yearend indicator prices, as publishedby AMM, for selected secondary aluminumingots also increased compared with those ofthe previous year and were as follows: alloy380 (1% zinc content), 98.98 cents per pound;alloy 360 (0.6% copper content), 102.79 centsper pound; alloy 413 (0.6% copper content),102.51 cents per pound; and alloy 319, 102.30cents per pound. Metals Week published anannual average U.S. price of 74.71 cents perpound for A-380 alloy (3% zinc content). Theaverage annual LME cash price for a similaraluminum 380 alloy was 65.90 cents per pound.
Foreign Trade.—Exports of aluminumscrap increased in 1994, reversing a 4-yeardownward trend. Japan continued to be theprincipal destination of exported scrap,accounting for almost 35% of the total.
Imports for consumption increased comparedwith those of the previous year. Canadaremained the major shipping country to theUnited States, supplying 55% of the totalaluminum scrap imports in 1994. (See tables 5and 6.)
World Review.—According to preliminaryestimates published by the World Bureau ofMetal Statistics in June 1995, world productionof secondary aluminum increased to 6.3 milliontons in 1994 from the revised 1993 productionfigure of 6.1 million tons.
According to Aluminum Can RecyclingEurope, 69,700 tons of aluminum UBC's wererecycled in Europe, representing a recycling rateof 30%. The four countries with the highestindividual recycling rates were Sweden (90%),Switzerland (83%), Iceland (80%), and Austria(65%).6
The recycling rate for aluminum UBC's in
2
Japan increased to 61.1% in fiscal year 1994 copper, up almost 80,000 tons from that of the scrap than does the consumer of the scrap.from 57.7% the previous year, according to the previous year, and accounted for 62% of copper Because of these inherent costs associated withJapan Aluminum Can Recycling Association. recovered from all scrap. This large increase in the initial collection and processing of scrap,The association estimated that 9.07 billion cans new scrap consumption reflects the increased low refined copper prices, such as thosewere recycled compared with 6.8 billion cans in domestic consumption of mill products, which, experienced in January, squeeze processing andfiscal year 1993. according to the Copper Development profit margins and reduce the quantity of scrap7
Outlook
The domestic and world secondaryaluminum industries are expected to continue toexpand. The growth in the use of aluminumbeverage containers is continuing and helpingto expand the aluminum recycling industryaround the world. Increased use of castaluminum by the automotive industry, a majormarket for secondary aluminum ingot, is alsoencouraging the expansion of the secondaryaluminum industry. Growing markets and theincreased sensitivity of the public to the issue ofwaste management have combined to foster thedevelopment and expansion of aluminumrecycling around the world.
Copper and Copper Alloy Scrap8
Annual Review
World production of secondary refinedcopper fell by about 100,000 tons to 1.8 milliontons in 1994, and accounted for about 16% ofglobal refined production. The United Statesaccounted for most of the decline in secondaryrefined production. Following 6 years ofsurplus production and a near tripling of worldrefined inventories to 1.4 million tons, copperdemand in 1994 exceeded production andglobal copper inventories declined by 360,000tons. Refined copper prices, which inNovember 1993 had fallen to their lowest levelin 7 years, rose during 1994 in response toincreasing supply tightness. The U.S. producerprice for refined copper averaged $1.41 perpound in December, up from $0.92 inDecember 1993.
Domestic consumption of refined copperrose by more than 13% during 1994 to record 1994. (See tables 15 and 16.)high levels. This was the third consecutive yearof large demand increases, consumption havingrisen by 6.3% and 8.5%, respectively, in 1992and 1993. In 1994, copper recovered from allold and new refined or remelted scrapcomprised 38% of total U.S. copper supply andhad an equivalent refined value of $3.3 billion.(See tables 7 through 13.) Conversion of old closely tied to the overall level of copperscrap to alloys and refined copper declined by fabrication. The recovery of copper from old43,000 tons, but contributed 500,000 tons of scrap declined in 1994 for the secondcopper to the market, a quantity equivalent to consecutive year, and did not share in the strongabout 18% of U.S. apparent consumption. Pur- growth in copper demand. Old scrap as achased new scrap, derived from copper percentage of apparent consumption declinedfabricating operations, yielded 827,000 tons of from 25% in 1991, to 19% in 1994. With the
Association Inc., rose by almost 13% in 1994. that can be recovered economically. Despite theAbout 77% of the copper contained in new increase in margins, consumption of No. 2scrap was consumed at brass mills. During the scrap, as well as lower grades of scrapyear, 8 primary and 5 secondary smelters, 9 consumed predominantly by secondary smelters,electrolytic and 6 fire refineries, and 15 declined in 1994. Environmental and capacityelectrowinning plants operated in the United constraints, along with constraints on materialsStates. Three of the electrolytic refineries were availability, prevented secondary smelters fromdedicated facilities associated with secondary increasing throughput. As noted above, thesmelters and mostly processed anode derived Gaston smelter closed at yearend. Also, intensefrom scrap; several other refineries that mainly competition from exporters may have limitedprocessed primary anode purchased or tolled the availability of certain scrap types. This issome anode derived from scrap. All the fire also reflected in the decline of old scraprefineries processed copper scrap. Copper was consumption; secondary smelters are the largestconsumed, both as refined copper and as direct consumers of old scrap. On the other hand,melt scrap, at about 35 brass mills, 15 wire rod consumption of No. 1 scrap and new scrap bothmills, and 600 foundries, chemical plants, and increased, owing to high production levels atmiscellaneous consumers. Of the total copper brass mills; brass mills are the principalrecovered from copper-, aluminum-, nickel-, and consumers of No. 1 scrap and new scrap.zinc-based scrap, copper smelters and refiners Consumption of brass ingot, a product of brassrecovered 30%; brass mills, 51%; brass and scrap, also increased, owing to a rise inbronze ingot makers, 10%; and miscellaneous domestic casting production.manufacturers, foundries, and chemical plants,9%. Unalloyed scrap accounted for 51% ofcopperbased scrap consumed, as shown on table11.
While total smelter capacity remainedunchanged at 1.9 million tons, investmentsmade in 1993 and 1994 led to higher capacityusage and increased primary smelterproduction. Secondary smelter productionhowever, declined slightly, and at yearend,Southwire Co. announced the immediateclosure of its secondary smelter and thephase-out of the associated electrolytic refineryat its Gaston Copper Recycling Corp., Gaston,SC. High operating costs and the largeadditional capital investment needed to complywith environmental regulations were cited bythe company as the reason for closure.
Prices.—Copper scrap prices trended alloy scrap and accounted for 73% of imports inupward in 1994, following the rise in refinedcopper prices. However, while the averageproducer price for refined copper rose about 53cents per pound from January to December, theprice rise for No. 2 scrap was only 32 cents perpound. Thus, the margin between the twomaterials widened from 18 cents per pound inJanuary, to 39 cents per pound in December.While copper scrap prices correlate to the priceof refined copper, the price paid for scrap ateach level of processing must be sufficientlydiscounted to allow for all subsequentprocessing costs. Thus, a scrap collector whomust perform such functions as sorting,shipping, chopping, baling, etc. will pay less for
Foreign Trade.—Exports of both alloyedand unalloyed scrap rose significantly in 1994,while imports of copper alloy scrap declinedmarkedly. Consequently, net exports of scraprose to more than 250,000 tons, up from about100,000 tons in 1993. The United States wasone of the largest international sources forcopper scrap, followed by France, Germany, andthe United Kingdom. U.S. exports of copperscrap have been increasing since the 1960's,when the Asian nations began to industrialize.In 1994, China, Hong Kong, Japan, Korea,Singapore, and Taiwan, combined, accountedfor 44% and 49%, respectively, of U.S.unalloyed and alloyed scrap exports. Exports ofunalloyed scrap to Canada rose by more than70%. Canada and Mexico were the leadingsources for U.S. imports of copper and copper
Outlook
Over the next decade, new copper scrap willcontinue to be a premium material for the U.S.semifabricating industry, and its level ofavailability and the quantity recycled will be
3
closure of the Gaston smelter, domestic domestically and imported. This tax is intended was estimated using prior year levels adjustedrecovery of copper from old scrap is expected to to provide a dedicated revenue of $1-billion- for general industry trends.remain at or below the current level. However, per-year for use in the cleanup of lead-based In U.S. secondary lead industry actionsif it is assumed that most copper scrap exports paint hazards in accordance with Title 10 of the during 1994, GNB Battery Technologies Inc.,were old scrap destined for recovery, the total Housing and Community Development Act of Atlanta, GA, received approval from thequantity of domestic source copper in old scrap 1992. Georgia Environmental Protection Agency torecycled in 1994 increased by about 30,000 build and operate a new and expanded lead-acidtons. Be-cause scrap is usually a lower-cost battery recycling facility at its presentalternative to primary metal, it will continue to Columbus, GA, location. The new secondarybe of great interest to Far Eastern countries as smelter/refinery, expected to be completed inthey expand their industries. The recovery of mid-1995, will have a production capacity ofcopper (old scrap) from the large and growing 90,000 tons per year of lead, 4.5 times that ofreservoir of copper products in use may be the existing plant at the Columbus site. GNBlimited by the following factors: (1) copper also acquired Quenell Enterprises, a Losprices, (2) life of products, (3) available Angeles-based lead oxide producer, in Octoberrecovery technologies, (4) changing end-use 1994. This purchase reportedly was intended topatterns (5) and environmental regulation. further support GNB's growing in-houseRegulations to limit the lead content of demands in battery production, recycling, andplumbing fixtures in potable water distribution distribution associated with the opening of thesystems could result in the land-filling of new Columbus plant. GNB's plans to build ahigh-leaded brass scrap, absent new recovery Greenfield secondary lead smelter intechnologies; leaded brass scrap is the prime Waynesboro, GA, continued to be suspendedfeed material to the ingot-making and foundry indefinitely.industries. The Basel Convention, an In September 1994, RSR Corp., Dallas, TX,international agreement on the transboundry suspended the process of obtaining permits formovement of hazardous waste, could impede its planned $60 million battery recycling plantthe international flow of copper scrap. in Aiken County, SC. The suspension of such
Lead9
Refined lead is a soft, heavy metal, one ofthe first metals used by humankind. Among theimportant characteristics of lead are itselectrochemical energy storage capability, itsgood corrosion resistance, and its low meltingpoint, the latter making it relatively easy to cast.The United States is the world's largestproducer and consumer of refined lead;domestic demand for lead is surpassed only bythat for aluminum, copper, and iron.
Legislation and Government Programs.— (See table 20.)The Lead Exposure Reduction Act was passedby the U.S. Senate at the end of May 1994.Included in this legislation was theestablishment of a mandatory recycling programthat prohibits incineration and landfill disposalof used lead-acid batteries and creates adistribution system whereby the used batteriesare returned by the retailers to the secondarylead smelters for recycling. The U.S. House ofRepresentatives did not advance its version ofthis legislation during 1994.
The Lead-Based Paint Hazard Trust FundAct introduced in the 1st session of the 103dCongress by 7 cosponsors on June 22, 1993,gained 36 additional sponsors in the U.S. Houseof Representatives by the end of the 2d sessionof the 103d Congress, but no further action wastaken on the bill during 1994. Essentially, thebill proposes a unitary tax of 45 cents per poundon all primary and secondary lead produced
Consumption.—Domestic demand patternsfor lead have undergone significant change inrecent years as a result of human healthconcerns related to lead exposure andsubsequent Government actions taken to reducethat exposure. In 1972, dissipative uses of lead,particularly in gasoline additives, pigments,ammunition, and chemicals, coupled with otheruses where the potential for human exposureexists, such as in packaging, solders, plumbing,and certain other construction materials,amounted to about 510,000 tons, or 38% of thereported consumption of lead. In 1985, theseend uses represented 205,000 tons, 18% ofconsumption, and in 1994 were only 140,000tons, 10% of consumption. Lead consumed inlead-acid storage batteries grew accordinglyduring these years from 660,000 tons, 49% oflead consumption in 1972, to 840,000 tons,73% in 1985, to 1.22 million tons, 84% in1994. Consequently, the number of usedbatteries available for recycling also grewduring this period. By 1994, the gross weightof lead-containing battery scrap processed atsecondary smelters reached 1.01 million tons.According to the most recent Battery CouncilInternational statistics, the leadacid battery Foreign Trade.—Exports of lead scrap inrecycling rate in the United States was about 1994 were about 88,000 tons, nearly 63%93% in 1993. (See table 17.)
Production.—In 1994, about 816,000 tonsof lead were produced at secondary smeltersfrom used lead-acid batteries. This wasapproximately 89% of the refined leadrecovered from both old and new scrap, and72% of the total production of refined lead fromprimary and secondary sources. The estimatedvalue of the lead recovered from secondarysources in 1994 was $748 million. Domesticsecondary production of lead increased by about2% in 1994, returning to near the level reachedin 1992. (See tables 1, 18, and 19.)
Domestic data for secondary leadconsumption and production are developed bythe USBM from a voluntary survey thatincludes data from both monthly and annualrespondents. In 1994, secondary smeltingand/or consuming companies which were senta survey request numbered 174, of which 139responded, providing 88% of the total reportedU.S. lead consumption. Of the 24 companiesproducing secondary lead to which a surveyrequest was sent, exclusive of those recyclingcopper-base alloys, 21 responded, providing91% of the total refinery production ofsecondary lead. Data for the nonrespondents
activity was made at the request of the AikenCounty Economic Development Partnership,pending the outcome of a Federal grand juryindictment alleging environmental violations atRSR's Indianapolis, IN, recycling plant.
higher than in 1993, and were valued atapproximately $24 million, about 69% greaterthan in 1993. Canada and the Republic ofKorea received 78% and 11%, respectively, ofthe exports of lead scrap. Imports of lead scrapfor the year totaled 144 tons worth $80,000.
Outlook
After 2 years of increases in lead demand inthe United States, owing mainly to theincreased use of lead acid batteries as bothoriginal equipment and replacement batteries inthe automotive industry, consumption of lead isexpected to decline slightly in 1995.
The rate of economic growth domestically isanticipated to be somewhat slower in 1995, butthe automotive manufacturing sector willremain relatively strong, resulting in a higherdemand for original equipment batteries. Totalnew vehicle production is estimated to increaseby 5.7%, to 12.9 million units in 1995. Thisdemand increase, however, will be tempered bya decrease in demand for replacement batteries,following a fairly mild 1994-95 winternationwide. The net result is a predicted
4
moderate decrease of about 2% in overall lead the USBM from a voluntary survey of the U.S. reported on studies conducted by the U.S.consumption during 1995. tin scrap industry. The smaller side of this Bureau of Mines Rolla (MO) Research Center
Lead supply from domestic secondary and industry is covered by a canvass sent to five on characteristics of recycled automotive oilprimary smelter production is expected to show detinning companies monthly; all five filters, many of which are made from tinplate.a net decline of about 1% in 1995. While responded or are estimated for. The larger side Increasingly, in recent years, used oil filtersprimary production should increase by about of the tin scrap industry, involving the alloys of have become a steel scrap item used as an4%, as a result of continued higher production tin, is covered largely by a canvass of the copper electric furnace scrap charge by steel minimills.at some of the larger operations, this increase and lead scrap industries (tin's major coalloys) TAMCO Steel Co., Rancho Cucamonga, CA,will be countered by a decline in secondary from which estimates are made for the tin and Bayou Steel Co., LaPlace, LA, have beenproduction, a result of a modest shortage of content. prominent in such scrap usage. The USBMavailable scrap. The former Steel Can Recycling Institute research showed that crushed and drained oil
Tin10
Tin was one of the earliest metals known tohumankind. Tin occurs in nature principally asthe oxide mineral cassiterite. Tin metal iscommonly used as a protective coating or as analloying metal with one or more other metals.Refined metal in the form of ingots is generallyused as the starting point for most uses of tin.The major uses for tin are as follows: cans andcontainers, 32%; electrical, 22%; construction,10%; and transportation, 11%; other usesaccount for the remaining 25%. Tinplatinggenerally uses no scrap tin, but most other end-use items, especially solder and brass/bronze,use substantial quantities of tin scrap.
About 25% of the domestic supply of tinmetal is metal recovered from scrap. In 1994,10,893 tons of tin metal valued at an estimated$89 million was recovered from new and old tinscrap.
Old tin scrap is collected at hundreds ofdomestic scrap yards, at nine detinning plants,and at most municipal collection/ recyclingcenters. New tin scrap is generated mainly inthe tin mills at six steel plants, scores ofcanmaking facilities, numerous brass andbronze plants, and many solder making plants.
Detinning facilities are unique to the tinscrap industry, in that no other major metalindustry has such large-scale facilities toremove plated metal. There are nine domesticdetinning plants scattered across the country.Until about 1989, they processed almostentirely new tinplate scrap that originated in thetin mills of steel plants and canmaking plants.Since 1989, with new technology that shredsused tin cans, some of the detinning facilitieshave the capability of also detinning old tincans. Only in the detinning process does freetin metal see its way to the marketplace. All thealloy forms of tin are recycled within their ownproduct line industries and thus reappear asregenerated alloys. (See tables 21, and 22.)
Most tin scrap processing facilities are closeto the tin-using industries and to denselypopulated areas. Most are in the Midwest andNortheast.
Domestic scrap data for tin are developed by
(SCRI) completed its first full year under its filters have a bulk density that is higher thannew name, the Steel Recycling Institute (SRI). many traditional scrap steel grades, a chemicalThe name change reflected a broadening of its analysis low in residual elements (except tin),mission to encompass not only steel cans and an overall yield of oil-filter scrap to cast(which had been its sole focus since its 1988 steel of 76% to 85% depending on the methodfounding), but all steel products ranging from used to prepare the scrap.appliances to filing cabinets to cars. Since One of the major domestic detinners, ProlerSCRI's inception in 1988, the steel can International Corp., announced plans to expandrecycling rate had grown from 15% to 53% in its capacity to recycle tin-bearing solutions from1994. The overall steel recycling rate has been the electronics industry at its Coolidge, AZ,over 60% for more than 20 years and currently facility. Proler announced that the companystands at 66%. developed its own process to extract tin from
The SRI announced several recycling solutions and sludges by adapting detinninghighlights for 1994: a) Steel can recycling rates technology used internally. Proler produces tinin the United States reached an all-time high of anodes from these solutions and sludges, which53%, with more than 17.6 billion cans, it sells back to the electronics industry. Prolerweighing 1.5 million tons, recycled. b) felt the need to expand because demand for theUtilization of used steel cans as a scrap charge service exceeded capacity at its existing plant.continued to increase. Steel mills and foundries Arizona is the home of numerous electronicswere remelting about 500 steel cans every plants.second. c) Each year, more than 30 billion steelcans are produced, packaging a variety ofproducts from food and beverages, to paints,chemicals and personal care products. d) Nineout of 10 aerosol cans are made of steel and arerecyclable when empty. More than 1,700communities currently recycle aerosol cans. e)More than 170 million Americans haveconvenient access to steel can recycling throughcurbside, drop-off and buyback programs, aswell as through magnetic separation at resourcefacilities. f) The SRI's goal is to achieve a 66%recycling rate for steel cans by the end of 1995.g) The average American uses 144 steel canseach year. If every American recycled at least95 steel cans in 1995, the goal of a 66% steelcan recycling rate could be achieved.
The SRI continued to focus its attention onthe recycling of aerosol steel cans. Some havefelt that aerosol steel cans can be hazardous torecycle, but the SRI has maintained that as longas each can is first emptied it is no morehazardous to recycle than any other type of can.The SRI pointed to an especially successfulaerosol steel can recycling program itcoordinated in the State of Michigan. SRIclaimed that over 1,500 communities are nowrecycling aerosol cans, including large citiessuch as Philadelphia, PA, and Washington, DC.
The Journal of Metals (February 1994)
World Review.—The United States, France,Germany, Japan, and the United Kingdom,generally lead the world in tin recycling activityand innovation. Environmental pressures inthose countries for the past 20 years have actedas a powerful incentive.
In contrast to the United States and Europe,where detinning has long been a substantialactivity, Japanese industry does little or nodetinning because it feels that the tin coating ontinplate has become so thin in the past 20 yearsthat detinning is not economical.
Outlook
The near- and long-term outlook for tinrecycling is positive, with modest growthexpected, about 1% annually. Tin is a high-value industrial material. In the form oftinplate, one of its main uses, it is easilyseparated magnetically for recycling. Tinconsumption is expected to grow about 1%annually. Scrap is expected to grow from 25%of total metal consumed in 1994 to 27%annually by the year 2000. A major incentive isexpected to be environmental legislation, mostlyat the local and State level. If tin prices remainrelatively high compared with prices of othermajor metals, the industry will have sufficientincentive to recycle this costly metal.
5
Zinc11
Zinc is the fourth most widely used metalafter iron, aluminum, and copper. About three- EAF dust were produced at four plants. (Seefourths is in metal form and one-fourth incompound form. More than 90% of the metal isused for galvanizing steel and for alloys; theremainder is used to produce dust, oxide, andvarious chemicals. Most metal products findwidespread use in the automotive, construction,electrical, and machinery sectors of theeconomy. Compounds similarly are dispersedin distribution and use, but are mainly used inagricultural, chemical, paint, pharmaceutical,and rubber sectors of the economy.
Nearly one-third of the 1.42 million tons ofzinc consumed annually by domestic industriesis secondary zinc. In 1994, about 367 tons ofsecondary zinc, valued at about $390 million,was recovered in refined metal, alloys, dusts,and chemicals. Scrap containing about 58,300tons of zinc and valued at $34.4 million wasexported in 1994, whereas 51,700 tons of zincin scrap, valued at $19.8 million, was imported.
Recycled zinc was derived 70% from newscrap and 30% from old scrap. New zinc scrapwas generated mainly in galvanizing anddiecasting plants, brass mills, andmanufacturing facilities where basic zincmaterials were consumed. New scrap consistedmostly of drosses, skims, furnace dusts, andresidues (from galvanizing and diecastingoperations, brass mills, and chemical plants)and clippings from the processing (stamping,trimming, etc.) of galvanized steel sheet andstrip, rolled zinc, and brass sheet. Old scrapconsisted almost entirely of diecastings, (mainlyfrom scrapped automobiles), brass products, androlled zinc items, such as gutters, roofing, andengraving plates. Zinc recovery from theburning of tires for energy is small but growing,whereas recovery from both old and newgalvanized steel scrap has increaseddramatically. Old zinc and brass scrap werecollected at hundreds of domestic scrap yards,at more than 200 U.S. automobile and applianceshredding operations, and at numerousmunicipal collection centers. In 1994, therewere three primary and seven secondarysmelters that processed scrap, drosses, skims,and/or steelworking electric arc furnace (EAF)dust into slab zinc, zinc alloys, and zinc dust.Seven other plants processed skims, drosses,scrap, and residues into zinc sulfate and/orchloride chemicals. Secondary brass andbronze were recycled at more than 500secondary smelters, foundries, and ingotmakers. Eagle Zinc, Hillsboro, IL, producedAmerican-process zinc oxide from oxidicsecondary materials. Most secondary zincplants are in the Eastern and Midwestern
United States; the ZCA plant in Monaca, PA, initial processes may, in turn, be recycled,is, by far, the single largest processor secondary resulting in further zinc recovery.zinc. Crude zinc concentrates extracted from Zinc materials made from zinc-base scrap are
tables 23, 24, and 25.)Because of wide differences in the character
and content of zinc-bearing scrap, zincrecycling processes vary widely. Zinc-containing metals generally are separated fromother materials initially by physical means suchas magnetic separation, sink-floating, and handsorting. In the case of mixed nonferrous metalshredder scrap, zinc can be separated fromhigher-melting point metals, such as aluminumand copper, by selective melting in a sweatfurnace. Zinc in galvanized scrap is largelyrecovered in furnace dust when the scrap ischarged into a steelmaking furnace; however Prices.—Prices paid for scrap and secondaryone commercial process has been developed to materials are negotiated, often on the basis of astrip zinc from galvanized scrap with a caustic daily or average LME price for zinc metal. Bidsleach prior to recycling the substrate steel to the are required for U.S. Department of Defensesteelmaking process. scrap sales. Prices depend on factors such as
Clean new scrap, mainly brass and rolled geographic location, quantity available, quality,zinc clippings and reject diecastings, generally grade, the presence of other components oronly require remelting before reuse. Drosses, elements, and environmental difficulties infragmentized diecastings, and mixed high-grade handling, transporting, or treating. In the casescrap typically are remelted, followed by zinc of EAF dust, the dust generator usually pays thedistillation with recovery as metal, dust, or dust processor a fee to recycle the material.oxide. Sometimes, high-purity drosses are Typically, there is a basic charge for dust withsimply melted and reacted with various fluxes 20% zinc content; generators of dust with lowerto release the metallic content; often the zinc content pay more, whereas generators ofrecovered metal can be used directly as a dust with higher zinc content pay less. Zincgalvanizing brightener or master alloy. and brass scrap prices are generally notMedium- and low-grade skims, oxidic dust, ash, available, although average daily, weekly, orand residues generally undergo an intermediate monthly prices for a few specific common typesreduction-distillation-pyrometallurgical step to are published in American Metal Market, Metalupgrade the zinc product before treatment or Bulletin, and Metal Bulletin Monthly.they are leached with acid, alkaline, orammoniacal solutions to extract zinc, which issubsequently recovered as a compound byprecipitation-crystallization or as a salablechemical retained in solution. Almost all of thezinc in EAF dusts is first recovered in anupgraded, impure zinc oxide product; however,several commercial EAF-dust-treatment plantsare able to bypass the intermediate step andrecover zinc metal directly. The upgraded zincoxide pyrometallurgical production is almostalways shipped to a primary pyrometallurgicalzinc smelter for refinement to metal. For themost part, the zinc metals, alloys, dust, andchemicals recovered from secondary materialsare comparable in quality to those derived fromprimary materials.
Recovery efficiency is very high from simpleremelting, but declines as the number ofprocessing steps increases and, generally, as thezinc content of the scrap declines. Zincrecovery from most secondary processes rangesbetween 40% and 85%; however, oxidematerials, slags, and residues resulting from
slab zinc, alloys, dusts, and compounds. Brassscrap, on the other hand, typically is remeltedand, with alloy adjustment, recast as brass.Zinc chloride and sulfate compounds areproduced largely by acid leaching of zinc skims,drosses, and chemical residues. Impure zincoxide products and zinc-bearing slags aresometimes used as trace element additives infertilizers and animal feeds. Zinc in brass is theprincipal form of secondary recovery, althoughin the past few years, production of secondaryslab zinc has risen substantially because it hasbeen the principal zinc product of EAF dustrecycling.
Outlook
Driven by public concern for theenvironment and legislation intended to protectthe environment, domestic and world secondaryzinc recovery is expected to increase as apercentage of zinc consumption in the nextdecade. However, the prospect for recoveryequivalent to more than 35% to 40% ofconsumption is relatively poor because of thedissipative nature and diversity of zinc uses.Greater recovery of zinc from galvanized steelscrap can be expected in the future as severalprocesses for dezincing galvanized scrap havebeen developed and tested. Increasedprocessing of low-zinc EAF dust, from othersteelmaking processes, and zinc residues fromenergy-generating tire burning appear to beother sources for near term gains in secondaryzinc output. Increased zinc recovery from therecycling of carbon-zinc and alkaline batteriesand municipal incinerator dusts and residuesare longer term possibilities. Secondary zinc
6
recycling could rise dramatically in the next CRU. Aluminum Metal Monitor (monthly).decade if the powering of a substantial number The Crucible, Non-Ferrous Founders' Society.of electric cars by zinc-air batteries become a Institute of Scrap Recycling Industries.reality. Lead and Zinc Statistics (monthly bulletin of
Prepared by J. F. Papp, physical scientist ,1
Branch of Metals.Prepared by P. Plunkert, physical scientist ,2
Branch of Metals.American Metal Market. Imco to Raise Capacity3
25% at Ohio UBC Plant. V. 102, No. 86, May 5,1994, p. 7.
Metal Bulletin Monthly. Imco Recycling. V.4
288, Dec. 1994, p. 80.American Metal Market. Alcan to Triple UBCs5
at Oswego. V. 102, No. 87, May 6, 1994, p. 2.———. 1994 European Beverage Can Con-6
sumption. V. 103, No. 115, June 15, 1995, p. 5.———. Japanese UBC Recycling Rate Up. V.7
103, No. 139, July 21, 1995, p. 10.Prepared by D. L. Edelstein, physical scientist,8
Branch of Metals.Prepared by G. R. Smith, physical scientist,9
Branch of Metals.Prepared by J. F. Carlin, Jr., physical scientist,10
Branch of Metals.Prepared by S. M. Jasinski, physical scientist,11
Branch of Metals.
OTHER SOURCES OF INFORMATION
U.S. Bureau of Mines PublicationsAluminum. Ch. in Mineral Commodity
Summaries, annual.Aluminum. Ch. in Minerals Yearbook,
annual.Aluminum. Mineral Industry Surveys,
monthly.Copper. Ch. in Mineral Commodity
Summaries, annual.Copper. Ch. in Minerals Yearbook, annual.Copper. Mineral Industry Surveys, monthly.Lead. Ch. in Mineral Commodity Summaries,
annual.Lead. Ch. in Minerals Yearbook, annual.Lead. Mineral Industry Survey, monthly.Tin. Ch. in Mineral Commodity Summaries,
annual.Tin. Ch. in Minerals Yearbook, monthly.Tin. Mineral Industry Survey, monthly.Zinc. Ch. in Mineral Commodity Summaries,
annual.Zinc. Ch. in Minerals Yearbook, annual.Zinc. Mineral Industry Surveys, monthly.Other SourcesAluminum Association Inc. Aluminum
Statistical Review, annual.American Metal Market (daily paper).Battery Council International (1993 National
Recycling Rate Study).Brass and Bronze Ingotmakers Association.Copper and Brass Fabricators Council, Inc.
the International Lead and Zinc StudyGroup).
Metal Bulletin.Metals Week.Resource Recycling.Roskill Information Services Ltd. Zinc 1990,
4th ed.Zincscan.
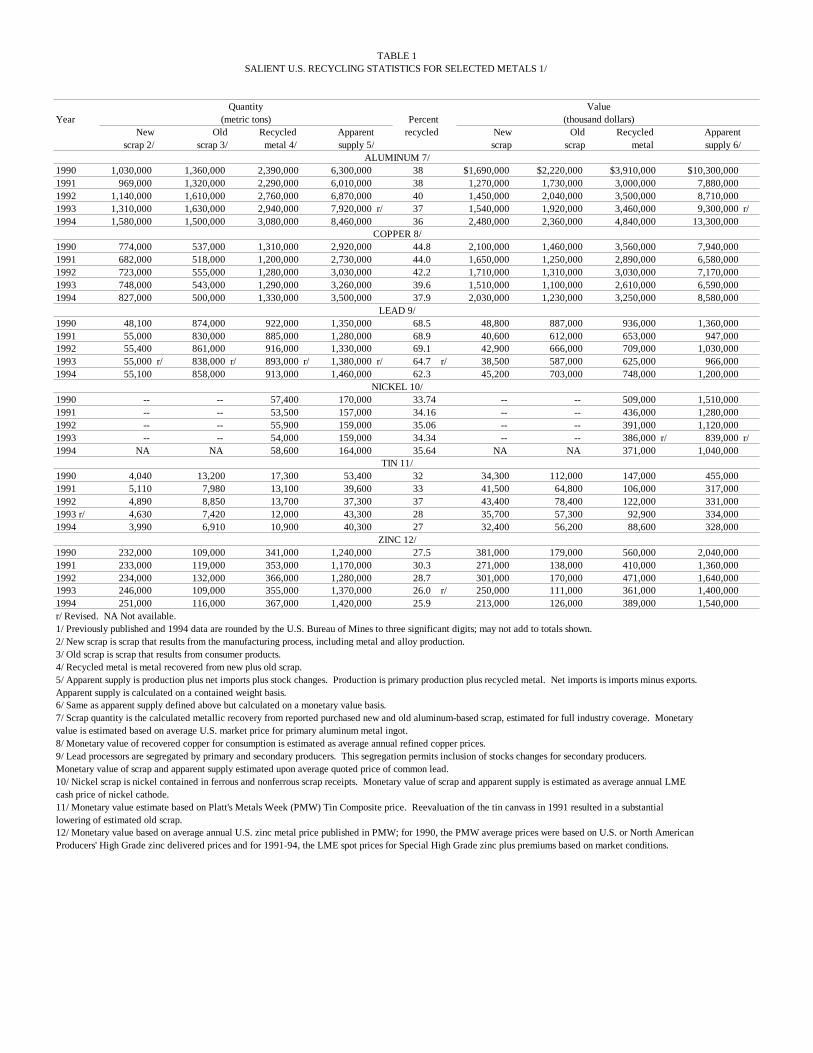
TABLE 1SALIENT U.S. RECYCLING STATISTICS FOR SELECTED METALS 1/
Quantity Value
Year (metric tons) Percent (thousand dollars)New Old Recycled Apparent recycled New Old Recycled Apparent
scrap 2/ scrap 3/ metal 4/ supply 5/ scrap scrap metal supply 6/ALUMINUM 7/
1990 1,030,000 1,360,000 2,390,000 6,300,000 38 $1,690,000 $2,220,000 $3,910,000 $10,300,0001991 969,000 1,320,000 2,290,000 6,010,000 38 1,270,000 1,730,000 3,000,000 7,880,0001992 1,140,000 1,610,000 2,760,000 6,870,000 40 1,450,000 2,040,000 3,500,000 8,710,0001993 1,310,000 1,630,000 2,940,000 7,920,000 r/ 37 1,540,000 1,920,000 3,460,000 9,300,000 r/1994 1,580,000 1,500,000 3,080,000 8,460,000 36 2,480,000 2,360,000 4,840,000 13,300,000
COPPER 8/1990 774,000 537,000 1,310,000 2,920,000 44.8 2,100,000 1,460,000 3,560,000 7,940,0001991 682,000 518,000 1,200,000 2,730,000 44.0 1,650,000 1,250,000 2,890,000 6,580,0001992 723,000 555,000 1,280,000 3,030,000 42.2 1,710,000 1,310,000 3,030,000 7,170,0001993 748,000 543,000 1,290,000 3,260,000 39.6 1,510,000 1,100,000 2,610,000 6,590,0001994 827,000 500,000 1,330,000 3,500,000 37.9 2,030,000 1,230,000 3,250,000 8,580,000
LEAD 9/1990 48,100 874,000 922,000 1,350,000 68.5 48,800 887,000 936,000 1,360,0001991 55,000 830,000 885,000 1,280,000 68.9 40,600 612,000 653,000 947,0001992 55,400 861,000 916,000 1,330,000 69.1 42,900 666,000 709,000 1,030,0001993 55,000 r/ 838,000 r/ 893,000 r/ 1,380,000 r/ 64.7 r/ 38,500 587,000 625,000 966,0001994 55,100 858,000 913,000 1,460,000 62.3 45,200 703,000 748,000 1,200,000
NICKEL 10/1990 -- -- 57,400 170,000 33.74 -- -- 509,000 1,510,0001991 -- -- 53,500 157,000 34.16 -- -- 436,000 1,280,0001992 -- -- 55,900 159,000 35.06 -- -- 391,000 1,120,0001993 -- -- 54,000 159,000 34.34 -- -- 386,000 r/ 839,000 r/1994 NA NA 58,600 164,000 35.64 NA NA 371,000 1,040,000
TIN 11/1990 4,040 13,200 17,300 53,400 32 34,300 112,000 147,000 455,0001991 5,110 7,980 13,100 39,600 33 41,500 64,800 106,000 317,0001992 4,890 8,850 13,700 37,300 37 43,400 78,400 122,000 331,0001993 r/ 4,630 7,420 12,000 43,300 28 35,700 57,300 92,900 334,0001994 3,990 6,910 10,900 40,300 27 32,400 56,200 88,600 328,000
ZINC 12/1990 232,000 109,000 341,000 1,240,000 27.5 381,000 179,000 560,000 2,040,0001991 233,000 119,000 353,000 1,170,000 30.3 271,000 138,000 410,000 1,360,0001992 234,000 132,000 366,000 1,280,000 28.7 301,000 170,000 471,000 1,640,0001993 246,000 109,000 355,000 1,370,000 26.0 r/ 250,000 111,000 361,000 1,400,0001994 251,000 116,000 367,000 1,420,000 25.9 213,000 126,000 389,000 1,540,000r/ Revised. NA Not available. 1/ Previously published and 1994 data are rounded by the U.S. Bureau of Mines to three significant digits; may not add to totals shown.2/ New scrap is scrap that results from the manufacturing process, including metal and alloy production.3/ Old scrap is scrap that results from consumer products.4/ Recycled metal is metal recovered from new plus old scrap.5/ Apparent supply is production plus net imports plus stock changes. Production is primary production plus recycled metal. Net imports is imports minus exports. Apparent supply is calculated on a contained weight basis.6/ Same as apparent supply defined above but calculated on a monetary value basis.7/ Scrap quantity is the calculated metallic recovery from reported purchased new and old aluminum-based scrap, estimated for full industry coverage. Monetaryvalue is estimated based on average U.S. market price for primary aluminum metal ingot.8/ Monetary value of recovered copper for consumption is estimated as average annual refined copper prices.9/ Lead processors are segregated by primary and secondary producers. This segregation permits inclusion of stocks changes for secondary producers.Monetary value of scrap and apparent supply estimated upon average quoted price of common lead.10/ Nickel scrap is nickel contained in ferrous and nonferrous scrap receipts. Monetary value of scrap and apparent supply is estimated as average annual LME cash price of nickel cathode.11/ Monetary value estimate based on Platt's Metals Week (PMW) Tin Composite price. Reevaluation of the tin canvass in 1991 resulted in a substantiallowering of estimated old scrap. 12/ Monetary value based on average annual U.S. zinc metal price published in PMW; for 1990, the PMW average prices were based on U.S. or North AmericanProducers' High Grade zinc delivered prices and for 1991-94, the LME spot prices for Special High Grade zinc plus premiums based on market conditions.
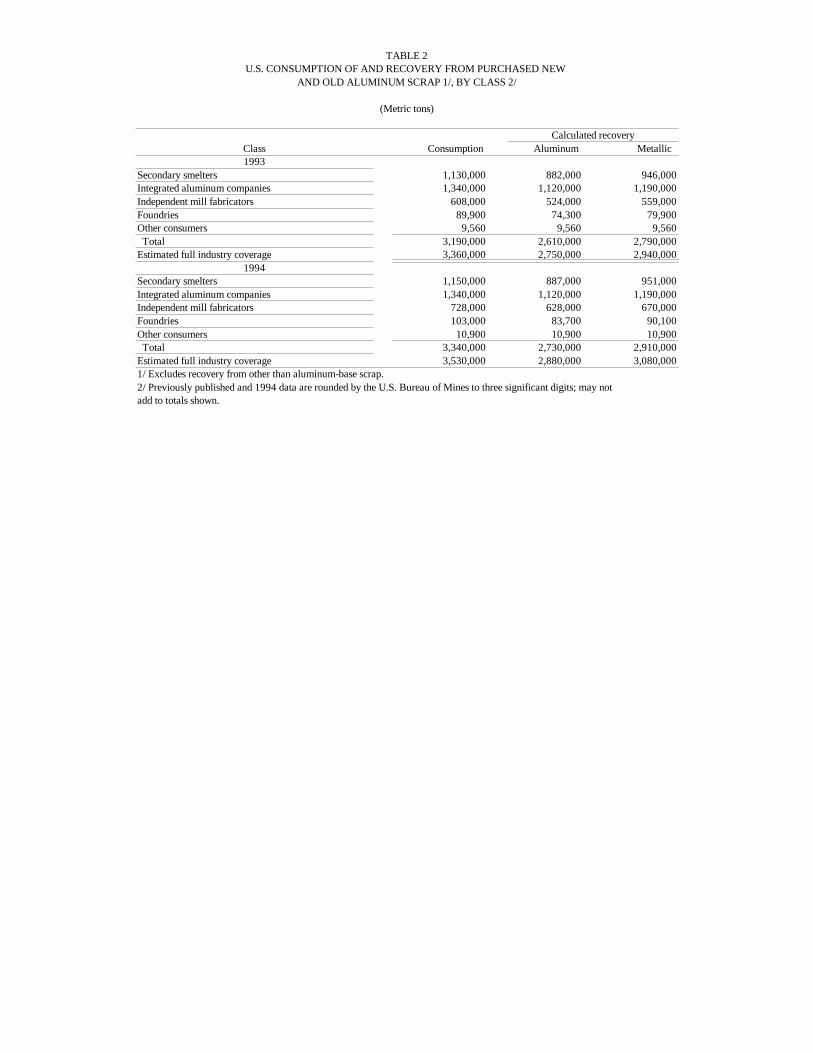
TABLE 2U.S. CONSUMPTION OF AND RECOVERY FROM PURCHASED NEW
AND OLD ALUMINUM SCRAP 1/, BY CLASS 2/
(Metric tons)
Calculated recoveryClass Consumption Aluminum Metallic 1993
Secondary smelters 1,130,000 882,000 946,000Integrated aluminum companies 1,340,000 1,120,000 1,190,000Independent mill fabricators 608,000 524,000 559,000Foundries 89,900 74,300 79,900Other consumers 9,560 9,560 9,560 Total 3,190,000 2,610,000 2,790,000Estimated full industry coverage 3,360,000 2,750,000 2,940,000
1994Secondary smelters 1,150,000 887,000 951,000Integrated aluminum companies 1,340,000 1,120,000 1,190,000Independent mill fabricators 728,000 628,000 670,000Foundries 103,000 83,700 90,100Other consumers 10,900 10,900 10,900 Total 3,340,000 2,730,000 2,910,000Estimated full industry coverage 3,530,000 2,880,000 3,080,0001/ Excludes recovery from other than aluminum-base scrap.2/ Previously published and 1994 data are rounded by the U.S. Bureau of Mines to three significant digits; may notadd to totals shown.

TABLE 3U.S. STOCKS, RECEIPTS, AND CONSUMPTION OF PURCHASED NEW AND OLD ALUMINUM
SCRAP 1/ AND SWEATED PIG IN 1994 2/
(Metric tons)
Stocks, Net Consump- Stocks,Class of consumer and type of scrap Jan. 1 receipts 3/ tion Dec. 31
Secondary smelters: New scrap: Solids 4,250 167,000 167,000 4,720 Borings and turnings 3,970 188,000 187,000 4,490 Dross and skimmings 5,200 150,000 152,000 3,000 Other 4/ 6,120 197,000 198,000 4,850 Total 19,500 702,000 705,000 17,100 Old scrap: Castings, sheet, clippings 15,000 294,000 292,000 16,800 Aluminum-copper radiators 1,100 9,060 9,340 816 Aluminum cans 5/ 1,470 r/ 101,000 100,000 1,680 Other 6/ 254 41,400 41,200 453 Total 17,800 r/ 445,000 443,000 19,700 Sweated pig 298 2,790 2,580 504 Total secondary smelters 37,600 1,150,000 1,150,000 37,300Integrated aluminum companies, foundries, independent mill fabricators, other consumers: New scrap: Solids 12,800 r/ 701,000 695,000 19,600 Borings and turnings 291 37,300 37,200 365 Dross and skimmings 14 13,600 13,500 89 Other 4/ 11,300 232,000 234,000 9,320 Total 24,400 r/ 984,000 979,000 29,400 Old scrap: Castings, sheet, clippings 7,490 380,000 378,000 9,080 Aluminum-copper radiators 163 2,610 2,400 371 Aluminum cans 10,700 815,000 803,000 22,600 Other 6/ 737 r/ 11,100 11,700 155 Total 19,100 1,210,000 1,200,000 32,300 Sweated pig 335 10,300 10,200 393 Total integrated aluminum companies, etc. 43,800 r/ 2,200,000 2,190,000 62,000All scrap consumed: New scrap: Solids 17,000 r/ 869,000 861,000 24,300 Borings and turnings 4,260 225,000 224,000 4,850 Dross and skimmings 5,220 164,000 166,000 3,090 Other 4/ 17,400 429,000 433,000 14,200 Total new scrap 43,900 r/ 1,690,000 1,680,000 46,400 Old scrap: Castings, sheet, clippings 22,400 674,000 671,000 25,900 Aluminum-copper radiators 1,260 11,700 11,700 1,190 Aluminum cans 12,100 916,000 904,000 24,300 Other 6/ 991 r/ 52,500 52,900 608 Total old scrap 36,800 1,650,000 1,640,000 52,000 Sweated pig 633 13,100 12,800 897 Total of all scrap consumed 81,400 r/ 3,350,000 3,340,000 99,300r/ Revised.1/ Data rounded by the U.S. Bureau of Mines to three significant digits; may not add to totals shown.2/ Includes imported scrap. According to reporting companies, 9.69% of total receipts of aluminum-base scrap, or 323,000 metric tons, was received on toll arrangements.3/ Includes inventory adjustment.4/ Includes data on foil, can stock clippings, and other miscellaneous.5/ Used beverage cans toll treated for primary producers are included in secondary smelter tabulation.6/ Includes municipal wastes (includes litter) and fragmentized scrap (auto shredder).
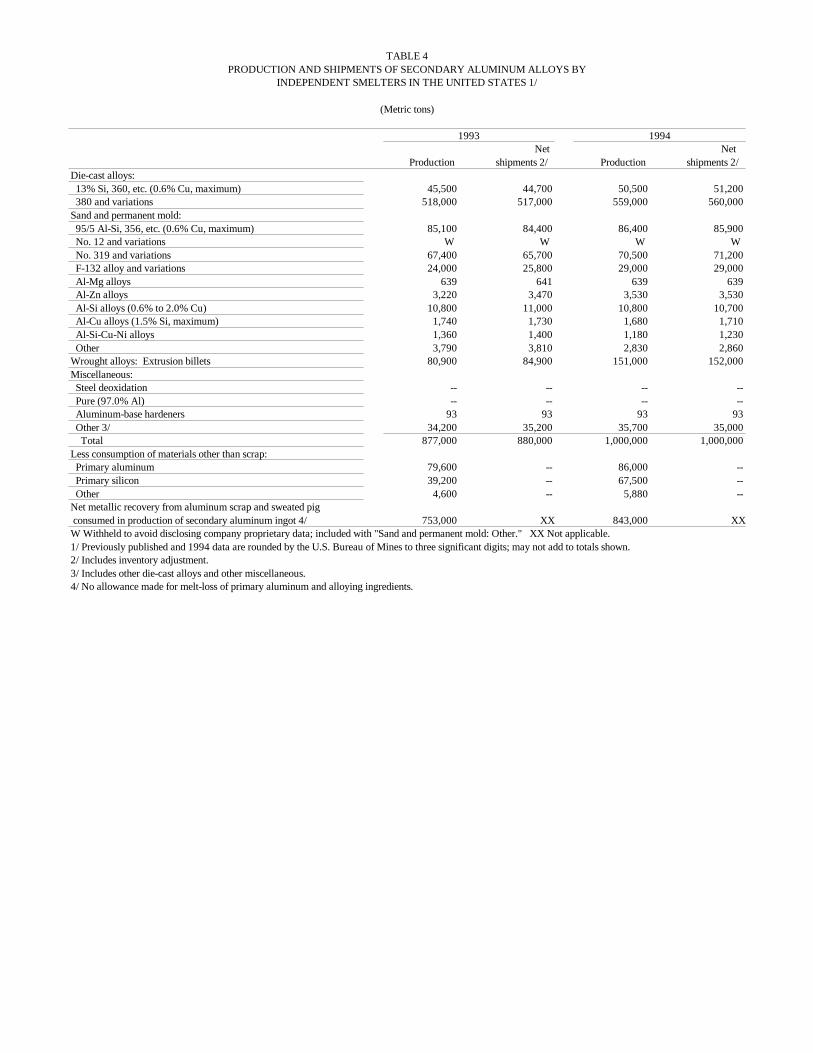
TABLE 4PRODUCTION AND SHIPMENTS OF SECONDARY ALUMINUM ALLOYS BY
INDEPENDENT SMELTERS IN THE UNITED STATES 1/
(Metric tons)
1993 1994Net Net
Production shipments 2/ Production shipments 2/ Die-cast alloys: 13% Si, 360, etc. (0.6% Cu, maximum) 45,500 44,700 50,500 51,200 380 and variations 518,000 517,000 559,000 560,000Sand and permanent mold: 95/5 Al-Si, 356, etc. (0.6% Cu, maximum) 85,100 84,400 86,400 85,900 No. 12 and variations W W W W No. 319 and variations 67,400 65,700 70,500 71,200 F-132 alloy and variations 24,000 25,800 29,000 29,000 Al-Mg alloys 639 641 639 639 Al-Zn alloys 3,220 3,470 3,530 3,530 Al-Si alloys (0.6% to 2.0% Cu) 10,800 11,000 10,800 10,700 Al-Cu alloys (1.5% Si, maximum) 1,740 1,730 1,680 1,710 Al-Si-Cu-Ni alloys 1,360 1,400 1,180 1,230 Other 3,790 3,810 2,830 2,860Wrought alloys: Extrusion billets 80,900 84,900 151,000 152,000Miscellaneous: Steel deoxidation -- -- -- -- Pure (97.0% Al) -- -- -- -- Aluminum-base hardeners 93 93 93 93 Other 3/ 34,200 35,200 35,700 35,000 Total 877,000 880,000 1,000,000 1,000,000Less consumption of materials other than scrap: Primary aluminum 79,600 -- 86,000 -- Primary silicon 39,200 -- 67,500 -- Other 4,600 -- 5,880 -- Net metallic recovery from aluminum scrap and sweated pig consumed in production of secondary aluminum ingot 4/ 753,000 XX 843,000 XXW Withheld to avoid disclosing company proprietary data; included with "Sand and permanent mold: Other." XX Not applicable.1/ Previously published and 1994 data are rounded by the U.S. Bureau of Mines to three significant digits; may not add to totals shown.2/ Includes inventory adjustment.3/ Includes other die-cast alloys and other miscellaneous.4/ No allowance made for melt-loss of primary aluminum and alloying ingredients.
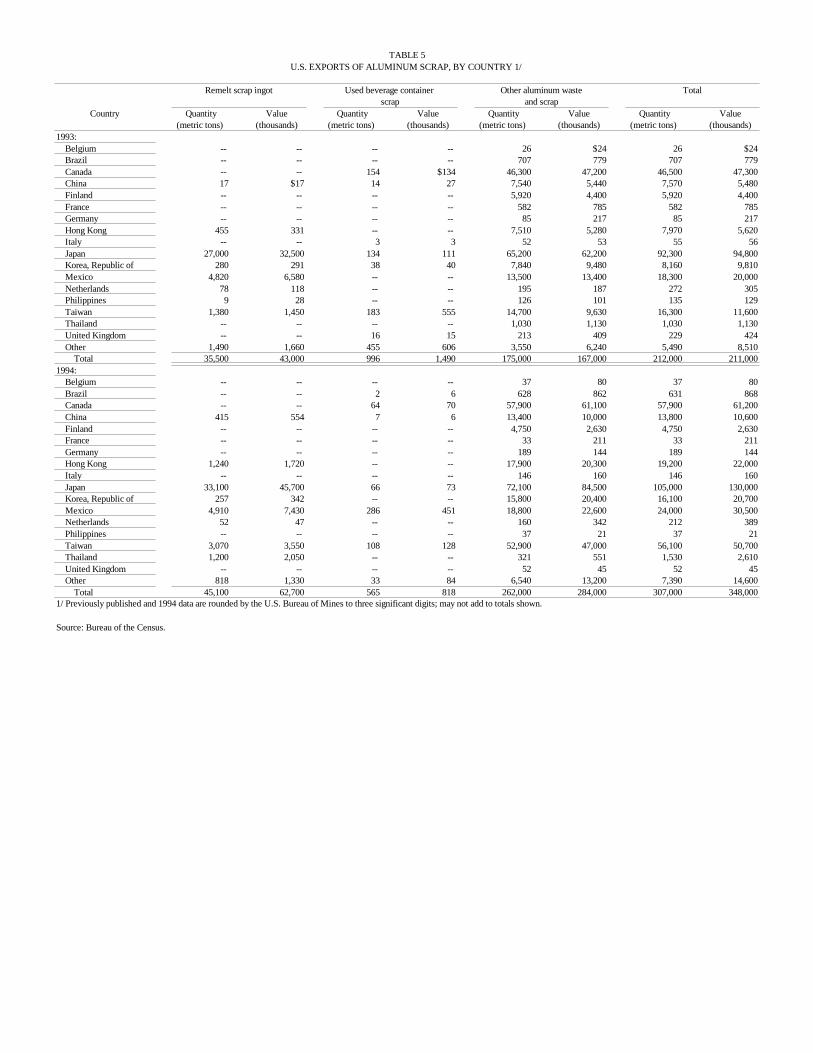
TABLE 5U.S. EXPORTS OF ALUMINUM SCRAP, BY COUNTRY 1/
Remelt scrap ingot Used beverage container Other aluminum waste Totalscrap and scrap
Country Quantity Value Quantity Value Quantity Value Quantity Value(metric tons) (thousands) (metric tons) (thousands) (metric tons) (thousands) (metric tons) (thousands)
1993: Belgium -- -- -- -- 26 $24 26 $24 Brazil -- -- -- -- 707 779 707 779 Canada -- -- 154 $134 46,300 47,200 46,500 47,300 China 17 $17 14 27 7,540 5,440 7,570 5,480 Finland -- -- -- -- 5,920 4,400 5,920 4,400 France -- -- -- -- 582 785 582 785 Germany -- -- -- -- 85 217 85 217 Hong Kong 455 331 -- -- 7,510 5,280 7,970 5,620 Italy -- -- 3 3 52 53 55 56 Japan 27,000 32,500 134 111 65,200 62,200 92,300 94,800 Korea, Republic of 280 291 38 40 7,840 9,480 8,160 9,810 Mexico 4,820 6,580 -- -- 13,500 13,400 18,300 20,000 Netherlands 78 118 -- -- 195 187 272 305 Philippines 9 28 -- -- 126 101 135 129 Taiwan 1,380 1,450 183 555 14,700 9,630 16,300 11,600 Thailand -- -- -- -- 1,030 1,130 1,030 1,130 United Kingdom -- -- 16 15 213 409 229 424 Other 1,490 1,660 455 606 3,550 6,240 5,490 8,510 Total 35,500 43,000 996 1,490 175,000 167,000 212,000 211,0001994: Belgium -- -- -- -- 37 80 37 80 Brazil -- -- 2 6 628 862 631 868 Canada -- -- 64 70 57,900 61,100 57,900 61,200 China 415 554 7 6 13,400 10,000 13,800 10,600 Finland -- -- -- -- 4,750 2,630 4,750 2,630 France -- -- -- -- 33 211 33 211 Germany -- -- -- -- 189 144 189 144 Hong Kong 1,240 1,720 -- -- 17,900 20,300 19,200 22,000 Italy -- -- -- -- 146 160 146 160 Japan 33,100 45,700 66 73 72,100 84,500 105,000 130,000 Korea, Republic of 257 342 -- -- 15,800 20,400 16,100 20,700 Mexico 4,910 7,430 286 451 18,800 22,600 24,000 30,500 Netherlands 52 47 -- -- 160 342 212 389 Philippines -- -- -- -- 37 21 37 21 Taiwan 3,070 3,550 108 128 52,900 47,000 56,100 50,700 Thailand 1,200 2,050 -- -- 321 551 1,530 2,610 United Kingdom -- -- -- -- 52 45 52 45 Other 818 1,330 33 84 6,540 13,200 7,390 14,600 Total 45,100 62,700 565 818 262,000 284,000 307,000 348,0001/ Previously published and 1994 data are rounded by the U.S. Bureau of Mines to three significant digits; may not add to totals shown.
Source: Bureau of the Census.
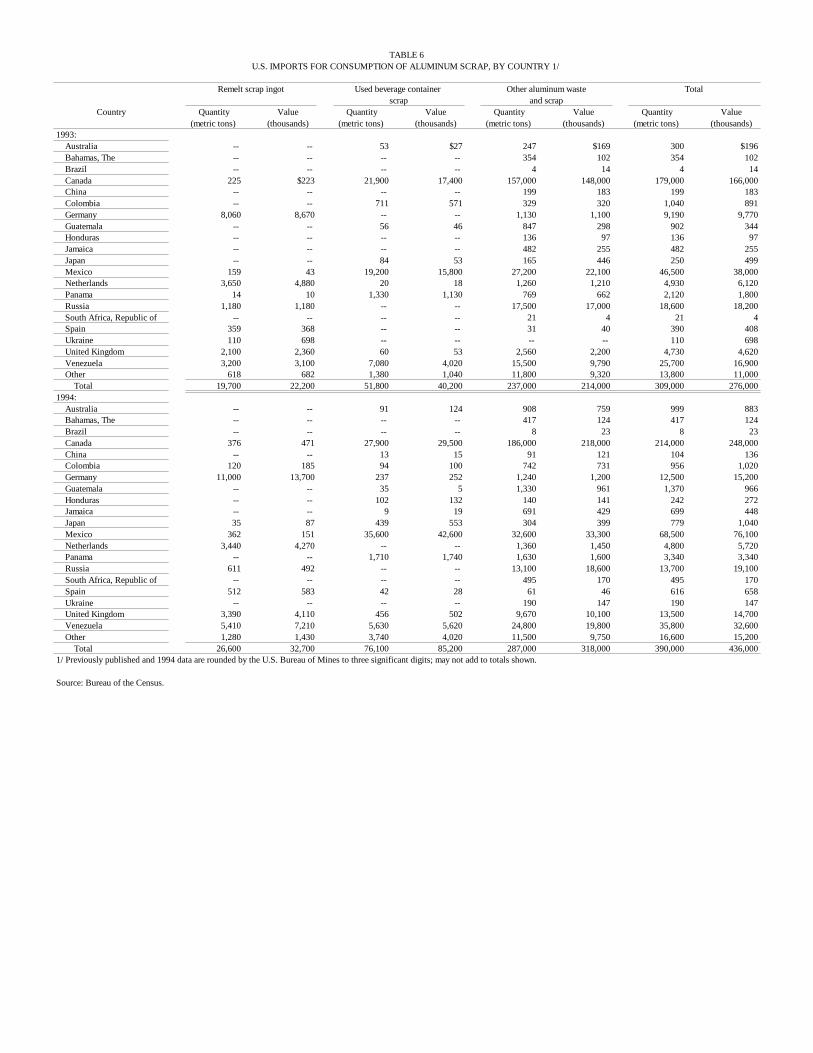
TABLE 6U.S. IMPORTS FOR CONSUMPTION OF ALUMINUM SCRAP, BY COUNTRY 1/
Remelt scrap ingot Used beverage container Other aluminum waste Totalscrap and scrap
Country Quantity Value Quantity Value Quantity Value Quantity Value(metric tons) (thousands) (metric tons) (thousands) (metric tons) (thousands) (metric tons) (thousands)
1993: Australia -- -- 53 $27 247 $169 300 $196 Bahamas, The -- -- -- -- 354 102 354 102 Brazil -- -- -- -- 4 14 4 14 Canada 225 $223 21,900 17,400 157,000 148,000 179,000 166,000 China -- -- -- -- 199 183 199 183 Colombia -- -- 711 571 329 320 1,040 891 Germany 8,060 8,670 -- -- 1,130 1,100 9,190 9,770 Guatemala -- -- 56 46 847 298 902 344 Honduras -- -- -- -- 136 97 136 97 Jamaica -- -- -- -- 482 255 482 255 Japan -- -- 84 53 165 446 250 499 Mexico 159 43 19,200 15,800 27,200 22,100 46,500 38,000 Netherlands 3,650 4,880 20 18 1,260 1,210 4,930 6,120 Panama 14 10 1,330 1,130 769 662 2,120 1,800 Russia 1,180 1,180 -- -- 17,500 17,000 18,600 18,200 South Africa, Republic of -- -- -- -- 21 4 21 4 Spain 359 368 -- -- 31 40 390 408 Ukraine 110 698 -- -- -- -- 110 698 United Kingdom 2,100 2,360 60 53 2,560 2,200 4,730 4,620 Venezuela 3,200 3,100 7,080 4,020 15,500 9,790 25,700 16,900 Other 618 682 1,380 1,040 11,800 9,320 13,800 11,000 Total 19,700 22,200 51,800 40,200 237,000 214,000 309,000 276,0001994: Australia -- -- 91 124 908 759 999 883 Bahamas, The -- -- -- -- 417 124 417 124 Brazil -- -- -- -- 8 23 8 23 Canada 376 471 27,900 29,500 186,000 218,000 214,000 248,000 China -- -- 13 15 91 121 104 136 Colombia 120 185 94 100 742 731 956 1,020 Germany 11,000 13,700 237 252 1,240 1,200 12,500 15,200 Guatemala -- -- 35 5 1,330 961 1,370 966 Honduras -- -- 102 132 140 141 242 272 Jamaica -- -- 9 19 691 429 699 448 Japan 35 87 439 553 304 399 779 1,040 Mexico 362 151 35,600 42,600 32,600 33,300 68,500 76,100 Netherlands 3,440 4,270 -- -- 1,360 1,450 4,800 5,720 Panama -- -- 1,710 1,740 1,630 1,600 3,340 3,340 Russia 611 492 -- -- 13,100 18,600 13,700 19,100 South Africa, Republic of -- -- -- -- 495 170 495 170 Spain 512 583 42 28 61 46 616 658 Ukraine -- -- -- -- 190 147 190 147 United Kingdom 3,390 4,110 456 502 9,670 10,100 13,500 14,700 Venezuela 5,410 7,210 5,630 5,620 24,800 19,800 35,800 32,600 Other 1,280 1,430 3,740 4,020 11,500 9,750 16,600 15,200 Total 26,600 32,700 76,100 85,200 287,000 318,000 390,000 436,0001/ Previously published and 1994 data are rounded by the U.S. Bureau of Mines to three significant digits; may not add to totals shown.
Source: Bureau of the Census.
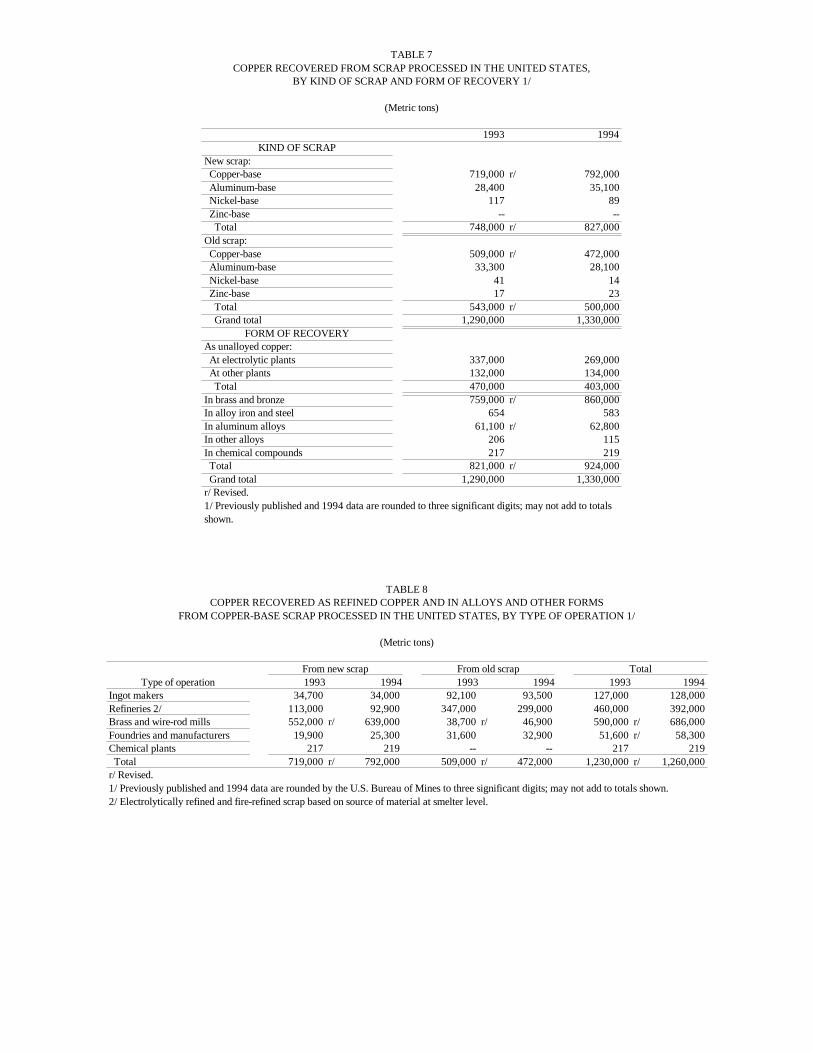
TABLE 7COPPER RECOVERED FROM SCRAP PROCESSED IN THE UNITED STATES,
BY KIND OF SCRAP AND FORM OF RECOVERY 1/
(Metric tons)
1993 1994 KIND OF SCRAP
New scrap: Copper-base 719,000 r/ 792,000 Aluminum-base 28,400 35,100 Nickel-base 117 89 Zinc-base -- -- Total 748,000 r/ 827,000Old scrap: Copper-base 509,000 r/ 472,000 Aluminum-base 33,300 28,100 Nickel-base 41 14 Zinc-base 17 23 Total 543,000 r/ 500,000 Grand total 1,290,000 1,330,000
FORM OF RECOVERYAs unalloyed copper: At electrolytic plants 337,000 269,000 At other plants 132,000 134,000 Total 470,000 403,000In brass and bronze 759,000 r/ 860,000In alloy iron and steel 654 583In aluminum alloys 61,100 r/ 62,800In other alloys 206 115In chemical compounds 217 219 Total 821,000 r/ 924,000 Grand total 1,290,000 1,330,000r/ Revised.1/ Previously published and 1994 data are rounded to three significant digits; may not add to totalsshown.
TABLE 8COPPER RECOVERED AS REFINED COPPER AND IN ALLOYS AND OTHER FORMS
FROM COPPER-BASE SCRAP PROCESSED IN THE UNITED STATES, BY TYPE OF OPERATION 1/
(Metric tons)
From new scrap From old scrap TotalType of operation 1993 1994 1993 1994 1993 1994
Ingot makers 34,700 34,000 92,100 93,500 127,000 128,000Refineries 2/ 113,000 92,900 347,000 299,000 460,000 392,000Brass and wire-rod mills 552,000 r/ 639,000 38,700 r/ 46,900 590,000 r/ 686,000Foundries and manufacturers 19,900 25,300 31,600 32,900 51,600 r/ 58,300Chemical plants 217 219 -- -- 217 219 Total 719,000 r/ 792,000 509,000 r/ 472,000 1,230,000 r/ 1,260,000r/ Revised.1/ Previously published and 1994 data are rounded by the U.S. Bureau of Mines to three significant digits; may not add to totals shown.2/ Electrolytically refined and fire-refined scrap based on source of material at smelter level.

TABLE 9PRODUCTION OF SECONDARY COPPER AND COPPER-ALLOY PRODUCTS
IN THE UNITED STATES, BY ITEM PRODUCED FROM SCRAP 1/
(Metric tons)
Item produced from scrap 1993 1994 Unalloyed copper products
Electrolytically refined copper 337,000 269,000Fire-refined copper 123,000 122,000Copper powder 9,180 10,600Copper castings 631 697 Total 470,000 403,000
Alloyed copper productsBrass and bronze ingots: Tin bronzes 15,200 14,800 Leaded red brass and semi-red brass 91,400 95,400 High leaded tin bronze 10,100 11,300 Yellow brass 7,420 8,290 Manganese bronze 6,760 7,500 Aluminum bronze 7,930 8,070 Nickel silver 2,230 3,070 Silicon bronze and brass 7,080 7,630 Copper-base hardeners and master alloys 7,860 9,680 Miscellaneous 5,440 1,360 Total 161,000 167,000Brass mill and wire rod mill products 733,000 849,000Brass and bronze castings 43,900 49,000Brass powder 263 342Copper in chemical products 217 219 Grand total 1,410,000 1,470,0001/ Previously published and 1994 data are rounded by the U.S. Bureau of Mines to threesignificant digits; may not add to totals shown.
TABLE 10COMPOSITION OF SECONDARY COPPER-ALLOY PRODUCTION IN THE UNITED STATES 1/
(Metric tons)
Copper Tin Lead Zinc Nickel Aluminum Total Brass and bronze ingot production: 2/ 1993 131,000 4,850 r/ 8,230 r/ 17,300 319 42 161,000 1994 135,000 4,850 8,300 18,200 244 35 167,000Secondary metal content of brass mill products: 1993 590,000 612 6,050 134,000 W W 733,000 1994 686,000 882 6,730 152,000 W W 849,000Secondary metal content of brass and bronze castings: 1993 38,900 837 1,420 2,460 78 138 43,900 1994 43,800 1,000 1,460 2,480 110 131 49,000r/ Revised. W Withheld to avoid disclosing company proprietary data; included in "Total."1/ Previously published and 1994 data are rounded by the U.S. Bureau of Mines to three significant digits; may not add to totals shown.2/ About 96% from scrap and 4% from other than scrap in 1993 and in 1994.
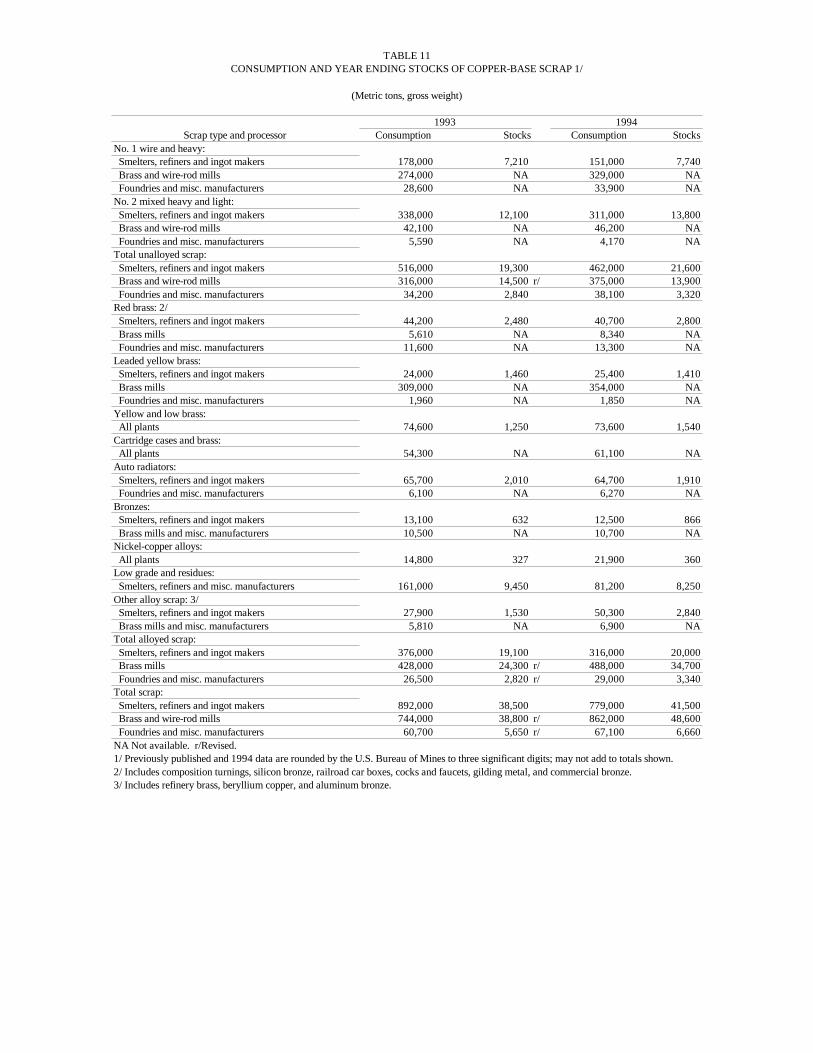
TABLE 11CONSUMPTION AND YEAR ENDING STOCKS OF COPPER-BASE SCRAP 1/
(Metric tons, gross weight)
1993 1994Scrap type and processor Consumption Stocks Consumption Stocks
No. 1 wire and heavy: Smelters, refiners and ingot makers 178,000 7,210 151,000 7,740 Brass and wire-rod mills 274,000 NA 329,000 NA Foundries and misc. manufacturers 28,600 NA 33,900 NA No. 2 mixed heavy and light: Smelters, refiners and ingot makers 338,000 12,100 311,000 13,800 Brass and wire-rod mills 42,100 NA 46,200 NA Foundries and misc. manufacturers 5,590 NA 4,170 NA Total unalloyed scrap: Smelters, refiners and ingot makers 516,000 19,300 462,000 21,600 Brass and wire-rod mills 316,000 14,500 r/ 375,000 13,900 Foundries and misc. manufacturers 34,200 2,840 38,100 3,320Red brass: 2/ Smelters, refiners and ingot makers 44,200 2,480 40,700 2,800 Brass mills 5,610 NA 8,340 NA Foundries and misc. manufacturers 11,600 NA 13,300 NA Leaded yellow brass: Smelters, refiners and ingot makers 24,000 1,460 25,400 1,410 Brass mills 309,000 NA 354,000 NA Foundries and misc. manufacturers 1,960 NA 1,850 NA Yellow and low brass: All plants 74,600 1,250 73,600 1,540Cartridge cases and brass: All plants 54,300 NA 61,100 NA Auto radiators: Smelters, refiners and ingot makers 65,700 2,010 64,700 1,910 Foundries and misc. manufacturers 6,100 NA 6,270 NA Bronzes: Smelters, refiners and ingot makers 13,100 632 12,500 866 Brass mills and misc. manufacturers 10,500 NA 10,700 NA Nickel-copper alloys: All plants 14,800 327 21,900 360Low grade and residues: Smelters, refiners and misc. manufacturers 161,000 9,450 81,200 8,250Other alloy scrap: 3/ Smelters, refiners and ingot makers 27,900 1,530 50,300 2,840 Brass mills and misc. manufacturers 5,810 NA 6,900 NA Total alloyed scrap: Smelters, refiners and ingot makers 376,000 19,100 316,000 20,000 Brass mills 428,000 24,300 r/ 488,000 34,700 Foundries and misc. manufacturers 26,500 2,820 r/ 29,000 3,340Total scrap: Smelters, refiners and ingot makers 892,000 38,500 779,000 41,500 Brass and wire-rod mills 744,000 38,800 r/ 862,000 48,600 Foundries and misc. manufacturers 60,700 5,650 r/ 67,100 6,660NA Not available. r/Revised.1/ Previously published and 1994 data are rounded by the U.S. Bureau of Mines to three significant digits; may not add to totals shown.2/ Includes composition turnings, silicon bronze, railroad car boxes, cocks and faucets, gilding metal, and commercial bronze.3/ Includes refinery brass, beryllium copper, and aluminum bronze.
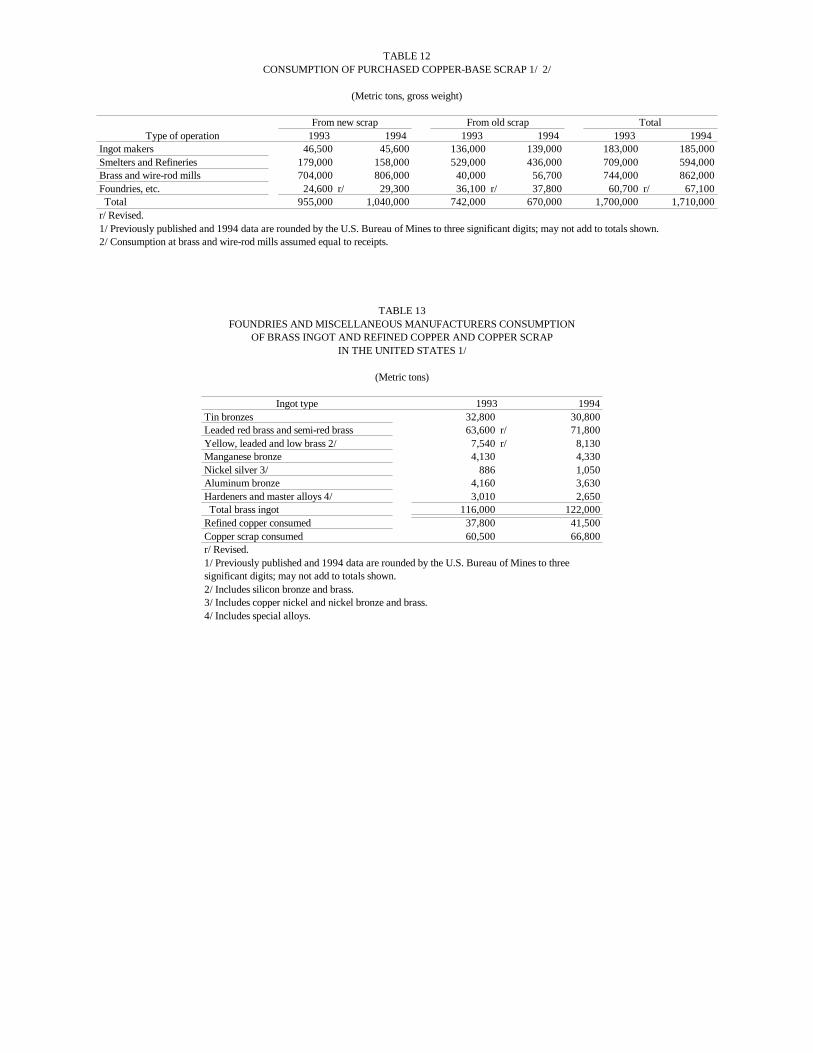
TABLE 12CONSUMPTION OF PURCHASED COPPER-BASE SCRAP 1/ 2/
(Metric tons, gross weight)
From new scrap From old scrap TotalType of operation 1993 1994 1993 1994 1993 1994
Ingot makers 46,500 45,600 136,000 139,000 183,000 185,000Smelters and Refineries 179,000 158,000 529,000 436,000 709,000 594,000Brass and wire-rod mills 704,000 806,000 40,000 56,700 744,000 862,000Foundries, etc. 24,600 r/ 29,300 36,100 r/ 37,800 60,700 r/ 67,100 Total 955,000 1,040,000 742,000 670,000 1,700,000 1,710,000r/ Revised.1/ Previously published and 1994 data are rounded by the U.S. Bureau of Mines to three significant digits; may not add to totals shown.2/ Consumption at brass and wire-rod mills assumed equal to receipts.
TABLE 13FOUNDRIES AND MISCELLANEOUS MANUFACTURERS CONSUMPTION
OF BRASS INGOT AND REFINED COPPER AND COPPER SCRAPIN THE UNITED STATES 1/
(Metric tons)
Ingot type 1993 1994 Tin bronzes 32,800 30,800Leaded red brass and semi-red brass 63,600 r/ 71,800Yellow, leaded and low brass 2/ 7,540 r/ 8,130Manganese bronze 4,130 4,330Nickel silver 3/ 886 1,050Aluminum bronze 4,160 3,630Hardeners and master alloys 4/ 3,010 2,650 Total brass ingot 116,000 122,000Refined copper consumed 37,800 41,500Copper scrap consumed 60,500 66,800r/ Revised.1/ Previously published and 1994 data are rounded by the U.S. Bureau of Mines to threesignificant digits; may not add to totals shown.2/ Includes silicon bronze and brass.3/ Includes copper nickel and nickel bronze and brass.4/ Includes special alloys.

TABLE 14AVERAGE PRICES FOR COPPER SCRAP AND ALLOY-INGOT, BY TYPE
(Cents per pound)
Dealers' buying (New York) Alloy-ingot (New York)Year Brass mills Refiners No. 2 Red brass turnings No. 115 brass Yellow brass
No. 1 scrap No. 2 scrap scrap and borings (85-5-5-5) (405) 1993 81.28 69.65 r/ 63.84 45.22 120.25 r/ 116.92 r/1994 100.83 85.15 69.83 47.45 121.50 118.54r/ Revised.
Source: American Metal Market.
TABLE 15U.S. EXPORTS OF COPPER SCRAP, BY COUNTRY 1/
Unalloyed copper scrap Copper-alloy scrap
1993 1994 1993 1994Country or Territory Quantity Value Quantity Value Quantity Value Quantity Value
(metric tons) (thousands) (metric tons) (thousands) (metric tons) (thousands) (metric tons) (thousands) Belgium 3,130 $1,400 1,130 $1,330 800 $2,500 4,060 $9,550Canada 42,800 39,300 73,700 98,700 11,400 20,300 23,200 37,500China 13,200 12,400 19,100 21,900 41,100 26,700 58,200 43,100Germany 294 322 157 167 974 1,960 5,820 6,000Hong Kong 10,000 7,690 13,700 12,900 4,230 4,050 10,100 7,590India 690 695 1,830 1,700 39,400 30,100 59,700 42,000Italy 231 278 445 818 124 147 3,810 5,480Japan 25,300 44,000 19,700 39,100 17,900 28,900 14,600 47,100Korea, Republic of 10,400 16,300 8,680 16,400 26,000 29,100 18,400 21,700Mexico 430 459 177 194 724 925 1,320 2,400Singapore 1,180 844 451 580 862 974 477 615Spain -- -- -- -- 4 10 6,100 975Sweden -- -- -- -- 645 1,230 681 1,350Taiwan 1,080 759 1,420 2,090 4,400 2,190 4,040 3,870Thailand 160 336 40 50 963 1,560 1,730 2,080United Kingdom 102 110 41 61 761 492 1,380 3,040Other 778 r/ 1,180 r/ 1,160 1,440 2,030 r/ 2,500 r/ 3,890 5,690 Total 110,000 126,000 142,000 197,000 152,000 154,000 218,000 240,000r/ Revised.1/ Previously published and 1994 data are rounded by the U.S. Bureau of Mines to three significant digits; may not add to totals shown.
Source: Bureau of the Census.
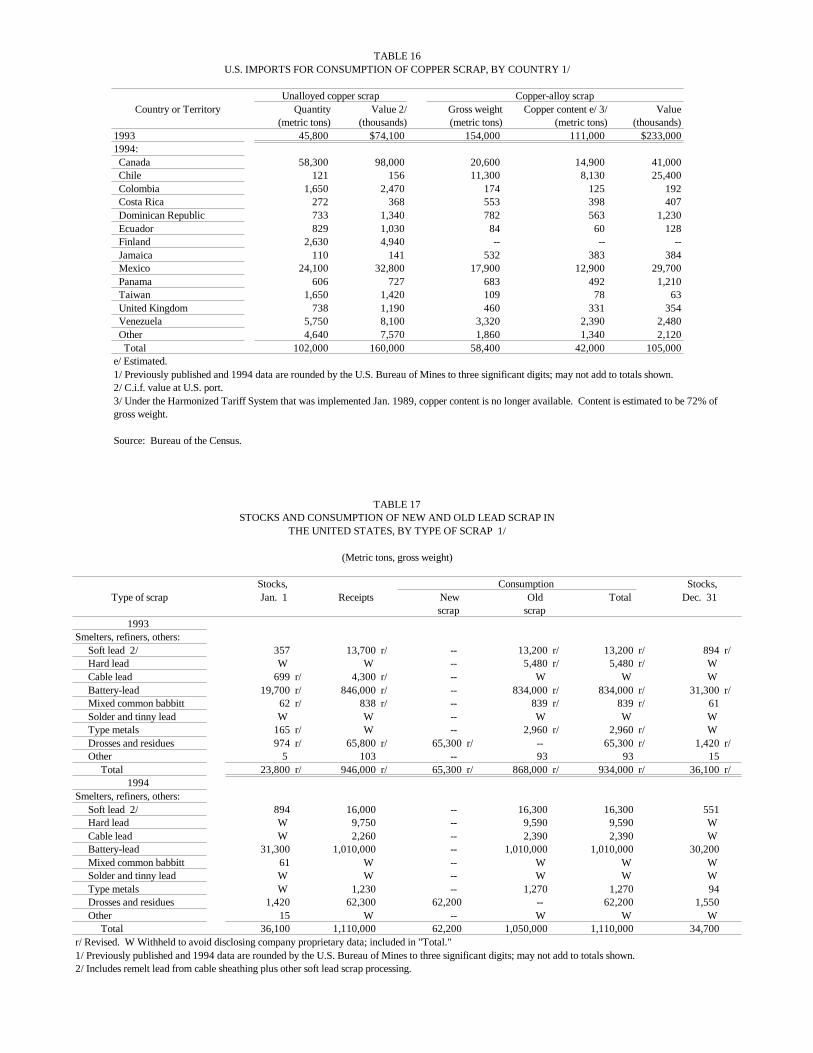
TABLE 16U.S. IMPORTS FOR CONSUMPTION OF COPPER SCRAP, BY COUNTRY 1/
Unalloyed copper scrap Copper-alloy scrapCountry or Territory Quantity Value 2/ Gross weight Copper content e/ 3/ Value
(metric tons) (thousands) (metric tons) (metric tons) (thousands) 1993 45,800 $74,100 154,000 111,000 $233,0001994: Canada 58,300 98,000 20,600 14,900 41,000 Chile 121 156 11,300 8,130 25,400 Colombia 1,650 2,470 174 125 192 Costa Rica 272 368 553 398 407 Dominican Republic 733 1,340 782 563 1,230 Ecuador 829 1,030 84 60 128 Finland 2,630 4,940 -- -- -- Jamaica 110 141 532 383 384 Mexico 24,100 32,800 17,900 12,900 29,700 Panama 606 727 683 492 1,210 Taiwan 1,650 1,420 109 78 63 United Kingdom 738 1,190 460 331 354 Venezuela 5,750 8,100 3,320 2,390 2,480 Other 4,640 7,570 1,860 1,340 2,120 Total 102,000 160,000 58,400 42,000 105,000e/ Estimated.1/ Previously published and 1994 data are rounded by the U.S. Bureau of Mines to three significant digits; may not add to totals shown.2/ C.i.f. value at U.S. port.3/ Under the Harmonized Tariff System that was implemented Jan. 1989, copper content is no longer available. Content is estimated to be 72% ofgross weight.
Source: Bureau of the Census.
TABLE 17STOCKS AND CONSUMPTION OF NEW AND OLD LEAD SCRAP IN
THE UNITED STATES, BY TYPE OF SCRAP 1/
(Metric tons, gross weight)
Stocks, Consumption Stocks,Type of scrap Jan. 1 Receipts New Old Total Dec. 31
scrap scrap1993
Smelters, refiners, others: Soft lead 2/ 357 13,700 r/ -- 13,200 r/ 13,200 r/ 894 r/ Hard lead W W -- 5,480 r/ 5,480 r/ W Cable lead 699 r/ 4,300 r/ -- W W W Battery-lead 19,700 r/ 846,000 r/ -- 834,000 r/ 834,000 r/ 31,300 r/ Mixed common babbitt 62 r/ 838 r/ -- 839 r/ 839 r/ 61 Solder and tinny lead W W -- W W W Type metals 165 r/ W -- 2,960 r/ 2,960 r/ W Drosses and residues 974 r/ 65,800 r/ 65,300 r/ -- 65,300 r/ 1,420 r/ Other 5 103 -- 93 93 15 Total 23,800 r/ 946,000 r/ 65,300 r/ 868,000 r/ 934,000 r/ 36,100 r/
1994Smelters, refiners, others: Soft lead 2/ 894 16,000 -- 16,300 16,300 551 Hard lead W 9,750 -- 9,590 9,590 W Cable lead W 2,260 -- 2,390 2,390 W Battery-lead 31,300 1,010,000 -- 1,010,000 1,010,000 30,200 Mixed common babbitt 61 W -- W W W Solder and tinny lead W W -- W W W Type metals W 1,230 -- 1,270 1,270 94 Drosses and residues 1,420 62,300 62,200 -- 62,200 1,550 Other 15 W -- W W W Total 36,100 1,110,000 62,200 1,050,000 1,110,000 34,700r/ Revised. W Withheld to avoid disclosing company proprietary data; included in "Total."1/ Previously published and 1994 data are rounded by the U.S. Bureau of Mines to three significant digits; may not add to totals shown.2/ Includes remelt lead from cable sheathing plus other soft lead scrap processing.
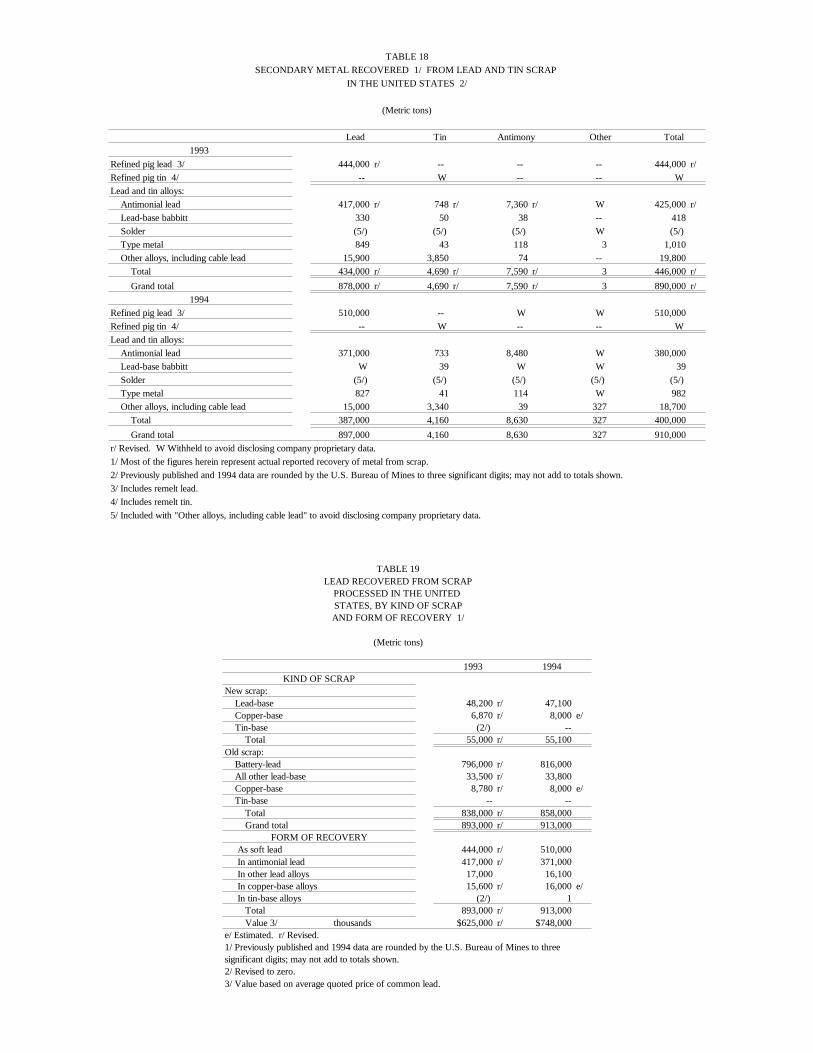
TABLE 18SECONDARY METAL RECOVERED 1/ FROM LEAD AND TIN SCRAP
IN THE UNITED STATES 2/
(Metric tons)
Lead Tin Antimony Other Total1993
Refined pig lead 3/ 444,000 r/ -- -- -- 444,000 r/Refined pig tin 4/ -- W -- -- WLead and tin alloys: Antimonial lead 417,000 r/ 748 r/ 7,360 r/ W 425,000 r/ Lead-base babbitt 330 50 38 -- 418 Solder (5/) (5/) (5/) W (5/) Type metal 849 43 118 3 1,010 Other alloys, including cable lead 15,900 3,850 74 -- 19,800 Total 434,000 r/ 4,690 r/ 7,590 r/ 3 446,000 r/ Grand total 878,000 r/ 4,690 r/ 7,590 r/ 3 890,000 r/
1994Refined pig lead 3/ 510,000 -- W W 510,000Refined pig tin 4/ -- W -- -- WLead and tin alloys: Antimonial lead 371,000 733 8,480 W 380,000 Lead-base babbitt W 39 W W 39 Solder (5/) (5/) (5/) (5/) (5/) Type metal 827 41 114 W 982 Other alloys, including cable lead 15,000 3,340 39 327 18,700 Total 387,000 4,160 8,630 327 400,000 Grand total 897,000 4,160 8,630 327 910,000r/ Revised. W Withheld to avoid disclosing company proprietary data.1/ Most of the figures herein represent actual reported recovery of metal from scrap. 2/ Previously published and 1994 data are rounded by the U.S. Bureau of Mines to three significant digits; may not add to totals shown.3/ Includes remelt lead.4/ Includes remelt tin.5/ Included with "Other alloys, including cable lead" to avoid disclosing company proprietary data.
TABLE 19LEAD RECOVERED FROM SCRAP
PROCESSED IN THE UNITED STATES, BY KIND OF SCRAPAND FORM OF RECOVERY 1/
(Metric tons)
1993 1994KIND OF SCRAP
New scrap: Lead-base 48,200 r/ 47,100 Copper-base 6,870 r/ 8,000 e/ Tin-base (2/) -- Total 55,000 r/ 55,100Old scrap: Battery-lead 796,000 r/ 816,000 All other lead-base 33,500 r/ 33,800 Copper-base 8,780 r/ 8,000 e/ Tin-base -- -- Total 838,000 r/ 858,000 Grand total 893,000 r/ 913,000
FORM OF RECOVERY As soft lead 444,000 r/ 510,000 In antimonial lead 417,000 r/ 371,000 In other lead alloys 17,000 16,100 In copper-base alloys 15,600 r/ 16,000 e/ In tin-base alloys (2/) 1 Total 893,000 r/ 913,000 Value 3/ thousands $625,000 r/ $748,000e/ Estimated. r/ Revised.1/ Previously published and 1994 data are rounded by the U.S. Bureau of Mines to threesignificant digits; may not add to totals shown.2/ Revised to zero.3/ Value based on average quoted price of common lead.

TABLE 20U.S. EXPORTS AND IMPORTS FOR CONSUMPTION OF LEAD SCRAP, BY COUNTRY 1/
1993 1994Country Quantity Value Quantity Value
(metric tons) (thousands) (metric tons) (thousands)EXPORTS
Scrap (gross weight): Antigua and Barbuda 1 $20 91 $16 Bahamas, The 119 54 (2/) 27 Belgium 30 3 22 64 Brazil 4,680 643 4,110 936 Canada 38,700 6,840 68,400 13,000 Cayman Islands -- -- 100 10 China 1,550 372 458 288 Colombia 452 84 15 320 Costa Rica 30 24 558 208 Germany 105 35 15 119 Hong Kong 656 323 49 19 India 970 237 941 156 Jamaica -- -- 34 3 Japan 520 511 127 321 Korea, Republic of 2,680 3,000 9,440 6,070 Malaysia 134 59 -- -- Mexico 2,030 1,010 903 1,140 Panama -- -- 137 37 Philippines 107 42 -- -- Russia -- -- 34 78 Singapore 1 66 782 292 Spain 26 15 -- -- Taiwan 522 149 250 113 Thailand 189 23 (2/) 3 United Arab Emirates 39 4 268 27 United Kingdom 457 219 903 292 Venezuela 4 80 315 83 Other 113 r/ 622 r/ 143 864 Total 54,100 14,400 88,100 24,500
IMPORTSReclaimed scrap, including ash and residues (lead content): 3/ Canada 58 29 128 39 Other 19 r/ 11 16 40 Total 78 r/ 39 144 80r/ Revised.1/ Previously published and 1994 data are rounded by the U.S. Bureau of Mines to three significant digits; may not add to totals shown.2/ Less than 1/2 unit.3/ Also includes other lead-bearing materials containing greater than 10% by weight of copper, lead, or zinc (any one).
Source: Bureau of the Census.
TABLE 21TIN RECOVERED FROM SCRAP PROCESSED IN
THE UNITED STATES, BY FORM OF RECOVERY 1/
(Metric tons unless otherwise specified)
Form of recovery 1993 1994Tin metal 2/ W WBronze and brass e/ 3/ 10,300 r/ 10,800Lead and tin alloys: Antimonial lead 748 r/ 733 Babbitt 51 W Type metal 43 41 Other alloys 4/ (5/) (5/) Total 842 r/ 774Tin content of chemical products W W Grand total 11,100 r/ 11,600 Value (thousands) e/ 6/ $85,900 r/ $94,000e/ Estimated. r/ Revised. W Withheld to avoid disclosing company proprietarydata; not included in "Grand total."1/ Previously published and 1994 data are rounded by the U.S. Bureau ofMines to three significant digits; may not add to totals shown.2/ Includes tin metal recovered at detinning and other plants.3/ Includes tin recovered from copper-, lead-, and tin-base scrap.4/ Includes foil, solder, terne metal, and cable lead.5/ Withheld to avoid disclosing company proprietary data; not included in"Total."6/ Based on Platt's Metals Week composite price.
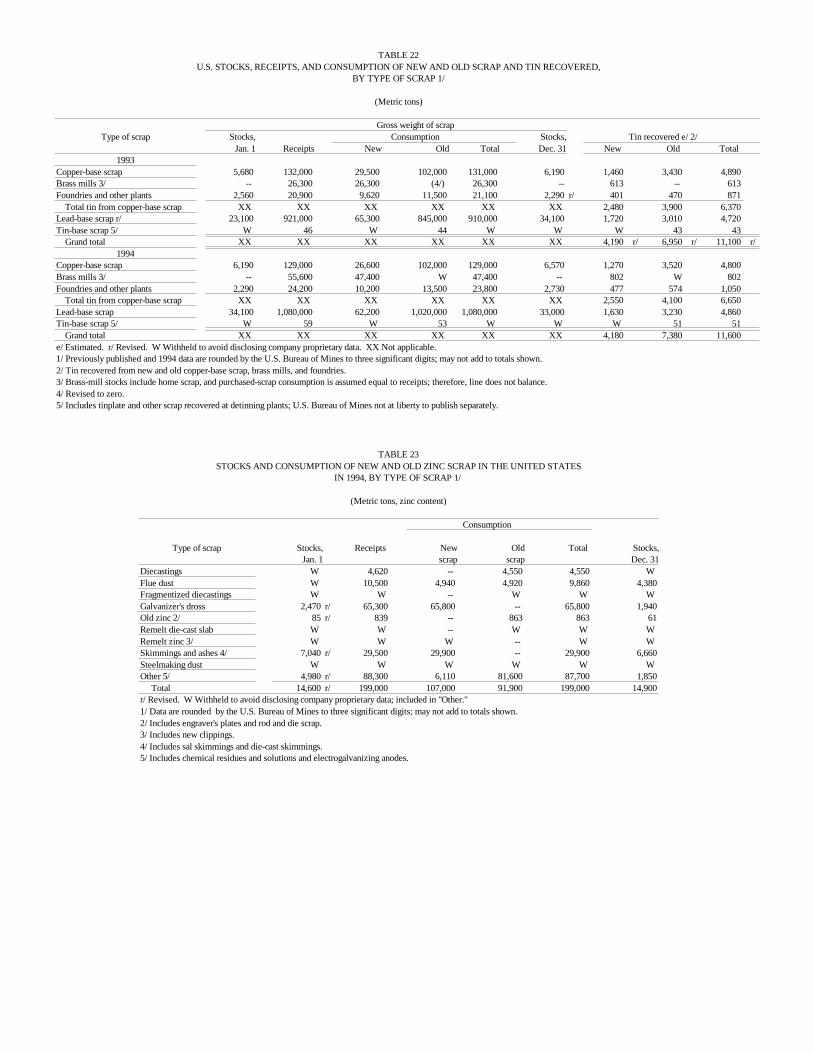
TABLE 22U.S. STOCKS, RECEIPTS, AND CONSUMPTION OF NEW AND OLD SCRAP AND TIN RECOVERED,
BY TYPE OF SCRAP 1/
(Metric tons)
Gross weight of scrapType of scrap Stocks, Consumption Stocks, Tin recovered e/ 2/
Jan. 1 Receipts New Old Total Dec. 31 New Old Total1993
Copper-base scrap 5,680 132,000 29,500 102,000 131,000 6,190 1,460 3,430 4,890Brass mills 3/ -- 26,300 26,300 (4/) 26,300 -- 613 -- 613Foundries and other plants 2,560 20,900 9,620 11,500 21,100 2,290 r/ 401 470 871 Total tin from copper-base scrap XX XX XX XX XX XX 2,480 3,900 6,370Lead-base scrap r/ 23,100 921,000 65,300 845,000 910,000 34,100 1,720 3,010 4,720Tin-base scrap 5/ W 46 W 44 W W W 43 43 Grand total XX XX XX XX XX XX 4,190 r/ 6,950 r/ 11,100 r/
1994Copper-base scrap 6,190 129,000 26,600 102,000 129,000 6,570 1,270 3,520 4,800Brass mills 3/ -- 55,600 47,400 W 47,400 -- 802 W 802Foundries and other plants 2,290 24,200 10,200 13,500 23,800 2,730 477 574 1,050 Total tin from copper-base scrap XX XX XX XX XX XX 2,550 4,100 6,650Lead-base scrap 34,100 1,080,000 62,200 1,020,000 1,080,000 33,000 1,630 3,230 4,860Tin-base scrap 5/ W 59 W 53 W W W 51 51 Grand total XX XX XX XX XX XX 4,180 7,380 11,600e/ Estimated. r/ Revised. W Withheld to avoid disclosing company proprietary data. XX Not applicable.1/ Previously published and 1994 data are rounded by the U.S. Bureau of Mines to three significant digits; may not add to totals shown.2/ Tin recovered from new and old copper-base scrap, brass mills, and foundries.3/ Brass-mill stocks include home scrap, and purchased-scrap consumption is assumed equal to receipts; therefore, line does not balance.4/ Revised to zero.5/ Includes tinplate and other scrap recovered at detinning plants; U.S. Bureau of Mines not at liberty to publish separately.
TABLE 23STOCKS AND CONSUMPTION OF NEW AND OLD ZINC SCRAP IN THE UNITED STATES
IN 1994, BY TYPE OF SCRAP 1/
(Metric tons, zinc content)
Consumption
Type of scrap Stocks, Receipts New Old Total Stocks,Jan. 1 scrap scrap Dec. 31
Diecastings W 4,620 -- 4,550 4,550 WFlue dust W 10,500 4,940 4,920 9,860 4,380Fragmentized diecastings W W -- W W WGalvanizer's dross 2,470 r/ 65,300 65,800 -- 65,800 1,940Old zinc 2/ 85 r/ 839 -- 863 863 61Remelt die-cast slab W W -- W W WRemelt zinc 3/ W W W -- W WSkimmings and ashes 4/ 7,040 r/ 29,500 29,900 -- 29,900 6,660Steelmaking dust W W W W W WOther 5/ 4,980 r/ 88,300 6,110 81,600 87,700 1,850 Total 14,600 r/ 199,000 107,000 91,900 199,000 14,900r/ Revised. W Withheld to avoid disclosing company proprietary data; included in "Other."1/ Data are rounded by the U.S. Bureau of Mines to three significant digits; may not add to totals shown.2/ Includes engraver's plates and rod and die scrap.3/ Includes new clippings.4/ Includes sal skimmings and die-cast skimmings.5/ Includes chemical residues and solutions and electrogalvanizing anodes.
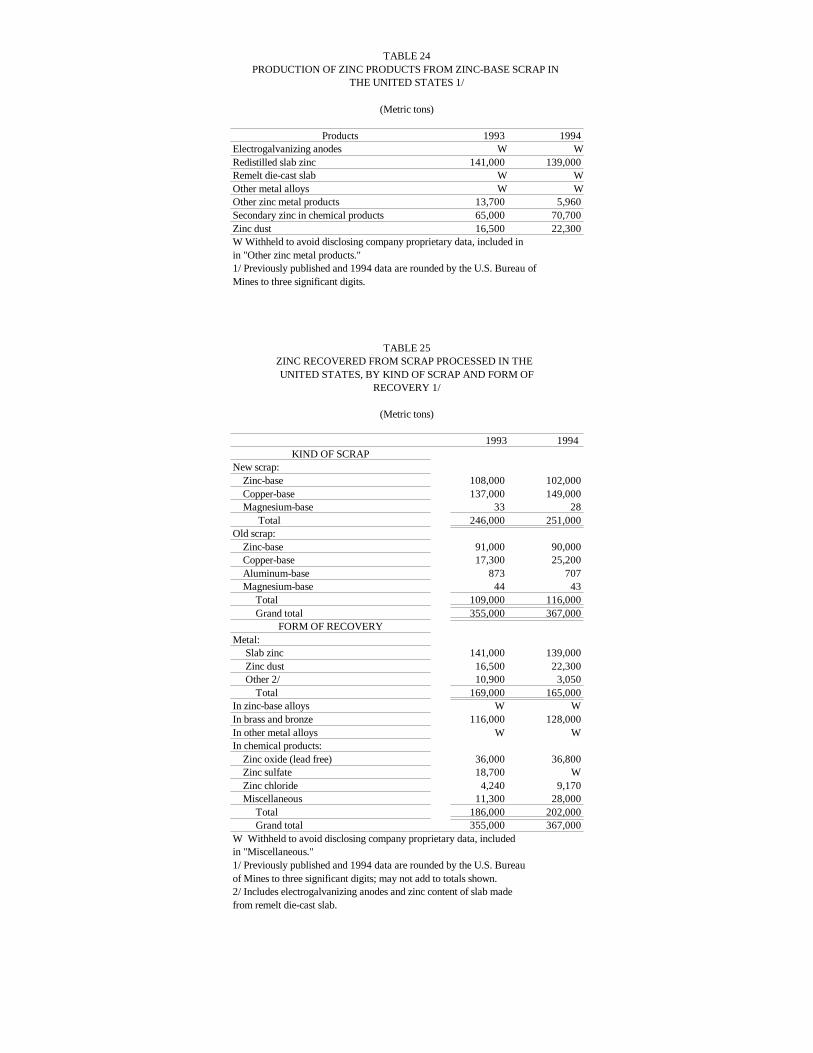
TABLE 24PRODUCTION OF ZINC PRODUCTS FROM ZINC-BASE SCRAP IN
THE UNITED STATES 1/
(Metric tons)
Products 1993 1994Electrogalvanizing anodes W WRedistilled slab zinc 141,000 139,000Remelt die-cast slab W WOther metal alloys W WOther zinc metal products 13,700 5,960Secondary zinc in chemical products 65,000 70,700Zinc dust 16,500 22,300W Withheld to avoid disclosing company proprietary data, included inin "Other zinc metal products."1/ Previously published and 1994 data are rounded by the U.S. Bureau of Mines to three significant digits.
TABLE 25ZINC RECOVERED FROM SCRAP PROCESSED IN THE UNITED STATES, BY KIND OF SCRAP AND FORM OF
RECOVERY 1/
(Metric tons)
1993 1994KIND OF SCRAP
New scrap: Zinc-base 108,000 102,000 Copper-base 137,000 149,000 Magnesium-base 33 28 Total 246,000 251,000Old scrap: Zinc-base 91,000 90,000 Copper-base 17,300 25,200 Aluminum-base 873 707 Magnesium-base 44 43 Total 109,000 116,000 Grand total 355,000 367,000
FORM OF RECOVERYMetal: Slab zinc 141,000 139,000 Zinc dust 16,500 22,300 Other 2/ 10,900 3,050 Total 169,000 165,000In zinc-base alloys W WIn brass and bronze 116,000 128,000In other metal alloys W WIn chemical products: Zinc oxide (lead free) 36,000 36,800 Zinc sulfate 18,700 W Zinc chloride 4,240 9,170 Miscellaneous 11,300 28,000 Total 186,000 202,000 Grand total 355,000 367,000W Withheld to avoid disclosing company proprietary data, includedin "Miscellaneous."1/ Previously published and 1994 data are rounded by the U.S. Bureauof Mines to three significant digits; may not add to totals shown.2/ Includes electrogalvanizing anodes and zinc content of slab madefrom remelt die-cast slab.