Recycling Financial Assistance Programs · The state's solid waste management policy, ... The state...
38
Wisconsin Legislative Fiscal Bureau January, 2017 Recycling Financial Assistance Programs Informational Paper 64
Transcript of Recycling Financial Assistance Programs · The state's solid waste management policy, ... The state...

Wisconsin Legislative Fiscal Bureau
January, 2017
Recycling Financial
Assistance Programs
Informational Paper 64

Recycling Financial Assistance Programs
Prepared by
Kendra Bonderud
Wisconsin Legislative Fiscal Bureau
One East Main, Suite 301
Madison, WI 53703
http://legis.wisconsin.gov/lfb


TABLE OF CONTENTS
Introduction ..................................................................................................................................................................... 1
Solid Waste and Recycling Program Requirements ...................................................................................................... 1
Solid Waste Management Policy........................................................................................................................... 1
Bans on Landfilling and Incineration .................................................................................................................... 2
Exceptions to the Bans ........................................................................................................................................... 2
Enforcement of Bans ............................................................................................................................................. 2
Local Government Responsible Units ........................................................................................................................... 4
Responsibilities of Local Governments ................................................................................................................ 4
Effective Recycling Programs ............................................................................................................................... 5
Out-of-State Waste ............................................................................................................................................... 11
Solid Waste Haulers .................................................................................................................................................... 11
Municipal and County Recycling Grant Program ....................................................................................................... 12
Appropriations ..................................................................................................................................................... 12
Eligibility for Grant Awards ................................................................................................................................ 12
2016 Award Characteristics ................................................................................................................................. 14
Recycling Consolidation Grant Program ..................................................................................................................... 21
Electronics Recycling Program ................................................................................................................................... 22
Sale of Covered Electronic Devices .................................................................................................................... 22
Requirements for Manufacturers ......................................................................................................................... 23
Requirements for Collectors and Recyclers ........................................................................................................ 26
DNR Administration ............................................................................................................................................ 26
Department of Natural Resources Activities ............................................................................................................... 27
DNR Recycling Staff ........................................................................................................................................... 27
Technical Assistance and Information ............................................................................................................... 28
Newspaper Recycled Content Target and Fees ................................................................................................... 29
Council on Recycling ................................................................................................................................................... 30
Department of Agriculture, Trade and Consumer Protection Clean Sweep Grants ................................................... 30
University of Wisconsin System Past Funding ........................................................................................................... 32


1
Recycling Financial Assistance Programs
Introduction
The Legislature enacted 1989 Wisconsin Act
335, a statewide regulatory and financial assis-
tance program aimed at encouraging, and in some
instances requiring, solid waste recycling and
reduction. The act also banned certain recyclable
materials from landfills. Subsequent legislation
modified the funding sources and appropriations
for state recycling programs.
The purpose of this paper is to describe major,
statewide solid waste recycling regulations, and
Department of Natural Resources (DNR) admin-
istration of recycling requirements, financial as-
sistance programs, and electronics recycling pro-
grams. It also describes the Department of Agri-
culture, Trade and Consumer Protection
(DATCP) clean sweep grants for the collection of
household hazardous waste, pesticides, and farm
chemicals.
DNR administers the municipal and county
recycling grant program that provides financial
assistance to responsible units of local govern-
ment for a portion of eligible recycling expenses.
The grant program is appropriated $18 million
for grants to responsible units in calendar year
2016 (2015-16) and $19 million in 2017 (2016-
17). In addition, a recycling consolidation grant
program is funded with $1 million annually ef-
fective in 2011-12.
Recycling programs are funded from the seg-
regated environmental management account of
the environmental fund. Prior to 2011-12, recy-
cling programs were funded from the segregated
recycling and renewable energy fund, which re-
ceived revenue from a recycling tipping fee on
solid waste disposed of in the state, and a recy-
cling surcharge on business income. In 2011
Wisconsin Act 32, the recycling fund was re-
pealed. Recycling tipping fees and electronics
recycling fee revenues, and recycling program
appropriations were transferred to the environ-
mental management account. The recycling
grants to local governments are the largest ex-
penditures from the environmental management
account. For more information about revenues
and expenditures to the account, see the Legisla-
tive Fiscal Bureau informational paper entitled
"Environmental Management Account."
Solid Waste and Recycling
Program Requirements
Solid Waste Management Policy
The state's solid waste management policy,
established in 1989 Wisconsin Act 335 in s.
287.05 of the statutes, declares that maximum
solid waste reduction, reuse, recycling, compost-
ing and resource recovery is in the best interest of
the state in order to protect public health, to pro-
tect the quality of the natural environment and to
conserve resources and energy.
The policy states that implementation of solid
waste reduction, reuse, recycling, composting
and resource recovery systems and operations
should involve and encourage the cooperation of
individuals, state and local governments, tribes,
schools, private organizations and businesses.
The statutes specify that state government should
achieve this by relying to the maximum extent
feasible on technical and financial assistance, ed-
ucational and managerial practices, and that nec-
essary regulations should be developed with
maximum flexibility.
2
The state policy establishes a hierarchy of sol-
id waste management options, ranked in the fol-
lowing order of preference: (1) reduction of the
amount of solid waste generated; (2) reuse of sol-
id waste; (3) recycling of solid waste; (4) com-
posting of solid waste; (5) recovery of energy
from solid waste; (6) land disposal of solid waste;
and (7) the burning of solid waste without energy
recovery.
Bans on Landfilling and Incineration
State law prohibits the landfilling and incin-
eration of specified materials after certain dates
as a means of encouraging their recycling or re-
ducing their generation.
In the recycling law, the term "solid waste
disposal facility" includes several types of facili-
ties, but is most commonly synonymous with the
more familiar "landfill." A "solid waste treat-
ment facility" that burns solid waste is generally
synonymous with "incinerator." For the purposes
of this paper, "landfill" and "incinerator" will be
used unless a more extensive definition is neces-
sary for clarity.
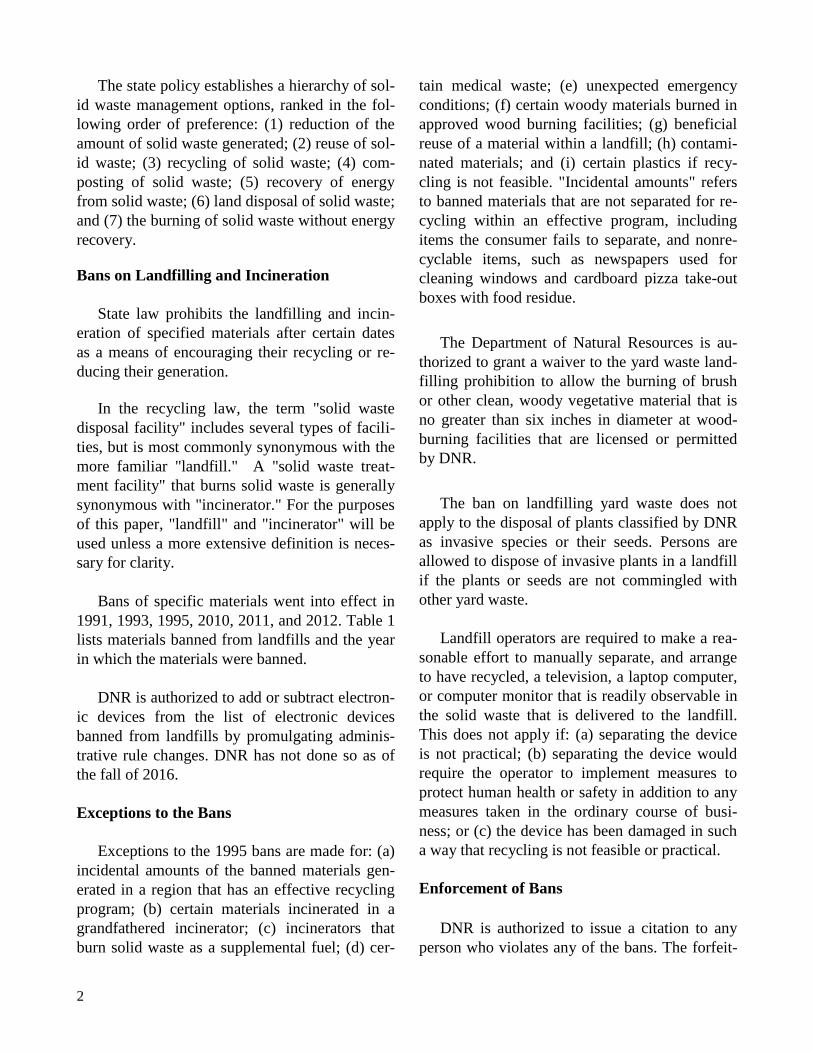
Bans of specific materials went into effect in
1991, 1993, 1995, 2010, 2011, and 2012. Table 1
lists materials banned from landfills and the year
in which the materials were banned.
DNR is authorized to add or subtract electron-
ic devices from the list of electronic devices
banned from landfills by promulgating adminis-
trative rule changes. DNR has not done so as of
the fall of 2016.
Exceptions to the Bans
Exceptions to the 1995 bans are made for: (a)
incidental amounts of the banned materials gen-
erated in a region that has an effective recycling
program; (b) certain materials incinerated in a
grandfathered incinerator; (c) incinerators that
burn solid waste as a supplemental fuel; (d) cer-
tain medical waste; (e) unexpected emergency
conditions; (f) certain woody materials burned in
approved wood burning facilities; (g) beneficial
reuse of a material within a landfill; (h) contami-
nated materials; and (i) certain plastics if recy-
cling is not feasible. "Incidental amounts" refers
to banned materials that are not separated for re-
cycling within an effective program, including
items the consumer fails to separate, and nonre-
cyclable items, such as newspapers used for
cleaning windows and cardboard pizza take-out
boxes with food residue.
The Department of Natural Resources is au-
thorized to grant a waiver to the yard waste land-
filling prohibition to allow the burning of brush
or other clean, woody vegetative material that is
no greater than six inches in diameter at wood-
burning facilities that are licensed or permitted
by DNR.
The ban on landfilling yard waste does not
apply to the disposal of plants classified by DNR
as invasive species or their seeds. Persons are
allowed to dispose of invasive plants in a landfill
if the plants or seeds are not commingled with
other yard waste.
Landfill operators are required to make a rea-
sonable effort to manually separate, and arrange
to have recycled, a television, a laptop computer,
or computer monitor that is readily observable in
the solid waste that is delivered to the landfill.
This does not apply if: (a) separating the device
is not practical; (b) separating the device would
require the operator to implement measures to
protect human health or safety in addition to any
measures taken in the ordinary course of busi-
ness; or (c) the device has been damaged in such
a way that recycling is not feasible or practical.
Enforcement of Bans
DNR is authorized to issue a citation to any
person who violates any of the bans. The forfeit-

3
Table 1: Materials Banned from Landfills
Date Material
January 1, 1991 No person may dispose of the following in a landfill or solid waste disposal facility:
• Lead acid batteries
• Major appliances = residential or commercial air conditioners, clothes dryers, clothes washers,
dishwashers, freezers, microwave ovens, ovens, refrigerators, stoves, furnaces, boilers, dehumidifiers
and water heaters.
• Waste oil
January 3, 1993 No person may dispose of yard waste in a landfill or solid waste disposal facility, except in an approved
land spreading facility (a facility in which solid waste is placed in thin layers onto the surface of the
land or incorporated into the surface layers of the soil).
No person may burn yard waste without energy recovery.
Yard waste = leaves, grass clippings, yard and garden debris, and brush, including clean woody
vegetative material no greater than six inches in diameter.
Yard waste does not include stumps, roots or shrubs with intact root balls.
January 1, 1995 No person may dispose of the following in a landfill or solid waste disposal facility:
• Aluminum containers
• Corrugated paper or other container board
• Foam polystyrene packaging
• Glass containers
• Magazines
• Newspapers
• Office paper
• Plastic containers (plastics #1 through #7)
• Steel containers
• Bi-metal cans (combination of steel and aluminum)
• Waste tires (can be burned with energy recovery, but cannot be burned without energy recovery).
September 1, 2010 No person may landfill, burn with or without energy recovery, or place in a container the contents of
which will be landfilled or burned, electronic devices or covered electronic devices.
Electronic devices = Peripheral (such as computer keyboard, mouse or speaker), facsimile machine,
digital video disc player, digital video player, video cassette recorder, video recorder, or cell phone.
Covered electronic device = television, computer monitor, computer, or printer for use by households or
schools.
January 1, 2011 No person may dispose of used oil filters for automotive engine oil in a landfill or solid waste facility.
July 1, 2011 No person may place in a container the contents of which will be disposed of in a solid waste facility,
converted into fuel, or burned at a solid waste treatment facility, any of the materials subject to the
1995 bans.
No person may place a waste tire in a container the contents of which will be disposed of in a solid waste
facility, or burned without waste recovery at a solid waste treatment facility.
April 7, 2012 No person may dispose of oil-absorbent materials containing waste oil in a landfill or solid waste facility
unless waste oil has been drained so no visible signs of free-flowing oil remain in or on the oil-
absorbent materials, and the oil-absorbent materials are not hazardous waste.

4
ures that may be collected through a citation for
violation of these requirements are $50 for the
first violation, $200 for the second and $2,000 for
the third or subsequent violation. The Attorney
General is authorized to enforce the 1995 and
2010 bans by seeking injunctive relief against
any person who violates them.
DNR's implementation of the recycling law
emphasizes achieving voluntary compliance
through technical and financial assistance rather
than enforced compliance through the imposition
of penalties or injunctions. However, the De-
partment works with responsible units to identify
violations of local recycling ordinances by waste
haulers or landfills.
DNR also is authorized to: (a) hold hearings
and compel the attendance of witnesses in the
production of evidence related to the administra-
tion of the statewide recycling laws; and (b) enter
and inspect property at which a solid waste facili-
ty is located, or is being constructed or installed,
or inspect any record relating to solid waste man-
agement at any reasonable time for the purpose
of ascertaining the status of compliance with re-
cycling law.
DNR activities related to enforcement are de-
scribed under the sections on effective recycling
programs and solid waste haulers. Prior to 2010,
DNR referred a small number of cases related to
the landfill bans to the Department of Justice
(DOJ) for enforcement action, as part of en-
forcement of other solid waste violations. DNR
has not referred any cases related to landfill bans
to DOJ between 2010 and the fall of 2016. Ex-
amples of other violations include landfill license
violations, open burning, improper storage of sol-
id or hazardous waste or recyclable materials at
nonlicensed sites, and improper hauling or pro-
cessing. In cases where a business, resident or
other entity is not following recycling require-
ments of the local ordinance, DNR works with
the responsible unit on enforcement. In cases
where waste haulers or materials recovery facili-
ties are not complying with state recycling re-
quirements outside the authority of the responsi-
ble unit, DNR works directly with the haulers or
materials recovery facilities to ensure compliance
with state requirements.
Local Government Responsible Units
Responsibilities of Local Governments
The statutes establish several responsibilities
for local government related to recycling. In gen-
eral, the local units of government responsible for
implementing state-mandated recycling programs
are termed "responsible units." Under the recy-
cling law definition, the responsible unit for a
geographic area is the municipality (city, village
or town) unless a county takes specific action to
create a responsible unit. Currently, every munic-
ipality in the state is included within one of 1,064
responsible units. For 2016, almost all responsi-
ble units (1,024 of 1,064), representing over 98%
of the state's population, received state-funded
grants for a portion of the costs of operating local
recycling programs.
A county may become a responsible unit upon
its board adopting a resolution accepting this des-
ignation. There are 34 counties that are responsi-
ble units for all or some of the communities with-
in their boundaries.
The governing body of any responsible unit
may designate, by contract, another unit of gov-
ernment to be the responsible unit, if it has that
unit of government's consent. These multiple-
municipality responsible units consist of coun-
ties, solid waste management commissions or
two or more neighboring municipalities. Federal-
ly recognized Indian tribes or bands may also be-
come responsible units.
5
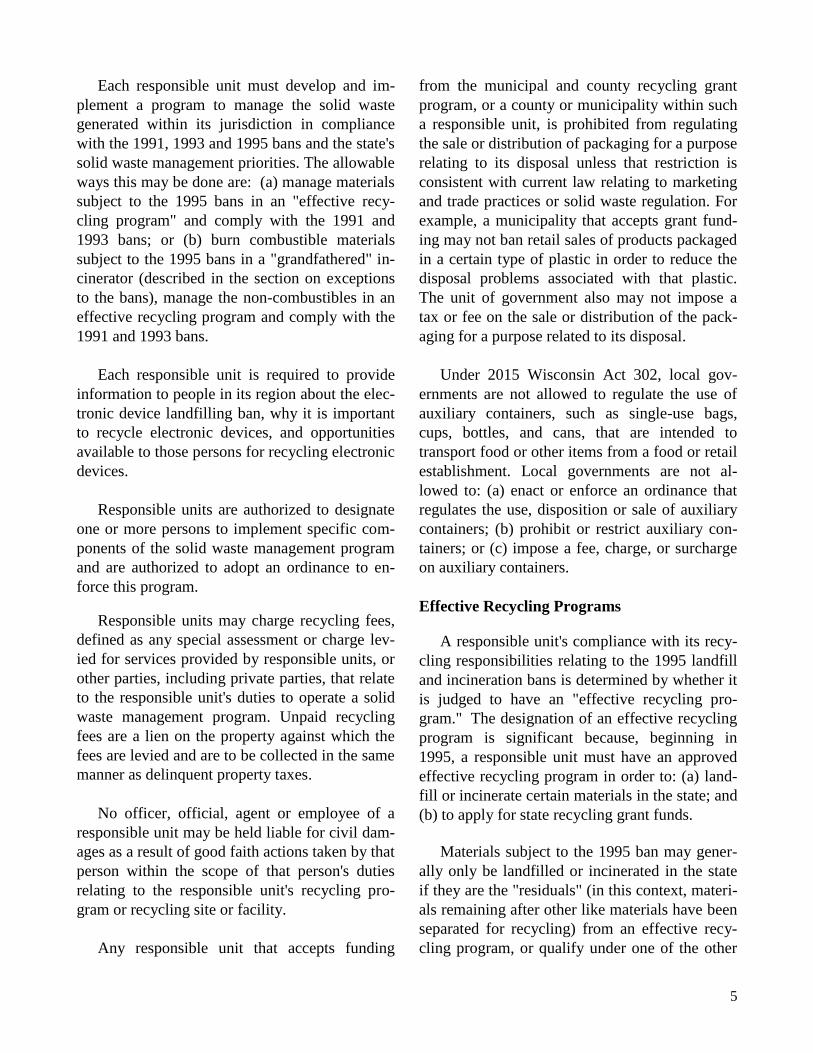
Each responsible unit must develop and im-
plement a program to manage the solid waste
generated within its jurisdiction in compliance
with the 1991, 1993 and 1995 bans and the state's
solid waste management priorities. The allowable
ways this may be done are: (a) manage materials
subject to the 1995 bans in an "effective recy-
cling program" and comply with the 1991 and
1993 bans; or (b) burn combustible materials
subject to the 1995 bans in a "grandfathered" in-
cinerator (described in the section on exceptions
to the bans), manage the non-combustibles in an
effective recycling program and comply with the
1991 and 1993 bans.
Each responsible unit is required to provide
information to people in its region about the elec-
tronic device landfilling ban, why it is important
to recycle electronic devices, and opportunities
available to those persons for recycling electronic
devices.
Responsible units are authorized to designate
one or more persons to implement specific com-
ponents of the solid waste management program
and are authorized to adopt an ordinance to en-
force this program.
Responsible units may charge recycling fees,
defined as any special assessment or charge lev-
ied for services provided by responsible units, or
other parties, including private parties, that relate
to the responsible unit's duties to operate a solid
waste management program. Unpaid recycling
fees are a lien on the property against which the
fees are levied and are to be collected in the same
manner as delinquent property taxes.
No officer, official, agent or employee of a
responsible unit may be held liable for civil dam-
ages as a result of good faith actions taken by that
person within the scope of that person's duties
relating to the responsible unit's recycling pro-
gram or recycling site or facility.
Any responsible unit that accepts funding
from the municipal and county recycling grant
program, or a county or municipality within such
a responsible unit, is prohibited from regulating
the sale or distribution of packaging for a purpose
relating to its disposal unless that restriction is
consistent with current law relating to marketing
and trade practices or solid waste regulation. For
example, a municipality that accepts grant fund-
ing may not ban retail sales of products packaged
in a certain type of plastic in order to reduce the
disposal problems associated with that plastic.
The unit of government also may not impose a
tax or fee on the sale or distribution of the pack-
aging for a purpose related to its disposal.
Under 2015 Wisconsin Act 302, local gov-
ernments are not allowed to regulate the use of
auxiliary containers, such as single-use bags,
cups, bottles, and cans, that are intended to
transport food or other items from a food or retail
establishment. Local governments are not al-
lowed to: (a) enact or enforce an ordinance that
regulates the use, disposition or sale of auxiliary
containers; (b) prohibit or restrict auxiliary con-
tainers; or (c) impose a fee, charge, or surcharge
on auxiliary containers.
Effective Recycling Programs
A responsible unit's compliance with its recy-
cling responsibilities relating to the 1995 landfill
and incineration bans is determined by whether it
is judged to have an "effective recycling pro-
gram." The designation of an effective recycling
program is significant because, beginning in
1995, a responsible unit must have an approved
effective recycling program in order to: (a) land-
fill or incinerate certain materials in the state; and
(b) to apply for state recycling grant funds.
Materials subject to the 1995 ban may gener-
ally only be landfilled or incinerated in the state
if they are the "residuals" (in this context, materi-
als remaining after other like materials have been
separated for recycling) from an effective recy-
cling program, or qualify under one of the other

6
exceptions.
All 1,064 responsible units have received ap-
proval from DNR as having effective recycling
programs. The approval is valid as long as the
local program is operated in a manner that main-
tains the required components of an effective re-
cycling program.
Local programs are required to submit an an-
nual report to DNR by April 30, for the preceding
calendar year, that describes their effective recy-
cling program. DNR administrative rules require
that the report contain specific information re-
garding how the responsible unit is complying
with effective program requirements. DNR staff
review the reports and perform program evalua-
tions to determine the compliance of the respon-
sible unit with the effective program require-
ments.
Required Components of an Effective
Program. Under requirements in Chapter 287 of
the statutes and administrative rule NR 544, a
responsible unit is required to administer an
effective recycling program that has all of the
following components:
1. A local ordinance to require recycling of
the banned materials in all residences and non-
residential facilities and properties. The ordi-
nance must: (a) prohibit the landfilling or burning
of materials subject to the 1995 bans that are sep-
arated for recycling; (b) require residents of sin-
gle-family, two- to four-unit residences, multiple-
family dwellings, and non-residential properties
to separate the banned materials from solid waste
or send the materials to a materials recovery fa-
cility for recycling; (c) require owners of multi-
family dwellings and non-residential properties
to provide recycling containers; (d) require own-
ers of nonresidential properties to notify users of
how to recycle materials; and (e) provide for en-
forcement and penalties.
2. A public education and information pro-
gram about how to recycle materials, reduce
waste and reuse materials.
3. A method for collecting, processing and
marketing of recyclables from single-family and
two- to four-unit residences.
4. Curbside collection in municipalities
with populations of 5,000 or greater and a popu-
lation density greater than 70 persons per square
mile. These municipalities must provide, at least
monthly, curbside collection from single-family
and two- to four-unit residences for at least
newspaper, glass, aluminum and steel containers,
plastic containers made of PETE (polyethylene
terephthalate or #1 plastic) or HDPE (high densi-
ty polyethylene or #2 plastic), and either corru-
gated paper or magazines, and must provide
drop-off collection for materials that are not col-
lected curbside.
5. Drop-off collection in municipalities
with populations of less than 5,000 or a popula-
tion density of 70 persons per square mile or less.
These municipalities must provide services for
single-family and two- to four-unit residences.
6. Collection of eight recyclable materials
that equals or exceeds 83.7 pounds per person per
year in rural municipalities (population of 5,000
or less, or a permanent population density of
fewer than 70 persons per square mile) or 108.2
pounds per person per year in other (urban) mu-
nicipalities.
7. Equipment and staff necessary to operate
and enforce the program.
8. Provisions for the management of post-
consumer waste that is generated within the re-
sponsible unit.
9. A reasonable effort to reduce the amount
of recyclable materials subject to the 1995 land-
fill bans, that are generated as solid waste and
disposed of in a landfill.

7
10. A compliance assurance plan describing
the procedure the responsible unit will follow to
address, at a minimum, one commonly encoun-
tered type of non-compliance with recycling re-
quirements specified in its recycling ordinance.
11. Submittal of an annual program report to
DNR that contains specified information and de-
scribes how the local program meets state re-
quirements.
Implementation of Effective Recycling
Programs. The structure of individual local
recycling programs varies. Responsible units
generally collect recyclable materials through
one of two methods. Curbside collection is the
collection of materials that are set out at the curb
of the residence where they were generated.
Drop-off collection is the collection of materials
at centralized locations where people who
generate the recyclables deliver or "drop off" the
materials.
In 2015, 31% of the state's population lived in
responsible units that only had curbside collec-
tion programs, 57% lived in responsible units
with combination of curbside and drop-off col-
lection and 12% lived in responsible units where
only drop-off collection was reported as the pri-
mary collection system. The percentage of re-
sponsible units with a combination of curbside
and drop-off collection is high because: (a) ap-
proximately 25% of the population of the state is
served by county responsible units, in which
some member communities may have curbside
collection and others have drop-off, so the county
is reported as having both; and (b) in some re-
sponsible units with both curbside and drop-off
programs, the drop-off collection is mainly used
for items that are not picked up at curbside.
DNR estimates that in 2015, over 97% of re-
sponsible units with populations over 2,000 had
access to curbside collection or a combination of
curbside and drop-off collection. Approximately
65% of the responsible units with populations
less than 2,000, and the majority of the popula-
tion in those responsible units, had access to
curbside collection or a combination of curbside
and drop-off collection.
Responsible units may choose to own or op-
erate a materials recovery facility (MRF) as part
of their effective recycling program, or contract
with a separately-owned MRF, or neither. A ma-
terials recovery facility is a facility where materi-
als banned from landfills, and not mixed with
other solid waste, are processed for reuse or re-
cycling. A MRF is required to submit a self-
certification form to DNR that the facility com-
plies with state requirements before the MRF be-
gins to serve a responsible unit. The self-
certification includes information about the oper-
ations of the facility, types and amounts of mate-
rials processed, storage capacity, procedures in
place to prevent nuisance conditions or discharg-
es of contaminants to the environment from the
materials, and certification that the facility pro-
duces recovered recyclable materials in accord-
ance with market quality specifications. The
MRF must also annually submit a certification
renewal and report to DNR.
Responsible units reported to DNR that they
collected a total of 707,031 tons of recyclable
materials from residences in 2015. The amount of
recyclable materials collected by responsible
units in 1994 through 2015, as reported to DNR,
is shown in Table 2. Approximately 58% of re-
cyclable materials collected in 2015 were materi-
als subject to the 1995 bans and 39% was yard
waste subject to the 1993 bans. Residential recy-
cling programs collected an average of 144
pounds per capita of the 1995 banned materials in
2015, and an average of approximately 249
pounds of recyclable materials per capita of the
materials shown in Table 2.
DNR contracted with private entities to con-
duct waste characterization studies of recyclable
materials for DNR in 1990, 1995, 2000, and
2009. DNR used the studies to make estimates of

8
collected recyclable materials as a percentage of
municipal solid waste generated statewide (resi-
dential and commercial solid waste) with the
most recent results shown in Table 3. The actual
recycling rates vary among municipalities.
In 2002 and 2009, DNR contracted with pri-
vate entities to study the quantity of municipal
solid waste that is landfilled in the state. DNR
used the study data to analyze how successful
local recycling programs have been both in di-
verting banned materials from landfills, and in
determining the average amounts and ranges of
recyclable materials found in the waste stream
and diverted from landfills. A report for the 2009
study included estimates of the quantity and
composition of municipal solid waste disposed of
in landfills by Wisconsin households, businesses,
and institutions. In general, the study found that
less waste was landfilled in 2009 than in 2002,
likely due to the economic slowdown in 2009,
and the composition of waste was similar to that
of 2002.
DNR used data from annual reports submitted
by responsible units in 2005 and 2006 to estimate
that collected recyclable materials represented a
statewide average of 24% of municipal solid
waste generated. DNR also estimated that the to-
tal diversion rate, including composting or yard
Table 2: Recyclable Materials Collected by Responsible Units and Reported to DNR (Tons)
Materials Banned from Other Non- Landfills Yard Banned Banned Year as of 1995* Waste Materials** Materials*** Total
1994 226,701 213,635 18,018 3,195 461,549 1995 360,669 210,288 22,598 47,316 640,871 1996 361,001 241,492 20,848 76,344 699,685 1997 389,161 280,213 25,950 71,682 767,006 1998 379,772 288,606 26,703 99,240 794,321
1999 389,381 278,275 26,668 70,994 765,318 2000 405,179 252,479 24,956 47,969 730,583 2001 403,915 260,047 23,498 39,596 727,056 2002 397,384 248,165 25,927 43,017 714,493 2003 397,596 260,396 22,097 55,521 735,610
2004 410,548 281,506 19,315 18,254 729,623 2005 410,492 283,489 15,867 18,384 728,232 2006 419,116 267,338 13,558 18,538 718,550 2007 411,047 241,149 14,001 23,521 689,718 2008 423,661 275,869 16,952 19,705 736,187
2009 410,443 270,946 12,972 16,000 710,361 2010 420,047 260,747 16,511 23,269 720,574 2011 398,524 242,731 16,247 NA 657,502 2012 392,576 250,021 15,755 NA 658,352 2013 414,453 259,291 20,035 NA 693,779 2014 412,767 277,955 19,511 NA 710,233 2015 410,192 279,141 17,698 NA 707,031
* Includes old newspapers, old magazines, old corrugated cardboard, office paper, aluminum cans, steel cans, glass
containers, plastic containers, co-mingled containers and polystyrene foam.
** Includes appliances, tires, lead acid batteries, and used oil. Includes electronics as of 2010.
*** Includes scrap metal, used clothing or textiles, miscellaneous recyclables, and residential mixed paper. Includes
electronics through 2009. DNR does not collect this information beginning in 2011.
NA= Not available.

9
waste managed at home (10%), and incineration
with energy recovery (3%), represented approxi-
mately 36% of municipal solid waste generated
in 2005 to 2006.
DNR officials indicate the 2009 study data
was not sufficient to update the 2006 estimate of
the overall average landfill diversion rate. How-
ever, DNR used the data to update estimates of
the recycling rate for various recyclable materi-
als. Table 3 shows the most recent DNR esti-
mates of the overall landfill diversion rate in
2005 to 2006 and the recycling rate for several
recyclable materials in 2009. DNR has not updat-
ed estimates of either measurement since then.
Review and Enforcement of Effective Pro-
gram Requirements. DNR is required to admin-
ister compliance of responsible units with effec-
tive recycling program criteria. The Department
is also required to annually review the programs
of at least 5% of the responsible unit grant recipi-
ents to ensure that programs and activities funded
by responsible units meet the requirements of the
statutes.
In 2014 through 2015, DNR reviewed the
compliance of 173 effective programs. The De-
partment also held online webinar sessions to as-
sist responsible units in complying with effective
program and annual reporting requirements, dis-
cuss recycling topics of interest, and provide op-
portunities for responsible units to learn from
each other about ways to improve their recycling
programs. In 2016, DNR transferred staff work
related to responsible units, from regional staff to
Madison central office staff. The Department's
review is handled by recycling grants staff when
they review grant-eligible expenses, and by se-
lected review of annual reports. Beginning in
2016, DNR planned to also review a smaller
number of responsible units through one-on-one
phone conversations or group meetings.
In 2014, the Department expanded an awards
program to statewide to recognize responsible
units that had outstanding performance during the
prior year. The program recognizes local efforts
in the categories of projects and initiatives, over-
all program, special events, and innovation.
In each of 2009 through 2016, DNR notified a
few responsible units of minor noncompliance
issues through letters, discussions or meetings,
but the issues were not serious enough to issue a
notice of noncompliance. Examples of noncom-
pliance concerns included responsible units not
doing a sufficient job of: (a) providing adequate
collection of recyclables; (b) requiring businesses
to recycle; (c) inspecting businesses or apart-
ments for compliance; (d) completing a compli-
ance assurance plan; and (e) submitting an annual
report in a timely manner. DNR negotiated cor-
rective action with the responsible units, and all
required corrective action was completed.
Table 3: DNR's Most Recent Estimates of the Recycling Rate for Various Materials and Land-fill Diversion Rate Estimated Material Recycling Rate * 2005 to 2006 Overall average landfill diversion rate ** 36% 2009 Recycling rate for various materials *** Glass containers 75% Aluminum containers 42% Steel cans 42% Uncoated cardboard 59% Other recyclable paper 56% PET bottles and non-bottles 19-35% HDPE bottles 45% #3-7 plastic bottles 17% Other plastic packaging 8%
* Does not include recycling that takes place through direct
redemption, such as aluminum cans, or direct sales of recovered
materials by generators, such as grocery stores recycling card-
board boxes.
**The DNR estimate includes recycling, plus combustion
with energy recovery, plus yard waste managed at home. DNR
indicates it does not have sufficient data to estimate the overall
landfill diversion rate in a year more recent than 2006.
*** DNR indicates it does not have sufficient data to estimate
the recycling rate for various recyclable materials in a year more
recent than 2009.

10
In 2014, DNR revised its method of handling
late annual reports, to train responsible unit rep-
resentatives how to fill out late annual reports,
send reminders that the responsible unit would be
placed on probation with the potential loss of
grant funds, and use available waste hauler data
to fill out annual reports for responsible units.
In the spring of 2014, DNR notified responsi-
ble units that if they did not submit the required
2013 annual recycling report by April 30, 2014,
they would be placed on a one-year probation
starting July 1, 2014. The probation would be in
effect until the responsible unit submits its 2014
annual recycling report. Receipt of a recycling
grant for calendar year 2015 was conditional on
submittal of the 2014 annual recycling report
(due April 30, 2015) by June 30, 2015.
In 2014, DNR placed 24 responsible units on
probation for nonsubmittal of the 2013 annual
report, with receipt of the 2015 grant being con-
ditional upon submittal of the 2014 annual report
by the April 30, 2015, deadline. All except two
submitted the 2013 report by mid-May, 2014.
The remaining two submitted their report after
receiving a letter from DNR informing them they
would be invoiced to repay the full 2013 recy-
cling grant. In 2015, DNR placed 28 responsible
units on probation for submitting the 2014 annual
report after April 30, 2015. In 2016, DNR placed
13 responsible units on probation for submitting
the 2015 annual report after April 30, 2016. One
responsible unit (Village of Ironton in Sauk
County) did not submit the 2014 or 2015 annual
report, and DNR followed up by invoicing the
responsible unit for repayment of the 2015 recy-
cling grant and denying payment of the 2016
grant. The other responsible units submitted their
annual reports, were removed from probation,
and did not lose grant funding.
DNR did not issue notices of violation or no-
tices of noncompliance in 2014 or 2015 to re-
sponsible units with late annual reports. In the
fall of 2016, the Department issued notices of
noncompliance to two responsible units that did
not submit an annual report in 2016 and for
whom no waste hauler data was available (the
Village of Couderay in Sawyer County and Town
of Farmington in Jefferson County). The Town of
Farmington subsequently submitted its annual
report and returned to compliance.
DNR has worked with responsible units to
resolve a small number of complaints, such as:
(a) a waste hauler collecting separated recycla-
bles with solid waste and landfilling all of the
materials; (b) businesses, apartment buildings, or
residences not separating recyclables; (c) a re-
sponsible unit not collecting for recycling all ma-
terials banned from landfills; (d) responsible
units or solid waste haulers not separating recy-
clable materials from solid waste; and (e) materi-
als recovery facilities storing recyclable materials
outside. In 2016, DNR also issued a notice of
noncompliance to a solid waste hauler for issues
related to storage of computer monitors and tele-
visions outdoors, handling of hazardous waste,
and compliance with requirements for storage
and disposal of solid waste.
For 2015, responsible units reported to DNR
that they took the following actions related to en-
forcing landfill bans: (a) received 5,553 com-
plaints; (b) issued 2,280 verbal warnings; (c) is-
sued 7,234 written warnings; (d) issued 36,399
warning tags for trash with recyclables in it; (e)
issued 745 citations; and (f) made 1,553 inspec-
tions. Almost all the actions under (a) through (e)
related to recycling in one- to four-unit dwell-
ings. All of the inspections were related to multi-
family dwellings and businesses. DNR does not
have information about the reasons for the com-
plaints, or the types of citations. DNR indicates
most of the warnings were tags placed on trash
cans that had recyclables in them.
Variances and Waivers to the Effective
Program Criteria. DNR may grant a variance to
a specific responsible unit from certain effective
program criteria for one or more of the materials

11
subject to the 1995 landfill and incinerations
bans. DNR may grant the variance to a specific
responsible unit if a cost of selling processed ma-
terial exceeds certain criteria.
In October, 1996, DNR issued a waiver to the
collection and disposal requirements for #3
through #7 plastic containers and polystyrene
foam packaging, based on a departmental study
that indicated that it is not feasible or practical to
continue collecting these materials under current
market conditions. The waiver has been in effect
for over 20 years and will continue until one year
after DNR determines that markets are available
for these materials.
Issuance of a variance or waiver eliminates
for effective recycling programs the requirement
to separate those recyclable materials, or the pro-
hibition on disposal or incineration of those ma-
terials, or both.
Out-of-State Waste
The recycling statutes in effect before 1997
required governmental units located outside Wis-
consin to receive approval as effective recycling
programs in order to dispose of solid waste in
Wisconsin. This was found to be unconstitutional
in National Solid Waste Management Assoc. v.
George Meyer, 63 F. 3d 653 (1995), by the U.S.
Seventh Circuit Court of Appeals. 1997 Wiscon-
sin Act 27 made several changes related to the
disposal of out-of-state waste in Wisconsin.
Those changes were struck down in 1998 by the
U.S. District Court for the Western District of
Wisconsin, and in 1999 by the U.S. Seventh Cir-
cuit Court of Appeals. Consequently, DNR does
not enforce effective recycling program criteria
on waste disposed of in Wisconsin landfills, if
the waste is generated out-of-state.
Solid Waste Haulers
Haulers who collect and transport solid waste
are required to be licensed by DNR under solid
waste management statutes and are required to
comply with the solid waste landfill bans. Haul-
ers who collect and transport municipal solid
waste are required to notify their clients (the con-
tracting entity or the entity that arranges for col-
lection and transportation service) of the need to
comply with state and local recycling require-
ments. Haulers are also required to provide in-
formation to responsible units about the amount
of recyclable materials collected under contract
with the responsible unit, within four weeks of a
written request from the responsible unit.
DNR sends annual letters to licensed haulers
of solid waste and recyclable materials as part of
the annual license renewal process to review the
recycling and landfill ban requirements. This in-
cludes reminding haulers of the requirements that
haulers must: (a) annually notify their customers
about state and local recycling requirements and
landfill bans; (b) keep collected recyclable mate-
rials separate from solid waste; (c) maintain sepa-
rated recyclables in clean condition; and (d) re-
port the weight of collected recyclables to re-
sponsible units.
In 2010 through 2016, DNR notified solid
waste haulers of the bans on the disposal of mate-
rials banned from landfills. DNR also developed
guidance on implementing the bans for haulers,
landfill operators, auto scrap processors, and oth-
er affected businesses and facilities, and related
to the requirements to separate recyclables from
solid waste. In addition, DNR reminded waste
haulers about administrative rules regarding
composting and allowing landfilling of certain
invasive species.
DNR has not issued any notices of noncom-
pliance to a hauler since 2009, when it issued one
in response to a complaint that a driver had
mixed sorted recyclables with solid waste. The
hauler returned to compliance within the 30-day
required timeframe. In 2014 through 2016, DNR
staff responded to a small number of citizen

12
complaints about possible cases of landfilling of
mixed recyclables and trash by haulers, or the
lack of recycling at special events. DNR resolved
the complaints through visits, letters, or other
communication to the hauler rather than issuing a
notice of noncompliance.
Municipal and County
Recycling Grant Program
The municipal and county recycling grant
program was created in 1989 Wisconsin Act 335
to provide financial assistance to responsible
units for eligible recycling expenses.
Appropriations
The municipal and county recycling grant
program was appropriated $19,000,000 annually
in 2011-12 through 2014-15. It was appropriated
$18,000,000 in 2015-16, and $19,000,000 begin-
ning in 2016-17. Table 4 shows annual appro-
priations for the program from 1990-91 through
2016-17.
Beginning in 2011-12, for calendar year 2012,
through 2016-17, for calendar year 2017,
$1,000,000 annually was appropriated for recy-
cling consolidation grants. The voluntary pro-
gram provides a per capita grant to responsible
units that are counties, Indian tribes, single or
consolidated municipalities with a population of
25,000 or more, or municipalities that have taken
certain actions to consolidate recycling programs.
Funding for the recycling consolidation grant
program is included in Table 4. The program is
described in a later section.
Beginning in 2002-03, for calendar year 2003,
through 2008-09, for calendar year 2009,
$1,900,000 annually was appropriated for recy-
cling efficiency incentive grants. This is included
in Table 4. The voluntary program provided addi-
tional recycling program grants for responsible
units that consolidate, enter into cooperative
agreements with other responsible units, or enact
other efficiencies. No funds were appropriated
for the program in 2009-10 and 2010-11, and the
program was repealed in the 2011-13 biennial
budget act.
Ten percent of funds available for 1994
through 1999 basic grants were allocated for
supplemental grants for responsible units that
imposed volume-based fees for residential solid
waste collection. The supplemental grant was
calculated by dividing the available funds by the
population subject to volume-based fees in the
responsible units that imposed volume-based fees
for residential solid waste collection.
Eligibility for Grant Awards
Responsible units with DNR-approved effec-
tive recycling programs are eligible for grants
under the municipal and county recycling grant
program. Eligible uses of grant funds include ex-
penses for planning, constructing or operating
one or more of the components of an effective
recycling program, or to comply with the 1993
yard waste ban. Eligible capital expenses include
annual depreciation, or equipment on an hourly
use basis.
Responsible units are required to submit an
application, with estimated net eligible recycling
costs, by October 1 for a grant for the following
calendar year. DNR pays the grant award by June
1 of the calendar grant year.
Past Grant Formula Provisions. In 1990
(fiscal year 1990-91), the first year grants were
awarded under the municipal and county grant
program, grants for the period from July 1, 1990,
through December 31, 1991, were allocated
through a special expedited process.
Grants for 1991 through 1999 were allocated
based on a complex formula based on eligible
expenses, "avoided disposal costs," and other fac-

13
tors. Avoided disposal costs are those costs that
are not incurred by the responsible unit because
material is recycled rather than disposed of by
landfilling or incineration (such as landfill tip-
ping fees).
The basic grant award in 1999, the last year
the formula was used, was determined by first
calculating 66% of eligible expenses minus
avoided disposal costs, and $8 per capita, and
determining which of the two amounts was less.
The second step was to compare this amount with
33% of eligible expenses. The responsible unit
received the greater of the two amounts deter-
Table 4: Municipal and County Recycling Grant, Efficiency Incentive Grant, and Consolidation Grant Programs: Appropriation Levels 1990-91 Through 2016-17
Efficiency Incentive
Municipal and or Recycling Total
Calendar County Recycling Consolidation Grant Appropriation
Year Fiscal Year Grant Appropriation Appropriation Amount
July 1, 1990 to
Dec 31, 1991 1990-91 $18,500,000 $0 $18,500,000
1992 1991-92 18,500,000 0 18,500,000
1993 1992-93 23,800,000 0 23,800,000
1994 1993-94 29,849,200 0 29,849,200
1995 1994-95 29,200,000 0 29,200,000
1996 1995-96 29,200,000 0 29,200,000
1997 1996-97 29,200,000 0 29,200,000
1998 1997-98 24,000,000 0 24,000,000
1999 1998-99 24,000,000 0 24,000,000
2000 1999-00 24,500,000 0 24,500,000
2001 2000-01 24,500,000 0 24,500,000
2002 2001-02 24,500,000 0 24,500,000
2003 2002-03 24,500,000 1,900,000 26,400,000
2004 2003-04 24,500,000 1,900,000 26,400,000
2005 2004-05 24,500,000 1,900,000 26,400,000
2006 2005-06 24,500,000 1,900,000 26,400,000
2007 2006-07 24,500,000 1,900,000 26,400,000
2008 2007-08 31,000,000 1,900,000 32,900,000
2009 2008-09 31,000,000* 1,900,000* 32,900,000
2010 2009-10 31,098,100* 0 31,098,100
2011 2010-11 32,098,100* 0 32,098,100
2012 2011-12 19,000,000 1,000,000 20,000,000
2013 2012-13 19,000,000 1,000,000 20,000,000
2014 2013-14 19,000,000 1,000,000 20,000,000
2015 2014-15 19,000,000 1,000,000 20,000,000
2016 2015-16 18,000,000 1,000,000 19,000,000
2017 2016-17 19,000,000 1,000,000 20,000,000
Total $660,445,400 $19,300,000 $679,745,400
*DNR awarded less than the appropriated amount to meet part of the Department’s obligation to transfer funds to the state’s
general fund under deficit-reduction requirements of 2007-09 and 2009-11 legislation. DNR awarded $29.3 million in 2008-
09 ($27.8 million for basic grants and $1.5 million for recycling efficiency grants), $29.3 million in 2009-10, and $19.0
million in 2010-11.
14
mined in the second step. Third, counties that are
responsible units for at least 75% of the county's
population were guaranteed a minimum annual
grant of $100,000 if they had eligible expenses
equal to or greater than that amount. The final
step was to prorate all grant awards by an equal
percentage (after providing the minimum
$100,000 grants to certain counties) to meet
available funding.
1999 Wisconsin Act 9 changed the grant for-
mula for 2000 and subsequent grant years. The
Legislature enacted a change to a per capita
based grant formula. However, as a result of the
Governor's partial veto, the formula was changed
to a proportional distribution based on 1999
awards.
In order to be eligible for a grant in 2000, a
responsible unit had to have received financial
assistance in 1999 and DNR had to have deter-
mined that the responsible unit has an effective
recycling program. In 2000, 11 responsible units
applied for and did not receive grants because
they did not receive a grant in 1999.
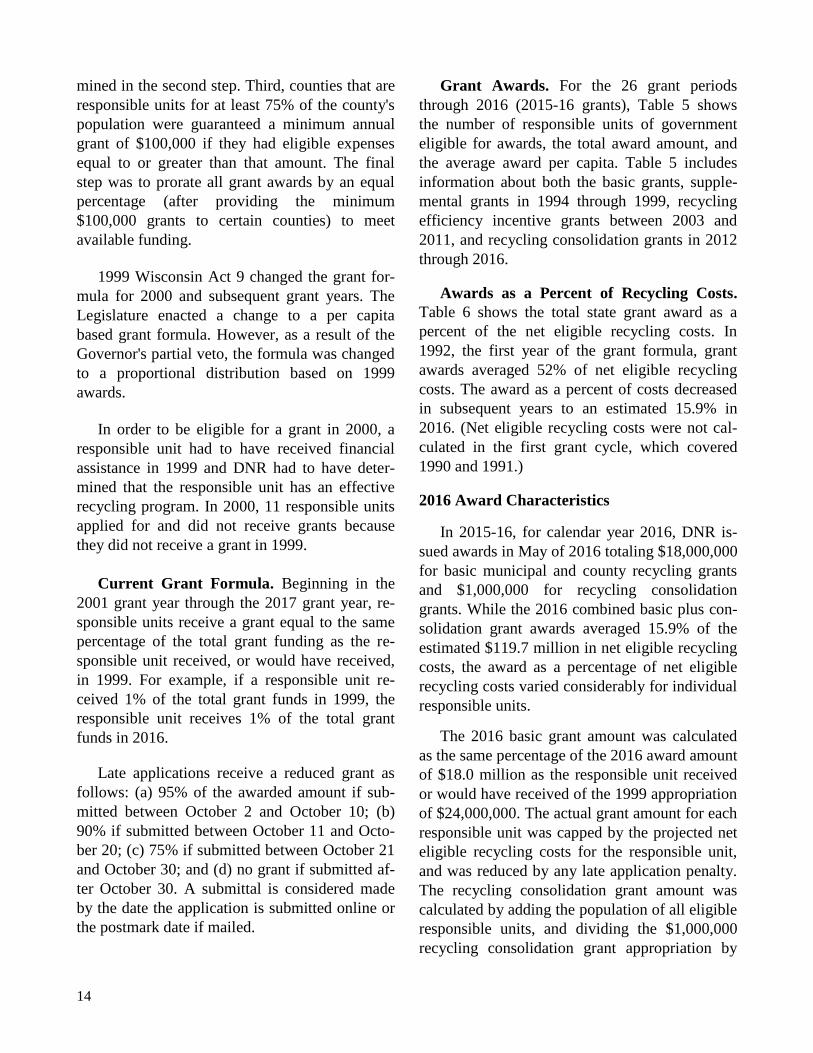
Current Grant Formula. Beginning in the
2001 grant year through the 2017 grant year, re-
sponsible units receive a grant equal to the same
percentage of the total grant funding as the re-
sponsible unit received, or would have received,
in 1999. For example, if a responsible unit re-
ceived 1% of the total grant funds in 1999, the
responsible unit receives 1% of the total grant
funds in 2016.
Late applications receive a reduced grant as
follows: (a) 95% of the awarded amount if sub-
mitted between October 2 and October 10; (b)
90% if submitted between October 11 and Octo-
ber 20; (c) 75% if submitted between October 21
and October 30; and (d) no grant if submitted af-
ter October 30. A submittal is considered made
by the date the application is submitted online or
the postmark date if mailed.
Grant Awards. For the 26 grant periods
through 2016 (2015-16 grants), Table 5 shows
the number of responsible units of government
eligible for awards, the total award amount, and
the average award per capita. Table 5 includes
information about both the basic grants, supple-
mental grants in 1994 through 1999, recycling
efficiency incentive grants between 2003 and
2011, and recycling consolidation grants in 2012
through 2016.
Awards as a Percent of Recycling Costs.
Table 6 shows the total state grant award as a
percent of the net eligible recycling costs. In
1992, the first year of the grant formula, grant
awards averaged 52% of net eligible recycling
costs. The award as a percent of costs decreased
in subsequent years to an estimated 15.9% in
2016. (Net eligible recycling costs were not cal-
culated in the first grant cycle, which covered
1990 and 1991.)
2016 Award Characteristics
In 2015-16, for calendar year 2016, DNR is-
sued awards in May of 2016 totaling $18,000,000
for basic municipal and county recycling grants
and $1,000,000 for recycling consolidation
grants. While the 2016 combined basic plus con-
solidation grant awards averaged 15.9% of the
estimated $119.7 million in net eligible recycling
costs, the award as a percentage of net eligible
recycling costs varied considerably for individual
responsible units.
The 2016 basic grant amount was calculated
as the same percentage of the 2016 award amount
of $18.0 million as the responsible unit received
or would have received of the 1999 appropriation
of $24,000,000. The actual grant amount for each
responsible unit was capped by the projected net
eligible recycling costs for the responsible unit,
and was reduced by any late application penalty.
The recycling consolidation grant amount was
calculated by adding the population of all eligible
responsible units, and dividing the $1,000,000
recycling consolidation grant appropriation by

15
Table 5: Summary of Municipal and County Recycling Grant Amounts
Net Eligible Average Number of Recycling Actual Per Capita Calendar Year Grantees (1) Costs (2) Award Amount Award Amount 1990/1991 final 1,860 (3) NA $18,500,000 $3.77 1992 final 870 $35,588,600 18,452,200 4.07 1993 final 941 48,520,200 23,741,300 4.98 1994 final Basic 1,001 56,520,200 26,860,700 5.44 Supplemental 211 NA 2,943,900 10.50 Total 1,001 56,520,200 29,804,500 6.04 1995 final Basic 1,010 61,023,800 26,182,500 5.21 Supplemental 283 NA 2,914,100 6.92 Total 1,010 61,023,800 29,096,600 5.80 1996 final Basic 1,018 66,340,000 26,278,600 5.18 Supplemental 299 NA 2,915,900 5.89 Total 1,018 66,340,000 29,194,500 5.75 1997 final Basic 1,016 68,842,900 26,268,900 5.13 Supplemental 290 NA 2,917,900 5.84 Total 1,016 68,842,900 29,186,800 5.71 1998 final Basic 1,018 71,442,200 21,440,200 4.15 Supplemental 292 NA 2,417,900 4.38 Total 1,018 71,442,200 23,858,100 4.61 1999 final Basic 1,011 73,262,600 21,731,500 4.18 Supplemental 296 NA 2,397,900 4.13 Total 1,011 73,262,600 24,129,400 4.64 2000 final Total 999 76,581,100 24,312,500 4.66 2001 final Total 1,011 84,124,200 24,276,700 4.59 2002 final Total 1,016 82,624,400 24,387,500 4.53 2003 final Basic 1,016 84,426,600 24,404,900 4.50 Efficiency Incentive 110 NA 1,900,000 0.71 Total 1,016 84,426,600 26,304,900 4.84 2004 final Basic 1,013 85,661,000 24,383,300 4.48 Efficiency Incentive 77 NA 1,900,000 0.74 Total 1,013 85,661,000 26,283,300 4.83 2005 final Basic 1,010 90,136,100 24,409,700 4.43 Efficiency Incentive 148 NA 1,898,200 0.66 Total 1,010 90,136,100 26,307,900 4.78 2006 final Basic 1,012 93,952,900 24,435,000 4.40 Efficiency Incentive 120 NA 1,900,000 0.71 Total 1,012 93,952,900 26,335,000 4.74

16
Table 5: Summary of Municipal and County Recycling Grant Amounts (continued)
Net Eligible Average Number of Recycling Actual Per Capita Calendar Year Grantees (1) Costs (2) Award Amount Award Amount 2007 final Basic 1,008 $98,387,100 $24,414,600 $4.37 Efficiency Incentive 124 NA 1,900,000 0.70 Total 1,018 98,387,100 26,314,600 4.71 2008 final Basic 1,018 99,118,900 30,787,900 5.47 Efficiency Incentive 227 NA 1,900,000 0.65 Total 1,018 99,118,900 32,687,900 5.81 2009 final Basic 1,022 107,997,300 27,829,100 (4) 4.92 Efficiency Incentive 161 NA 1,500,000 (4) 0.56 Total 1,022 107,997,300 29,329,100 5.18 2010 final Basic 1,025 104,028,700 29,294,200 (4) 5.16 Efficiency Incentive 0 NA 0 0.00 Total 1,025 104,028,700 29,294,200 5.16 2011 final Basic 1,020 103,514,700 18,954,000 (4) 3.34 Efficiency Incentive 0 NA 0 0.00 Total 1,020 103,514,700 18,954,000 3.34 2012 final Basic 1,026 105,885,200 19,000,000 3.34 Consolidation 186 NA 1,000,000 0.27 Total 1,026 105,885,200 20,000,000 3.52 2013 final Basic 1,020 109,311,000 18,996,900 3.34 Consolidation 193 NA 1,000,000 0.26 Total 1,020 109,310,000 19,996,900 3.52 2014 final Basic 1,024 112,172,800 19,000,000 3.32 Consolidation 203 NA 1,000,000 0.26 Total 1,024 112,172,800 20,000,000 3.50 2015 final Basic 1,027 116,717,400 19,000,000 3.34 Consolidation 201 NA 1,000,000 0.26 Total 1,027 116,717,400 20,000,000 3.49 2016 award Basic 1,024 119,671,900 18,000,000 3.15 Consolidation 193 NA 1,000,000 0.26 Total 1,024 119,671,900 19,000,000 3.33
NA: Not applicable (1) All grantees that received a supplemental grant in 1994 through 1999, an efficiency incentive grant in 2003 through 2009, or a consolidation grant in 2012 through 2016, first received a basic grant. (2) For final grants, this equals the lesser of the actual net eligible recycling costs and the net eligible recycling costs that were estimated at the time of the initial grant award.
(3) This equals the 1990 total of 1,849 municipalities plus 11 Indian tribes. Since the first expedited grant installment was made to all municipalities and Indian tribes, and subsequent installments only to responsible units, this is the maximum number of units that received any of the expedited grant installments.
(4) DNR awarded less than the appropriated amount to meet part of the Department’s obligation to transfer funds to the state’s general fund under deficit-reduction requirements of 2007-09 and 2009-11 legislation.

17
that population total, to reach a per capita consol-
idation grant amount of $0.26.
For the 2016 grant year, Tables 7 through 14
show the distribution of grant awards in several
different ways and include the population repre-
sented by the responsible units receiving those
awards, the net eligible recycling costs, the total
grant award, the average per capita grant award,
and the grant award as a percent of net eligible
recycling costs.
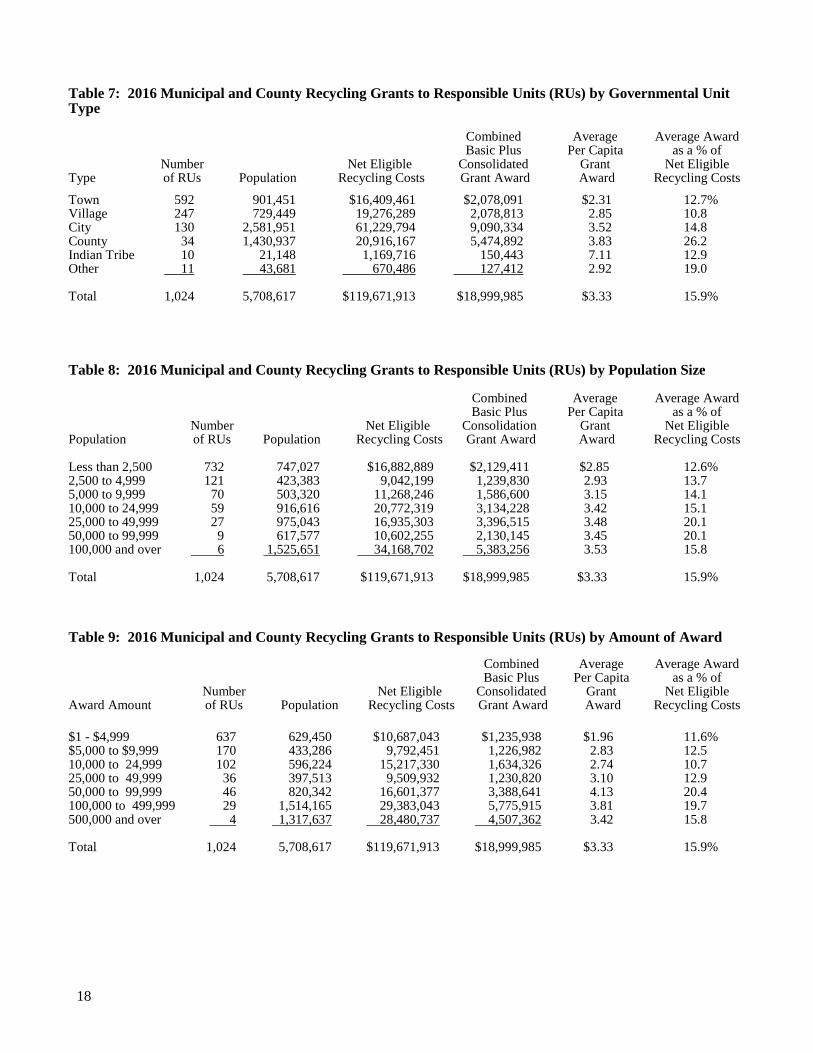
Table 7 shows the distribution of 2016 basic
plus consolidated grant awards by type of local
government unit. While 58% of the responsible
units were towns, towns represented 15.8% of the
population of responsible units that received
grant awards and 10.9% of the total grant award
dollars. Responsible units that are cities repre-
sented 45.2% of the population and 47.8% of the
total grant award dollars. While the statewide av-
erage award as a percent of the net eligible recy-
cling costs was 15.9% and the average award per
capita was $3.33, these measurements varied by
responsible unit.
Most of the responsible unit grant recipients
had populations under 2,500. As shown in the
Table 8 distribution by population size, the 732
responsible units with populations under 2,500
represented 71.4% of the responsible units that
received grants, 13.1% of the population served
through the grants and 11.2% of the total grant
award dollars in 2016. In comparison, six respon-
sible units with populations of 100,000 or greater
represented 0.6% of the responsible units, but
included 26.7% of the population that received
grants and 28.3% of the total grant award dollars
in 2016.
Table 9 lists the number and total dollar
amount of 2016 recycling grant awards received
by the size of the award and includes the popula-
tion represented within each category. Table 9
shows that 637 grant awards, totaling $1,235,938,
were less than $5,000 each, and were made to
responsible units representing a total population
of 629,450. These grants represent approximately
11.0% of the population of grantees and 6.5% of
the awarded grant dollars. Four grant awards
were each $500,000 or larger, totaling
$4,507,362, and were made to approximately
23.1% of the population served, with approxi-
mately 23.7% of the grant dollars awarded in
2016.
Table 6: Municipal and County Recycling Grants: Eligible Cost, Grant Award and Award as Percent of Costs ($ in Millions) Net Eligible Grant Award Calendar Recycling Award* as % of Net Year Costs Amount Eligible Costs
1992 $35.6 $18.5 52.0% 1993 48.5 23.7 48.9 1994 56.5 29.8 52.7 1995 61.0 29.1 47.7 1996 66.3 29.2 44.0
1997 68.8 29.2 42.4 1998 71.4 23.9 33.5 1999 73.3 24.1 32.9 2000 76.6 24.3 31.7 2001 84.1 24.3 28.9
2002 82.6 24.3 29.4 2003 84.4 26.3 31.2 2004 85.7 26.4 30.8 2005 90.1 26.3 29.2 2006 94.0 26.3 28.0
2007 98.4 26.3 26.7 2008 99.1 32.7 33.0 2009 108.0 29.3 27.2 2010 104.0 29.3 28.2 2011 103.5 19.0 18.3
2012 105.9 20.0 18.9 2013 109.3 20.0 18.3 2014 112.2 20.0 17.8 2015 116.7 20.0 17.1 2016** 119.7 19.0 15.9 *In the 2003 through 2011 grant years, includes basic grant plus efficiency incentive grant. As of 2012, includes basic grant plus consolidated grant. **Estimated net eligible recycling costs.
18
Table 7: 2016 Municipal and County Recycling Grants to Responsible Units (RUs) by Governmental Unit Type Combined Average Average Award Basic Plus Per Capita as a % of Number Net Eligible Consolidated Grant Net Eligible Type of RUs Population Recycling Costs Grant Award Award Recycling Costs
Town 592 901,451 $16,409,461 $2,078,091 $2.31 12.7% Village 247 729,449 19,276,289 2,078,813 2.85 10.8 City 130 2,581,951 61,229,794 9,090,334 3.52 14.8 County 34 1,430,937 20,916,167 5,474,892 3.83 26.2 Indian Tribe 10 21,148 1,169,716 150,443 7.11 12.9 Other 11 43,681 670,486 127,412 2.92 19.0 Total 1,024 5,708,617 $119,671,913 $18,999,985 $3.33 15.9% Table 8: 2016 Municipal and County Recycling Grants to Responsible Units (RUs) by Population Size Combined Average Average Award Basic Plus Per Capita as a % of Number Net Eligible Consolidation Grant Net Eligible Population of RUs Population Recycling Costs Grant Award Award Recycling Costs Less than 2,500 732 747,027 $16,882,889 $2,129,411 $2.85 12.6% 2,500 to 4,999 121 423,383 9,042,199 1,239,830 2.93 13.7 5,000 to 9,999 70 503,320 11,268,246 1,586,600 3.15 14.1 10,000 to 24,999 59 916,616 20,772,319 3,134,228 3.42 15.1 25,000 to 49,999 27 975,043 16,935,303 3,396,515 3.48 20.1 50,000 to 99,999 9 617,577 10,602,255 2,130,145 3.45 20.1 100,000 and over 6 1,525,651 34,168,702 5,383,256 3.53 15.8 Total 1,024 5,708,617 $119,671,913 $18,999,985 $3.33 15.9%
Table 9: 2016 Municipal and County Recycling Grants to Responsible Units (RUs) by Amount of Award Combined Average Average Award Basic Plus Per Capita as a % of Number Net Eligible Consolidated Grant Net Eligible Award Amount of RUs Population Recycling Costs Grant Award Award Recycling Costs
$1 - $4,999 637 629,450 $10,687,043 $1,235,938 $1.96 11.6% $5,000 to $9,999 170 433,286 9,792,451 1,226,982 2.83 12.5 10,000 to 24,999 102 596,224 15,217,330 1,634,326 2.74 10.7 25,000 to 49,999 36 397,513 9,509,932 1,230,820 3.10 12.9 50,000 to 99,999 46 820,342 16,601,377 3,388,641 4.13 20.4 100,000 to 499,999 29 1,514,165 29,383,043 5,775,915 3.81 19.7 500,000 and over 4 1,317,637 28,480,737 4,507,362 3.42 15.8 Total 1,024 5,708,617 $119,671,913 $18,999,985 $3.33 15.9%

19
Table 10 shows that the distribution of grants
by per capita category varied among responsible
units. Approximately 34.3% of the grantees, with
14.4% of the total grantee population, received
awards that averaged less than $2 per capita, with
awards averaging 8.7% of total net eligible recy-
cling costs. In comparison, 18 responsible units,
with 0.9% of the total grantee population, re-
ceived awards that averaged $8 and over per cap-
ita, with these awards averaging 22.4% of the net
eligible recycling costs of the 18 responsible
units.
Table 11 shows the grant award as a percent
of the net eligible recycling costs. The award as a
percent of net eligible recycling costs varied
widely, ranging from 1% to 100% of net eligible
recycling costs. In the group of 25 responsible
units that had awards that averaged 60% or more
of net eligible costs, the per capita award ranged
from $0.38 to $17. Six of the 25 responsible units
received awards equaling 100% of net eligible
recycling costs. The variation in the award as a
percent of net eligible cost is due to factors such
as what activities responsible units choose to in-
clude in their recycling program, what activities
responsible units included in 1999 when the cur-
rent formula was created (since 1999, responsible
units have received the same percentage of the
total grant as they received in 1999), the costs of
various curbside collection or drop-off collection
program components, and the costs of transporta-
tion of collection activities in densely or sparsely
populated responsible units.
Table 10: 2016 Municipal and County Recycling Grants to Responsible Units (RUs) by Award Per Capita
Combined Average Average Award Basic Plus Per Capita as a % of Number Net Eligible Consolidated Grant Net Eligible Award Per Capita of RUs Population Recycling Costs Grant Award Award Recycling Costs
$0.01 to $0.99 109 204,716 $1,972,455 $142,160 $0.69 7.2% 1.00 to 1.99 242 617,905 10,498,018 946,162 1.53 9.0 2.00 to 2.99 239 1,114,241 19,689,059 2,832,297 2.54 14.4 3.00 to 3.99 242 2,902,205 67,117,706 10,249,662 3.53 15.3 4.00 to 5.99 127 640,792 12,259,908 3,017,751 4.71 24.6 6.00 to 7.99 47 175,983 5,337,076 1,185,649 6.74 22.2 8.00 to 9.99 7 30,915 1,356,019 263,873 8.54 19.5 10.00 and over 11 21,860 1,441,672 362,432 16.58 25.1 Total 1,024 5,708,617 $119,671,913 $18,999,985 $3.33 15.9%
Table 11: 2016 Municipal and County Recycling Grants to Responsible Units (RUs) by Award as a Percent of Net Eligible Recycling Costs
Combined Average Average Award Award as % of Basic Plus Per Capita as a % of Net Eligible Number Net Eligible Consolidated Grant Net Eligible Recycling Costs of RUs Population Recycling Costs Grant Award Award Recycling Costs 0.1% to 9.99% 291 1,102,008 $37,435,598 $2,869,167 $2.60 7.7% 10 to 19.99 419 2,732,262 59,312,949 8,932,515 3.27 15.1 20 to 29.99 176 908,359 13,951,792 3,309,102 3.64 23.7 30 to 39.99 61 552,708 5,451,908 1,923,456 3.48 35.3 40 to 49.99 36 174,179 2,154,558 964,773 5.54 44.8 50 to 59.99 16 35,792 261,093 134,827 3.77 51.6 60 to 100 25 203,309 1,104,015 866,144 4.26 78.5 Total 1,024 5,708,617 $119,671,913 $18,999,985 $3.33 15.9%

20
Table 12: 2016 Municipal and County Recycling Grants to Responsible Units (RUs) - Largest 68 Grant Awards Includes All Awards of $60,000 or Greater
Combined Award Basic Plus Per Capita as a % of Net Eligible Consolidated Grant Net Eligible Municipality/County Population Recycling Costs Grant Award Award Recycling Costs Milwaukee, City 595,787 $11,777,187 $2,206,512 $3.70 18.7% Waukesha, County 279,902 7,067,245 992,735 3.55 14.0 Madison, City 242,216 8,086,652 765,263 3.16 9.5 Outagamie, County 199,732 1,549,653 542,852 2.72 35.0 Eau Claire, County 102,963 1,204,545 462,932 4.50 38.4 Green Bay, City 105,051 4,483,420 412,962 3.93 9.2 Kenosha, City 99,623 1,252,051 369,615 3.71 29.5 Racine, City 78,336 2,735,737 300,150 3.83 11.0 West Allis, City 60,329 1,585,679 241,535 4.00 15.2 Oshkosh, City 66,451 1,032,896 226,089 3.40 21.9 Janesville, City 63,510 995,677 215,379 3.39 21.6 Portage, County 62,624 1,101,036 209,780 3.35 19.1 Chippewa, County 58,610 664,163 207,636 3.54 31.3 Manitowoc, City 33,703 428,500 205,419 6.09 47.9 Oconto, County 38,147 458,808 197,249 5.17 43.0 Neenah, City 25,871 1,266,360 192,077 7.42 15.2 Pierce, County 42,240 649,290 191,444 4.53 29.5 Saint Croix, County 76,102 299,735 187,483 2.46 62.5 Sheboygan, City 48,806 1,220,616 184,100 3.77 15.1 Wauwatosa, City 46,947 872,669 176,949 3.77 20.3 La Crosse, City 51,992 935,281 172,477 3.32 18.4 Waupaca, County 41,586 595,518 164,579 3.96 27.6 Polk, County 44,167 419,528 151,750 3.44 36.2 Dunn, County 41,703 727,637 149,424 3.58 20.5 Fond du Lac, City 43,461 790,323 149,326 3.44 18.9 Wausau, City 39,063 614,855 140,362 3.59 22.8 Monroe, County 44,303 787,800 137,531 3.10 17.5 Vernon, County 30,370 648,105 135,251 4.45 20.9 Columbia, County 41,753 943,000 131,703 3.15 14.0 Beloit, City 36,792 864,784 131,133 3.56 15.2 Greenfield, City 36,473 684,030 118,339 3.24 17.3 Vilas, County 21,590 439,014 109,908 5.09 25.0 West Bend, City 31,599 681,986 103,335 3.27 15.2 Fitchburg, City 26,321 442,933 98,462 3.74 22.2 Superior, City 27,251 409,281 95,939 3.52 23.4 Watertown, City 23,864 1,138,059 94,191 3.95 8.3 Richland, County 17,208 199,927 93,919 5.46 47.0 Buffalo, County 10,795 227,901 93,854 8.69 41.2 Allouez, Village 13,790 520,975 93,704 6.80 18.0 De Pere, City 24,447 611,894 92,993 3.80 15.2 Adams, County 18,857 181,229 92,219 4.89 50.9 Oak Creek, City 34,791 689,516 89,837 2.58 13.0 Taylor, County 16,242 343,291 84,349 5.19 24.6 Barron, County 34,673 360,169 84,207 2.43 23.4 Iron, County 5,925 101,787 83,831 14.15 82.4

21
Table 12: 2016 Municipal and County Recycling Grants to Responsible Units (RUs) - Largest 65 Grant Awards Includes All Awards of $60,000 or Greater (continued)
Combined Award Basic Plus Per Capita as a % of Net Eligible Consolidated Grant Net Eligible Municipality/County Population Recycling Costs Grant Award Award Recycling Costs Burnett, County 15,213 $92,596 $83,245 $5.47 89.9% Waushara, County 23,699 231,166 82,923 3.50 35.9 Door, County 28,175 401,600 82,505 2.93 20.5 Jackson, County 20,327 185,400 80,728 3.97 43.5 Washburn, County 15,915 97,464 79,295 4.98 81.4 Two Rivers, City 11,593 343,722 78,808 6.80 22.9 Forest, County 9,287 106,248 77,559 8.35 73.0 South Milwaukee, City 21,142 460,726 77,179 3.65 16.8 Florence, County 4,474 78,997 76,298 17.05 96.6 Menominee, County 4,244 155,500 76,238 17.96 49.0 Menomonee Falls, Village 35,928 510,500 76,219 2.12 14.9 Marquette, County 14,370 79,008 75,143 5.23 95.1 Weston, Village 15,931 357,525 74,783 4.69 20.9 Rusk, County 13,326 71,438 71,438 5.36 100.0 Monroe, City 10,768 389,800 70,510 6.55 18.1 Wisconsin Rapids, City 18,577 479,427 68,687 3.70 14.3 Ashwaubenon, Village 16,940 454,512 68,614 4.05 15.1 Oneida, County 27,081 201,700 67,680 2.50 33.6 Menasha, City 17,633 667,613 66,860 3.79 10.0 Franklin, City 35,655 484,948 65,995 1.85 13.6 Pepin, County 8,191 82,759 64,028 7.82 77.4 Cudahy, City 18,250 542,267 63,477 3.48 11.7 Whitefish Bay, Village 14,243 419,857 60,523 4.25 14.4 Largest Grants, $60,000 or Greater 3,486,928 $69,985,515 $13,069,519 $3.75 18.7% Small Grants Less Than $60,000 2,221,689 $49,686,398 $5,930,466 $2.67 11.9% Statewide Total, 1,024 Grants 5,708,617 $119,671,913 $18,999,985 $3.33 15.9% 68 Largest Grants, % of Total 61.1% 58.5% 68.8%
Table 12 lists the 68 responsible units with
grant awards of $60,000 or greater for the 2016
grant year. These responsible units include 30
cities, 33 counties, and five villages. Grants to the
68 responsible units include 61.1% of the total
grantee population and 68.8% of the total grant
award dollars paid.
The grant award for the 68 responsible units
as a percent of net eligible recycling costs varied
from 10% to 100%, depending on the 1999 grant
amount and estimated net eligible costs.
Recycling Consolidation Grant Program
In 2011 Wisconsin Act 32, a recycling consol-

22
idation grant program was created. The program
has been appropriated $1,000,000 annually 2011-
12 through 2016-17 from the segregated envi-
ronmental management account.
DNR is required to distribute the funds on a
per capita basis to responsible units that operate
effective recycling programs and meet one of the
following criteria:
1. The responsible unit is a county.
2. The responsible unit is a federally recog-
nized Indian tribe or band.
3. The responsible unit has a population of
25,000 or more and consists of one or more mu-
nicipalities.
4. The responsible unit is not eligible under
(1) through (3) above, but one of the following
applies by October 1 in the year before the grant
year: (a) the responsible unit consists of what had
previously been at least two responsible units; or
(b) the responsible unit enters into a cooperative
agreement with another responsible unit for the
joint provision of at least one of the following
elements of an effective recycling program: (1)
performing comprehensive program planning; (2)
collecting and transporting recyclable materials;
(3) sorting recyclable materials at a materials re-
covery facility; (4) developing and distributing
education materials relating to waste reduction,
reuse, and recycling; (5) carrying out a program
of technical assistance to businesses and owners
and occupants of multifamily dwellings to in-
crease the availability and convenience of recy-
cling; or (6) any other program element approved
by DNR.
The sum of the recycling consolidation grant
and basic grant for specific responsible units can-
not exceed the amount of eligible recycling costs.
Table 13 summarizes the recycling consolidation
grants awarded in 2011-12 through 2015-16 by
type of eligibility. Counties are listed only under
"County" if they have a population that exceeds
25,000, or could have also qualified through a
cooperative agreement. Cities or villages with a
population over 25,000 are only listed in that cat-
egory if they could have also qualified through a
cooperative agreement. The table also includes
the number of responsible units that received re-
cycling consolidation grants, total population of
those responsible units, and the per capita award
amount.
Electronics Recycling Program
DNR administers the electronics recycling
program established under 2009 Wisconsin Act
50. DNR refers to the program as "E-Cycle Wis-
consin." The program includes requirements for
sales and recycling of covered electronic devices
used by households, public K-12 schools, and
private school choice program schools (covered
schools). It also includes requirements for manu-
facturers, retailers, collectors, and recyclers of
covered electronic devices. Covered electronic
devices include televisions and computer moni-
tors with a tube or screen at least seven inches at
its longest diagonal measurement, computers, and
printers.
Sale of Covered Electronic Devices
Since February 1, 2010, a manufacturer may
only sell, offer to sell, or deliver to a retailer for
subsequent sale, covered electronic devices to
households or covered schools if the manufactur-
er labels the devices, recycles or arranges for re-
cycling the devices, registers with DNR, pays
annual registration fees, submits annual reports to
DNR, finances and ensures the recycling of a cer-
tain amount of electronics annually, and pays
shortfall fees if it recycles less than certain target
amounts.
Beginning July 1, 2010, a retailer may only

23
Table 13: Recycling Consolidation Grants Eligibility Number Award Category of RUs Population Amount 2012 Grants County 34 1,415,318 $375,354 Indian Tribe 10 21,148 5,609 Population > 25,000 25 1,908,697 506,201 Cooperative agreement 117 425,464 112,836 Total 186 3,770,627 $1,000,000 Per Capita grant = $0.265 2013 Grants County 34 1,453,432 $381,054 Indian Tribe 10 21,148 5,544 Population > 25,000 25 1,875,851 491,802 Cooperative agreement 124 463,810 121,600 Total 193 3,814,241 $1,000,000 Per Capita grant = $0.262 2014 Grants County 34 1,421,483 $371,109 Indian Tribe 10 21,148 5,507 Population > 25,000 25 1,916,875 499,187 Cooperative agreement 134 476,915 124,197 Total 203 3,836,421 $1,000,000 Per Capita grant = $0.261 2015 Grants County 34 1,425,425 $371,877 Indian Tribe 10 21,148 5,517 Population > 25,000 25 1,920,734 501,097 Cooperative agreement 132 465,752 121,509 Total 201 3,833,059 $1,000,000 Per Capita grant = $0.261 2016 Grants County 34 1,430,937 $374,760 Indian Tribe 10 21,148 5,539 Population > 25,000 25 1,924,140 503,930 Cooperative agreement 124 442,047 115,772 Total 193 3,818,272 $1,000,000 Per Capita grant = $0.262
sell or offer to sell a new covered electronic
device to a household or covered school if the
retailer determines that the brand of covered
electronic device is on the DNR's Internet site list
of registered manufacturers. If a manufacturer's
registration is revoked or expires, the retailer may
only sell the covered electronic device within 180
days after the revocation or expiration. A retailer
is required to provide information to purchasers
describing how eligible electronic devices can be
collected and recycled, and a description of the
ban on disposing of the devices in landfills or
incinerators.
Requirements for Manufacturers
The program defines manufacturers as any
person who: (a) manufactures covered electronic
devices to be sold under the person's own brand;
(b) sells covered electronic devices manufactured
by someone else under the person's own brand; or
(c) licenses the person's brand for manufacture
and sale of covered electronic devices by others.

24
Registration and Recycling Targets. Manu-
facturers are required to register with DNR annu-
ally by September 1. Manufacturers must include
information in the registration about the brands
and weight of covered electronic devices they sell
in the state, the total weight of eligible electronic
devices used by households or covered schools
that were collected by or delivered to the manu-
facturer for recycling, and other required infor-
mation.
From July 1, 2015, through June 30, 2016,
189 manufacturers submitted registrations of
covered electronic devices in the fall of 2015. For
the period July 1, 2016, through June 30, 2017,
164 manufacturers submitted registrations by
September 1, 2016, and DNR anticipated there
would be a small number of additional registra-
tions.
A manufacturer is required to achieve a recy-
cling target every year, that is, to achieve a speci-
fied amount of recycling of electronic devices, as
determined by weight and a specified formula. A
manufacturer is required to recycle 80% of the
weight of covered electronic devices it sold to
households and covered schools during the 12-
month period two years earlier.
A manufacturer may recycle a broader catego-
ry of "eligible electronic devices" to meet its re-
cycling target. Eligible electronic devices include
covered electronic devices (computers, printers,
monitors, and televisions), plus devices used by
households or covered schools that include com-
puter peripherals (such as keyboards, external
hard drives, flash drives, modems, mice, scan-
ners, and speakers used with a computer), facsim-
ile machines, digital video disc (DVD) players,
video cassette recorders (VCR), and digital video
recorders or players that do not use discs or cas-
settes. DNR is authorized to promulgate adminis-
trative rule changes to add or subtract types of
electronic devices from the list of eligible elec-
tronic devices. As of the fall of 2016, DNR has
not initiated such rule changes.
Manufacturers are subject to a forfeiture of
not more than $10,000 per violation of the elec-
tronics recycling statutes.
In DNR's report to the Legislature submitted
in December, 2016, the Department reported that
in 2016, DNR issued five notices of noncompli-
ance to manufacturers who were not in com-
plaince with program requirements. Four of the
manufacturers came into compliance without fur-
ther enforcement action and DNR determined the
fifth had gone out of business.
Registration and Shortfall Fees and Cred-
its. DNR is required to assess annual registration
and shortfall fees to manufacturers. The fees are
deposited in the environmental management ac-
count of the environmental fund, are only availa-
ble for expenditure under an appropriation for
DNR administration of the electronics recycling
program, and cannot be used for other appropria-
tions from the account.
A manufacturer is required to pay annual reg-
istration fees by September 1, based on the num-
ber of covered electronic devices it sold during
the previous program year (July 1 to June 30).
The fees include: (a) $0, if less than 25 devices
were sold; (b) $1,250 if 25 to 249 devices were
sold; and (c) $5,000 if at least 250 devices were
sold. DNR may promulgate an administrative
rule to change the registration fee for manufac-
turers that sell at least 250 devices in the state
annually. As of the fall of 2016, DNR had not
initiated such rule changes.
In its annual report, the manufacturer is re-
quired to report on the weight of eligible elec-
tronic devices that it recycled during the prior
program year. If the manufacturer does not meet
its recycling target, that is, it recycles substantial-
ly fewer electronic devices than it sells, it must
pay an annual shortfall fee to DNR.
Shortfall fees are calculated on a graduated
scale determined by how short of the target recy-

25
cling weight the manufacturer's actual collections
were. The fees are calculated by first subtracting
the actual recycling weight from the target recy-
cling weight. The manufacturer is allowed to
multiply the total recycled weight that it recycled
by 1.25 for eligible electronic devices that it col-
lects in rural counties. This is intended to provide
an incentive for manufacturers to collect eligible
electronic devices for recycling in rural areas.
The statutes designate 33 urban and 39 rural
counties for purposes of the collection incentive.
The resulting number of pounds is used to
calculate the shortfall fees as follows: (a) 50
cents per pound if the actual weight recycled is
less than 50% of the target recycling weight; (b)
40 cents per pound if the actual weight recycled
is at least 50% but not more than 90% of the tar-
get recycling weight; and (c) 30 cents per pound
if the actual weight recycled is more than 90%
and less than 100% of the target recycling
weight.
Table 14 shows the amount of manufacturer
registration and shortfall fees collected in 2009-
10, the first year of the program, through 2015-
16. In 2014-15, approximately 79 of 132 regis-
tered manufacturers paid registration fees totaling
$320,000. The registered manufacturers who did
not pay fees were exempt from fees because they
sold fewer than 25 units.
In 2015-16, approximately 108 of 189 regis-
tered manufacturers paid registration fees totaling
an estimated $405,700. In 2015-16, an estimated
$20,500 was received for shortfall fees from ap-
proximately 31 manufacturers assessed for the
2014-15 program year. As of December 1, 2016,
DNR had not finalized 2015-16 revenues or ex-
penditures.
A manufacturer earns a recycling credit if, for
a program year, the weight of eligible electronic
devices recycled exceeds the target recycling
weight. The manufacturer would be entitled to a
number of recycling credits equal to the number
of excess pounds or 20% of the target recycling
weight, whichever is less. During the three suc-
ceeding program years, the manufacturer could
use the credits to help meet its recycling target
during that time, or could sell the credits to an-
other manufacturer. In the program year ending
June 30, 2015, manufacturers earned recycling
credits totaling almost 1.6 million pounds, and
applied just over 1.6 million pounds to meet re-
cycling targets. In the program year ending June
30, 2016, manufacturers earned recycling credits
totaling almost 330,000 pounds and applied just
over 1.0 million pounds to meet recycling targets.
There were almost 3.0 million recycling credits
available for manufacturers to use or sell to other
manufacturers in years after June 30, 2016.
A manufacturer may submit, with its registra-
tion, a request for relief from the shortfall fee in
that year. The manufacturer would have to sub-
mit information showing that it made good faith
progress toward meeting its target recycling
weight. If DNR determines that the manufacturer
has made good faith progress toward meeting its
target recycling weight, the Department would
waive the shortfall fee. If not, DNR would notify
the manufacturer, and the manufacturer would
have to pay the shortfall fee within 60 days after
receiving the notification. As of October, 2016,
no manufacturers had submitted a request.
Table 14: Electronics Recycling Program -- Manufacturer Fees Collected
Registration Shortfall Year Fees Fees Total
2009-10 $261,250 $0 $261,250 2010-11 270,000 0 270,000 2011-12 275,000 8,453 283,453 2012-13 310,000 19,210 329,210 2013-14 310,000 10,105 320,105
2014-15 320,000 9,472 329,472 2015-16* 405,667 20,472 426,139 *2015-16 includes estimated revenues. As of December 1, 2016, DNR had not finalized actual amounts.

26
Requirements for Collectors and Recyclers
The program specifies that collectors are per-
sons who receive electronic devices from house-
holds or covered schools and deliver them to re-
cyclers. Recyclers accept electronics from collec-
tors, households and schools, for the purpose of
recycling.
Collectors and recyclers are required to regis-
ter with DNR annually by August 1. Collectors
are required to report to DNR the total weight of
eligible electronic devices collected during the
preceding program year, and the names of the
recyclers to whom the collector delivered the
electronic devices. Registered collectors and re-
cyclers may not use prison labor to collect or re-
cycle eligible electronic devices.
Registered recyclers are required to meet ad-
ditional requirements. These relate to maintaining
specified liability insurance, proof of financial
responsibility, specific records, a contingency
plan for responding to releases of hazardous sub-
stances, and compliance with federal, state, and
local requirements for storing, transporting, pro-
cessing, and exporting eligible electronic devices.
Collectors and recyclers are not subject to reg-
istration fees. DNR reported that 147 collectors
and 20 recyclers were registered with DNR for
the program year July 1, 2015, through June 30,
2016. As of October, 2016, 132 collectors and 20
recyclers had registered with DNR for the pro-
gram year July 1, 2016, through June 30, 2017,
and DNR anticipated there would be some addi-
tional registrations.
Between July 1, 2015, and June 30, 2016, reg-
istered collectors collected 32.4 million pounds
of eligible electronics at 512 registered collection
sites, including at 393 permanent and 119 tempo-
rary or event sites. Of the total amount collected,
approximately 29.7 million pounds (92%) was
from urban counties. Of the total amount collect-
ed in 2015-16, 61% of the weight collected was
televisions, 9% was computers, 7% was comput-
er monitors, and 23% was other eligible electron-
ics such as printers. For the first seven program
years, a cumulative total of 223.6 million pounds
of electronics was collected between January 1,
2010, and June 30, 2016.
DNR is authorized to audit, or contract for the
audit of a registered collector or recycler. If the
Department does so during the first three years in
which the collector or recycler is registered, the
collector or recycler is required to pay 25% of the
cost of the audit. After the first three years, the
collector or recycler will pay 50% of the cost of
the audit. The costs paid by the collector or recy-
cler will be deposited in the electronics recycling
appropriation. As of the fall of 2016, DNR had
not audited any registered collector or recycler.
Collectors and recyclers are subject to a for-
feiture of not more than $1,000 per violation.
In DNR's December, 2016, report, the De-
partment stated that it inspected seven recyclers
and 37 collection sites between July 1, 2015, and
June 30, 2016.
DNR Administration
DNR is responsible for administration and
collection of electronics recycling program fees,
compliance and enforcement, and outreach. DNR
is required to maintain an Internet site on which it
lists the names of registered manufacturers, the
names of brands of electronics listed in the manu-
facturers' registrations, and the names of regis-
tered collectors and recyclers.
DNR allocates 2.0 positions from the envi-
ronmental management account to administer the
electronics recycling program. One of the posi-
tions is appropriated in an environmental man-
agement account appropriation authorized to
spend only any electronics registration and short-
fall fees. The appropriation may spend all mon-
eys received from the fees, so the appropriation

27
amount is an estimate. The remaining position is
appropriated through the DNR recycling adminis-
trative appropriation, which is funded from envi-
ronmental management account revenues other
than the electronics fees.
DNR utilizes the positions to coordinate the
program, interpret policy, prepare guidance doc-
uments, develop administrative rules, manage
and track registrations, manage annual reporting
by entities regulated by the program, collect fees,
prepare the annual legislative report required by
statute, maintain a computer system for the pro-
gram, provide outreach and technical assistance,
perform enforcement and compliance, conduct
inspections of registered recyclers and collectors,
and perform public outreach. During the 2015-17
biennium, DNR also paid for two limited-term
employees to increase retailer compliance, in-
spect registered collectors and recyclers, develop
compliance and technical assistance materials,
identify new types of electronics, and perform
program evaluation. DNR also used electronics
fee revenues to purchase national sales data relat-
ed to sales and recycling of electronics, pay for
informational technology improvements to re-
porting and registration, conduct a statewide
household survey about electronics, perform pub-
lic outreach about the law, and conduct a stake-
holders meeting.
DNR is required to submit an annual report by
December 1, beginning in 2012, to the Legisla-
ture and Governor, which includes specified in-
formation related to collection of electronic de-
vices, information provided by manufacturers
and recyclers under the program, information
about disposal of eligible electronic devices in
landfills, enforcement, and recommendations.
DNR submitted its first annual report in 2012,
has submitted reports in December of each of
2013 through 2016. The report submitted in De-
cember, 2016, included the following infor-
mation: (a) almost all manufacturers met or ex-
ceeded their recycling targets, with only a small
number paying a shortfall fee; (b) the vast ma-
jority of manufacturers, recyclers and collectors
are complying with the law; (c) some Wisconsin
residents are still putting electronics in the trash
or illegally disposing of them; (d) there were reg-
istered collection sites in 63 of 72 counties; and
(e) DNR has increased compliance assistance and
enforcement measures.
In the 2016 report, DNR recommended to: (a)
consider changing the annual program year to
correspond to a calendar year rather than the state
fiscal year; (b) eliminate registration fees for
small manufacturers; (c) modify the definition of
covered school to include all K-12 schools (cur-
rently K-12 public schools and private school
choice schools); (d) modify the manufacturer tar-
get formula to be based on the total weight of
electronics received for recycling in previous
years; (e) modify the rural collection incentive
formula to increase access to electronics collec-
tion in rural areas of the state; and (f) update and
clarify definitions of electronics devices.
If the federal government enacts a law relating
to the collection and recycling of covered elec-
tronic devices sold in the United States, DNR
will be required to prepare a report describing the
effect of the federal law and to submit it to the
Legislature's standing committees with jurisdic-
tion over solid waste policy. As of the fall of
2016, there have been no federal law changes re-
lated to the collection and recycling of electronic
devices.
Department of Natural
Resources Activities
DNR Recycling Staff
In 2016-17, DNR is authorized 20.4 positions
from the segregated environmental management
account for work on various recycling activities.

28
This includes the following:
1. The Bureau of Waste and Materials
Management in the Division of Air, Waste and
Remediation and Redevelopment is authorized
14.5 positions. Staff in the central office perform
policy development, administrative, planning,
evaluation, markets directory, data management,
informational and educational functions. In 2016,
regional staff functions were transferred to the
central office to provide technical assistance and
outreach to local governments on recycling, track
and enforce compliance with conditions of ap-
proved effective recycling programs, and process
applications for the municipal and county grant
program. Regional staff provide support to cen-
tral staff related to the functions transferred from
the regions to the central office. In addition, re-
gional staff provide plan review and technical
assistance related to recycling facilities, and for
solid waste facilities with a purpose related to
recycling, such as facilities that process recycla-
ble materials into usable products. Earlier sec-
tions of the paper describe DNR's responsibilities
related to administration of compliance with ef-
fective program requirements. Of the 14.5 posi-
tions, 2.0 positions staff the electronics recycling
program. One of the two positions is funded sole-
ly from electronics recycling revenues, and the
other position is funded from undesignated envi-
ronmental management account revenues.
2. The Bureau of Environmental Analysis
and Sustainability is authorized 1.0 business sec-
tor specialist to work with communities and busi-
nesses to manage improved performance in busi-
ness recycling.
3. Administration of the recycling grant
programs is performed by 2.0 positions in the Bu-
reau of Community Financial Assistance in the
Division of Customer and Employee Services.
4. Recycling enforcement activities are per-
formed by 2.4 positions in the Law Enforcement
program. This is provided by allocating a portion
of the time of environmental wardens throughout
the state. DNR regional recycling specialists also
work on enforcement issues.
5. DNR also has accounting, purchasing
and other financial management recycling-related
responsibilities that are performed by 0.5 posi-
tion.
Technical Assistance and Information
DNR is responsible for providing technical
assistance and comprehensive public information.
DNR is required to provide technical assistance
to individuals, groups, businesses, state agencies,
counties and municipalities in all aspects of recy-
cling, with an emphasis on documents and mate-
rial that is easy to read and understand by the
general public. This includes: (a) providing in-
formation about how to perform a study related
to the composition of solid waste; (b) maintaining
current estimates of the amount of components of
solid waste generated by categories of businesses,
industries, municipalities and other governmental
entities; (c) providing information about how to
manage solid waste consistent with the state's
solid waste management priorities; and (d)
providing technical assistance to local recycling
programs.
The Department is required to collect, prepare
and disseminate information, and conduct educa-
tional and training programs that assist in the im-
plementation of the solid waste management pro-
grams. The educational programs must inform
the public of the relationship between an individ-
ual's consumption of goods and services, the gen-
eration of different types and quantities of solid
waste and the implementation of the solid waste
management priorities. DNR is also required to
prepare educational programs on a statewide ba-
sis for the following audiences: (a) municipal,
county and state officials and employees; (b) kin-
dergarten through graduate students and teachers;
(c) private solid waste scrap brokers, dealers and
processors; (d) businesses that use or could use

29
recycled materials or that produce or could pro-
duce products from recycled materials and per-
sons who serve or support these businesses; and
(e) the general public.
During the 2015-17 biennium, DNR accom-
plished these responsibilities by focusing on sev-
eral activities that are listed below:
1. Prepared, updated, and distributed fact
sheets, newsletters, updates, and publications re-
lated to general recycling issues and specific
types of recycling.
2. Continued to improve DNR Internet web
sites to provide information about recycling pro-
grams, legislation, and grant opportunities.
3. Provided communication and education
tools and resources to responsible units for distri-
bution to their residents, businesses, and institu-
tions.
4. Participated in an Internet-based green
and healthy school program in partnership with
the Wisconsin Department of Public Instruction
and other entities by conducting workshops and
conferences, and producing a monthly electronic
newsletter.
5. Worked with businesses to increase recy-
cling opportunities and use recycled materials in
operations.
6. Worked with the UW-Extension Solid
and Hazardous Waste Education Center and UW-
Green Bay to maintain an online recycling mar-
kets database.
7. Developed recycling signs for use in ef-
forts to increase recycling of light bulbs, batter-
ies, pesticides, antifreeze and mercury-containing
items.
8. Participated in and promoted the Wis-
consin WRAP initiative (Wrap Recycling Action
Program) to increase recycling of plastic film,
wrap, and bags in the state.
9. Worked with various associations, busi-
nesses, and local governments to increase recy-
cling of bottles and rigid plastics.
10. Presented and exhibited at various con-
ferences and fairs on issues such as general recy-
cling and waste reduction, business and event
recycling, plastic film recycling, composting,
electronics, and open burning.
11. Worked with coordinators and solid
waste haulers for several large special events to
improve access to recycling by event participants
and food vendors.
12. Developed and promoted recycling initia-
tives for monofilament fishing lines (fishing line
made from a single fiber of plastic) and agricul-
tural plastics.
13. Worked with the Department of Agricul-
ture, Trade and Consumer Protection to develop a
survey on paint management methods and costs.
Newspaper Recycled Content Target and Fees
Beginning in 1998, printers and publishers of
newspapers and some shopper guides were re-
quired to use newsprint that averaged 33% or
more of post-consumer recycled content. The
percentage increased from 10% in 1992 (the first
year it was required), during the following sever-
al years.
DNR was required to assess a newspaper re-
cycling fee annually to the publisher of a news-
paper that failed to meet the recycled content tar-
gets. Printers and publishers were required to re-
port annually to DNR on their compliance with
the requirements of the newspaper recycled con-
tent requirement. Fees totaling $59,000 were paid
for 1992 through 2011. DNR did not assess any
fees after 2011. The fees were deposited in the
environmental management account. DNR esti-
mated that, in 2013, the statewide average recy-

30
cled content was 25.6%.
Under 2015 Wisconsin Act 7, the newsprint
recycled requirement and fee were eliminated.
Council on Recycling
The Council on Recycling was statutorily cre-
ated in 1989 as a part-time advisory body ap-
pointed by the Governor to promote the efficient
and prompt implementation of state programs
relating to solid waste reduction, recovery and
recycling and to advise and assist state and local
agencies in the coordination of these programs
and the exchange of information related to these
activities. There are seven Council members rep-
resenting business, government, and the public at
large. Each member serves a four-year term. The
Council is staffed by DNR.
In addition to the general functions, the Coun-
cil is directed to: (a) advise state agencies con-
cerning the promulgation of administrative rules
related to solid waste reduction, recovery and re-
cycling; (b) advise DNR and the University of
Wisconsin system concerning educational efforts
and research related to these activities; (c) in co-
operation with the packaging industry, recom-
mend standards for recyclable packaging; (d) de-
velop recommendations, advise and assist local
officials and the automotive service industry to
promote the recycling of used oil filters; (f) ad-
vise DNR concerning the development of a
statewide plan for public service announcements
that would provide information about recycling
programs and the benefits of recycling; and (g)
advise the Governor and the Legislature.
During 2015 and 2016, the Council worked
on the following activities: (a) studied electronics
recycling efforts and the costs of recycling elec-
tronics; (b) educated themselves on the recycling
of rigid plastics by industries and businesses; (c)
supported efforts to continue state funding for
recycling programs; (d) discussed recycling of
paint, pharmaceuticals, mattresses, batteries, and
propane cylinders; and (e) discussed future pri-
orities for the Council's work in the areas of plas-
tics, education and outreach, impacts of products
from production to disposal or recycling (product
stewardship), construction and demolition mate-
rials, diversion of organic materials from land-
fills, and funding for recycling programs.
Department of Agriculture, Trade and
Consumer Protection Clean Sweep Grants
The clean sweep program provides grants to
counties and municipalities for the collection of
pesticides, farm chemicals, and hazardous wastes
from farmers, businesses, households, schools,
and government agencies. 2003 Wisconsin Act
33 created the program under DATCP by consol-
idating DATCP's agricultural chemical and pesti-
cide collection program with DNR's household
hazardous waste grant program. The program
was further expanded under 2007 Wisconsin Act
20 to allow grants for the collection and disposal
of unwanted prescription drugs. The program is
currently administered under ATCP 34. Base
funding for the program is $750,000 SEG annual-
ly from the environmental management account.
The statutes provide that DATCP must award
at least two-thirds of the funding available annu-
ally for clean sweep grants for household hazard-
ous waste and pharmaceuticals collections. Grant
awards are made to reimburse incurred local
costs, with municipalities required to fund at least
25% of the clean sweep project costs, either with
cash or in-kind services. No maximum grant
award is set in statute or administrative code, al-
though DATCP determines the maximum grant
internally each grant cycle in an attempt to pro-
vide most eligible applicants with some level of
funding. Table 15 shows maximum amounts es-
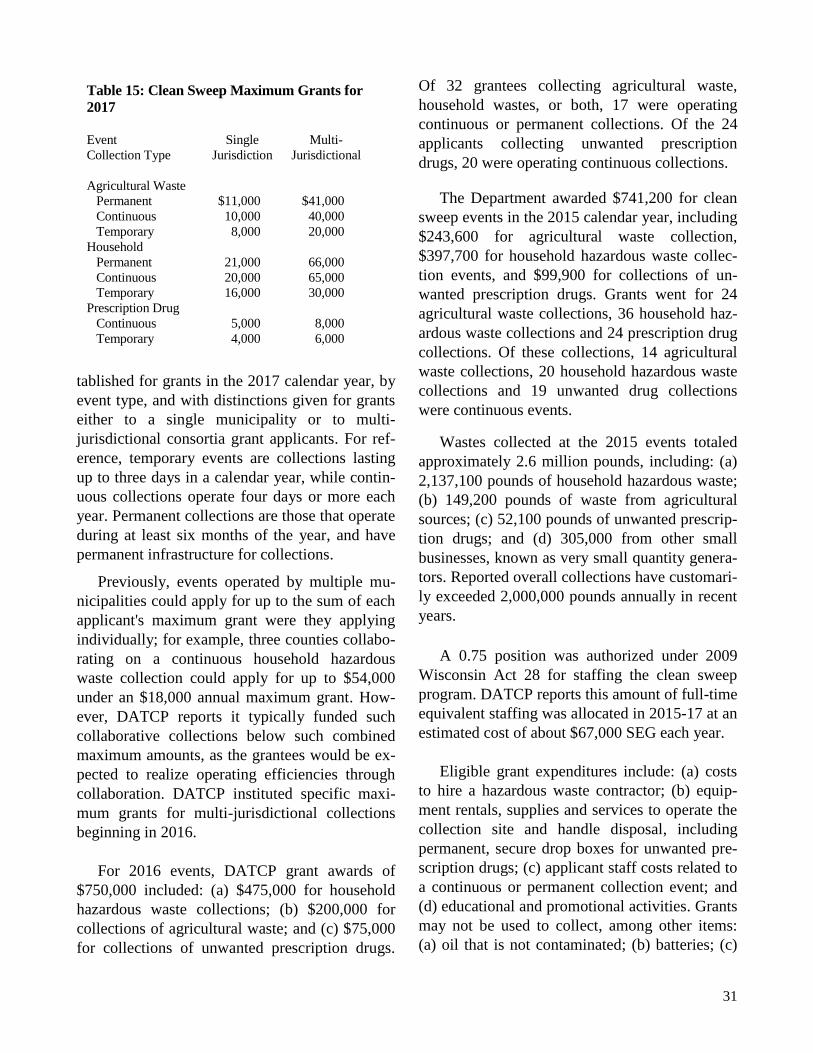
31
tablished for grants in the 2017 calendar year, by
event type, and with distinctions given for grants
either to a single municipality or to multi-
jurisdictional consortia grant applicants. For ref-
erence, temporary events are collections lasting
up to three days in a calendar year, while contin-
uous collections operate four days or more each
year. Permanent collections are those that operate
during at least six months of the year, and have
permanent infrastructure for collections.
Previously, events operated by multiple mu-
nicipalities could apply for up to the sum of each
applicant's maximum grant were they applying
individually; for example, three counties collabo-
rating on a continuous household hazardous
waste collection could apply for up to $54,000
under an $18,000 annual maximum grant. How-
ever, DATCP reports it typically funded such
collaborative collections below such combined
maximum amounts, as the grantees would be ex-
pected to realize operating efficiencies through
collaboration. DATCP instituted specific maxi-
mum grants for multi-jurisdictional collections
beginning in 2016.
For 2016 events, DATCP grant awards of
$750,000 included: (a) $475,000 for household
hazardous waste collections; (b) $200,000 for
collections of agricultural waste; and (c) $75,000
for collections of unwanted prescription drugs.
Of 32 grantees collecting agricultural waste,
household wastes, or both, 17 were operating
continuous or permanent collections. Of the 24
applicants collecting unwanted prescription
drugs, 20 were operating continuous collections.
The Department awarded $741,200 for clean
sweep events in the 2015 calendar year, including
$243,600 for agricultural waste collection,
$397,700 for household hazardous waste collec-
tion events, and $99,900 for collections of un-
wanted prescription drugs. Grants went for 24
agricultural waste collections, 36 household haz-
ardous waste collections and 24 prescription drug
collections. Of these collections, 14 agricultural
waste collections, 20 household hazardous waste
collections and 19 unwanted drug collections
were continuous events.
Wastes collected at the 2015 events totaled
approximately 2.6 million pounds, including: (a)
2,137,100 pounds of household hazardous waste;
(b) 149,200 pounds of waste from agricultural
sources; (c) 52,100 pounds of unwanted prescrip-
tion drugs; and (d) 305,000 from other small
businesses, known as very small quantity genera-
tors. Reported overall collections have customari-
ly exceeded 2,000,000 pounds annually in recent
years.
A 0.75 position was authorized under 2009
Wisconsin Act 28 for staffing the clean sweep
program. DATCP reports this amount of full-time
equivalent staffing was allocated in 2015-17 at an
estimated cost of about $67,000 SEG each year.
Eligible grant expenditures include: (a) costs
to hire a hazardous waste contractor; (b) equip-
ment rentals, supplies and services to operate the
collection site and handle disposal, including
permanent, secure drop boxes for unwanted pre-
scription drugs; (c) applicant staff costs related to
a continuous or permanent collection event; and
(d) educational and promotional activities. Grants
may not be used to collect, among other items:
(a) oil that is not contaminated; (b) batteries; (c)
Table 15: Clean Sweep Maximum Grants for
2017
Event Single Multi-
Collection Type Jurisdiction Jurisdictional
Agricultural Waste
Permanent $11,000 $41,000
Continuous 10,000 40,000
Temporary 8,000 20,000
Household
Permanent 21,000 66,000
Continuous 20,000 65,000
Temporary 16,000 30,000
Prescription Drug
Continuous 5,000 8,000
Temporary 4,000 6,000

32
contaminated soil or debris; (d) fluorescent tubes;
(e) triple-rinsed plastic pesticide containers; (e)
materials or devices that may be disposed of at
other waste or recycling sites; (f) personal care
products; (g) infectious waste and hypodermic
needles; and (h) chemicals for which there is no
federally approved or state-approved disposal
method.
Very small-quantity generators (VSQGs) gen-
erally are firms that do not produce more than
100 kilograms (220 pounds) of hazardous waste
in any given month. Commercial firms that quali-
fy as VSQGs are allowed to bring in hazardous
wastes for disposal at clean sweep sites. VSQGs
are eligible for up to a 50% subsidy from DATCP
for disposal of pesticides or other approved farm
chemical wastes, but must pay the full disposal
costs of other hazardous chemicals. VSQGs must
register with the collecting agency or hazardous
waste contractor. The collecting agency or con-
tractor must keep records of the amount of waste
collected from the VSQG, the total cost to collect
and dispose of this waste, and the total amount of
payments received from the generator. For 2015
collections, DATCP reimbursed grantees approx-
imately $2,100 for costs of disposing of VSQG-
generated waste. The Department set aside
$2,000 for VSQG reimbursements for 2016 and
2017 events.
University of Wisconsin System Past Funding
Prior to 2015-16, the UW System received
$155,400 SEG annually from the environmental
fund for research into alternative methods of sol-
id waste management and to administer solid
waste experiment centers. The Solid Waste Re-
search Council awarded research funds. Prior to
2015-16, the University of Wisconsin - Extension
Solid and Hazardous Waste Education Center
(SHWEC) received $388,300 SEG annually from
the environmental fund to provide educational
and technical assistance programs in recycling
and recycling market development. Under 2015
Wisconsin Act 55, funding from the environmen-
tal fund for these purposes was repealed.