Recycling DRS in Scotland DRS in... · Value-driven consulting Science-led research Recycling DRS...
150
Value-driven consulting Science-led research Recycling DRS in Scotland A report to provide the glass packaging industry with the evidence to inform debate on the potential impact of the introduction of a recycling DRS for beverage containers in Scotland that includes glass beverage bottles September 2019
Transcript of Recycling DRS in Scotland DRS in... · Value-driven consulting Science-led research Recycling DRS...

Value-driven consulting Science-led research
Recycling DRS in Scotland A report to provide the glass packaging industry with the evidence
to inform debate on the potential impact of the introduction of a recycling DRS for beverage containers in Scotland that includes glass beverage bottles
September 2019

Recycling DRS in Scotland Written by: Dr Peter Lee, Dr Nia Bell, Tania Garcia, Oliver Lee
and Jake Harding Final check by: Katie Baker Approved by: Date: 6 September 2019 Contact: [email protected] Reference: FEVE09 495.docx Disclaimer: This disclaimer, together with any limitations specified in the report, applies to use of this report. This report was prepared in accordance with the contracted scope of services for the specific purpose stated and subject to the applicable cost, time and other constraints. In preparing this report, Oakdene Hollins Ltd relied on (1) client/third party information which was not verified by Oakdene Hollins except to the extent required in the scope of services (and Oakdene Hollins does not accept responsibility for omissions or inaccuracies in the client/third party information) and (2) information taken at or under the particular times and conditions specified (and Oakdene Hollins does not accept responsibility for any subsequent changes). This report has been prepared solely for use by and is confidential to the client, and Oakdene Hollins accepts no responsibility for its use by other persons. This report is subject to copyright protection and the copyright owner reserves its rights. This report does not constitute legal advice.
Oakdene Hollins is registered to ISO 9001:2015 and ISO 14001:2015 and has gained certification to the Government-approved Cyber Essentials Standard.
We print our reports on ecolabelled / recycled paper
Value-driven consulting
Science-led research

Value-driven consulting Science-led research
Contents 1 Executive summary ............................................................................................................ 1
2 Introduction ....................................................................................................................... 4
2.1 Background ................................................................................................................ 4
2.2 The proposed recycling DRS for Scotland ................................................................. 5
2.3 The purpose of this report ........................................................................................ 7
2.4 The study approach ................................................................................................... 8
2.5 Layout of the report .................................................................................................. 8
2.6 Terms of reference .................................................................................................... 8
3 Assessment of the current producer responsibility scheme for packaging in UK ............. 9
3.1 Current EPR – the PRN scheme ................................................................................. 9
3.2 Performance of the current EPR scheme ................................................................ 10
3.3 Overall assessment of current UK system ............................................................... 17
4 Assessment of glass packaging recycling in Scotland ...................................................... 18
4.1 The glass packaging recycling rate in Scotland ........................................................ 18
4.2 Glass collection schemes in Scotland ...................................................................... 19
4.3 The quality of the recovered glass in Scotland ........................................................ 24
4.4 Quantities of glass packaging put on the Scottish market ...................................... 25
5 Assessment of the proposed recycling DRS ..................................................................... 35
5.1 Effectiveness of proposed DRS against criteria ....................................................... 35
5.2 Implementation of the recycling DRS in Scotland ................................................... 36
5.3 Economic and social sustainability .......................................................................... 42
5.4 Review of environmental impact ............................................................................ 47
6 Key findings ...................................................................................................................... 51
6.1 Review of current waste management systems in place in Scotland ..................... 51
6.2 Review of Scottish Government statements on the proposed recycling DRS ........ 51
6.3 Review of unintended consequences – market distortion ..................................... 76
7 To conclude ...................................................................................................................... 81
7.1 Meeting recycling targets ........................................................................................ 81
7.2 EPR ........................................................................................................................... 81
7.3 DRS .......................................................................................................................... 82
7.4 Local authorities ...................................................................................................... 82
7.5 Data uncertainty ...................................................................................................... 82
7.6 Refillable culture ..................................................................................................... 83
7.7 On-trade .................................................................................................................. 83
7.8 Producer pays .......................................................................................................... 84

7.9 Consumer pays ........................................................................................................ 84
7.10 Litter ........................................................................................................................ 84
7.11 Upsizing ................................................................................................................... 84
Annex A: Example MSs operating an EPR for packaging .......................................................... 86
Austria .................................................................................................................................. 86
Spain ..................................................................................................................................... 88
Annex B: MS and EFTA countries operating a recycling DRS including glass ........................... 92
Croatia .................................................................................................................................. 92
Denmark ............................................................................................................................... 96
Estonia ................................................................................................................................ 101
Finland ................................................................................................................................ 105
Germany ............................................................................................................................. 111
Lithuania ............................................................................................................................. 115
Annex C: Countries that operate a recycling DRS that excludes glass ................................... 117
Netherlands ........................................................................................................................ 117
Norway ............................................................................................................................... 119
Sweden ............................................................................................................................... 122
Annex D: Review of current producer responsibility scheme against a critical criteria ........ 125
Annex E: Review of the proposed recycling DRS against critical criteria ............................... 128
Figures Figure 1: How the packaging obligation system relates to the flow of packaging waste in the UK ............................................................................................................................................. 10
Figure 2: The glass packaging recycling rate in the UK ............................................................ 11
Figure 3: The glass packaging recycling rate across Europe ..................................................... 12
Figure 4: The plastic packaging recycling rate in the UK .......................................................... 14
Figure 5: The plastic packaging recycling rate across Europe .................................................. 15
Figure 6: The metallic packaging recycling rate in the UK ....................................................... 15
Figure 7: The metallic packaging recycling rate across Europe ................................................ 16
Figure 8: Current household collection of target containers ................................................... 18
Figure 9: Analysis of glass collection schemes in Scotland in 2017 .......................................... 20
Figure 10: Quantity of glass collected (kg per capita) in the 32 Scottish Local Authorities ..... 21
Figure 11: The glass collection rates vs housing density of the 32 Scottish Local Authorities . 22
Figure 12: Household waste recycling rate in the 32 Scottish Local authorities ..................... 24
Figure 13: Unit sales of beer & cider by packaging material in the UK .................................... 29
Figure 14: Unit sales of wine by packaging material in the UK ................................................ 29

Value-driven consulting Science-led research
Figure 15: Unit sales of spirits by packaging material in the UK .............................................. 30
Figure 16: Unit sales of soft drinks by packaging material in the UK ....................................... 31
Figure 17: A breakdown of the UK soft drinks sales by packaging material in 2018 ............... 31
Figure 18: Unit sales of bottled water by packaging material in the UK.................................. 32
Figure 19: Unit sales of food by packaging material in the UK ................................................ 33
Figure 20: Unit sales of hot drinks by packaging material in the UK ....................................... 34
Figure 21: Scatterplot of the market share of refillables in the beer, bottled water and soft drinks markets in 2000 and 2017 ............................................................................................. 37
Figure 22: A breakdown of wine bottle sales in Scotland ........................................................ 40
Figure 23: A comparison between the traditional refillable glass flow chart and the proposed recycled DRS ............................................................................................................................. 41
Figure 24: A breakdown of the proposed revenue streams in the Scottish recycling DRS ...... 42
Figure 25: Cost to consumers of operating the DRS ................................................................ 43
Figure 26: The glass packaging recycling rate across Europe .................................................. 49
Figure 27: A breakdown of the proposed revenue streams in the Scottish recycling DRS ...... 52
Figure 28: Cost to consumers of operating the DRS ................................................................ 52
Figure 29: A breakdown of revenue streams in the Norwegian recycling DRS. ...................... 53
Figure 30: The glass packaging recycling rate in the UK .......................................................... 54
Figure 31: The beer market in one-way glass in Croatia .......................................................... 55
Figure 32: The beer market in one-way PET in Croatia ............................................................ 55
Figure 33: The beer market in one-way cans in Croatia .......................................................... 56
Figure 34: beer sales in glass in the UK in 2017 ....................................................................... 56
Figure 35: Estimated breakdown of glass containers by product category included in the proposed recycling DRS for Scotland. Unit sales shown in millions in 2018 ........................... 57
Figure 36: The glass packaging recycling rate across Europe .................................................. 58
Figure 37: Carbonates sales in different packaging formats in Germany, 2000 to 2018 ......... 61
Figure 38: Beer sales in different packaging formats in Croatia, 2006 to 2017 ....................... 61
Figure 39: Beer sales by packaging format in Denmark since the introduction of the recycling DRS in 2002 .............................................................................................................................. 63
Figure 40: Unit sales of beer & cider by packaging material in the UK .................................... 63
Figure 41: Change in unit sales by packaging type in the Croatian beer market since the introduction of the recycling DRS in 2006 ............................................................................... 64
Figure 42: the scatterplot of the market share of refillables in the beer, bottled water and soft drinks markets in 2000 and 2017 ...................................................................................... 71
Figure 43: Export versus UK reprocessing of packaging waste. ............................................... 74
Figure 44: Carbonate sales in Germany by packaging type ..................................................... 76
Figure 45: The beer market in one-way glass in Croatia where DRS was introduced in 2006 . 77
Figure 46: beer sales in glass in the UK in 2017 ....................................................................... 78

Figure 47: Market share (% of unit sales) of glass by product category in Denmark ............... 79
Figure 48: Market share (% of unit sales) of glass by product category in the UK .................. 80
Figure 49: The glass packaging recycling rate Austria .............................................................. 86
Figure 50: Market share of glass (% of unit sales) by product category in Austria .................. 88
Figure 51: The glass packaging recycling rate in Spain ............................................................. 89
Figure 52: The number of ‘igloos’ and the recycling rate in Spain 2007 to 2016 .................... 89
Figure 53: An example of the bottle banks in operation for the HORECA channel in Spain .... 90
Figure 54: A comparison between the unit sales of bottled water, beer and soft drinks in one-way glass containers and the recycling rate for glass packaging in Spain ............................... 91
Figure 55: Market share of glass (% of unit sales) by product category in Spain ..................... 91
Figure 56: The glass packaging recycling rate (%) in Croatia .................................................... 93
Figure 57: The beer market in one-way glass in Croatia .......................................................... 93
Figure 58: The beer market in one-way PET in Croatia ............................................................ 94
Figure 59: The beer market in one-way cans in Croatia........................................................... 94
Figure 60: A comparison of unit sales by packaging material in the Croatian beer market .... 95
Figure 61: The glass packaging recycling rate in Denmark ....................................................... 96
Figure 62: Market share of glass (% of unit sales) by product category in Denmark ............... 99
Figure 63: Beer sales by packaging format in Denmark since the introduction of the recycling DRS in 2002 ............................................................................................................................ 100
Figure 64: The glass packaging recycling rate in Estonia ........................................................ 101
Figure 65: The beer market in one-way cans in Estonia ........................................................ 102
Figure 66: Beverage sales of beer, bottled water and soft drinks by container type in Estonia ................................................................................................................................................ 104
Figure 67: Glass packaging recycling rates in Finland ............................................................ 106
Figure 68: An example of the RINKI-operated glass collection points ................................... 107
Figure 69: Sales of beer, soft drinks and bottled water in Finland ........................................ 108
Figure 70: Finland – carbonates sales .................................................................................... 108
Figure 71: Market share of glass (% of unit sales) by product category in Finland ................ 109
Figure 72: Beer sales by packaging type in Finland ................................................................ 110
Figure 73: The glass packaging recycling rate in Germany ..................................................... 111
Figure 74: Germany – total sales of bottled water, soft drinks and beer .............................. 112
Figure 75: Material flows for one-way glass bottles disposed of through the dual system .. 113
Figure 76: Material flows of deposit one-way glass bottles................................................... 114
Figure 77: Market share of glass (% of unit sales) by product category in Germany............. 114
Figure 78: The glass packaging recycling rate in Lithuania .................................................... 115
Figure 79: Lithuania – Unit sales of beer, bottled water and soft drinks ............................... 116
Figure 80: The glass packaging recycling rate in the Netherlands ......................................... 117

Value-driven consulting Science-led research
Figure 81: The impact the introduction of the Recycling DRS had on refillable and one-way 150cl PET containers .............................................................................................................. 118
Figure 82: Market share of glass (% of unit sales) by product category in the Netherlands . 118
Figure 83: The glass packaging recycling rate in Norway ....................................................... 119
Figure 84: Sales of beer, soft drinks and bottled water by packaging format in Norway ...... 120
Figure 85: Market share of glass (% of unit sales) by product category in Norway ............... 120
Figure 86: The glass packaging recycling rate in Sweden ...................................................... 122
Figure 87: Market share of glass (% of unit sales) by product category in Sweden .............. 123
Figure 88: Beer sales in Sweden by packaging type ............................................................... 124
Tables Table 1: The ‘preferred’ design for the proposed recycling DRS for drinks containers in Scotland ..................................................................................................................................... 6
Table 2: The business packaging waste recycling targets for glass in 2018 to 2022................ 12
Table 3: Impact on overall recycling rate of the obligated businesses hitting their recycling target in 2022 ........................................................................................................................... 13
Table 4: Overall glass packaging recycling rates if business packaging waste recycling targets are achieved. ............................................................................................................................ 13
Table 5: The overall recycling rates if the business packaging waste recycling targets for plastic packaging are met. Business targets shown in brackets. ............................................ 14
Table 6: The overall recycling rates if the business packaging waste recycling targets for metallic packaging are met. Business targets shown in brackets. .......................................... 16
Table 7: Analysis of kerbside glass collection in Scotland 2014-15.......................................... 19
Table 8: Review of the glass recycling participation rates in Scotland .................................... 19
Table 9: Net impact of recycling glass in the UK, 2014 prices.................................................. 25
Table 10: Unit sales (in millions) of container glass in the UK by product category ................ 26
Table 11: Estimated unit sales (millions) in Scotland in 2018 .................................................. 27
Table 12: Estimated weight of glass in the proposed Scottish DRS ......................................... 27
Table 13: DRS containers distributed in Scotland in 2017 by container type .......................... 28
Table 14: Deposit schemes for one-way beverage containers in use across Europe .............. 35
Table 15: Implementation of the recycling DRS in Scotland .................................................... 36
Table 16: Off-trade beer sales by retail channel in 2017 ......................................................... 38
Table 17: Off-trade wine sales by retail channel in 2017 ......................................................... 39
Table 18: Off-trade spirit sales by retail channel in 2017 ........................................................ 39
Table 19: WRAP’s material prices per tonne in the UK and projections – best estimate ........ 43
Table 20: Expected impact of proposals on UK packaging recycling rates by 2025. ............... 44
Table 21: The estimated total tonnes of packaging in the DRS ............................................... 44
Table 22: Costs and benefits of a DRS for Scotland - NPV ....................................................... 45

Table 23: Costs and benefits of an EPR for Scotland - NPV ...................................................... 46
Table 24: Glass return rates versus overall glass packaging recycling rates across the EU-28MS and EFTA ........................................................................................................................ 48
Table 25: Recycling volumes for glass packaging in Germany, 2010 to 2015 in ‘000 tonnes .. 59
Table 26: The glass packaging recycling rate for non-deposit glass in Finland 2015 to 2017 .. 59
Table 27: Operating fees by packaging type ............................................................................ 62
Table 28: The breakdown of the material specific packaging tariffs in Austria in 2014 .......... 64
Table 29: Categorisation of littered materials by the extent to which they are recyclable ..... 66
Table 30: Costs and benefits of a DRS for Scotland - NPV........................................................ 67
Table 31: Costs and benefits of an EPR for Scotland - NPV ...................................................... 68
Table 32: Glass return rates versus overall glass packaging recycling rates across the EU-28MS and EFTA ................................................................................................................... 72
Table 33: The glass packaging recycling rate for non-deposit glass in Finland 2015 to 2017 .. 73
Table 34: Net impact of recycling glass in the UK, 2014 prices, best estimate per tonne ....... 73
Table 35: Estimates of glass packaging in the proposed recycling DRS ................................... 76
Table 36: The breakdown of the costs of operating the EPR scheme in Austria, 2012 to 2014 .................................................................................................................................................. 87
Table 37: The breakdown of the material specific packaging tariffs in Austria in 2014 .......... 87
Table 38: Examples of the waste management fees for non-DRS packaging in Croatia .......... 95
Table 39: Revenue generated in the Danish recycling DRS in 2017 ......................................... 97
Table 40: Operating fees by packaging type ............................................................................ 98
Table 41: Revenue generated in the Estonian recycling DRS in 2017 .................................... 103
Table 42: Summary of glass recycling in Finland in 2015 ....................................................... 106
Table 43: The glass packaging recycling rate for non-deposit glass in Finland 2015 to 2017 106
Table 44: Recycling volumes for glass packaging in Germany 2010 to 2015 in ‘000 tonnes . 112
Table 45: A breakdown of revenue streams in the Norwegian recycling DRS in 2017. ......... 121
Table 46: A review of the effectiveness of the current PRN scheme against the proposed system criteria ........................................................................................................................ 125
Table 47: A review of the effectiveness of the proposed DRS scheme in Scotland against the proposed system criteria........................................................................................................ 128

Value-driven consulting Science-led research
Contents amendment record This report has been amended and issued as follows:
Version Date Description Author Editor
Draft
Draft_v2 25 August 2019 For FEVE member and ZWS review
PL NB
Draft-v3 6 September 2019 Final editing PL
Glossary ARA Altstoff Recycling Austria
CEP Circular Economy Package
DPG Deutsche Pfandsystem GmbH
DRS deposit-return (refund) system
EFTA European Free Trade Area
EPR extended producer responsibility
EU-28MS 28 Member States of the EU
HORECA hotels, restaurants and catering (sector)
LA Local Authority
MS Member State (of the EU)
On-Trade Bars, restaurants, hotels (Horeca)
Off-Trade Retail (off the shelf)
PET polyethylene terephthalate
PPWD Packaging and Packaging Waste Directive 94/62/EC
PRN Packaging Recovery Note
RVM reverse vending machine
SEK Swedish krona
SGÅ Svensk Glasåtervinning
USAD Užstato Sistemos Administratorius


Recycling DRS in Scotland
1
1
1
1 Executive summary
In 2017, the First Minister of Scotland committed to introducing a recycling Deposit Return Scheme (DRS) for Scotland. The basic principle of the DRS is that the consumer pays a deposit at the point of purchase (20p in the case of Scotland) and the deposit would be refunded when the consumer returned the empty bottles or cans to a retail outlet that operates a takeback system. Two key objectives of the scheme are to contribute to1:
• Scotland’s 2025 target to increase the national recycling rate to 70%.
• The national litter strategy, Towards a Litter-free Scotland, which aims to effect a whole shift in national policy and practice towards prevention.
On 8 May 2019, it was reported that the proposed scheme would include PET bottles, metal cans and glass bottles for recycling. As the name implies, the ‘recycling DRS’ recovers glass for recycling. This is unlike the original DRS, that recovered glass for refilling and reuse.
The objective of this study, commissioned by FEVE – the European Container Glass Federation, was to determine the potential impact of the introduction of the recycling DRS on the glass sector. Our approach was to review the documentation produced by the Scottish Government on the proposed recycling DRS and then to develop an evidence base either supporting or challenging the statements made.
Our research suggests that the expected outcomes of the proposed recycling DRS scheme in Scotland, in relation to glass, are, in some cases, unrealistic and that EPR may be a more cost-effective means of improving the quantity and quality of glass collection and recycling rates in Scotland.
The key findings and observations from the study are:
Glass recycling rate: New recycling targets for glass packaging of 70% by 2025 and 75% by 2030 have been set at a European level2 and based on previous performance it would be anticipated that these targets would be achieved via the existing PRN system. The likelihood of the glass packaging recycling rate in Scotland being higher than today’s 64% in 2025, let alone 20433, is therefore very high.
Additional recycling system: The recycling DRS proposed by Scotland only covers part of the packaging put on the market and therefore can only be introduced alongside investment in existing or new collection schemes, if the new packaging recycling targets for 2025 and 2030 are to be met. An estimated 26% of glass packaging will fall outside the DRS, much of which is clear glass needed by the Scottish glass manufacturers. The two ‘dual’ systems would have to be maintained in parallel. The widely recyclable components will be removed from the existing collection systems making them less efficient. The limited quantity and quality of glass remaining outside the deposit scheme could jeopardise the Local Authority current collection provisions (kerbside or bring banks) for such glass.
1 https://www.gov.scot/publications/deposit-return-scheme-scotland-full-business-case-stage-1/
2 https://eur-lex.europa.eu/legal-content/EN/TXT/?uri=LEGISSUM%3Al21207 (EU Directive, 2018)
3 https://www.gov.scot/binaries/content/documents/govscot/publications/foi-eir-release/2019/05/foi-19-01048/documents/foi-19-
01048-document1/foi-19-01048-document1/govscot%3Adocument/DRSPB16_03a%2BThe%2BCase%2Bfor%2BGlass%2Breport.pdf (ZWS, 2018)
Recycling DRS in Scotland
2
Lack of harmonisation of waste management: There is no harmonisation of waste management systems in place across the Local Authorities in Scotland from both a general household waste, and more specifically, packaging glass collection, perspective. The introduction of a recycling DRS for beverage containers would only tackle a very small part of this issue.
EPR schemes work: EPR schemes have been traditionally implemented to channel producer funding into investment in End of Life (EoL) waste management infrastructure and reduce the financial burden on Local Authorities. Spain and the EPR scheme for non-DRS in Finland are examples where the reason for the rapid increase in the recycling rates was the introduction of the EPR.
Producers will not pay full net costs: The recycling DRS cannot be considered a policy mechanism that forces producers to cover the ‘full net costs’ of the downstream management of the products they place on the market, i.e. the ‘producer pays’ principle. This is not unique to the proposed scheme in Scotland since the same is the case in Norway.
Consumers will be main funders of the proposed scheme: The consumer will be the main funders of the scheme, through unredeemed deposits. At the ambitious ‘best practice’ capture rate of 90%, the consumers will be paying £33.9 million per year and at a capture rate of 80%, they will be paying £67.8 million per year. Since the cost of running the scheme is estimated to be £80.7 million per year, the consumers will be the main source of funding. Best practices: The statement that the recycling DRS will have a greater impact on the recycling rate for glass does not take into consideration that the top four performing countries (Slovenia, Belgium, Luxembourg and Sweden) do not operate a recycling DRS for glass, but instead operate an EPR scheme to cover all glass packaging. All achieve over 90%. Sweden is a case in point, operating a recycling DRS for PET and cans since the 1990’s and an EPR for glass, with a glass packaging recycling rate of over 90%.
Upsizing: The introduction of a scheme with a flat deposit can potentially encourage consumers to upsize. This is a particularly contentious issue for alcoholic beverages. The Croatian beer market is an example where this occurred after the introduction of such a scheme.
Market distortion: There is likely to be significant market distortion in the form of material shifts, especially since glass is more difficult to handle via a recycling DRS than PET or cans which can result in higher handling fees and subsequent market distortions. Germany, Croatia and Denmark are cases in point. In Denmark, producer fees for glass bottles placed onto the market are circa 15 times higher than that for aluminium cans.
Glass in an EPR scheme does not have the same issues, since the glass can be collected using the existing collection infrastructure (kerbside or bring banks). In the Austrian EPR scheme, the packaging tariff (€/kg) is lower for glass than plastics and metallics. Additionally, in Finland it is reported that glass collection is cheaper through the EPR scheme than the recycling DRS.
Non-DRS: Further to the threat of market distortion from materials included within the recycling DRS, there is a significant market presence of non-DRS materials and packaging formats (e.g. HDPE bottles, pouches, bag in box) in some product categories in which glass operates (for example wine).

Recycling DRS in Scotland
3
3
3
Disamenity cost of littering: A key sensitivity regarding the overall valuation of the benefits of the proposed recycling DRS is the disamenity costs associated with littering. There is little supporting evidence available to suggest that the recycling DRS will have a much higher impact on littering than an EPR that includes a litter enforcement strategy. Austria provides an example of an effective litter strategy.
Closing the manufacturing loop: Scotland, and more broadly the UK, has a ‘colour imbalance’ issue with its glass, in that due to the high levels of imports of coloured glass (wine and beer) and exports (spirits in clear glass) there is an imbalance in the colour of the glass required by the glass manufacturers and the colour of the waste glass being generated in Scotland.
Hospitality sector: The inclusion of glass in the recycling DRS would be particularly challenging to the hospitality sector due to such factors as the high volumes of glass packaging waste being generated, storage requirements and the manual nature of the returns process.
Refillables culture: All the countries that have introduced a recycling DRS in Europe have a recent record of operating refillable DRS schemes, and hence, the infrastructure and consumer behaviour was already in place to switch or supplement this.
Circular product design: An EPR is best placed to encourage circular product design (across all household packaging) than a recycling DRS that targets the widely recyclable and, in many cases, highly recycled PET bottles, metallic cans and glass beverage bottles.
Modelling bias: There is significant bias in the justification for the recycling DRS. For example, comparing a recycling DRS that includes just widely recyclable PET, metallic cans and glass drinks containers with an EPR that includes all household packaging significantly distorts the modelling in favour of the recycling DRS.
Data uncertainties: The estimated amount of glass containers put on the market in Scotland differ significantly from the 0.33 billion containers estimated within the Scottish Governments Full business and regulatory impact assessment. Estimates vary between 333 and 754 million glass containers. This level of uncertainty over the scale of the glass that would be included within the scheme places concerns over the cost modelling that has been undertaken and places a risk to the glass producers that they will be faced with extremely inflated costs.
To conclude, there is no guarantee that the Recycling DRS will increase overall glass packaging recycling rates nor provide the recyclate needed to make a circular economy in Scotland. Many glass packaging products covered by the current EPR scheme would fall outside the proposed recycling DRS scheme. Furthermore, the cost to consumers is substantial and the measure will have unintended consequences.

Recycling DRS in Scotland
4
2 Introduction
2.1 Background
Packaging and packaging waste in Scotland is governed by the EU Directive on Packaging and Packaging Waste Directive 94/62/EC. This Directive was recently amended by Directive (EU) 2018/8524 and contains updated measures designed to: prevent the production of packaging waste, and to promote the reuse, recycling and other forms of recovering of packaging waste, instead of its final disposal, thus contributing to the transition towards a circular economy. For example, this included legally binding EU targets for the recycling of glass packaging across all MS:
• A minimum recycling rate of 70% for glass by 2025.
• A minimum recycling rate of 75% for glass by 2030.
This supersedes the previous mandatory recycling targets that formed part of the MS obligations under the 1994 Packaging and Packaging Waste Directive (PPWD) – 94/62/EC.
Each EU Member State (MS) can decide how it wishes to comply with its packaging obligations, and schemes vary by MS. In the UK, the current system of producer responsibility for packaging has been in place in the UK since 1997. It predates the devolved government (1999), and hence operates UK-wide. Two significant regulations associated with the system target specific aspects:
• Recycling and recovery of packaging are covered under the Producer Responsibility Obligations (Packaging Waste) Regulations 2007.
• Single market, design and manufacturing aspects of packaging are covered under the Packaging (Essential Requirements) (Amendment) Regulations 2015.
Across Europe, the extended producer responsibility (EPR) schemes are commonplace and, for glass, have contributed greatly to the EU-wide average recycling rate of 74%. In its simplest form, the EPR involves the producers paying a fee into a central pot of funds - the fee paid into the fund being dependent on the quantity of packaging the producer is placing on the market - which is then used to fund the end of life management of the waste packaging. Annex 1 shows case studies for Austria and Spain, two MS operating EPR schemes.
More sophisticated EPR schemes are now being introduced, called ‘modulated EPR’, in which the fee is calculated not only on the quantity of material being placed on the market, but also on the type of packaging in terms of its environmental credentials (is it widely recyclable, does it have a high recycled content, is it sourced from sustainable sources, etc.). Furthermore, the amended Waste Framework Directive (WFD) (Directive (EU) 2018/851) sets a requirement for minimum EPR requirements (Art 8) by 5 January 2023 at the latest. For this purpose, the European Commission will develop a guidance document for MS and operators.
A more recently identified issue with packaging - and more specifically plastic packaging - is that it falls into the category of Single Use Plastics (SUP), with its association with marine
4 https://eur-lex.europa.eu/legal-content/EN/TXT/?uri=LEGISSUM%3Al21207 (EU Directive, 2018)
Recycling DRS in Scotland
5
5
5
litter. The EU Directive (Directive EU 2019/904)5 on The reduction of the impact of certain plastic products on the environment reports that SUP items represent about half of all marine litter found on European beaches and the top ten most found SUP items - which include plastic beverage bottles, their caps and lids - represents 86% of all SUP items. The measures introduced by the European Commission are:
• Product design requirement.
• Extended producer responsibility.
• Separate collection objective.
• Awareness-raising measures.
This issue around plastic packaging and especially marine littering, brought to prominence the one-way recycling deposit refund (or return) system (DRS). Scotland and England are considering a recycling (DRS) for single use plastics, in line with those already in operation in the MS of Croatia, Denmark, Estonia, Finland, Germany, Lithuania, the Netherlands and Sweden and more widely in a number of US and Australian states, Canadian provinces and - closer to home - in Norway and Iceland. Annex 2 provides case studies of the MS currently operating recycling DRS with glass included (Croatia, Denmark, Finland, Germany and Lithuania) while Annex 3 shows case studies for MS and EFTA that operate recycling DRS where glass is excluded (Norway, Netherlands and Sweden).
For glass, historically, DRS is associated with refillable glass and was a voluntary scheme operated, in many cases, by brewers wishing to have their valued bottles returned for washing and refilling. The system involves consumers paying a deposit at the time of purchase and then returning the empty bottles back to the point of purchase or a designated return point in return for the redemption of their deposit. The proposed DRS scheme for Scotland is not for refillables which are for multiple use but is a means of motivating consumers to return the bottles for recycling rather than discard them either as litter or in the residual waste stream. Reducing this ‘leakage’ from the system forms part of a circular economy strategy.
This study looks at the pros and cons, including the unintended consequences, of introducing a recycling DRS for one-way glass packaging in Scotland.
2.2 The proposed recycling DRS for Scotland
Overview of DRS
Scotland has deemed that, as part of the revision of the current system of producer responsibility for packaging in the UK, there is a need for the inclusion of a deposit refund system (DRS) for one-way beverage containers.
What is a DRS?
A DRS for beverage containers is a system in which consumers pay a deposit for a container when purchasing a beverage and receive a refund of the deposit upon return of said container. The main purpose of the deposit is to provide an economic incentive to consumers to return their empty containers.
5 https://eur-lex.europa.eu/legal-content/EN/TXT/?uri=uriserv:OJ.L_.2019.155.01.0001.01.ENG&toc=OJ:L:2019:155:FULL

Recycling DRS in Scotland
6
Traditionally, DRSs in Europe were paid on refillable containers with the primary objective of maximising trippage6 rates. In Europe, such systems tended to be voluntary, and were established and managed by the producers who had a financial interest in recovering packaging for reuse. In more recent times, recycling DRSs with mandatory deposits have been introduced, with the aim of recovering one-way containers in order to reduce litter or increase recycling rates.
The proposed Scottish recycling DRS
On 8 May 2019, the Scottish Government published its report A deposit return scheme for Scotland – full business case stage 1 (hereafter referred to as ‘the business case’). Table 1 provides a summary of the scheme design.
Table 1: The ‘preferred’ design for the proposed recycling DRS for drinks containers in Scotland
Criteria Preferred scheme design (in scope)
Packaging materials
Glass bottles, PET bottles and metal (aluminium and steel) cans
Packaging size Above 50ml and below 3 litres
Sales channels Both on-trade (hospitality sector) and off-trade (retail) including online retailers
Product categories
No differentiation based on product
Refund system
Return to retailer (return to any place of purchase) with 85-90% of containers in scope being captured through automated Reverse Vending Machines (RVMs). The hospitality sector that sell drinks to be opened and consumed on-site (pubs, restaurants, etc) will be given the option not to charge the deposit to customers and not to act as a return point for containers that they do not sell. Furthermore, non-retail spaces such as recycling centres, schools or other community hubs, will be able to act as return locations.
Collection method
Soft drop (glass bottles collected whole rather than crushed)7 and compaction of plastic bottles and metal cans (after being verified as deposit bearing containers)
Deposit amount 20p on all containers irrespective of size
Target capture rate
90% in two to three years8
Fraud prevention
The preferred scheme will not mandate the adoption of a specific barcode
Scheme administration
Single scheme administrator
Source: Oakdene Hollins from Scottish Government studies
6 ‘Trippage’ is the number of trips a bottle makes, including the first filling, until it is taken out of circulation.
7 This was included in the 23 September 2018, ZWS report entitled DRS – the case for glass. It reports that a ‘soft drop’ method of
collection for glass will require additional retail floor space, i.e. 25% larger space and 10% increased capital cost. However, this will aid the colour sorting of the bottles at the glass reprocessing stage. 8
This 90% target is in line with current best practice from such recycling DRS schemes in operation in Europe and the EC proposal on
single-use plastics (aimed at tackling marine litter) which includes a collection target for plastic drinks bottles ec.europa.eu/commission/news/single-use-plastics-2018-may-28_en (European Commission, 2018)

Recycling DRS in Scotland
7
7
7
A key attribute of the proposed scheme is that it will introduce the ‘producer pays’ principles to the collection of in scope materials. It is reported that:
“DRS will operate as an instrument for implementing Extended Producer Responsibility (EPR), where producers who benefit from placing material onto the market incur the costs of ensuring appropriate treatment at end of life.”
This is in line with a Scottish Government impact assessment9 which states that “the option we consider is to reform the packaging producer responsibility system so that producers cover the full net end-of-life costs of municipal packaging”.
The proposed definition of full net cost covers:
• Collecting and transporting household/household-like packaging waste for recycling.
• Sorting and treatment of household/household-like packaging waste (where required) for recycling. The income obtained from the sale of recyclable materials would be netted off.
• Treating/disposing of any packaging disposed of in the residual waste stream.
• Providing information to consumers on recycling packaging waste and anti-littering.
• Clean up of littered and fly-tipped packaging items.
• The collection, collation and reporting of relevant packaging and waste management data (including litter and fly-tipping).
The business case identified four investment objectives, which “inform the development of the preferred scheme design and against which its impact will be measured”:
• Improving recycling quantity.
• Improving recycling quality.
• Encouraging wider behaviour change around materials.
• Delivering maximum economic and societal benefit for Scotland during the transition to a low carbon world.
2.3 The purpose of this report
This report was commissioned by FEVE – the European Container Glass Federation as it is important for the European glass packaging industry to better understand the impact that the proposed recycling DRS for one-way containers in Scotland poses to the relative market share of glass beverage packaging. Traditionally for glass, a deposit-return system was the system used to operate refillable glass packaging. This ‘dual-nature’ of deposits needs to be carefully considered when assessing the impact of deposits on one-way beverage containers.
Adding to the complexity, no two deposit schemes operating in Europe are the same. Crucially, this is because schemes need to be integrated with existing national policies on packaging and must account for differences in consumer behaviour in terms of recycling culture, demographic trends, etc. Thus, deposit schemes are tailored to the individual countries / regions and the impact of replicating such schemes elsewhere is difficult to predict.
9 https://www.gov.scot/publications/deposit-return-scheme-scotland-full-business-regulatory-impact-assessment/pages/1/

Recycling DRS in Scotland
8
2.4 The study approach
The methodology used within this study was to review the documentation produced by the Scottish Government on the proposed recycling DRS and then to develop the evidence base either supporting or challenging the statements made. This involved drawing on the schemes currently in operation across Europe, sales data from GlobalData, recycling data from Eurostat and more general literature captured through desk-based research.
2.5 Layout of the report
The sections of the report are:
• Section 3. Assessment of the current producer responsibility scheme for packaging and impact on glass collection and recycling in Scotland.
• Section 4. Assessment of glass packaging recycling in Scotland.
• Section 5. Assessment of the proposed recycling DRS.
• Section 6. Key findings
• Section 7. conclusions.
2.6 Terms of reference
The EU has changed the calculation rules for recycling rates from ‘Collected for recycling’ to the ‘Measurement point after the cullet treatment plant’ i.e. after handling and sorting the waste glass etc, when cullet ceases to be waste. We have no data on losses, but they are estimated at +/- 5 to 10%. The new secondary legislation was published on 7 June 2019.10
Due to the assessment of historic data included within this study, we have not made any allowance for the level of yield losses throughout this study.
10 https://eur-lex.europa.eu/legal-content/EN/TXT/HTML/?uri=CELEX:32019D1004&from=EN#d1e199-66-1

Recycling DRS in Scotland
9
9
9
3 Assessment of the current producer responsibility scheme for packaging in UK
3.1 Current EPR – the PRN scheme
Extended producer responsibility (EPR) schemes, covered by the EU Packaging Directive means obligated11 producers must pay fees to cover the end of life costs of their packaging (i.e. its collection, recycling and disposal). Every time an obligated producer (e.g. a brand) puts a packed product on the market, it must pay the fee. Most EPR schemes are fee-based models. New EPR rules will now also cover the cost of littering.
The UK operates a market-based model, called the Packaging Recovery Note (PRN). Obligated producers have to buy PRNs (1 PRN / 1 tonne) from waste reprocessors or packaging companies to offset their packaging use against the recycling target. If the target is not being met, the PRN price goes up; if the target is met it goes down. Calls are growing for a reform of PRNs.
Key elements of the current system
The key elements of the current UK system are:12
• Businesses that handle over 50 tonnes of packaging annually and have an annual turnover over £2 million are required to meet a share of the UK annual packaging waste recycling targets. These businesses are called ‘obligated’ or ‘obliged’ businesses or producers.
• The contribution of obligated producers depends on their role in the supply chain and the amount of packaging they handle.
• The regulations do not require obligated producers to collect or recycle their own packaging to meet their share of the UK packaging waste recycling targets. Rather, they must acquire evidence to demonstrate that tonnages equivalent to their individual targets have been recovered and recycled during the year. This evidence is called a PRN (Packaging Waste Recovery Note) or, where the packaging waste is recovered overseas, a PERN (Packaging Waste Export Recovery Note). Obligated industries must purchase a PRN or PERN.
• The financial value/cost of evidence notes is determined by the market. They fluctuate in price in response to a range of factors; these include the supply of recyclables, the price of raw materials, the price of secondary raw materials, the availability of evidence and the level at which the targets have been set.
In 2017, the total amount of packaging placed on the market in the UK was approximately 11.5 million tonnes. The proportion accounted for by obligated businesses was 9.8 million tonnes or 85% of the total packaging.
11 See Section 3.1.1 for an explanation of the term ‘obligated’.
12 https://consult.defra.gov.uk/environmental-quality/consultation-on-reforming-the-uk-packaging-
produce/supporting_documents/packagingeprconsultdoc.pdf (Defra, 2019)
Recycling DRS in Scotland
10
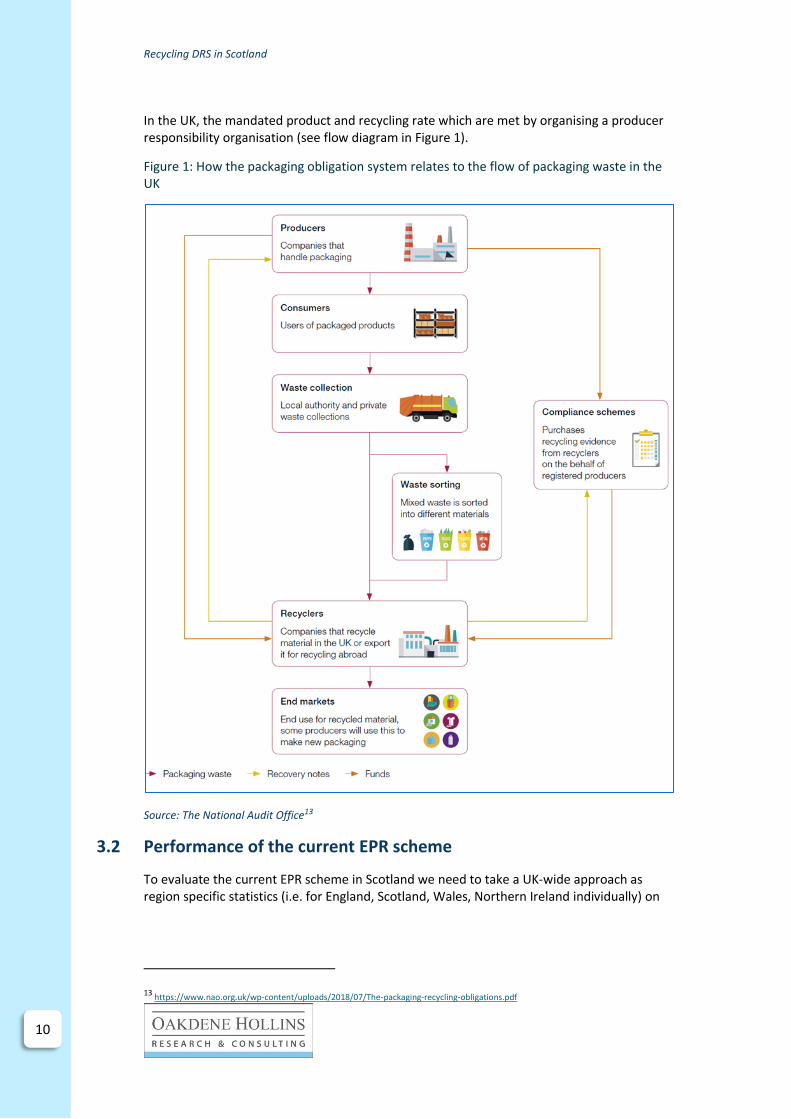
In the UK, the mandated product and recycling rate which are met by organising a producer responsibility organisation (see flow diagram in Figure 1).
Figure 1: How the packaging obligation system relates to the flow of packaging waste in the UK
Source: The National Audit Office13
3.2 Performance of the current EPR scheme
To evaluate the current EPR scheme in Scotland we need to take a UK-wide approach as region specific statistics (i.e. for England, Scotland, Wales, Northern Ireland individually) on
13 https://www.nao.org.uk/wp-content/uploads/2018/07/The-packaging-recycling-obligations.pdf

Recycling DRS in Scotland
11
11
11
annual recycling figures, as used to track the progress made towards the EU Directive targets, are not available.
We will also only consider the three packaging materials included in the proposed recycling DRS (Glass, Plastic and Metal). This will allow us to determine whether the current EPR system is more or less suited to any of the three materials.
UK recycling rates for glass packaging
Figure 2 shows the glass packaging recycling rate in the UK. The most recent EU Directive target for the UK was the 60% target back in 2008 and the UK met the target with a recycling rate of 61.3%14. Since then the UK Government has set its own business packaging waste recycling targets, but the recycling rate has stagnated in the last five recorded years (2012 to 2016) following an increased recycling rate.
Figure 2: The glass packaging recycling rate in the UK
Source: Eurostat
Figure 3 shows the overall recycling rates for glass packaging for the EU-28, Norway and Switzerland, in 2016, with the countries operating recycling DRS for one-way glass beverage containers shown in red. With a recycling rate of 66.9%, the UK is ranked at the lower end of the scale.
14 https://www.letsrecycle.com/packaging/targets/

Recycling DRS in Scotland
12
Figure 3: The glass packaging recycling rate across Europe
Source: Eurostat. Key: Red = MS operates a DRS for one-way glass; Blue = MS does not operate a DRS for one-way glass
Although this analysis shows that the UK is not performing particularly well it also shows that only three countries operating a recycling DRS fall into the top 10 countries in terms of overall glass packaging recycling rate. The UK has a higher recycling rate than two of the countries that operate a recycling DRS for glass.
Projected recycling rates for glass packaging in UK
Table 2 shows the existing and proposed UK business packaging waste recycling targets for glass (2018 to 2022).
Table 2: The business packaging waste recycling targets for glass in 2018 to 2022
Existing business targets
Proposed new business targets
agreed by UK Gov
2018 2019 2020 2021 2022
Glass 78% 79% 80% 84% 87%
Of which by re-melt 67% 67% 67% 68% 68%
Source: Defra, 201915
Table 3 shows that if the obligated businesses hit their 87% business target in 2022 and their contribution remains at 85% (see Section 3.1.1) of the total packaging, an overall glass packaging recycling rate of 74% will be achieved, i.e. the PRN scheme will deliver a recycling
15 https://consult.defra.gov.uk/environmental-quality/consultation-on-reforming-the-uk-packaging-
produce/supporting_documents/packagingeprconsultdoc.pdf

Recycling DRS in Scotland
13
13
13
rate of 74% if the obligated businesses (accounting for 85% of total glass waste) meet the 87% target.
Table 3: Impact on overall recycling rate of the obligated businesses hitting their recycling target in 2022
Percentage of
overall packaging Recycling target
Contribution to overall recycling rate
Obligated businesses 85% 87% 85% x 87% = 74%
Non-obligated businesses
15% 0% 0%
Total 74%
Source: Oakdene Hollins
Table 4 shows the overall performance of the current scheme in the UK. This shows that, if the obligated businesses meet their recycling targets, the 2025 recycling target of 70% would be achieved in 2021 and the UK would be well on its way to meeting the 75% target for 2030, with a recycling rate of 74% in 2022.
Please note: the re-melt figures are derived by multiplying the overall recycling rate by the remelt obligation shown in Table 2. For example, for 2018 the overall recycling rate is 66.3% and the remelt obligation is that 67% of the recycling should be via remelt, therefore 66.3% multiplied by 67% results in a remelt rate of 44.4%. Unfortunately, from a glass industry perspective, Table 4 shows that the business target for the re-melt (closed loop recycling of glass back into bottles) is less than 50% of the total waste glass being generated in all but the last year. Cost constraints see Table 9, mean that some collected glass bottles are used in lower value material recovery such as in the production of aggregate.
Table 4: Overall glass packaging recycling rates if business packaging waste recycling targets are achieved.
2018 2019 2020 2021 2022
Glass 66.3% 67.2% 68% 71.4% 74.0%
Of which by re-melt
44.4% 45.0% 45.6% 48.6% 50.3%
Source: Oakdene Hollins
UK recycling rate for plastic packaging
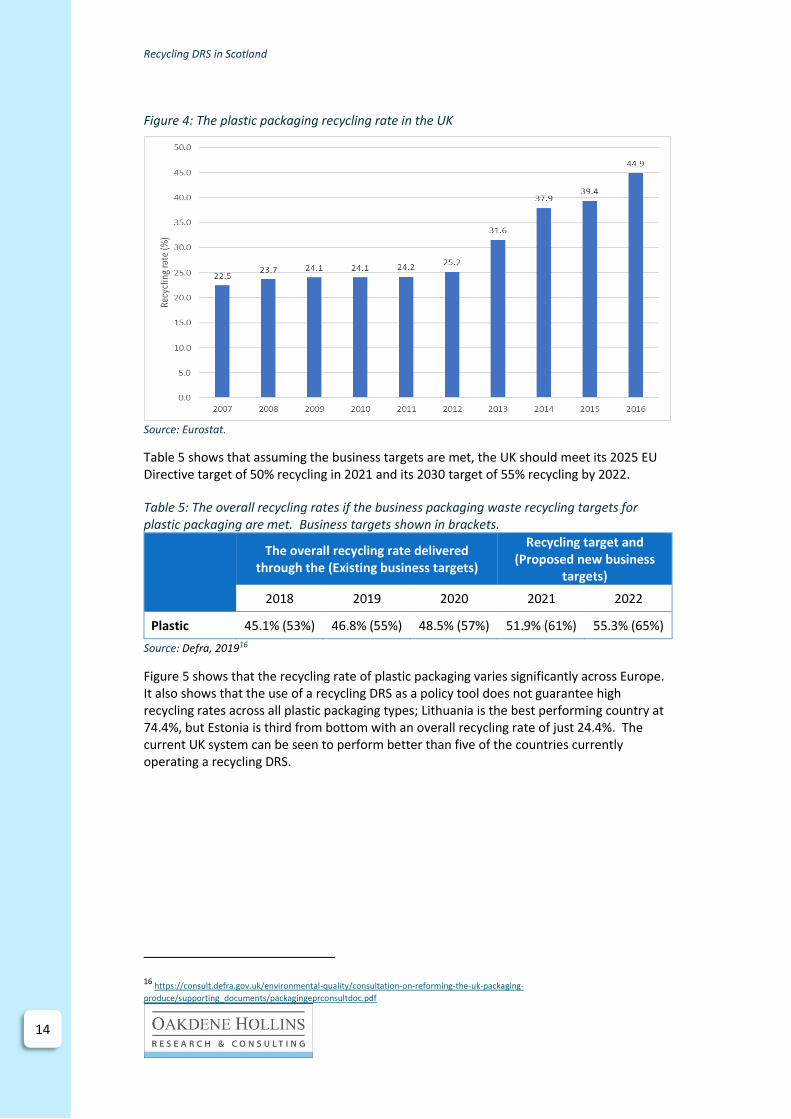
Figure 4 shows the plastic packaging recycling rate in the UK. The last EU Directive target was 22.5% in 2008, and the UK met its target with a recycling rate of 23.7%. Figure 4 shows a relatively steep increase in the recycling rate between 2012 (25.2%) and 2016 (44.9%). This, in part, is due to a significant year-on-year increase in the business packaging waste recycling targets over this period, i.e. from 32% in 2012 to 47% in 2015.
Recycling DRS in Scotland
14
Figure 4: The plastic packaging recycling rate in the UK
Source: Eurostat.
Table 5 shows that assuming the business targets are met, the UK should meet its 2025 EU Directive target of 50% recycling in 2021 and its 2030 target of 55% recycling by 2022.
Table 5: The overall recycling rates if the business packaging waste recycling targets for plastic packaging are met. Business targets shown in brackets.
The overall recycling rate delivered through the (Existing business targets)
Recycling target and (Proposed new business
targets)
2018 2019 2020 2021 2022
Plastic 45.1% (53%) 46.8% (55%) 48.5% (57%) 51.9% (61%) 55.3% (65%)
Source: Defra, 201916
Figure 5 shows that the recycling rate of plastic packaging varies significantly across Europe. It also shows that the use of a recycling DRS as a policy tool does not guarantee high recycling rates across all plastic packaging types; Lithuania is the best performing country at 74.4%, but Estonia is third from bottom with an overall recycling rate of just 24.4%. The current UK system can be seen to perform better than five of the countries currently operating a recycling DRS.
16 https://consult.defra.gov.uk/environmental-quality/consultation-on-reforming-the-uk-packaging-
produce/supporting_documents/packagingeprconsultdoc.pdf

Recycling DRS in Scotland
15
15
15
Figure 5: The plastic packaging recycling rate across Europe
Source: Eurostat. Key: Red = MS operates a DRS for one-way glass; Blue = MS does not operate a DRS for one-way plastic
UK recycling rate for metallic packaging
Figure 6 shows the UK recycling rate for metallic packaging. This shows that the UK met its 2008 EU Directive target of 50%. This also shows a similar trend to that of plastic packaging with a significant growth between 2012 and 2016 due to increased business targets.
Figure 6: The metallic packaging recycling rate in the UK
Source: Eurostat.

Recycling DRS in Scotland
16
Table 6 shows the overall recycling rates if the business targets are met. For aluminium packaging, the 2025 target of 50% would be met in 2019 and the 2030 target of 60% would be very close to being met in 2022 (58.7%). For steel packaging, the 70% 2025 target would be met in 2020, but the UK would be 3.5% off the target of 80% recycling by 2030 in 2022.
Table 6: The overall recycling rates if the business packaging waste recycling targets for metallic packaging are met. Business targets shown in brackets.
Recycling target and (Existing business targets)
Recycling target and (Proposed new business
targets)
2018 2019 2020 2021 2022
Aluminium 49.3% (58%)
51.9% (61%)
54.4% (64%)
56.1% (66%)
58.7% (69%)
Steel 67.2% (79%)
69.7% (82%)
72.3% (85%)
74.8% (88%)
76.5% (90%)
Source: Defra, 201917
Figure 7 shows that the recycling rate for metallic packaging again varies considerably across Europe. The top four performing countries do not operate a recycling DRS, and hence there is no conclusive proof that this is the best option. Croatia is a particularly poor-performing country with a recycling rate of just 16.4%.18
Figure 7: The metallic packaging recycling rate across Europe
Source: Eurostat. Key: Red = MS operates a DRS for one-way glass; Blue = MS does not operate a DRS for one-way metallic packaging
17 https://consult.defra.gov.uk/environmental-quality/consultation-on-reforming-the-uk-packaging-
produce/supporting_documents/packagingeprconsultdoc.pdf (Defra, 2019) 18 Vetropack states that there was no official statement made on why the recycling rate in Croatia was so low. Vetropack Personal
Communication July 2019.

Recycling DRS in Scotland
17
17
17
3.3 Overall assessment of current UK system
The February 2019 Defra report Consultation on reforming the UK packaging producer responsibility system (hereafter referred to as ‘the consultation’) states that:19
“This (the current system) has helped to drive recycling of packaging waste from 25%, 20 years ago, to 64.7% in 2016. Over this period, we have met all our UK and EU packaging waste recycling targets, and the cost of compliance to business has been kept low when compared to other Member States.”
However, the performance of the system does not come without its criticism. The consultation continues:
“Stakeholders have expressed concerns over the transparency of the system including how income from the sale of evidence has supported packaging waste recycling, that local authorities receive limited direct financial support for managing packaging waste, and that there is not a level playing field for domestic reprocessing.”
The Impact Assessment (IA) (hereafter referred to as ‘the impact assessment’) that accompanied the consultation also reported the following:19
“It provides little incentive for producers to design for greater re-use or recyclability. At the same time, demand for collected materials is not being stimulated sufficiently, local authorities receive limited financial support for collections and many people continue to be confused over what packaging can and can’t be recycled. Contrary to the polluter pays principle, a range of environmental externalities (e.g. carbon emissions and disamenity impacts from littering) are not fully accounted for in producers’ decisions.”
Furthermore, the consultation also highlighted the increase in public consciousness around the management of waste - most significantly plastic. It states that:
“…the growing issue of plastic waste in our oceans is driving a desire for further action on the part of the public.”
Annex 4 shows the results of a mapping exercise showing all the system specification requirements based on the system criteria outlined in the consultation, ‘the impact assessment’ and ‘the business case’, as discussed in Section 2. The performance of the current system has been appraised against these specifications.
The analysis reaffirms the conclusions from the consultation that the current scheme was a low cost means of meeting recycling targets. This therefore suggests that the main focus was on the requirements of the Packaging Waste Regulations, i.e. recycling and recovery of packaging, with little focus on the Essential Packaging Regulation around design and manufacturing of the product. It can also be observed that the term ‘low cost’ refers to the financial burden placed on the producers and not Local Authorities who have had to fund the management of the materials from a collection and disposal perspective.
19 https://consult.defra.gov.uk/environmental-quality/consultation-on-reforming-the-uk-packaging-
produce/supporting_documents/packagingeprconsultdoc.pdf (Defra, 2019)

Recycling DRS in Scotland
18
4 Assessment of glass packaging recycling in Scotland
4.1 The glass packaging recycling rate in Scotland
ZWS reports that the recycling rate for container glass in Scotland from household collections in 2018 is estimated to be 64% (119,843 tonnes from an annual total of 188,588 tonnes of glass arisings from households and businesses).20 In terms of the recycling of glass drinks bottles, a study for ZWS21 reported that in 2012, 70% of all glass drinks bottles were recycled in Scotland. However, a compositional study by ZWS in 2014/15 estimated that only 59% of glass drinks containers were being recovered from Local Authority household collections.22 Figure 8 provides a summary of the two datasets. Unfortunately, the reliability of the data must be taken into consideration since the business case report states that:
“…there are limitations in the available Scottish specific data in relation to sales, waste by material type and material reprocessing of drinks containers…”
Figure 8: Current household collection of target containers
Source: ZWS, 201726
Please note: the general consensus among FEVE members is that glass drinks bottles are the most readily recycled glass packaging, and hence the recycling rate for glass drinks bottles would be higher than the overall rate of recycling for glass packaging, i.e. higher than the 64% figure shown for overall recycling shown above.
20 https://www.gov.scot/binaries/content/documents/govscot/publications/foi-eir-release/2019/05/foi-19-01048/documents/foi-19-
01048-document1/foi-19-01048-document1/govscot%3Adocument/DRSPB16_03a%2BThe%2BCase%2Bfor%2BGlass%2Breport.pdf (ZWS, 2018) 21
https://www.zerowastescotland.org.uk/sites/default/files/SPRN_0.pdf (ZWS, 2015)
22 https://www.zerowastescotland.org.uk/composition-household-waste-kerbside (ZWS, 2017)
69,8
50
60
51
59
4649
53 53
39
0
10
20
30
40
50
60
70
80
Glass drinkscontainers
Steel drinkscontainers
Aluminiumdrinks
containers
Plastic (PET)drinks
containers
Plastic (HDPE)drinks
containers
Cartons
Rec
yclin
g ra
te (
%)
2012 2015

Recycling DRS in Scotland
19
19
19
Table 7 shows the results for glass of a compositional study undertaken by ZWS. This shows that clear glass, the most valuable and sought after by the spirits sector, is the lowest performing, with a recycling rate below 40% (39.5%). The 46,000 tonnes of clear glass that is not currently recycled in Scotland makes it the second most recyclable material found in the household residual waste stream in Scotland, behind food waste23.
Table 7: Analysis of kerbside glass collection in Scotland 2014-15. Total glass
collected (tonnes) Total glass in residual
waste (tonnes) Total glass
recycled (tonnes) Recycling rate (%)
Clear 76,000 46,000 30,000 39.5
Green 34,000 14,000 20,000 58.8
Amber 20,000 11,000 9,000 45.0
Other glass
4,000 4,000 - -
Total 134,000 75,000 59,000 44.0
Total (%)
56.0% 44.0%
Source: ZWS, 201724
Low participation rates among households can be considered a significant causative factor of the low recycling rates. Key Scottish Environment Statistics 201625 reported that only 77% of Scottish households reported to have undertaken any form of glass recycling in the last month. This shows the magnitude of the challenge ahead in terms of meeting the target of a 90% recovery rate in the recycling DRS in two to three years, detailed in Table 8.
Table 8 shows that current participators (77% of households) would need to increase their recycling rate from 83.1% to 90%, whereas, the non-participators (23% of households) would need to increase from 0% to 90%. For this change to be feasible, there is a clear dependence upon a major shift in recycling culture.
Table 8: Review of the glass recycling participation rates in Scotland
% of
households Current recycling rate
(%) (2015) Target recycling rate
(%) in 2 or 3 years
Current participation rate for recycling
77 Current total recycling
(64%)/ 77% = 83.1% 90%
Current non- participation
23 0% 90%
Source: Oakdene Hollins
4.2 Glass collection schemes in Scotland
Figure 9 shows the glass recycling schemes in operation in the 32 Local Authorities across Scotland in 2017. The ‘kerbside separate collection’ represents the best system26 for
23
https://www.zerowastescotland.org.uk/sites/default/files/The%20composition%20of%20household%20waste%20at%20the%20kerbside%20in%202014-15.pdf 24 https://www.zerowastescotland.org.uk/composition-household-waste-kerbside (ZWS, 2017)
25 https://www.gov.scot/binaries/content/documents/govscot/publications/statistics/2016/10/key-scottish-environment-statistics-2016-
9781786525505/documents/00508344-pdf/00508344-pdf/govscot%3Adocument/00508344.pdf?forceDownload=true (National Statistics/Natural Scotland, 2016) 26
https://www.nrscotland.gov.uk/statistics-and-data/statistics/stats-at-a-glance/council-area-profiles

Recycling DRS in Scotland
20
collecting good quality (uncontaminated) glass and this service was provided in 18 of the 32 Local Authorities. It is reported that 1.37 million households have access to glass collection at kerbside (separate or comingled collection) and 1.03 million do not.
Figure 9: Analysis of glass collection schemes in Scotland in 2017
Source: National Records of Scotland, accessed 201927
Figure 10 shows the wide range of glass collection rates in the 32 Scottish Local Authorities, from the Shetland Islands with a recycling rate of 8.4 kg per capita to North Lanarkshire at 34 kg per capita. Clearly, the quantity of glass generated (kg per capita) in each Local Authority will vary, but the recycling infrastructure will also have a significant bearing on the collection rates. For example, Viridor has a glass reprocessing facility with a capacity of 200,000 tonnes per year in North Lanarkshire, the Local Authority with the highest recycling rate. Furthermore, the five highest recycling authorities all operated a separate kerbside glass collection service. Please note: unfortunately, the quantity of waste glass generated could not be found for each Local Authority and hence the recycling rate could not be calculated.
27 https://www.nrscotland.gov.uk/statistics-and-data/statistics/stats-at-a-glance/council-area-profiles
18
26
14
0
5
10
15
20
25
30
Kerbside separate collection Bring site separate collection Comingled recycling
Nu
mb
er o
f lo
cal a
uth
ori
ties
o
per
atin
g th
is s
chem
e

Recycling DRS in Scotland
21
21
21
Figure 10: Quantity of glass collected (kg per capita) in the 32 Scottish Local Authorities
Source: National Records of Scotland, accessed 201931
Figure 10 also shows the poor performance of some of the major cities, with Glasgow City ranked fifth lowest in terms of collection quantities. The ZWS report DRS – the case for glass states that in the Local Authorities that operate a kerbside collection system, not all householders are fully served by the system. For example, the kerbside scheme operated in Glasgow excluded the 33% of households in densely populated areas.
Figure 11 shows the glass collection rates of the 32 Local Authorities against their relative housing density. This clearly shows the spread of collection rates, i.e.:
• In the very rural areas with a housing density of less than 500 houses per square mile, the glass collection rates vary across the Local Authorities from 8.7 kg per capita in the Shetland Islands to Argyll and Bute with a collection rate of 33.5 kg per capita.
• In the mid-range of housing density (more than 500 to fewer than 1,000 houses per square mile) the glass collection ranges from 9.8 kg per capita in West Dunbartonshire to North Lanarkshire with a collection rate of 34 kg per capita.
• The four main cities of Scotland show the least diversity, from Glasgow City with a collection rate of 11.8 kg per capita to Dundee City at 20.6 kg per capita.
This analysis shows that in many of the Local Authorities the glass collection infrastructure is not well established, irrespective of whether it is an urban or rural Local Authority. This can be due to the motivation of the individual Local Authorities to deliver the service, but often this will be due to the budgetary constraints of having to balance the provision of this service against many others.
0
5
10
15
20
25
30
35
40
Shet
lan
d Is
lan
ds
Wes
t D
un
bar
ton
shir
e
Du
mfr
ies
and
Gal
low
ay
Wes
t Lo
thia
n
Gla
sgo
w C
ity
Inve
rcly
de
Fife
East
Ren
frew
shir
e
Sco
ttis
h B
ord
ers
Ab
erd
een
Cit
y
Pe
rth
an
d K
inro
ss
East
Lo
thia
n
Cit
y o
f Ed
inb
urg
h
Ren
frew
shir
e
East
Ayr
shir
e
Du
nd
ee C
ity
An
gus
Mid
loth
ian
Ab
erd
een
shir
e
No
rth
Ayr
shir
e
Ork
ney
Isla
nd
s
Nah
-Eile
anan
Sia
r
Sou
th L
anar
ksh
ire
Sou
th A
yrsh
ire
Hig
hla
nd
Stir
ling
East
Du
nb
arto
nsh
ire
Falk
irk
Cla
ckm
ann
ansh
ire
Mo
ray
Arg
yll a
nd
Bu
te
No
rth
Lan
arks
hir
e
Qu
anti
ty o
f gl
ass
colle
cted
(kg
per
cap
ita)

Recycling DRS in Scotland
22
Figure 11: The glass collection rates vs housing density of the 32 Scottish Local Authorities
Source: Adapted by Oakdene Hollins from National Records of Scotland, accessed 201928
To compound the issue around the relatively poor collection performance and inconsistency across Local Authorities, a number have decided to reduce their glass recycling services. For example, two of the councils shown to be operating a kerbside collection scheme have made the decision to withdraw the scheme. Clackmannanshire (ranked 4th on Figure 10)29 and Inverclyde (ranked 6th poorest) have made the decision to withdraw their kerbside glass collection services as a cost cutting exercise. This is particularly disappointing in the Clackmannanshire scheme since the scheme was considered an example of good practice in terms of glass recycling by Resource Efficient Scotland.30
A spokesperson for the Inverclyde scheme stated that:31
“As part of the Council’s budget review we had to make the tough decision to withdraw the kerbside glass collection service. It wasn’t an easy one as we pride ourselves on our excellent record on recycling. I appreciate people will now have to go a little out of their way rather than enjoy the convenience of collections, but I would encourage householders to continue to recycle and re-use what they can.”
Conversely, West Lothian Council (ranked 4th poorest) has increased the number of glass recycling bins in bottle banks in the area since receiving £435,000 of grant funding from Zero Waste Scotland.32
28 https://www.nrscotland.gov.uk/statistics-and-data/statistics/stats-at-a-glance/council-area-profiles (National Records of Scotland,
accessed 2019) 29 https://www.clacks.gov.uk/document/meeting/266/912/6398.pdf (Clackmannanshire Council, 2019)
30 https://www.resourceefficientscotland.com/sites/default/files/Good%20practice%20in%20glass%20kerbside%20collection%20-
%20Clackmannanshire%20Council.pdf (ZWS, 2012) 31 https://www.inverclyde.gov.uk/news/2018/may/kerbside-glass-collections-to-end (Inverclyde Council, 2018) 32
https://www.westlothian.gov.uk/article/4903/Glass-Recycling (West Lothian Council, accessed 2019)
0
500
1000
1500
2000
2500
3000
3500
4000
4500
5000
0 5 10 15 20 25 30 35
Ho
use
s p
er s
qu
are
mile
Local Authorities glass collection rate (kg per capita)
Dundee City
City of Edinburgh
Aberdeen City
North Lanarkshire
Argyll and Bute
Glasgow City

Recycling DRS in Scotland
23
23
23
The case of West Lothian Council is an important example of closing the loop on glass without the introduction of a recycling DRS. After having been awarded funding to increase the number of bottle banks in the county, the figure rose substantially from 40 to 150 (30 more were put in place but have since been removed due to complaints from residents). In tandem, the household recycling bin size was reduced from 240 to 140 litres to encourage use of the bottle banks.
Over the last five years, recycled glass tonnage has increased from 1,800 to 2, 400 tonnes per year (and fluctuated around 2,400 tonnes per year for the past three years). The most crucial part of the West Lothian case study lies in the government contract with the local waste management firm which requires all glass recycling to be for remelt only, preventing losses to aggregate etc. Not only does this retain the material value of the glass, it enables the desired, and very much attainable, closed loop for glass.33
Other councils have decided to put any discussions on the implementation of kerbside collection on hold whilst the debate on the implementation of the recycling DRS takes place – Fife being one such example.34
A study by ZWS in 2012 concluded that:35
“While deprivation and high population housing density do correlate to some extent with lower levels of recycling, good quality services can outweigh these disadvantages, and some lower income authority areas and those with higher housing density do perform well above the average, showing that the trend is not inevitable.”
This suggests that the issue with the stalling recycling rates is the lack of investment in the poor performing Local Authorities rather than a general poor performance across all Authorities.
Household waste recycling in Scotland
This section focuses on household waste recycling since this represents the ‘bigger picture’ in terms of waste management infrastructure and can be considered as falling under the objective of the proposed DRS of “encouraging wider behavioural change around materials”.
Figure 12 shows the breakdown of municipal waste recycling in the 32 Local Authorities. This can be seen to show a similar broad trend to that of glass collection shown in Figure 10 and highlights the widescale nature of the challenge to increase recycling rates in Scotland. For example, Glasgow City is again in the bottom five with a recycling rate of just 26.7%. North Lanarkshire represents an interesting case, top of the glass recycling table, due to the Viridor facility, but ranked 8th poorest in terms of overall household waste recycling. This again stresses that the lack of recycling infrastructure is a key causative factor in the relatively low recycling rates and in the current system this is constrained by Local Authority budgetary pressures.
33 Personal communication. West Lothian Council. July 2019.
34 https://www.thecourier.co.uk/fp/news/local/fife/739448/fife-glass-recycling-proposal-on-hold-for-now/ (The Courier, 2018) 35
https://www.zerowastescotland.org.uk/sites/default/files/Glass%20Collection%20%26%20Re-processing%20Options%20report.pdf

Recycling DRS in Scotland
24
Figure 12: Household waste recycling rate in the 32 Scottish Local authorities
Source: National Records of Scotland, accessed 201936
In the same way that Local Authorities have cut back on the quality of their glass recycling schemes, it is reported that the same is happening with overall household waste. For example, Aberdeen City has moved from separate collection to mixed with a brand-new resource recovery facility being commissioned in 2017 to process mixed waste.37
Key Scottish Environment Statistics 2016 reported that 10% of households did not participate in any recycling of newspapers, magazines, paper, cardboard, glass, metal or plastic in the last one month. This again highlights the broad nature of the issue with a need to instil a recycling culture into a significant portion of the population.38
4.3 The quality of the recovered glass in Scotland
It is reported in DRS – the case for glass that “…currently between 20 – 50% of glass is not suitable for closed loop recycling due to the way it is currently collected and processed in Scotland (mixed and crushed)”.
Scotland, and more broadly the UK, has a ‘colour imbalance’ issue with its glass, in that due to the high levels of imports of coloured glass (wine and beer) and exports (spirits in clear glass) there is an imbalance in the colour of the glass required by the glass manufacturers and the colour of the waste glass being generated in Scotland. To address this issue
36 https://www.nrscotland.gov.uk/statistics-and-data/statistics/stats-at-a-glance/council-area-profiles (National Records of Scotland,
accessed 2019) 37 https://www.pressandjournal.co.uk/fp/news/aberdeen/1500631/aberdeen-recycling-quality-lowest-in-scotland/ (The Press and Journal,
2018), http://puttingwastetogooduse.co.uk/2018/08/suez-site-seeing-part-14-altens-east-recycling-and-resource-facility/ (Suez, 2018) 38
https://www.gov.scot/binaries/content/documents/govscot/publications/statistics/2016/10/key-scottish-environment-statistics-2016-
9781786525505/documents/00508344-pdf/00508344-pdf/govscot%3Adocument/00508344.pdf?forceDownload=true (National Statistics/Natural Scotland, 2016)
0
10
20
30
40
50
60
70
Shet
lan
d Is
lan
ds
Ork
ney
Isla
nd
s
Nah
-Eile
anan
Sia
r
Gla
sgo
w C
ity
Du
mfr
ies
and
Gal
low
ay
Du
nd
ee C
ity
Arg
yll a
nd
Bu
te
No
rth
Lan
arks
hir
e
Sco
ttis
h B
ord
ers
Cit
y o
f Ed
inb
urg
h
Hig
hla
nd
Ab
erd
een
shir
e
Ab
erd
een
Cit
y
Sou
th L
anar
ksh
ire
Wes
t D
un
bar
ton
shir
e
Ren
frew
shir
e
East
Du
nb
arto
nsh
ire
Mid
loth
ian
East
Ayr
shir
e
East
Lo
thia
n
Fife
Stir
ling
An
gus
Sou
th A
yrsh
ire
Pe
rth
an
d K
inro
ss
No
rth
Ayr
shir
e
Falk
irk
Inve
rcly
de
Mo
ray
Cla
ckm
ann
ansh
ire
Wes
t Lo
thia
n
East
Ren
frew
shir
e
Rec
yclin
g ra
te (
%)

Recycling DRS in Scotland
25
25
25
alternative, non-colour sensitive recycling options have been developed such as the aggregates market. This therefore drives the method of collection, with mixed, crushed glass being the most cost-effective method of collecting glass that is destined for use as aggregate.
The budgetary constraints on Local Authorities means that the aggregates option is an attractive means of meeting their recycling obligations. For example, an impact assessment by Defra in 2014 compares the net cost of recycling glass through remelt and aggregates. This showed that in 2014 the lower ‘collection and sorting for recycling’ to aggregates resulted in this being cheaper than the remelt route, Table 9. Due to the much higher environmental benefits of closed loop (remelt) recycling, discussed in Section 6, this is considered a market failure.
Table 9: Net impact of recycling glass in the UK, 2014 prices
Best estimate per tonne, £2014 prices Remelt Aggregate
Collection and sorting for recycling -£103.2 -£71.5
Change in landfill cost (collection and gate fee) £61.2 £61.2
Material revenue £24.5 £5.1
Carbon impact £2.0 £1.3
Total net impact per tonne -£15.5 -£4.0
Source: Defra39
Conversely, glass reprocessors have had to adapt their processes to enable the processing of poorer quality feedstock. For example, the Viridor glass recycling facility in Newhouse, North Lanarkshire recycles glass from 17 Scottish local authorities and the facility is reported to recover up to 97% of input materials, achieving up to 99% product purity.40 Newhouse has the capacity to handle up to 200,000 tonnes of glass bottles and MRF-derived material per year, although it is not currently running at full capacity. About 20% of the input is from MRF-derived sources and all the cullet recycled at the facility is sold to bottlemakers, to be manufactured into new bottles and jars.
4.4 Quantities of glass packaging put on the Scottish market
Unit sales in Scotland by product category
Table 10 provides a summary of unit sales of container glass in the UK according to Global Data. To estimate the quantities being placed on the market in Scotland, British Beer and Pub Association (BBPA) data was used to determine the contribution of Scotland. In addition, a population proxy was used.
39 https://assets.publishing.service.gov.uk/government/uploads/system/uploads/attachment_data/file/294272/packaging-targets-ia.pdf
40 http://www.recyclingwasteworld.co.uk/news/uks-most-advanced-glass-recycling-facility-opens-in-north-lanarkshire/88996/ (Recycling
& Waste World, 2015)

Recycling DRS in Scotland
26
Table 10: Unit sales (in millions) of container glass in the UK by product category
Source: GlobalData. Adapted by Oakdene Hollins.
BBPA data
The British Beer and Pub Association (BBPA) reports that Scotland’s contribution to the overall UK sales is:
• Beer: 8.2% of the on-trade and 8.9% of the off-trade.
• Wine: 11% of the on-trade and 9.1% of the off-trade.
• Spirits: 13% of the on-trade and 12.4% of the off-trade.
Therefore, it is considered reasonable to assume that Scotland accounts for 10% of overall UK ‘placed on market’ (POM) sales that would be included within the scope of the DRS, which equates to 2.4 billion units per year.
Population proxy
This does assume that a similar per capita consumption rate exists across the four nations. In 2018, the population of Scotland stood at 5,441,000 and the UK 66,238,000 making Scotland 8.2% of the UK population.
Table 11 shows that the estimated unit sales varies across the two alternative approaches quite considerable, from 834 million using the population proxy to 1,020 million using the BBPA proxy. The top five product categories shown in Table 11 are included in the proposed recycling DRS and the estimates of the number of containers in the scheme varies from 754 million based on the BBPA data and 618 million using the population proxy.
2012 2013 2014 2015 2016 2017 2018
Beer & Cider 3,394 3,555 3,570 3,618 3,640 3,713 3,771
Soft Drinks 982 945 953 928 952 1,001 1,039
Spirits 693 710 724 747 765 787 801
Wines 1,454 1,472 1,512 1,582 1,613 1,660 1,690
Packaged Water 182 191 201 211 222 233 243
Cosmetics and Toiletries 258 259 260 262 264 266 267
Food 2,300 2,286 2,261 2,238 2,218 2,209 2,194
Hot Drinks 136 139 142 146 149 152 155
Household Care 19 19 18 18 18 18 17
Total 9,417 9,575 9,642 9,750 9,841 10,039 10,176
UK unit sales data (in millions)
Product category

Recycling DRS in Scotland
27
27
27
Table 11: Estimated unit sales (millions) in Scotland in 2018
Included in proposed DRS?
Product category UK data Scotland data
BBPA Population
proxy
DRS
Beer & cider 3,771 377 309
Soft drinks 1,039 104 85
Spirits 801 80 66
Wines 1,690 169 139
Packaged water 243 24 20
Non-DRS
Cosmetics & toiletries
267 27 22
Food 2,194 219 180
Hot drinks 155 15 13
Household care 17 2 1
10,1760 1,018 834
Source: GlobalData. Adapted by Oakdene Hollins.
As a third method of quantifying the unit sales in Scotland an assessment was undertaken by a FEVE member using UK Euromonitor data. Furthermore, the FEVE member also estimated the quantity of glass that would be included in scheme, Table 12. The estimated unit sales is lower than the two figures above, at 591 million units. The overall tonnage of 227,400 tonnes is higher than the 188,588 tonnes quoted by ZWS.41
Table 12: Estimated weight of glass in the proposed Scottish DRS
Food and beverage packaging
Average weight of a container (grams)
Number of units (millions)
Tonnes of glass
Beverage bottles (included in the DRS)
300 591 177,300
Beverage jars (non-DRS) 250 23 5,750
Food jars (non-DRS) 210 135 28,350
Food bottles (non-DRS) 200 80 16,000
Total 829 227,400
Source: Analysis by FEVE member based on Euromonitor data.
These three estimates differ significantly from the 0.33 billion containers estimated within the Scottish Governments Full business and regulatory impact assessment Table 13. This level of uncertainty over the scale of the glass that would be included within the scheme places concerns over the cost modelling that has been undertaken and places a risk to the glass producers that they will be faced with extremely inflated costs.
41 https://www.gov.scot/binaries/content/documents/govscot/publications/foi-eir-release/2019/05/foi-19-01048/documents/foi-19-
01048-document1/foi-19-01048-document1/govscot%3Adocument/DRSPB16_03a%2BThe%2BCase%2Bfor%2BGlass%2Breport.pdf (ZWS, 2018)

Recycling DRS in Scotland
28
Table 13: DRS containers distributed in Scotland in 2017 by container type
Container type Number of containers Percentage of containers
Glass bottles (non-refillable) 333,011,097 20%
Metal cans 639,361,200 38%
PET bottles 694,115,099 42%
Total 1,666,487,396 100.0%
Source: Scottish Government42
Trends analysis in unit sales by packaging material in the UK
Beer & cider
Figure 13 shows the breakdown of beer & cider by packaging material. This shows that cans (rigid metal) and glass dominate the market, and both have had the same growth trajectory from 2012 to 2018. This mirrors the trend in the UK of a move from on-trade drinking (pubs and clubs) where draught is the dominant format, to home consumption, where packaged beers are far more prominent. A concern for the glass industry is that the Scottish Government reports that producer fees will be higher for glass than aluminium and appear to be sensitive in such markets as the beer sector where the two packaging formats are competing head-to-head. The statements made by the Scottish Government are:42
• The producer fee will be applied on a per container basis, with the level of the fee determined by the type of material used in the production of the containers.
• Materials that attract a higher sale value for Scheme Administrator, such as aluminium, will likely be subject to a lower fee.
• Materials which have a lower sale value, such as glass, will be subject to a higher fee reflecting the higher net cost of the Scheme Administrator.
• In general, it is not expected that there will be significant shifts in material used given the costs involved and limits on the substitutability of materials.
42 https://www.gov.scot/publications/deposit-return-scheme-scotland-full-business-regulatory-impact-assessment/pages/1/

Recycling DRS in Scotland
29
29
29
Figure 13: Unit sales of beer & cider by packaging material in the UK
Source: GlobalData. Adapted by Oakdene Hollins.
Wine
Figure 14 shows that glass dominates the packaged wine channel, but rigid plastic is on the rise. Although the market is still dominated by glass this growth in rigid plastic represents a major threat to the glass industry.
Figure 14: Unit sales of wine by packaging material in the UK
Source: GlobalData. Adapted by Oakdene Hollins.

Recycling DRS in Scotland
30
Spirits
Figure 15 shows that between 2006 and 2011 there was a significant decline in spirit sales in glass, but since then there has been year-on-year growth in glass. Rigid metal (cans) represents the second largest packaging format by sales units, and this showed a similar trend as glass between 2006 and 2011, but sales have been relatively stable since then.
Figure 15: Unit sales of spirits by packaging material in the UK
Source: GlobalData. Adapted by Oakdene Hollins.
Soft drinks
In the soft drinks channel, Figure 16 shows some significant trends with glass staying stable at about 1 billion units in the UK, and cans showing year-on-year growth and reaching the point in 2018 where cans challenge rigid plastic for the position as market leader. Although paper & board and flexible packaging represent the smallest market share, they are not included within the proposed recycling DRS and hence may become more of a preferred choice from a convenience perspective, especially in the on-the-go channel.

Recycling DRS in Scotland
31
31
31
Figure 16: Unit sales of soft drinks by packaging material in the UK
Source: GlobalData. Adapted by Oakdene Hollins.
Figure 17 illustrates the complexity of the soft drinks market in the UK with nine different packaging formats, six of which are excluded from the proposed DRS for Scotland and account for 13% of the market.
Figure 17: A breakdown of the UK soft drinks sales by packaging material in 2018
Source: GlobalData. Adapted by Oakdene Hollins.

Recycling DRS in Scotland
32
Bottled water
Figure 18 shows bottled water sales by packaging material. This highlights the dominant position of rigid plastic in this market and the extraordinary growth in bottled water sales in this format since 2012. Glass has retained its position at number 2 in the market with a significant proportion of these sales being in the on-trade where glass is seen to have a ‘premium’ status.
Figure 18: Unit sales of bottled water by packaging material in the UK
Source: GlobalData. Adapted by Oakdene Hollins.
Food jars
Figure 19 shows that food jars have maintained sales at about 2.5 billion units. However, flexible packaging and rigid packaging has grown year-on-year with combined sales of 58 billion units in 2018. Although it must be considered as highly speculative, if Local Authorities start reducing their glass recycling services it is possible for non-DRS glass to lose its ‘widely recyclable’ status. This could drive producers and brand owners to switch away from glass food jars, and there are numerous alternatives already on the market.

Recycling DRS in Scotland
33
33
33
Figure 19: Unit sales of food by packaging material in the UK
Source: GlobalData. Adapted by Oakdene Hollins.
Food jars are predominantly made from clear (flint) glass and make up a high percentage of the 46,000 tonnes of clear glass that is not currently recycled in Scotland (see Section 4.1 of this report). The fact that this is excluded from the proposed DRS means that the recycling rate of this much sought-after glass will be dependent on the alternative systems that are in place to capture the non-DRS material.

Recycling DRS in Scotland
34
Hot drinks
Figure 20 shows the market leader in hot drink packaging (paper and board) dropping sales, with flexible packaging rapidly closing the gap. Glass has grown year-on-year albeit at a much slower pace than flexible packaging. The debate over the environmental merits of flexible packaging versus glass is much cited. However, if the ‘widely recyclable’ merits of glass are called into question then the case for flexible packaging would be much stronger.
Figure 20: Unit sales of hot drinks by packaging material in the UK
Source: GlobalData. Adapted by Oakdene Hollins.
The ZWS report states that:43
“The Strategic Environmental Assessment indicates that under business as usual the recycling rate for glass is unlikely to increase above 64% by 2043.”
Although it is acknowledged that the UK packaging targets are heavily dependent on the performance of England, due simply to the much higher volumes of packaging waste being managed in England, it is questioned how no change in glass packaging recycling rate can be considered the base case over the next 25 years (2018 to 2043). For example, Table 2 shows that the business targets for obligated businesses under the current scheme will increase from 78% in 2018 to 87% in 2022.
43 https://www.gov.scot/binaries/content/documents/govscot/publications/foi-eir-release/2019/05/foi-19-01048/documents/foi-19-
01048-document1/foi-19-01048-document1/govscot%3Adocument/DRSPB16_03a%2BThe%2BCase%2Bfor%2BGlass%2Breport.pdf (ZWS, 2018)

Recycling DRS in Scotland
35
35
35
5 Assessment of the proposed recycling DRS
The following assessment of the proposed recycling DRS scheme for Scotland is based on a comprehensive review of other DRS schemes in Europe, see Table 14 for summary.
The inclusion of all three drinks packaging materials is similar to 7 out of 10 of the recycling DRS in operation in Europe. However, due to the many differences in the product scope and implementation of the various DRS schemes, no conclusions should be drawn without a full case-by-case assessment, with consideration of Scotland’s unique situation.
Table 14: Deposit schemes for one-way beverage containers in use across Europe
Country Mandate implemented Materials included
Glass PET Cans
Croatia 2006 ✓ ✓ ✓
Denmark 2002 ✓ ✓ ✓
Estonia 2005 ✓ ✓ ✓
Finland44 1996 cans, 2008 PET, 2012 glass ✓ ✓ ✓
Germany 2003 ✓ ✓ ✓
Iceland 1989 ✓ ✓ ✓
Lithuania 2016 ✓ ✓ ✓
Netherlands 2005 ✓
Norway 1996 ✓ ✓
Sweden 1984 cans, 1994 PET ✓ ✓
Source: ACR+, 201945
5.1 Effectiveness of proposed DRS against criteria
Annex 5 shows the review of the proposed DRS for Scotland in terms of the mapping of the performance of the system against the system criteria.
It is concluded that the scheme is likely to deliver a reduction in littering and the capture rate of the in-scope material. However, the impact the scheme will have on other aspects is heavily dependent on the design of the scheme. It is considered safe to say that it would have limited impact on the circular economy attributes of the packaging that falls outside the scope of the scheme, but that would fall under the scope the Essential Requirements Regulations. This proposed system therefore threatens to do little more than the existing PRN system in simply meeting the needs of the Packaging Waste Regulations with the only substantive added benefit being reduced litter.
44 www.palpa.fi/beverage-container-recycling/deposit-refund-system/ (Palpa, accessed 2019) 45
http://www.acrplus.org/images/technical-reports/2019_ACR_Deposit-refund_systems_in_Europe_Report.pdf (ACR+, 2019)

Recycling DRS in Scotland
36
5.2 Implementation of the recycling DRS in Scotland
Table 15 shows four key system attributes that can be considered ‘enablers’ to the successful implementation of a successful recycling DRS. These attributes are commonplace in the existing schemes operating in Europe. Unfortunately, this shows that Scotland does not have any of these attributes in place, and hence they represent major barriers to the implementation of the DRS in Scotland.
Table 15: Implementation of the recycling DRS in Scotland
Attribute Current system RAG
Transition costs to government and other stakeholders (producers, retailers, etc)
All the existing recycling DRS in Europe involved a transition from refillable DRS to the recycling DRS so much of the infrastructure and consumer behaviour was in place. In Scotland there is no refillable infrastructure
Maturity of the One-way container market at the point of implementation
Finland and Germany show that the recyclable DRS was introduced when the transition from refillables to one-way was in its infancy. In Scotland, the one-way containers account for 100% of the market in many product categories (especially in the retail sector).
Recycling culture
In Scotland there is less of a recycling culture than in many of the countries operating a recycling DRS. Consumers may perceive their existing kerbside collection service to be ‘convenient’ and be reluctant to participate in the recycling DRS
Simple sales channel structure
In the UK the sales channel structure is very complex and product category specific
Source: Oakdene Hollins. (RAG: Green = good performance, Amber = medium performance and Red = poor performance)
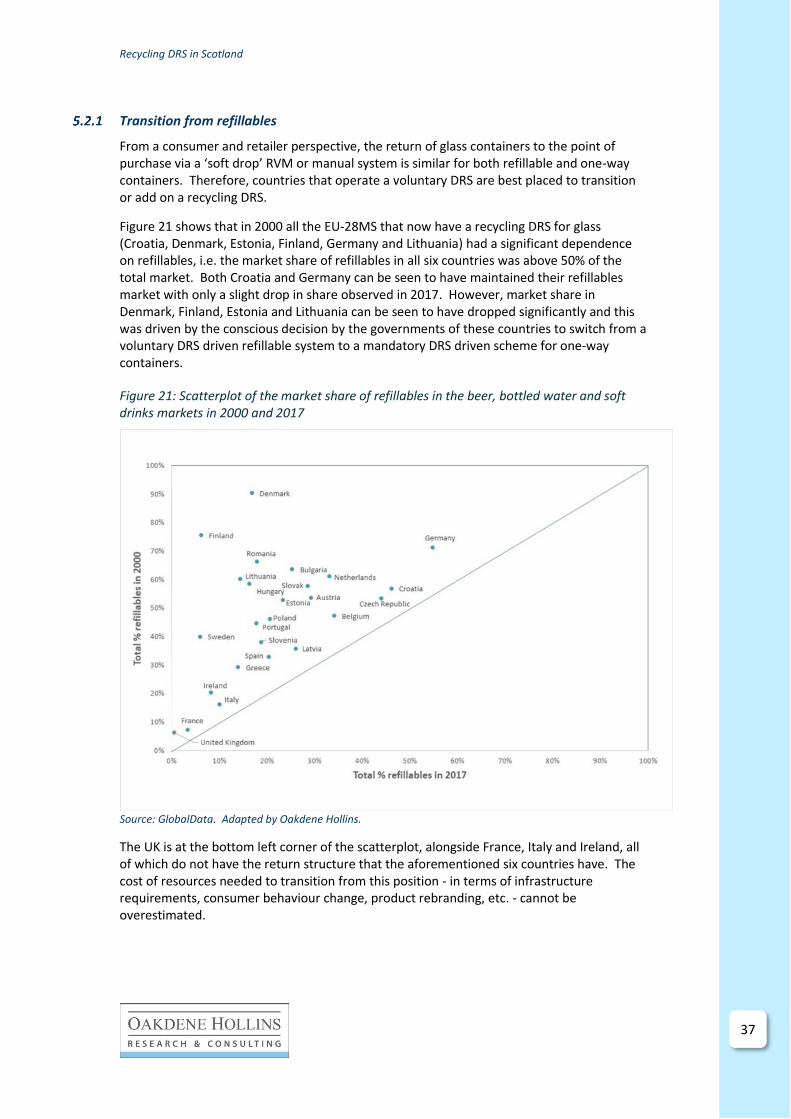
Recycling DRS in Scotland
37
37
37
Transition from refillables
From a consumer and retailer perspective, the return of glass containers to the point of purchase via a ‘soft drop’ RVM or manual system is similar for both refillable and one-way containers. Therefore, countries that operate a voluntary DRS are best placed to transition or add on a recycling DRS.
Figure 21 shows that in 2000 all the EU-28MS that now have a recycling DRS for glass (Croatia, Denmark, Estonia, Finland, Germany and Lithuania) had a significant dependence on refillables, i.e. the market share of refillables in all six countries was above 50% of the total market. Both Croatia and Germany can be seen to have maintained their refillables market with only a slight drop in share observed in 2017. However, market share in Denmark, Finland, Estonia and Lithuania can be seen to have dropped significantly and this was driven by the conscious decision by the governments of these countries to switch from a voluntary DRS driven refillable system to a mandatory DRS driven scheme for one-way containers.
Figure 21: Scatterplot of the market share of refillables in the beer, bottled water and soft drinks markets in 2000 and 2017
Source: GlobalData. Adapted by Oakdene Hollins.
The UK is at the bottom left corner of the scatterplot, alongside France, Italy and Ireland, all of which do not have the return structure that the aforementioned six countries have. The cost of resources needed to transition from this position - in terms of infrastructure requirements, consumer behaviour change, product rebranding, etc. - cannot be overestimated.

Recycling DRS in Scotland
38
Maturity of the one-way container market
The loss of the AG Barr refillable bottle scheme in 2015 means that in Scotland, one-way glass now accounts for nearly 100% of glass beverage packaging and hence the transition to a recycling DRS requires the full-scale transfer of the whole market. Furthermore, there is a need for a scheme to capture the non-DRS material.
Recycling culture
We have discussed earlier that although the recycling rates are slowly increasing in Scotland, it does not have a long history of recycling and it still has a significant contingent of non-participating households.
Simple sales channel structure
The UK has a diverse range of channels in which to purchase beverages, which complicates the recovery of containers through the retailers and on-trade. For example, Table 16 shows the distribution of beer sales in the retail channel. This shows that in Germany the four largest channels in terms of footprint (hypermarkets, supermarkets, discounters and food / drink / tobacco specialists) account for 88.8% of the total sales and the smaller retailers (independent small groceries and convenience stores) account for just 3.7%. This clearly reduces the burden placed on the small retailers in terms of handling and storing returned containers. Although the four largest channels tin the UK have 66.3% of the market, the smaller retailers account for over one-quarter of the market (independent small groceries and convenience stores 26.8%) and a much larger share of the market is through the non-store retailing, i.e. internet or home shopping.
Table 16: Off-trade beer sales by retail channel in 2017
Channel of distribution Beer sales (%)
UK Germany
Hypermarkets 36.1 17.6
Supermarkets 20.4 22.5
Discounters 6.4 25
Food/drink/tobacco specialists 3.4 23.7
Independent small groceries 15.6 2.7
Convenience stores 11.2 1
Forecourt retailers 1.9 5.7
Non-store retailing 5.1 0.5
Total 100.1 98.7 Source: Euromonitor (Agriculture and Agri-Food Canada, 2018)46
Wine is excluded from the recycling DRS in Germany, but Table 17 shows that the discounters account for nearly half (47.5%) of off-trade wine sales. For the UK, the four largest retailers account for 78.9% of sales and hence would be in a good position to handle wine bottles. Interestingly, non-store retailing accounted for 13.3% of sales and this could represent more of a challenge for the delivery vehicles to takeback the empties and return deposits. Alternatively, this could represent a loophole in the recycling DRS, i.e. a source of non-DRS containers on the market. This channel is considered a significant threat to the glass sector since consumers have already demonstrated a willingness to switch retail
46 https://www5.agr.gc.ca/eng/industry-markets-and-trade/international-agri-food-market-intelligence/reports/sector-trend-analysis-
beer-spirits-wine-and-ready-to-drink-high-strength-premixes-in-the-european-union/?id=1539181759431

Recycling DRS in Scotland
39
39
39
channels for convenience and would be most likely to switch packaging format, e.g. a switch from glass bottles to pouches or bag-in-box.
Table 17: Off-trade wine sales by retail channel in 2017
Channel of distribution Wine sales (%)
UK Germany
Hypermarkets 39.8 9.6
Supermarkets 22.2 15
Discounters 4.8 47.5
Food/drink/tobacco specialists 12.1 3
Independent small groceries 2.4 3.5
Convenience stores 4.6 0.5
Forecourt retailers 1.1 3.6
Non-store retailing 13.3 10.5
Total 100.3 93.2 Source: Euromonitor (Agriculture and Agri-Food Canada, 2018)47
Please note: In Sweden and Norway where recycling DRS are used, boxed wine accounts for half the retail shelf space.48 This could represent a serious issue for the glass sector, where bag-in-box or pouches are seen to be more convenient than the deposit-bearing glass. Furthermore, the high price point of the wine in comparison to the deposit is cited to be a possible threat to high capture rates in the recycling DRS, i.e. consumers would prefer to include it in the kerbside scheme.49
Much like the analysis of beer, above, the small retailers account for a significant portion of the spirits market, Table 18 (Independent small groceries and convenience stores 21%), and hence the introduction of the recycling DRS could impact significantly in terms of lost income, material handling and storage costs etc.
Table 18: Off-trade spirit sales by retail channel in 2017
Channel of distribution Spirits sales (%)
UK Germany
Hypermarkets 36.4 15.9
Supermarkets 19.9 21.2
Discounters 5.7 29.7
Food/drink/tobacco specialists 7.9 18.6
Independent small groceries 11.5 3
Convenience stores 9.5 1.1
Forecourt retailers 1.8 5.3
Other grocery retailers 0 2.4
Non-store retailing 7.4 1.3
Total 100.1 98.5 Source: Euromonitor (Agriculture and Agri-Food Canada, 2018)47
47 https://www5.agr.gc.ca/eng/industry-markets-and-trade/international-agri-food-market-intelligence/reports/sector-trend-analysis-
beer-spirits-wine-and-ready-to-drink-high-strength-premixes-in-the-european-union/?id=1539181759431 48 https://www.thedrinksbusiness.com/2018/11/bag-in-box-the-unloved-child-of-the-wine-trade/ (The Drinks Business, 2018)
49 https://repak.ie/wp-content/uploads/2017/12/PMCA-Report-on-Deposit-and-Return-Scheme-in-Ireland-041217-FINAL.pdf (Repak/PMCA Economic Consulting, 2017)

Recycling DRS in Scotland
40
The on-trade (pubs, hotels, restaurants, etc) represents a particular issue, especially since the intention is for the containers to be recovered via the existing outbound delivery system.
To demonstrate the numbers of bottles that would potentially have to be returned via the outbound delivery vehicles, we have made the calculation for wine bottles only, based on the following estimates:
• The Wine and Spirits Trade Association (WSTA) reports that in 2016, 140,575,000 9litre cases were sold in the UK, which equates to 1.686,9 billion bottles50
• The British Beer and Pub Association (BBPA) reports that:
• 18.8% of wine is sold into the on-trade in the UK and Scotland account for 11% of the UK on-trade, and
• Scotland accounts for 9.1% of the UK off-trade.
Based on this data, Figure 22 shows that there are an estimated 120 million glass bottles in the Scottish off-trade and 16.5 million bottles in the Scottish on-trade. The Scottish Government reports51 a total estimated 45.5 million DRS-eligible containers sold in Scottish pubs and clubs each year. This estimation is potentially very low given the fact that glass wine bottles alone are estimated to account for 16.5 million containers or 36% of the total. This excludes beer, spirits, bottled water and soft drinks containers (glass, PET and cans).
Figure 22: A breakdown of wine bottle sales in Scotland
Source: Oakdene Hollins
Key issues and challenges around the proposed recycling DRS for the on-trade (hospitality trade) are:
• Secure storage on-site to prevent public access to the containers.
50 https://www.wsta.co.uk/publications-useful-documents/146-2017-market-overview/file (WSTA, 2017) 51
https://www.gov.scot/publications/deposit-return-scheme-scotland-full-business-regulatory-impact-assessment/pages/1/
Total UK Wine 1.69 billion bottles
Off-trade UK 1.37 billion bottles
Off-trade Scotland 0.12 billion bottles
On-trade UK 0.15 billion bottles
On-trade Scotland 16.5 million bottles

Recycling DRS in Scotland
41
41
41
• High volume manual handling. Taking the Scottish Government figures of 45,448,535 units in the system and a total of 2,840 pubs / bars in Scotland, it is estimated that the average pub / bars would generate 16,000 containers per year, equivalent to 307 containers per week. Please note: A study by the BBPA52 in 2005 estimated that large nightclubs can generate 4,000 containers on just one Friday or Saturday night.
• Reverse logistics cannot be utilised for some of the legs of the journey. Figure 23 shows the difference between the traditional refill system that could fully utilise reverse logistics and the one-way container recycling system. The Scottish Government assumed that hotels, pubs, bars and full-service restaurants would be likely to choose to operate the closed loop arrangement, whereby, customers are not charged the deposit.53
• Vehicle management. High outbound volume (of products) on deliveries later in the week and high inbound volume (of empty containers) early in the week and seasonality / event issues in balancing outbound and inbound capacity.
• Traceability of returns. One vehicle may collect empty containers from about 10 drops on a round; so how to ensure that the deposits are returned to the correct outlet?
• Crate or container management?
Figure 23: A comparison between the traditional refillable glass flow chart and the proposed recycled DRS
Source: The British Beer and Pub Association52
52 bbpa_reverse_haul_report.pdf 53
https://www.gov.scot/publications/deposit-return-scheme-scotland-full-business-regulatory-impact-assessment/pages/1/

Recycling DRS in Scotland
42
1Please note: in the case of empty glass in the refillable system the glass is not waste, whereas, the empty glass in the one-way recycling system is waste. This may cause an issue from a transportation of waste perspective, i.e. would there be a need for the distribution companies to have a waste carriers’ licence?
5.3 Economic and social sustainability
The ‘business case’ refers to the recycling (one-way) DRS as a form of EPR initiative. It must be stressed that a significant proportion of the revenue from the scheme is generated through the unredeemed deposits, i.e. consumers not returning the empty containers and redeeming their deposits and through the revenue from the sale of materials. Figure 24 shows that at the target capture rate of 90% the producer fees account for just 32% of the total revenue. This cannot therefore be considered a system where the producer pays the full net costs of waste management.
Figure 24: A breakdown of the proposed revenue streams in the Scottish recycling DRS
Source: Scottish Government54
Figure 25 shows a breakdown of the direct cost of operating the recycling DRS to consumers at various capture rates. This shows that at a capture rate of 80% the consumers would be paying £67.8 million in unredeemed deposits which equates to 84% of the scheme revenue. This suggests that Producer Fees are likely to be very modest in the first few years of the scheme while the scheme is in its infancy and capture rates slowly increase.
54 https://www.gov.scot/publications/deposit-return-scheme-scotland-full-business-case-stage-1/
Unredeemed deposits
42%
Sale of materials26%
Producer fee32%

Recycling DRS in Scotland
43
43
43
Figure 25: Cost to consumers of operating the DRS
Source: Oakdene Hollins
Conversely, in the case of glass, the capture rates are typically high and the material prices low, which will place greater pressure on the Producer Fees. For example, Table 19 shows the very low price per tonne for glass against the price for the other materials included in the proposed DRS. The revenue generated through material sales will not therefore be as significant a revenue stream as that for metal and plastics. To compound this issue, glass is the most difficult material to handle through a recycling DRS and countries such as Denmark, see Annex B, apply much higher handling fees for glass.
Table 19: WRAP’s material prices per tonne in the UK and projections – best estimate
Material 2015 2016 2017 2023 2027
Glass 9.9 11.6 12.1 11.2 11.2
Aluminium 722.4 694.9 722.4 713.2 713.2
Steel 67.8 49.3 108.7 75.3 75.3
Plastics 158.2 150.4 182.2 163.6 163.6
Source: Defra, 201955
Table 20 shows that the proposed intervention of the recycling DRS is expected to increase the glass packaging recycling rate in the UK from 67% in 2016 to 82% in 2025. This far exceeds the EU glass packaging recycling rate of 70%. However, a number of Scottish Local Authorities have already committed to cutting back on their glass recycling services, and other countries have shown that high capture rates in the recycling DRS do not automatically translate into high overall material recycling rates - Estonia and Croatia being cases in point for glass recycling.
55 https://consult.defra.gov.uk/environmental-quality/consultation-on-reforming-the-uk-packaging-
produce/supporting_documents/packagingeprconsultimpactassessment.pdf
101,7
67,8
33,9
00
20
40
60
80
100
120
70 80 90 100
Rev
enu
e ge
ner
ated
fro
m c
on
sum
ers
fro
m
un
red
eem
ed d
epo
sits
(£
mill
ion
)
Capture rate of recycling DRS (%)
Cost of operating the scheme £80.7million

Recycling DRS in Scotland
44
Table 20: Expected impact of proposals on UK packaging recycling rates by 2025.
Packaging material
2016 recycling
rate
Consistent collections
Packaging reform
DRS Projected 2025 rate
EU target 2025
Glass 67% 4% 0% 11% 82% 70%
Aluminium 51% 4% 0% 13% 68% 50%
Steel 74% 5% 0% 1% 80% 70%
Plastic 45% 4% 3% 2% 55% 50%
Source: Defra, 201956
Table 21 shows the percentage of each packaging material that will be covered in the DRS. The relatively high figure for glass packaging (76.5%) would be expected to increase the quality of the glass being recovered to be improved, but the overall quantity of glass recovered is difficult to predict. A key concern is that the non-DRS (23.5%) would be far more costly to recover and hence some Local Authorities may decide to abandon their glass recycling schemes (especially separate kerbside collections). This trend is already being observed prior to the implementation of the scheme due to cost constraints. The PET figure of just 13.8%, shows that the key driver for the introduction of such a scheme is not to significantly increase the overall material recycling, but to minimize littering.
Table 21: The estimated total tonnes of packaging in the DRS
Container type Drinks packaging
included in the DRS (tonnes)
Total packaging in the UK by material
% of total in the DRS
Glass bottles 1,835,931 2,400,000 76.5
Aluminium cans 119,421 200,000 59.7
Steel cans 34,760 600,000 5.8
PET bottles 317,427 2,300,000 13.8
Total 2,307,538 5,500,000 42.0
Source: Defra, 201957
The report DRS – The case for Glass58 states that “glass is also a particular health problem for children”. “Of 241 children, 83 (34%) had been cut at least once while walking outdoors”. 0.8% of glass bottles are littered.
The glass industry is fully aware of the health and safety issues associated with glass, especially in the context of broken bottles being thrown away and have a campaign to tackle this issue. However, it questions and challenges the aforementioned statements and facts
56 https://consult.defra.gov.uk/environmental-quality/consultation-on-reforming-the-uk-packaging-
produce/supporting_documents/packagingeprconsultdoc.pdf 57 https://consult.defra.gov.uk/environmental-quality/consultation-on-reforming-the-uk-packaging-
produce/supporting_documents/packagingeprconsultimpactassessment.pdf 58 https://www.gov.scot/binaries/content/documents/govscot/publications/foi-eir-release/2019/05/foi-19-01048/documents/foi-19-
01048-document1/foi-19-01048-document1/govscot%3Adocument/DRSPB16_03a%2BThe%2BCase%2Bfor%2BGlass%2Breport.pdf (ZWS, 2018)

Recycling DRS in Scotland
45
45
45
on littering and the potential impact of the DRS on reducing the incidents of glass breakages on pavements, etc.
Three reports on littering cited in the ZWS reports were reviewed59,60, 61 and the following observations can be made:
In the case of PET bottles, metal cans and whole glass bottles that are littered, they can be classified under the general category of ‘a lazy or thoughtless action’ by an individual with an immediate desire to be rid of litter as quickly as possible. This is considered a behaviour that can be tackled through a DRS or more bins, awareness raising etc. However, the deliberate smashing of glass on the ground cannot be considered in the same context. This is a serious criminal act that is perceived to be ‘rebellious or cool’ or is undertaken under the influence of drink. It is considered extremely unlikely that such behaviour can be mitigated through the introduction of a recycling DRS and hence should not be considered a major point of justification for the introduction of such a scheme.
Table 22 shows the output from the modelling exercise undertaken by the Scottish Government as part of the Full business and regulatory impact assessment and shows that it is the high valuation of the societal benefits that makes the proposed scheme ‘net positive’. It is reported that “the majority of these societal benefits are derived from the reduced disadvantage to local neighbourhoods from targeting a highly visible component of the litter stream and the value of avoided carbon emissions”. Four out of 12 of the businesses consulted for views on the proposed Scottish DRS (Ardagh, Highland Spring, SWA and SESA) stressed that it would have no or minimal impact on litter, and the Co-op group stated that “its costs for litter management would not reduce, although there may be a modest reduction in littering”.62
Table 22: Costs and benefits of a DRS for Scotland - NPV
Actor Name Costs (£m) Benefits (£m) Net Benefit (£m)
Local Authorities -46.3 237.5 191.1
Business -1,537.7 1,153.4 -384.3
Regulator -4.8 0 -4.8
Society -821.9 1,101.3 279.4
Total -2,410.7 2,492.2 81.6
Source: Scottish Government62
In the comparative EPR model, the Scottish Government’s Full business and regulatory impact assessment states that “the litter enforcement strategy costed in this option reflects that an EPR scheme has significantly lower impact on littering behaviour (but on a wider range of packaging materials) than the impact achieved by a DRS”. Firstly, it should be noted that the litter enforcement strategy is likely to have a significant impact on all litter
59 http://www.haveyougotthebottle.org.uk/wp-content/uploads/2019/03/LitteringEunomiaMarch2019.pdf 60
https://www.zerowastescotland.org.uk/sites/default/files/Rapid%20Evidence%20Review%20of%20Littering%20Behaviour%20and%20Anti-Litter%20Policies.pdf 61 https://www.zerowastescotland.org.uk/sites/default/files/Scotland%27s%20Litter%20Problem%20-%20Full%20Final%20Report.pdf 62
https://www.gov.scot/publications/deposit-return-scheme-scotland-full-business-regulatory-impact-assessment/pages/1/

Recycling DRS in Scotland
46
and not just packaging materials, and secondly, the experience of Austria demonstrates that such strategies can be highly effective.
Table 23 shows that the societal benefits assigned to the EPR model that includes a litter enforcement strategy was £252 million, just 23% of that modelled for the DRS (£1,101 million) shown in Table 22. Please note: The Scottish Governments report states that with respect to the comparison of the DRS versus EPR options that “it is not possible to isolate the costs and benefits of DRS containers within the EPR output, so the NPV analysis provided includes wider household packaging”. It is suggested that this unfairly penalizes the EPR option since it would heavily inflate the costs to business of operating the EPR for all household packaging shown in Table 23.
Furthermore, the estimated costs to business of implementing the EPR appears to be very high, since the major component of the costs is the transfer of the waste management costs from the Local Authorities to businesses, in line with the ‘polluter pays’ principle, and Table 23 shows the Local Authority benefits (£284 million) to be much lower than the £670 million costs incurred by business. Additional costs to business would include the cost of littering and possibly fly tipping, although fly tipping is less prevalent for beverage containers than other forms of waste. Although the actual estimated cost to business can be challenged , Table 23 does demonstrate the true ‘polluter pays’ nature of the EPR with business accounting for £670 million of the £675 million costs at zero cost to Local Authorities and Society.
Table 23: Costs and benefits of an EPR for Scotland - NPV
Actor Name Costs (£m) Benefits (£m) Net Benefit (£m)
Local Authorities 0 284.3 284.3
Business -669.7 189.8 -479.9
Regulator -5.3 0 -5.3
Society 0 251.7 251.7
Total -675.1 725.8 50.7
Source: Scottish GovernmentError! Bookmark not defined.
Please note: The Scottish Government’s Full business and regulatory impact assessment63 reports that all modelling is based on the best practice case for the recycling DRS of a capture rate of 90% and that this capture rate is “not anticipated to be achievable under the EPR where a rate of 71% is modelled”. On the basis of the findings shown in Figure 3, it is considered appropriate to at least use a similar figure of 90% for the modelling of the EPR scheme since there are four countries that currently operate above this level. This is considered more realistic than using the current best practice for EPR (100%, in Slovenia).
63 https://www.gov.scot/publications/deposit-return-scheme-scotland-full-business-regulatory-impact-assessment/pages/1/

Recycling DRS in Scotland
47
47
47
5.4 Review of environmental impact
The Scottish Government’s Strategic Environmental Assessment: Post Adoption Statement reports three environmental considerations in the design, development and implementation of the DRS:64
• To contribute to meeting the recycling target of ensuring 70% of all waste is recycled by 2025, as set out in the Zero Waste Plan.65
• To embed circular economy principles into the design of packaging materials for reuse, recycling and recovery in partnership with packaging industries, as part of the transformation led by the Scottish Government’s Making Things Last – A Circular Economy Strategy66 and Safeguarding Scotland’s Resources: Blueprint for a more Resource Efficient and Circular Economy (SSR).67
• To enable the public to adopt alternative behaviours to waste management, through access to improved recycling opportunities, awareness campaigns and targeted efforts to tackle littering in both terrestrial and marine environments (consistent with the Scottish Government’s Towards a Litter Free Scotland: A Strategic Approach to Higher Quality Local Environments68 and its A Marine Litter Strategy for Scotland69).
These three elements are discussed below.
Meeting the recycling target
64 https://www.gov.scot/publications/deposit-return-scheme-scotland-strategic-environmental-assessment-post-adoption-statement/
65 https://www.gov.scot/publications/scotlands-zero-waste-plan/
66 https://www2.gov.scot/Resource/0049/00494471.pdf
67 http://www.gov.scot/Publications/2012/06/4215
68 http://www.gov.scot/Resource/0045/00452542.pdf 69
http://www.gov.scot/Publications/2014/09/4891/downloads

Recycling DRS in Scotland
48
Table 24 shows that the target capture rate of 90% within the proposed recycling DRS in Scotland represents best practice as seen in Denmark in 2016. However, the impact of the DRS on the overall glass packaging recycling rate depends on the relative quantity of glass included within the DRS. For example, in Germany the DRS accounts for a maximum of just 4.6% of the glass being recycled with the EPR scheme managing most glass, whereas in Croatia 82% of glass is managed through the recycling DRS.

Recycling DRS in Scotland
49
49
49
Table 24: Glass return rates versus overall glass packaging recycling rates across the EU-28MS and EFTA
Country
Glass return rate (%) Overall glass packaging recycling rate in
2016 (%) 2015 2016 2017
Croatia 86 82 56.4
Denmark 89 90 85.0
Estonia 87 87 89 63.4
Finland70 88 88 87 89.8
Germany Not available 85.5
Lithuania 83 71.0
Source: Eurostat and ACR+, 201971
For the Scottish scheme, it is anticipated that about 75% of glass will be managed through the recycling DRS. Therefore, a capture rate of 90% within the recycling DRS equates to an overall recycling rate of 67.5%, and hence to meet the 70% target there would be a need for 2.5% of glass to be recovered from outside the scheme, i.e. a 10% recycling rate for the 25% of glass that is non-DRS. Although it is highly unlikely that all Local Authorities will stop glass collections in Scotland it does signify that the recycling DRS alone would not satisfy the 70% target.
Figure 26 shows that the four countries across Europe with the highest recycling rate for glass all operate an EPR-only scheme with a recycling rate in excess of 90%. The EPR schemes work in a similar way to a PRN scheme in that they are material- rather than product- specific, and hence a 90% recycling rate within the scheme equates directly to a 90% overall recycling rate. Given that the target of 70% is in six years’ time, this is achievable within this timescale using an EPR only scheme.
70 www.palpa.fi/beverage-container-recycling/deposit-refund-system/ (Palpa, accessed 2019) 71
http://www.acrplus.org/images/technical-reports/2019_ACR_Deposit-refund_systems_in_Europe_Report.pdf (ACR+, 2019)

Recycling DRS in Scotland
50
Figure 26: The glass packaging recycling rate across Europe
Source: Eurostat. Key: Red = MS operates a DRS for one-way glass; Blue = MS does not operate a DRS for one-way glass
Embedding circular economy principles
The segregated nature of the collection through reverse vending machines or sorting facilities enables the quality of the recovered material to be maximised. This results in a very high purity waste stream that can be utilised in closed loop recycling, i.e. remelt. Some countries, such as Denmark, have introduced a Circular Economy Fee as an extension to their recycling DRS, penalising producers that place hard-to-recycle packaging material onto the market. However, most of the glass that is included within the DRS is predominantly classified as ‘widely recyclable’ and hence the Circular Economy Fee only applies to a very small number of containers included within the scheme.
In terms of unintended consequences, the introduction of a deposit on such low price point products as single use plastic bottled water containers could result in more consumers shifting to refillable containers that they fill at home. This ‘reuse’ scenario would be considered very positive from a circular economy perspective.
The alternative EPR schemes are in place to increase overall recycling rates and are volume-based so have the same general benefits of the current PRN scheme. They can also involve producer fees or taxes that are modulated, depending on the type of packaging being placed on the market. For example, Austria, Croatia and Lithuania have waste management or recycling fees, environmental pollution taxes or material specific packaging tariffs in place that operate in a similar way to that of the Circular Economy Fee in Denmark and this is applied to a wide spectrum of products and materials. For example, in Croatia businesses producing plastic carrier bags pay the highest fees, in Austria it is beverage cartons, etc.
Since the alternative EPR scheme generally applies across all packaging materials it is best placed to embed circular economy principles. This most applies to the non-DRS materials that are not widely recyclable or where other criteria can be introduced, e.g. recycled content, etc.

Recycling DRS in Scotland
51
51
51
Public adoption of alternative behaviours
The financial incentive to return the containers within the proposed recycling DRS will be enough to provide a behaviour change in some consumers and equally, for others, the deposit will act as a means of raising consumer awareness of the environmental benefit of returning containers. However, it is very difficult to quantify the level of impact the introduction of the proposed recycling DRS will have on consumer behaviour.
In EPR schemes such as that operating in Austria, funds are allocated to communications, campaigns and general litter strategies that can have a significant impact on consumer behaviour. However, much like the observations made for the proposed recycling DRS, it is extremely difficult to predict how significant the behaviour change will be. For example, how will it impact on the 10% of households in Scotland that are currently non-participators in the recycling schemes currently operating for the collection of packaging.

Recycling DRS in Scotland
52
6 Key findings
6.1 Review of current waste management systems in place in Scotland
In general, the highest recycling rates for any waste materials are achieved where there is source-separated collection, good governance of waste management systems, and effective public communication initiatives. Unfortunately, there are only a small number of Local Authorities in Scotland that operate in this fashion. Many of the current waste management systems in place in Scotland cannot be considered fit for purpose in any of these aspects, with a very high reliance on individual Local Authorities or individual waste management companies to invest and deliver the recycling service.
6.2 Review of Scottish Government statements on the proposed recycling DRS
This section reviews 12 statements made by the Scottish Government on how the proposed recycling DRS will operate and the perceived outcomes.
DRS as an instrument for implementing Extended Producer Responsibility (EPR)
According to the Scottish Government statement “DRS will operate as an instrument for implementing Extended Producer Responsibility (EPR), where producers who benefit from placing material onto the market incur the costs of ensuring appropriate treatment at end of life.”72
“…the option we consider is to reform the packaging producer responsibility system so that producers cover the full net end-of-life costs of municipal packaging.”73
These statements indicate the Scottish Government’s intention to ensure all producers who put packaged products on the market pay for the end of life costs. A mandatory EPR scheme is due to be introduced by 2023. The mandatory EPR scheme must apply to all packaging whereas the DRS proposed by Scotland only covers part of the packaging put on the market and therefore can only be introduced alongside investment in existing collection schemes. The DRS alone therefore is not sufficient to implement EPR. An estimated 26% of glass packaging falls outside the DRS requiring continued investment in existing collection schemes to catch this.
The Scottish Government’s estimated total annual cost of running the DRS scheme is placed at £80.7 million and this will be met through three revenue streams: producer fees, sale of materials and unredeemed deposits. Figure 27 shows that at the target capture rate of 90%, the producer fees account for just 32% of the total revenue. This cannot therefore be considered a system where the producer pays the ‘full net costs’ of waste management.
72 https://www.gov.scot/publications/deposit-return-scheme-scotland-full-business-case-stage-1/ 73
https://www.gov.scot/publications/deposit-return-scheme-scotland-full-business-regulatory-impact-assessment/pages/1/

Recycling DRS in Scotland
53
53
53
Figure 27: A breakdown of the proposed revenue streams in the Scottish recycling DRS
Source: Scottish Government74
Consumers will be paying the unredeemed deposits: Figure 28 shows a breakdown of the direct cost of operating the recycling DRS to consumers at various capture rates. This shows that at a capture rate of 80%, the 20% unredeemed deposits represents a cost to consumers of £67.8 million, which equates to a contribution to overall scheme revenue of 84% . (£67.8 million from unredeemed deposits with the scheme costs at £80.7 million) At a capture rate of 70% the scheme would generate a revenue surplus of £21 million (£101.7 million from unredeemed deposits with the scheme costs at £80.7 million) from unredeemed deposits alone. This suggests that Producer Fees are likely to be very modest in the first few years of the scheme while the scheme is in its infancy and capture rates slowly increase.
Figure 28: Cost to consumers of operating the DRS
Source: Oakdene Hollins
74 https://www.gov.scot/publications/deposit-return-scheme-scotland-full-business-case-stage-1/
Unredeemed deposits
42%
Sale of materials26%
Producer fee32%
101,7
67,8
33,9
00
20
40
60
80
100
120
70 80 90 100
Rev
enu
e ge
ner
ated
fro
m c
on
sum
ers
fro
m
un
red
eem
ed d
epo
sits
(£
mill
ion
)
Capture rate of recycling DRS (%)
Cost of operating the scheme £80.7million

Recycling DRS in Scotland
54
The Scottish Government75 estimates that the societal costs, measured as net present value over 25 years, will be £822 million, consisting of £657 million in unredeemed deposits and £165 million in the value of public time (a valuation of the time consumers spend participating in the scheme). This is based on the realisation of the 90% capture rate, and hence if the capture rate falls short this number would increase significantly; at a capture rate of 80% the cost to consumers of unredeemed deposits would double to over £1.3 billion, but there would be a slight reduction in the costs attributed to public time, to 8/9ths of the £165 million figure (£147 million).
Although the contribution of consumers to the scheme may appear high, these estimates are lower than the associated costs in the recycling DRS in operation in Norway. Figure 29 shows that the ‘income from DRS’ (i.e. unredeemed deposits) account for 86% of the revenue in the Norwegian scheme and ‘administration fees’, paid by the producers, only account for 5% of revenue.
Figure 29: A breakdown of revenue streams in the Norwegian recycling DRS.
Source: Infinitum 2017 annual report
The recycling rate for glass will increase above 64% by 2043 without DRS
According to the Scottish Government, “The Strategic Environmental Assessment indicates that under business as usual the recycling rate for glass is unlikely to increase above 64% by 2043”.75 However this statement does not take into account the new recycling targets set for glass nor the eventual introduction of a mandatory EPR scheme by 2023.
The February 2019 report Consultation on reforming the UK packaging producer responsibility system states that:76
“This (the current system) has helped to drive recycling of packaging waste from 25%, 20 years ago, to 64.7% in 2016. Over this period, we have met all our UK and EU packaging
75 https://www.gov.scot/publications/deposit-return-scheme-scotland-full-business-regulatory-impact-assessment/pages/1/
76 https://consult.defra.gov.uk/environmental-quality/consultation-on-reforming-the-uk-packaging-
produce/supporting_documents/packagingeprconsultdoc.pdf (Defra, 2019)
Income from DRS86%
Sale of material7%
Administration fees5%
Other revenue2%

Recycling DRS in Scotland
55
55
55
waste recycling targets, and the cost of compliance to business has been kept low when compared to other Member States.”
The last EU Packaging Directive recycling target for the UK was some 11 years ago (60% for glass recycling in 2008) and since then there has been little incentive for the UK to increase the recycling rate and it has inevitably stalled (Figure 30). However, new glass recycling targets of 70% by 2025 and 75% by 2030 have been set at a European level77 and based on previous performance. it would be anticipated that these targets would be achieved via the existing PRN system (discussed in Section 3.1).
The likelihood of the glass packaging recycling rate in Scotland being higher than 64% in 2025, let alone 2043, is therefore very high.
Figure 30: The glass packaging recycling rate in the UK
Source: Eurostat
Volume of containers: significant impacts towards upsizing can be anticipated
“The Scottish DRS would apply a 20p deposit on all containers within scope, regardless of the size of the product in question. This means that a 330ml can of soft drink would have the same deposit as a 500ml or 2,000ml equivalent product, which would increase the price per ml of smaller products relatively to larger products. In turn, this could have an impact on consumer demand and consumption decisions.”78
“This increase in the real average price per ml of DRS-applicable products is mirrored across all different product types that have been analysed, in both the soft and alcoholic sectors, using the Kantar data. This suggests that DRS could impact consumer choice, incentivising a shift, to some extent, towards purchasing larger sized products compared to what they were purchasing before although the magnitude of this change is likely to be small and would not be expected to cause consumers to change their choice or preference for a certain brand.
77 https://eur-lex.europa.eu/legal-content/EN/TXT/?uri=LEGISSUM%3Al21207 (EU Directive, 2018) 78
https://www.gov.scot/publications/deposit-return-scheme-scotland-full-business-regulatory-impact-assessment/pages/1/

Recycling DRS in Scotland
56
The decision to pursue a scheme design which maximises consumer convenience and targets a high capture rate should also help to mitigate this impact.”78
Croatia operates a similar recycling DRS in which the deposit is fixed irrespective of the volume of the container. Figure 31 shows the impact the introduction of the recycling DRS in 2006 had on the 25cl glass beer bottle, with an 80 million unit reduction in sales between 2006 and 2017.
Figure 31: The beer market in one-way glass in Croatia
Source: GlobalData. Adapted by Oakdene Hollins.
Figure 32 shows the growth in the sales of the 2litre one-way PET beer bottle after the introduction of the recycling DRS in 2006, at the expense of the 1litre bottle.
Figure 32: The beer market in one-way PET in Croatia
Source: GlobalData. Adapted by Oakdene Hollins.
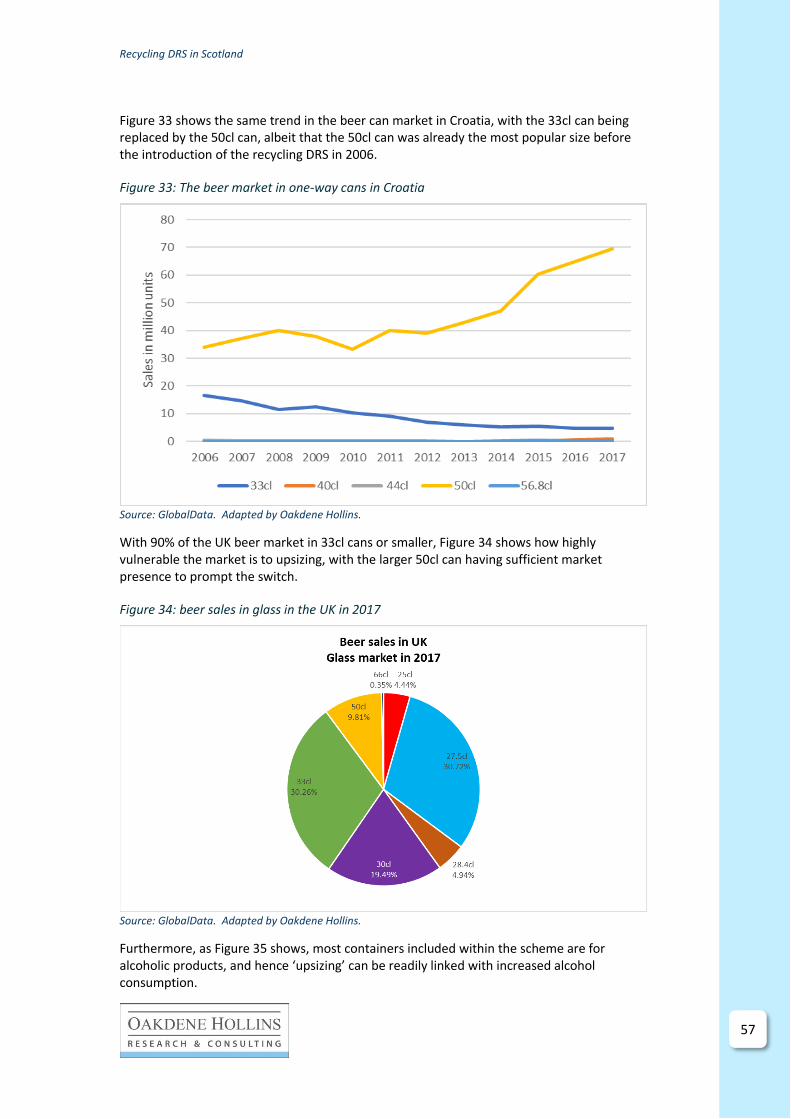
Recycling DRS in Scotland
57
57
57
Figure 33 shows the same trend in the beer can market in Croatia, with the 33cl can being replaced by the 50cl can, albeit that the 50cl can was already the most popular size before the introduction of the recycling DRS in 2006.
Figure 33: The beer market in one-way cans in Croatia
Source: GlobalData. Adapted by Oakdene Hollins.
With 90% of the UK beer market in 33cl cans or smaller, Figure 34 shows how highly vulnerable the market is to upsizing, with the larger 50cl can having sufficient market presence to prompt the switch.
Figure 34: beer sales in glass in the UK in 2017
Source: GlobalData. Adapted by Oakdene Hollins.
Furthermore, as Figure 35 shows, most containers included within the scheme are for alcoholic products, and hence ‘upsizing’ can be readily linked with increased alcohol consumption.

Recycling DRS in Scotland
58
Figure 35: Estimated breakdown of glass containers by product category included in the proposed recycling DRS for Scotland. Unit sales shown in millions in 2018
Source: Oakdene Hollins based on GlobalData
The countries with the highest glass packaging recycling rates do not operate a DRS.
The Scottish Government’s Full business and regulatory impact assessment79 reports that all modelling is based on the best practice case for the recycling DRS of a capture rate of 90% and that this capture rate is “not anticipated to be achievable under the EPR where a rate of 71% is modelled”.
“…it is not possible to isolate the costs and benefits of DRS containers within the EPR output, so the (Net Present Value) NPV analysis provided includes wider household packaging…”
Therefore, the modelling exercise is based on a recycling DRS that includes only PET, metallic cans and glass drinks containers, which equates to 150,500 tonnes of packaging waste. However, the EPR model includes all household packaging materials including glass, paper, card, steel, aluminium and plastics, which equates to 545,000 tonnes of packaging waste.80
The current recycling rate for all the household packaging material included within the EPR model is much lower than that of the material in the proposed recycling DRS, with 245,000 tonnes currently being recycled, equating to a recycling rate of 45%, i.e. 245,000 tonnes of the 545,000 tonnes is currently recycled.81 A key reason for the lower rate of recycling is that the material included in the EPR scheme includes more problematic packaging waste streams including black plastic food trays, plastic film and containers for household chemicals, etc., which are not widely recyclable or considered recyclable by consumers. The anticipated recycling rate of 71% across all packaging wastes would support the Scottish
79 https://www.gov.scot/publications/deposit-return-scheme-scotland-full-business-regulatory-impact-assessment/pages/1/
80 https://www.gov.scot/publications/deposit-return-scheme-scotland-full-business-case-stage-1/
81 https://www.gov.scot/publications/deposit-return-scheme-scotland-full-business-regulatory-impact-assessment/pages/1/
Beer & cider; 339; 37%
Soft drinks; 94; 10%Spirits;
72; 8%
Wines; 152; 17%
Packaged water; 22; 2%
Non-DRS; 237; 26%

Recycling DRS in Scotland
59
59
59
Government’s target82 of recycling 70% of household waste by 2025. Conversely, for a scheme that includes the DRS to achieve the 70% target, additional systems would need to be put in place to manage the non-DRS waste and the full cost benefits of this ‘dual system’ should be considered if the comparison between the two schemes is to be fair and reasonable.
To highlight the high level of distortion the modelled scenarios have, Figure 36 shows the
glass packaging recycling rates across Europe with the top four best performing countries
(those with a recycling rate in excess of 90%) all operating an EPR-only model. Furthermore,
in countries such as Germany, where it is implied that the high overall recycling rate is due to
the operation of a recycling DRS, latest figures show that only a very small portion (4.6%) of
the glass is recovered through the recycling DRS. Most of the glass (84.3%) is collected
through the EPR scheme (
82 https://www.gov.scot/policies/managing-waste/

Recycling DRS in Scotland
60
Table 25). Please note: Taking the German case whereby the recycling rate from the glass captured through the recycling DRS is 95-98%, a capture rate of 90% equates to a recycling rate of between 85.5% and 88.2%.
Figure 36: The glass packaging recycling rate across Europe
Source: Eurostat. Key: Red = MS operates a DRS for one-way glass; Blue = MS does not operate a DRS for one-way glass
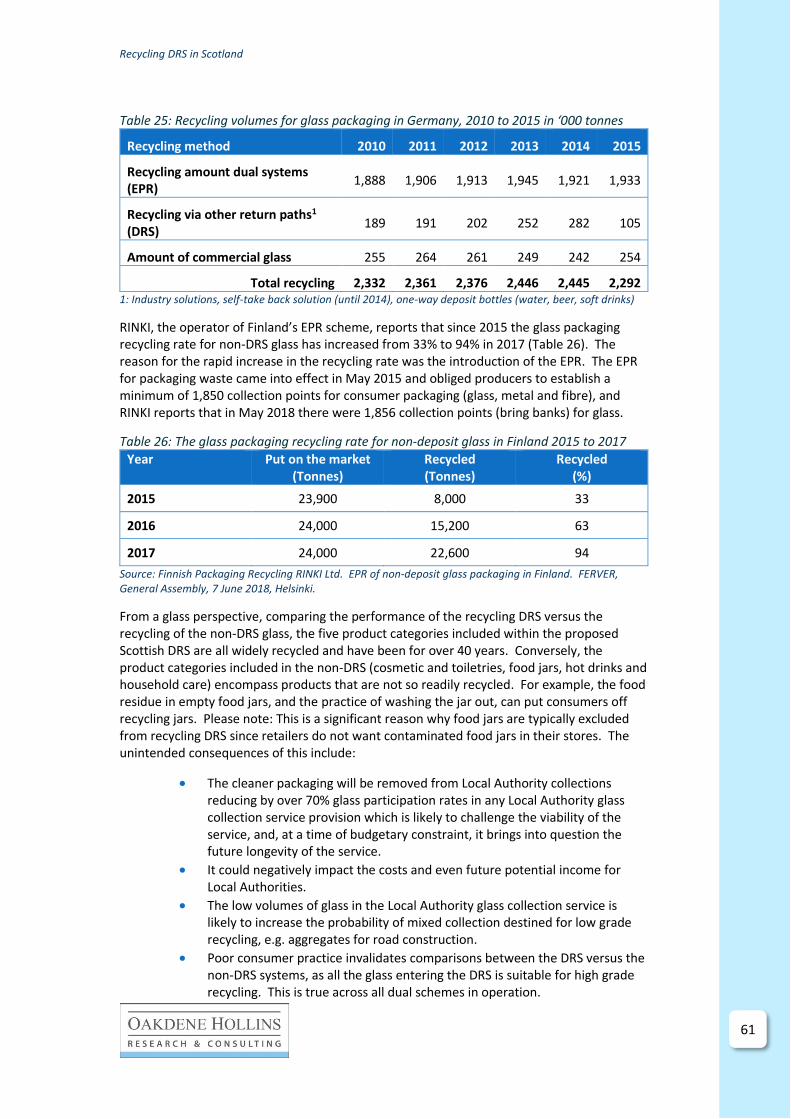
Recycling DRS in Scotland
61
61
61
Table 25: Recycling volumes for glass packaging in Germany, 2010 to 2015 in ‘000 tonnes
Recycling method 2010 2011 2012 2013 2014 2015
Recycling amount dual systems (EPR)
1,888 1,906 1,913 1,945 1,921 1,933
Recycling via other return paths1
(DRS) 189 191 202 252 282 105
Amount of commercial glass 255 264 261 249 242 254
Total recycling 2,332 2,361 2,376 2,446 2,445 2,292 1: Industry solutions, self-take back solution (until 2014), one-way deposit bottles (water, beer, soft drinks)
RINKI, the operator of Finland’s EPR scheme, reports that since 2015 the glass packaging recycling rate for non-DRS glass has increased from 33% to 94% in 2017 (Table 26). The reason for the rapid increase in the recycling rate was the introduction of the EPR. The EPR for packaging waste came into effect in May 2015 and obliged producers to establish a minimum of 1,850 collection points for consumer packaging (glass, metal and fibre), and RINKI reports that in May 2018 there were 1,856 collection points (bring banks) for glass.
Table 26: The glass packaging recycling rate for non-deposit glass in Finland 2015 to 2017
Year Put on the market (Tonnes)
Recycled (Tonnes)
Recycled (%)
2015 23,900 8,000 33
2016 24,000 15,200 63
2017 24,000 22,600 94
Source: Finnish Packaging Recycling RINKI Ltd. EPR of non-deposit glass packaging in Finland. FERVER, General Assembly, 7 June 2018, Helsinki.
From a glass perspective, comparing the performance of the recycling DRS versus the recycling of the non-DRS glass, the five product categories included within the proposed Scottish DRS are all widely recycled and have been for over 40 years. Conversely, the product categories included in the non-DRS (cosmetic and toiletries, food jars, hot drinks and household care) encompass products that are not so readily recycled. For example, the food residue in empty food jars, and the practice of washing the jar out, can put consumers off recycling jars. Please note: This is a significant reason why food jars are typically excluded from recycling DRS since retailers do not want contaminated food jars in their stores. The unintended consequences of this include:
• The cleaner packaging will be removed from Local Authority collections reducing by over 70% glass participation rates in any Local Authority glass collection service provision which is likely to challenge the viability of the service, and, at a time of budgetary constraint, it brings into question the future longevity of the service.
• It could negatively impact the costs and even future potential income for Local Authorities.
• The low volumes of glass in the Local Authority glass collection service is likely to increase the probability of mixed collection destined for low grade recycling, e.g. aggregates for road construction.
• Poor consumer practice invalidates comparisons between the DRS versus the non-DRS systems, as all the glass entering the DRS is suitable for high grade recycling. This is true across all dual schemes in operation.

Recycling DRS in Scotland
62
• Some consumers who have grown accustomed to using kerbside or ‘bring’ schemes are likely to continue to use these schemes for some DRS containers as a matter of convenience. For example, recycling behaviour is likely to be different for consumers of high price point wine and spirits consumed at home, than for consumers of lower price point bottled water and soft drinks that are consumed in a multitude of different environments, especially on-the-go.
There are examples over the last two years of Scottish Local Authorities reducing their glass recycling services. For example, Clackmannanshire and Inverclyde have made the decision to withdraw their kerbside glass collection services as a cost cutting exercise. This is particularly disappointing in the Clackmannanshire scheme since the scheme was considered an example of good practice in terms of glass recycling by Resource Efficient Scotland.83
A spokesperson for the Inverclyde scheme stated that:84
“As part of the Council’s budget review we had to make the tough decision to withdraw the kerbside glass collection service. It wasn’t an easy one as we pride ourselves on our excellent record on recycling. I appreciate people will now have to go a little out of their way rather than enjoy the convenience of collections, but I would encourage householders to continue to recycle and re-use what they can.”
Experience shows that there will be significant shifts in material use
According to the Scottish Government, “Income for the scheme will be generated from three streams: the sale of materials collected through the scheme, unredeemed deposits, and a fee paid by producers. The producer fee will likely be applied on a per container basis, with the level of the fee determined by the type of material used in the production of the containers. Materials that attract a higher sale value for the Scheme Administrator, such as aluminium, will likely be subject to a lower fee. Materials which have a lower sale value, such as glass, will be subject to a higher fee reflecting the higher net cost to the Scheme Administrator.”85
“In general, it is not expected that there will be significant shifts in material used given the costs involved and limits on the substitutability of materials.”97
For carbonates in Germany (Figure 37), before the implementation of the DRS in 2000, non-fillable glass was more common than PET, but the implementation of the DRS in 2003 severely affected the market for one-way glass and started the rapid rise of plastic’s market share. It could be argued that the decline of the one-way glass pre-dates the DRS, but this coincides with the time when the new policy would have been discussed resulting in producers deciding to switch sooner rather than later.
83 https://www.resourceefficientscotland.com/sites/default/files/Good%20practice%20in%20glass%20kerbside%20collection%20-
%20Clackmannanshire%20Council.pdf (ZWS, 2012) 84 https://www.inverclyde.gov.uk/news/2018/may/kerbside-glass-collections-to-end (Inverclyde Council, 2018) 85
https://www.gov.scot/publications/deposit-return-scheme-scotland-full-business-case-stage-1/

Recycling DRS in Scotland
63
63
63
Figure 37: Carbonates sales in different packaging formats in Germany, 2000 to 2018
Source: GlobalData. Adapted by Oakdene Hollins.
Figure 38 shows the dramatic reduction in glass beverage bottle sales in the beer market in Croatia since the introduction of the recycling DRS in 2006, with sales in glass dropping from over 90 million units in 2006 to under 20 million units in 2017.
Figure 38: Beer sales in different packaging formats in Croatia, 2006 to 2017
Source: GlobalData. Adapted by Oakdene Hollins.
In Denmark, the recycling DRS system administrator, Dansk Retursystem, reports that 93% of the 1.2 billion containers recovered through the recycling DRS are PET and cans. The reverse vending machines crush these containers, which improves transport and storage efficiencies.

Recycling DRS in Scotland
64
This makes handling these materials cheaper, which reduces the fees on plastic and aluminium. For glass, Dansk Retursystem reports that:86
“In relation to glass, we have not achieved the same efficiency. Although we have introduced special solutions where the counting takes place in the shops, we cannot crush glass in the shops. Therefore, glass is expensive to transport, and it also requires extra safety equipment at our factories. The charge on glass therefore rises based on the actual cost of handling the material, and since glass only accounts for about 7% of the market, the costs are distributed on fewer packages.”
The impact of the greater difficulty in handling glass in the recycling DRS is reflected in the fees. Dansk Retursystem reports that:
“In 2018, we have a goal of implementing a fee reduction that is on average 10% lower than in 2017. On 1 July 2018, the fees were regulated. The fees for aluminium, steel and plastic packaging are reduced, while the charges for glass packaging are rising.”
Table 27 shows the operating fees before the fee changes in the first six months of 2018 compared to the 2019 fees. This shows the significant difference in operating fees between the packaging types that are easy to recover through the recycling DRS, e.g. aluminium (4 Danish øre per unit (0.0054€)), as opposed to the harder to handle glass (77 Danish øre per unit, eqv. 0.08 €).
Table 27: Operating fees by packaging type
Packaging type
Size Operating fee (Danish øre per unit)
2018 (Jan to June) 87
201988
Aluminium Under 1 litre 9 (0.12€) 4 (0.0054€)
Steel Under 1 litre 21 (0.028€) 16 (0.021€)
1 litre and over
64 (0.086€) 23 (0.031€)
Plastic Under 1 litre 21 (0.028€) 17 (0.023€)
1 litre and over
27 (0.036€) 17 (0.023€)
Glass Under 1 litre 41 (0.055€) 57 (0.076€)
1 litre and over
70 (0.094€) 77 (0.103€)
Figure 39 shows the example of beer sales in Denmark and how the beverage can industry has grown since the introduction of the scheme in 2002. It also shows how very small the one-way beverage packaging market was for beer in Denmark in 2002, simplifying the implementation of the scheme considerably.
86 https://www.danskretursystem.dk/implementering-af-ny-gebyrmodel-2/ (Dansk Retursystem)
87 https://www.danskretursystem.dk/wp-content/uploads/2017/12/Hjemmeside_Gennemsnitsgebyr-og-pantetiketter-2018-1.-januar-30.-
juni-2018-20171222.pdf (Dansk Retursystem, 2018) 88 https://www.danskretursystem.dk/wp-content/uploads/2018/11/Hjemmeside_Gennemsnitsgebyr-og-pantetiketter-2019.pdf (Dansk
Retursystem, 2019)

Recycling DRS in Scotland
65
65
65
Figure 39: Beer sales by packaging format in Denmark since the introduction of the recycling DRS in 2002
Source: GlobalData. Adapted by Oakdene Hollins.
Figure 40 shows that the profile of the packaging beer market in the UK is significantly different from that of Denmark, with glass and cans having a greater split of the market. Any changes to cost or convenience could have a major impact on the market share of glass in this product category.
Figure 40: Unit sales of beer & cider by packaging material in the UK
Source: GlobalData. Adapted by Oakdene Hollins.
Figure 41 shows the switch from glass to beverage cans in the beer sector in Croatia following the introduction of the recycling DRS for glass in 2006.

Recycling DRS in Scotland
66
Figure 41: Change in unit sales by packaging type in the Croatian beer market since the introduction of the recycling DRS in 2006
Source: GlobalData. Adapted by Oakdene Hollins.
Table 28 shows the license rates that producers pay in the Austrian EPR scheme, as of 1 January 2015; it is reported that the rates reflect the expenses the various materials cause in the collection and recovery cycle. The table shows that the tariff for glass is one of the lowest, signifying that from a weight-based perspective it is one of the cheapest materials to recover using this system. The revenue generated through the packaging tariffs account for 75% of the scheme revenue and the remaining 25% is covered through the sale of glass cullet.
Table 28: The breakdown of the material specific packaging tariffs in Austria in 2014
Material Packaging tariff (€/kg)
Household Commercial
Paper 0.095 0.035
Glass 0.082 0.05
Ferrous metal 0.24 0.06
Aluminium 0.29 0.08
Plastic 0.565
Beverage cartons 0.59
Other composite materials 0.565 0.1
Ceramics 0.14 0.14
Wood 0.018 0.008
Textile fibres 0.2 0.2
Biodegradable materials 0.45 0.1 Source: ARA: Sustainability report 2014. Please note: ‘commercial’ refers to packaging used by commercial and industrial businesses.
The EPR scheme can achieve a higher impact on littering behaviour than the impact achieved by a DRS, because it covers more products
According to the Scottish Government, “The benefit to society from the introduction of a DRS is considerable, with the majority being derived from the reduced disadvantage to local
0
10
20
30
40
50
60
70
80
90
100
Non-Refillable Glass Metal PET
2006 2018

Recycling DRS in Scotland
67
67
67
neighbourhoods from targeting a highly visible component of the litter stream and the value of avoided carbon emissions.”89
“While an EPR will facilitate recycling efforts by consumers already engaged, it does not incentivise behaviour change in the same way that a DRS will. As a result, there is likely to be limited impact on littering behaviour and it will take longer for recycling rates to increase significantly. In comparison, a DRS will have significant impact very quickly. Loss aversion is likely to act as a powerful motivator to incentivise behaviour change, both in terms of littering fewer drinks containers (which make up a considerable share of the litter stream) and returning drinks containers for recycling in order to redeem the deposit. It is possible that the DRS incentive might lead to a change in behaviour regarding other items typically littered, and general recycling behaviour, however these have not been modelled.”89
“Capturing wider litter benefits that include the value of litter reduction in a broader range of locations e.g. avoiding marine litter, the wider Scottish countryside, tourist locations and areas where people visit regularly. These particular benefits are likely to be higher for DRS when compared with an EPR scheme.”90
The statement that the litter engagement strategy included as part of the EPR policy will have less impact than that of the recycling DRS appears to challenge the Scottish litter strategy Towards a litter free Scotland.91 The Partial Business and Regulatory Impact Assessment associated with this strategy stated that the benefits of introducing this strategy included:91
“An implemented strategy will reduce the on-going burdens and costs borne by public and private land managers associated with litter and fly tipping. Communities will benefit from higher quality local environments and from the contribution that this makes to wellbeing.”
89 https://www.gov.scot/publications/deposit-return-scheme-scotland-full-business-regulatory-impact-assessment/pages/4/
90 https://www.gov.scot/publications/deposit-return-scheme-scotland-full-business-regulatory-impact-assessment/pages/1/ 91
https://www2.gov.scot/Resource/0045/00452542.pdf

Recycling DRS in Scotland
68
Table 29 shows that the materials in the recycled DRS account for 21.7% of the littered materials in Scotland, all of which is widely recyclable. Assuming there is a direct correlation between the increase in recycling rate and a reduction in litter resulting from the introduction of the scheme it is estimated that the scheme will reduce the levels of littering by 5.6% (target recycling rate 90% - current recycling rate 64% x 21.7%).
Conversely, the materials in the EPR scheme account for 41.5% of the littered materials, 30.9% being widely recyclable and 10.6% potentially recyclable. Applying the same assumptions as above, the EPR would reduce overall littering by 10.79% (assumed recycling rate 71% - current recycling rate 45% x 41.5%). Please note: This does not include the reductions in litter due to the supporting litter strategy.

Recycling DRS in Scotland
69
69
69
Table 29: Categorisation of littered materials by the extent to which they are recyclable
Material category
Estimated % composition in litter on ground
Included in the DRS Included in the EPR
Widely recyclable
Potentially recyclable
Widely recyclable
Potentially recyclable
Newspapers & magazines
8.5%
Other paper 8.2% ?
Cardboard 9.2% Yes
Plastic film 6.6% Yes
Plastic bottles 8.6% Yes Yes
Other plastic packaging
4.0% Yes
Other dense plastic
1.2%
Textiles & footwear
2.1%
Wood 0.7%
Furniture 0.6%
Disposable nappies
1.6%
Other combustibles
11.2%
Packaging glass
9.1% Yes Yes
Other glass 0.3%
Rubble (C&D waste)
0.2%
Other non-combustibles
0.7%
Metal cans 4.0% Yes Yes
Other metal 2.9%
Food/kitchen waste
14.3%
HHW 0.1%
WEEE 4.0%
Fines 1.7%
Total 21.7% 0% 30.9% 10.6% Source: Oakdene Hollins using Scottish Government data92
The Scottish Government’s Strategic Environmental Assessment93 states that “where DRS have been implemented in other countries, and where data is available, DRS has been identified as making an effective contribution to the reduction in littering”. However, a study undertaken in Ghent (Belgium) was referenced as justification for this statement and this study was more dismissive of the impact the recycling DRS would have on litter. The assessment states:94
92 https://www.zerowastescotland.org.uk/sites/default/files/Scotland%27s%20Litter%20Problem%20-%20Full%20Final%20Report.pdf
93 https://www.gov.scot/publications/deposit-return-scheme-scotland-strategic-environmental-assessment-post-adoption-statement/ 94
https://lib.ugent.be/fulltxt/RUG01/002/304/845/RUG01-002304845_2016_0001_AC.pdf

Recycling DRS in Scotland
70
“We found that a DRS for one-way beverage packaging can serve as a means to increase the recovery rate of PET-bottles. The result for reducing the amount of litter was more ambiguous. The reason for this is that one-way beverage packaging only accounts for 40% of the total volume of litter and 4% of the total pieces of litter. This partially accomplishing of the political objectives is accompanied with a very costly system.”
Table 30 shows the output from the modelling exercise undertaken by the Scottish Government as part of the Full business and regulatory impact assessment and shows that it is the high valuation of the societal benefits (£1,101.3 million) that makes the proposed scheme ‘net positive’. The Scottish Government breaks down this figure into three components: 95
• Improved amenity resulting from the reduction in litter = £994 million.
• Monetised benefit from carbon emission reduction = £81 million.
• Commercial value of advertising space at RVMs = £26 million.
Table 30: Costs and benefits of a DRS for Scotland - NPV
Actor Name Costs (£m) Benefits (£m) Net Benefit (£m)
Local Authorities -46.3 237.5 191.1
Business -1,537.7 1,153.4 -384.3
Regulator -4.8 0 -4.8
Society -821.9 1,101.3 279.4
Total -2,410.7 2,492.2 81.6
Source: Scottish Government96
In its study Scotland’s Litter Problem the Scottish Government caveats these estimates in stating that:97
“Uncertainty in this area is high, and there is no suggestion litter is solely responsible for the impacts identified. However, better understanding the linkages between litter, wider local environmental quality, and mental health would improve understanding further.”
“…solving the litter problem in isolation would not necessarily make all these associated costs go away…”
These caveats provide sufficient uncertainty to question the benefits of the recycling DRS over the EPR with litter enforcement strategy. The Scottish litter strategy Towards a litter free Scotland98 appears to suggest that a whole raft of interventions and initiatives are required to tackle the litter problem in Scotland, but the recycling DRS is now seen to potentially realise huge benefits.
The Local Government Association (LGA) response to the DRS consultation for England, Wales and Northern Ireland reports that:99
95 https://www.gov.scot/publications/deposit-return-scheme-scotland-full-business-case-stage-1/
96 https://www.gov.scot/publications/deposit-return-scheme-scotland-full-business-regulatory-impact-assessment/pages/1/
97 https://www.zerowastescotland.org.uk/sites/default/files/Scotland%27s%20Litter%20Problem%20-%20Full%20Final%20Report.pdf
98 https://www2.gov.scot/Resource/0045/00452542.pdf 99
https://www.local.gov.uk/consultation-introducing-deposit-return-scheme-england-wales-and-northern-ireland-lga-response

Recycling DRS in Scotland
71
71
71
“…we have to question the value being placed on DRS within the Impact Assessments (IAs). We have sought external financial analysis and this has confirmed that the value being placed on the disamenity of litter within the DRS proposals needs further clarification. The calculation on disamenity of litter is not well supported by the evidence presented. We would question the overall value for money of DRS if the figures for litter disamenity are excluded from the analysis.”
Furthermore, four out of 12 of the businesses consulted for views on the proposed Scottish DRS (Ardagh, Highland Spring, SWA and SESA) stressed that it would have no or minimal impact on litter, and the Co-op group stated that “its costs for litter management would not reduce, although there may be a modest reduction in littering”.100
Table 31 shows that the societal benefits assigned to the EPR model that includes a litter enforcement strategy was £252million, just 23% of that modelled for the DRS (£1,101 million) shown in Table 30.
Table 31: Costs and benefits of an EPR for Scotland - NPV
Actor Name Costs (£m) Benefits (£m) Net Benefit (£m)
Local Authorities 0 284.3 284.3
Business -669.7 189.8 -479.9
Regulator -5.3 0 -5.3
Society 0 251.7 251.7
Total -675.1 725.8 50.7
Source: Scottish Government100
In Austria, the Federal Ministry of Sustainability and Tourism has recently launched Reinwerfen statt Wegwerfen (English: Toss it in the bin), a voluntary initiative for businesses and social partners to improve the ecological performance of packaging (mainly beverage containers). This nationwide anti-littering campaign receives between 700,000 and 1 million euro of annual funding from packers/fillers and retailers and seeks to raise public awareness to prevent littering and promote the separate collection and recycling of packaging. Unfortunately, the resulting impacts of this scheme could not be identified.
However, to place the Austrian budget into context in Scotland, the Scottish Government reports that:
“We have committed up to £500,000 towards Keep Scotland Beautiful’s Clean Up Scotland initiative in the period from 2013-2015. As a result of joint working (between Keep Scotland Beautiful, local authorities, businesses and communities) during 2013: 101
• More than 245,000 volunteers took part in the initiative.
• Around 3,500 clean ups (297 per month) took place.
• More than 2,000 tonnes of litter were removed across Scotland.”
Although this cannot be considered a litter prevention intervention it does show the impact just one intervention can have on littering, as part of a more widescale litter strategy.
100 https://www.gov.scot/publications/deposit-return-scheme-scotland-full-business-regulatory-impact-assessment/pages/1/ 101
https://www2.gov.scot/Resource/0045/00452542.pdf

Recycling DRS in Scotland
72
Whilst we acknowledge there is a great need to address the general littering problem within society at large, the problem is at the same time very complex and the most effective national and local measures should be introduced and maintained. Measures must be targeted based on type of littering issue and where the littering occurs.
It is important to get the picture on packaging composition and where it is consumed. In Vancouver, Canada, street litter audits took place assessing the composition of the accumulated litter present where ‘large litter’ (larger than 4 square inches) and ‘small litter’ were assessed counting the pieces in certain areas. For large litter, cups and paper/fibre material were the most observed, while cigarette butts (composed of plastic material) and chewing gum where the most common small litter. Beverage containers accounted for 3% of all the large litter observed in the 2017 audit. The largest subcategory evaluated for beverage containers was beer cans (20%) and milk-type beverage (plastic, 20%), followed by water (plastic, 16%). Other packaging accounted for 1% of the overall large litter observed where foil pouches and containers (60%) and broken container glass (40%) comprise the other packaging category; i.e. the broken glass composition was 0.4% according to this study.102
The low amount of large size beverage containers in the street litter mix is comparable to studies in other cities in Canada and the USA. Toronto, for example, reported 1% of glass material composition in a study from 2016. The broken glass rate is only slightly higher for small-sized litter compared to large size (around 2%).103
Impacts on the hospitality sector will be significant
According to the Scottish Government, “Impacts on the hospitality sector: no significant impacts anticipated”.104
Key issues and challenges around the proposed recycling DRS for the on-trade (hospitality sector) are:
• Secure storage on-site to prevent public access to the glass bottles which will now have a value. Also, security may be needed to prevent glass bottles being crushed (very small pieces of glass cannot be recycled, but instead end up as aggregate).
• High volume manual handling. Taking the Scottish Government figures of 45,448,535 units in the system and a total of 2,840 pubs / bars in Scotland, it is estimated that the average pub / bars would generate 16,000 containers per year, equivalent to 307 containers per week.104 Please note: A study by the British Beer and Pub Association105 in 2005 estimated that large nightclubs can generate 4,000 containers on just one Friday or Saturday night.
• In the proposed closed loop arrangement, whereby customers are not charged the deposit104, reverse logistics cannot be utilised for some of the legs of the journey, i.e. return to the sorting centres or from the sorting centres to the reprocessing plants. The Scottish Government assumed that
102 https://vancouver.ca/files/cov/street-litter-audit-survey-report-2017.pdf
103 https://www.toronto.ca/wp-content/uploads/2017/10/8ed5-Toronto-Litter-2016-Final-Report_App_Final.pdf
104 https://www.gov.scot/publications/deposit-return-scheme-scotland-full-business-regulatory-impact-assessment/pages/1/ 105
bbpa_reverse_haul_report.pdf
Recycling DRS in Scotland
73
73
73
hotels, pubs, bars and full-service restaurants would be likely to choose to operate the closed loop arrangement.
• Vehicle management. High outbound volume (of products) on deliveries later in the week and high inbound volume (of empty containers) early in the week and seasonality / event issues in balancing outbound and inbound capacity.
• Traceability of returns. One vehicle may collect empty containers from about 10 drops on a round, so how to ensure that the deposits are returned to the correct outlet?
• Will the cans and PET containers need to be kept uncrushed so that barcodes can be read at the sorting depots? What is the likely, reject rates through unreadily barcodes?
• Crate or container management? The bottles would need to be transported in a suitable crate, container or bag that would add cost to the process.
Please note: A point of clarification is required on whether the waste containers can be legally transported with food and beverage containers in the same vehicles. This is unlike the case of the return of refillable glass bottles which are not classified as waste and therefore can benefit from reverse logistics, but this is not the case for non-refillable packaging.
Refilllable schemes are present in all countries that have introduced a recycling DRS
According to the Scottish Government “Across many countries in Europe organised schemes for ‘refillable’ glass bottles are in operation. These schemes are logistically and commercially separate from the recycling deposit return schemes but, where both types of scheme are present in the same nation (e.g. in Finland), they often work alongside each other.”106
The refillable DRSs are voluntary schemes operated by private organisations while the non-refillable DRSs are mandatory. From a consumer and retailer perspective the return of glass containers to the point of purchase via a ‘soft drop’ reverse vending machine (RVM) or manual system is similar for both refillable and one-way containers, and in countries such as Germany, the RVMs can handle both refillable and one-way containers. Therefore, from a consumer and retailer perspective there is no difference between the two packaging formats - although it can lead to confusion for consumers as to what packaging is refillable and which one is not. The countries operating a voluntary DRS for refillable glass are best placed to transition or add on a recycling DRS for non-refillable glass. Figure 42 shows that in 2000 all the EU-28MS that have a recycling DRS for non-refillable glass (i.e. Croatia, Denmark, Estonia, Finland, Germany and Lithuania) had a significant dependence on refillables, i.e. the market share of refillables in all six countries was above 50% of the total market for beer, soft drinks and bottles water. Both Croatia and Germany have maintained their refillables market with only a slight drop in share observed in 2017. However, the refillables market share in Denmark, Finland, Estonia and Lithuania has dropped significantly, driven by the conscious decision by the governments of these countries to switch from a voluntary DRS driven refillable system to a mandatory DRS driven scheme for one-way containers.
The UK is at the bottom left corner of the scatterplot, alongside France, Italy and Ireland, all of which do not have the return structure that the aforementioned countries have. In Scotland, AG Barr (makers of IrnBru) ran a voluntary DRS for many years but abandoned it on
106 https://www.gov.scot/publications/deposit-return-scheme-scotland-full-business-case-stage-1/
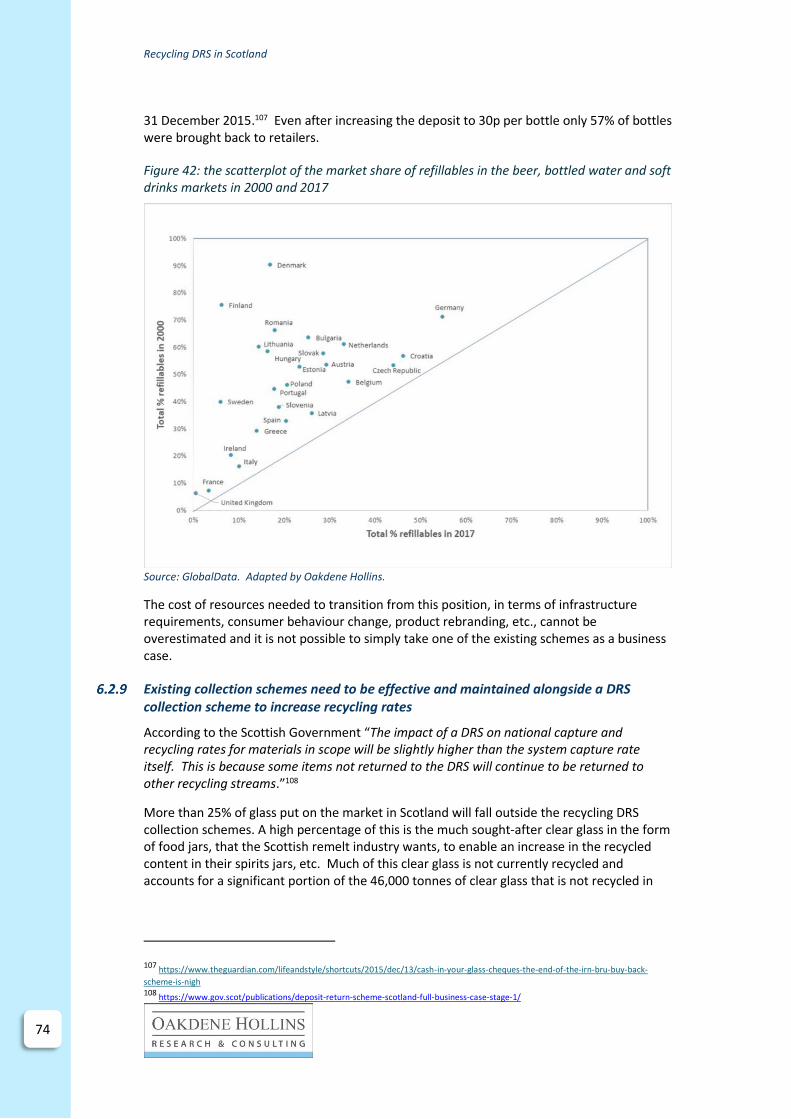
Recycling DRS in Scotland
74
31 December 2015.107 Even after increasing the deposit to 30p per bottle only 57% of bottles were brought back to retailers.
Figure 42: the scatterplot of the market share of refillables in the beer, bottled water and soft drinks markets in 2000 and 2017
Source: GlobalData. Adapted by Oakdene Hollins.
The cost of resources needed to transition from this position, in terms of infrastructure requirements, consumer behaviour change, product rebranding, etc., cannot be overestimated and it is not possible to simply take one of the existing schemes as a business case.
Existing collection schemes need to be effective and maintained alongside a DRS collection scheme to increase recycling rates
According to the Scottish Government “The impact of a DRS on national capture and recycling rates for materials in scope will be slightly higher than the system capture rate itself. This is because some items not returned to the DRS will continue to be returned to other recycling streams.”108
More than 25% of glass put on the market in Scotland will fall outside the recycling DRS collection schemes. A high percentage of this is the much sought-after clear glass in the form of food jars, that the Scottish remelt industry wants, to enable an increase in the recycled content in their spirits jars, etc. Much of this clear glass is not currently recycled and accounts for a significant portion of the 46,000 tonnes of clear glass that is not recycled in
107 https://www.theguardian.com/lifeandstyle/shortcuts/2015/dec/13/cash-in-your-glass-cheques-the-end-of-the-irn-bru-buy-back-
scheme-is-nigh 108
https://www.gov.scot/publications/deposit-return-scheme-scotland-full-business-case-stage-1/

Recycling DRS in Scotland
75
75
75
Scotland each year. This portion will need to be collected through alternative schemes to the DRS to achieve high overall glass packaging recycling rates.
Table 32 shows a comparison, where available, of the glass return rates of the respective recycling DRS versus the overall glass packaging recycling rates (as shown in Table 32). What can be seen is that, of the countries that provide the data, only Denmark (introduced 2002) has achieved the 90% glass return rate under the DRS that Scotland are looking to achieve. High return rates (above 80%) can be seen in every country where data was available, and this is typically much higher than the respective overall glass packaging recycling rates. For example, in Croatia the overall recycling rate in 2016 was 56.4% and the return rate for the glass in the DRS was 82%. In Estonia in 2016 the return rate from the DRS was 87% and the overall glass packaging recycling rate is 63.4%. It is reported that the exclusion of strong alcoholic beverages (vodka, wine, etc.) and glass jars is a significant contributing factor and it would require a significant investment to include these product categories within the recycling DRS.109
Table 32: Glass return rates versus overall glass packaging recycling rates across the EU-28MS and EFTA
Country
Glass return rate (%) Overall glass packaging recycling rate in
2016 (%) 2015 2016 2017
Croatia 86 82 56.4
Denmark 89 90 85.0
Estonia 87 87 89 63.4
Finland110 88 88 87 89.8
Germany Not available 85.5
Lithuania 83 71.0
Source: ACR+, 2019111
Finland represents the exception to this rule with an overall recycling rate in 2016 greater
than that of the return rate from the DRS. RINKI, the operator of Finland’s EPR scheme,
reports that the glass packaging recycling rate for non-deposit glass has increased
significantly from 33% in 2015 to 94% in 2017 (
109 Earth Care Ltd. Personal communication 14 August 2018. 110 www.palpa.fi/beverage-container-recycling/deposit-refund-system/ (Palpa, accessed 2019) 111
http://www.acrplus.org/images/technical-reports/2019_ACR_Deposit-refund_systems_in_Europe_Report.pdf (ACR+, 2019)
Recycling DRS in Scotland
76
Table 33). The reason for the rapid increase in the recycling rate was the introduction of the EPR. The EPR for packaging waste came into effect in May 2015 and obliged producers to establish a minimum of 1,850 collection points for consumer packaging (glass, metal and fibre); RINKI reports that in May 2018 there were 1,856 collection points (bring banks) for glass.

Recycling DRS in Scotland
77
77
77
Table 33: The glass packaging recycling rate for non-deposit glass in Finland 2015 to 2017
Year Put on the market (Tonnes)
Recycled (Tonnes)
Recycled (%)
2015 23,900 8,000 33
2016 24,000 15,200 63
2017 24,000 22,600 94
Source: Finnish Packaging Recycling RINKI Ltd. EPR of non-deposit glass packaging in Finland. FERVER, General Assembly, 7 June 2018, Helsinki.
Consumption behaviour change could lead to closed loop recycling in Scotland
According to the Scottish Government “…currently between 20 – 50% of glass is not suitable for closed loop recycling due to the way it is currently collected and processed in Scotland (mixed and crushed)”.112
The ‘colour imbalance’ issue in the UK is heavily cited and this is compounded in Scotland by the export trade of spirits in clear glass bottles. The UK addressed this issue by promoting alternative, non-colour sensitive glass recycling options, such as, the use of cullet as a substitute for virgin aggregate.
The alternative recycling routes are attractive to Local Authorities that are under budgetary pressure since they are typically not colour or size sensitive, and hence returned glass can be collected mixed and crushed.
Therefore, the collection of high-quality glass via the recycling DRS cannot be considered a guarantee that the material will be used in high value closed loop recycling in Scotland. The demand for such material must be taken into consideration. For example, in Iceland’s recycling DRS the glass is crushed and used for aggregates since there is no glass manufacturing in Iceland and exporting the glass is too expensive.113
Table 34 shows the net impact of recycling glass to remelt compared to aggregates. The cost of recycling glass via aggregates is £11.50 per tonne cheaper than the remelt route.
Table 34: Net impact of recycling glass in the UK, 2014 prices, best estimate per tonne Remelt Aggregate
Collection and sorting for recycling -£103.2 -£71.5
Change in landfill cost (collection and gate fee) £61.2 £61.2
Material revenue £24.5 £5.1
Carbon impact £2.0 £1.3
Total net impact per tonne -£15.5 -£4.0
Source: Defra114
112 https://www.gov.scot/binaries/content/documents/govscot/publications/foi-eir-release/2019/05/foi-19-01048/documents/foi-19-
01048-document1/foi-19-01048-document1/govscot%3Adocument/DRSPB16_03a%2BThe%2BCase%2Bfor%2BGlass%2Breport.pdf (ZWS, 2018) 113 http://www.acrplus.org/images/technical-reports/2019_ACR_Deposit-refund_systems_in_Europe_Report.pdf 114
https://assets.publishing.service.gov.uk/government/uploads/system/uploads/attachment_data/file/294272/packaging-targets-ia.pdf

Recycling DRS in Scotland
78
The recycling DRS will not solve the mismatch of glass colours available for recycling. Scotland consumes a lot of products packed in green glass (wine), amber glass (beer) while the Scottish glass manufacturers predominantly need white (flint) glass. The manufacture of flint glass is particularly sensitive to colour contamination and hence green or amber glass cannot be incorporated into flint as it will affect the colour.
Scotland can supply the growing demand for the recycled glass of all colours outside of Scotland in the rest of the UK and in Europe. Exports of cullet from the UK have increased sharply: most is exported to Spain, Italy and Portugal for closed-loop recycling into wine bottles, with exports to Portugal in particular growing rapidly.115
The export of collected packaging is not restricted to glass, see Figure 43, and has increased for packaging as a whole.
Figure 43: Export versus UK reprocessing of packaging waste.
Source: The National Audit Office152
Encourage circular product design by beverage packaging producer
According to the Scottish Government a DRS scheme will “Encourage circular product design by beverage packaging producers e.g. making packaging lighter, increasing recycling content in containers, or designing for increased recyclability.”116
This statement differs significantly from the following statement made in the same Scottish Government report:
“…in terms of circular economy benefits, a DRS will help to target ‘leaks’ (where the material is discarded and no longer retained in the circular loop) of valuable resources, maximise their value and ensure they become an important feedstock for high value re-processing. This will maximise the economic impact for Scotland and create employment opportunities across a range of roles.”116
115 http://www.wrap.org.uk/sites/files/wrap/Glass%20Update%20Market%20Situation%20Report%20Autumn%202008.pdf 116
https://www.gov.scot/publications/deposit-return-scheme-scotland-full-business-case-stage-1/

Recycling DRS in Scotland
79
79
79
The proposed recycling DRS is highly likely to deliver to the latter of the two statements in that it will increase the capture rate of widely recyclable material (PET, metallic cans and glass) and reduce the level of ‘leakage’ from the economy. However, the fixed nature of the deposit does not enable it to differentiate between well-designed packaging with minimal environmental impact and a highly impactful packaging design.
To encourage circular product design, the scheme would need to distinguish between packaging designs that, for example, end up ‘hard to recycle’ and those that are ‘easy to recycle’; for example, placing a higher deposit or price on a brand that uses multi-layer plastic beer bottle over a brand that uses a mono-layer plastic water bottle, or charging different fees for a brand using a lighter weight glass and one using a heavier bottle.
In 2018, Denmark introduced a Circular Economy Fee which applies to packaging that is included in the recycling DRS, that is paid if the following are used:
• Coloured plastic (7 Danish øre (0.0094€) per unit).
• Composite plastic (4 Danish øre (0.0054€) per unit).
• Plastic or aluminium sleeves (7 Danish øre (0.0094€) per unit).
• Composite aluminium (6 Danish øre (0.0080€) per unit).
• Glass sleeves (2 Danish øre (0.0027€) per unit).
• Patent stoppers (57 Danish øre (0.076€) per unit).
This adds a lot of complexity to the recycling DRS, especially considering the variety of multiple sites and multiple parties involved. An EPR promises an easier better way to manage this. In the latest EU legislation, which will come into effect by 2023, EPR schemes will be able to introduce ‘eco-modulated’ fees for individual packaging for each brand.
Limitations in the available Scottish specific data
According to the Scottish Government, “…there are limitations in the available Scottish specific data in relation to sales, waste by material type and material reprocessing of drinks containers…”117
This is considered a major issue and adds heavily to the uncertainties included within the modelling process. For example:
• The number and weight of sales units that would be included in the recycling DRS needs to be clarified.
117 https://www.gov.scot/publications/deposit-return-scheme-scotland-full-business-regulatory-impact-assessment/pages/1/

Recycling DRS in Scotland
80
• Table 35 shows the variability in the estimates of the units of glass packaging that would be within the proposed recycling DRS in Scotland. Estimates vary between 333 and 754 million glass containers.
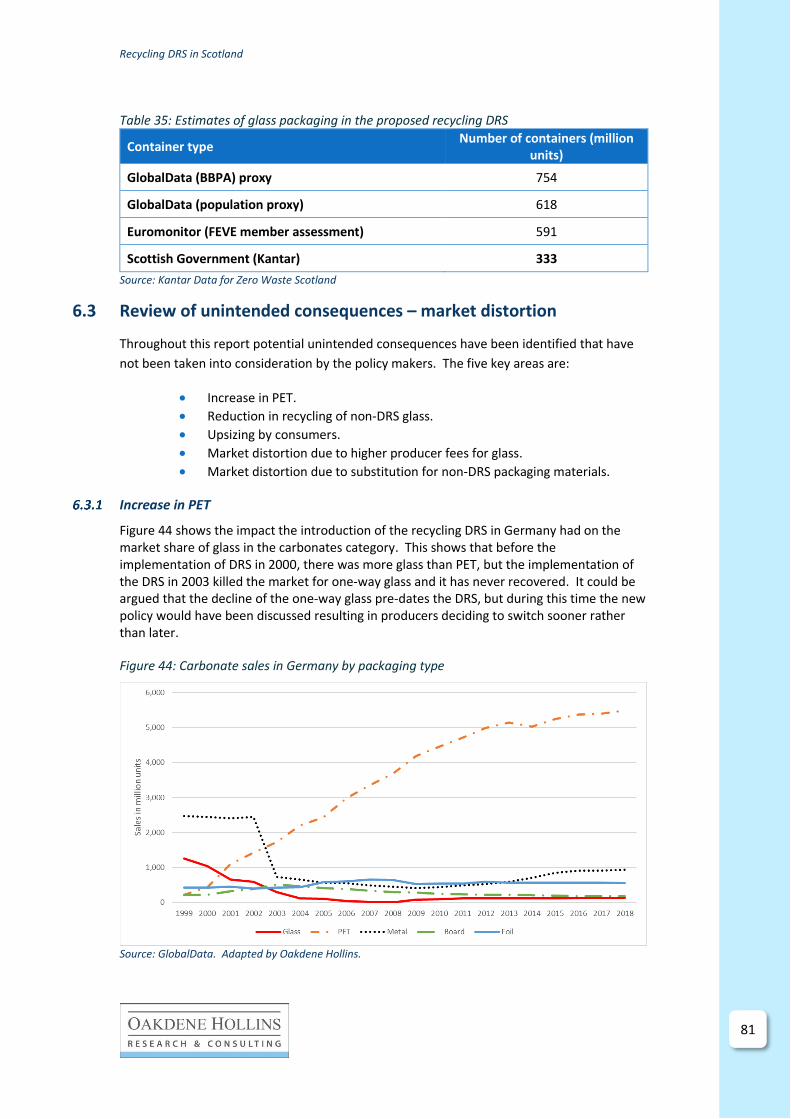
Recycling DRS in Scotland
81
81
81
Table 35: Estimates of glass packaging in the proposed recycling DRS
Container type Number of containers (million
units)
GlobalData (BBPA) proxy 754
GlobalData (population proxy) 618
Euromonitor (FEVE member assessment) 591
Scottish Government (Kantar) 333
Source: Kantar Data for Zero Waste Scotland
6.3 Review of unintended consequences – market distortion
Throughout this report potential unintended consequences have been identified that have
not been taken into consideration by the policy makers. The five key areas are:
• Increase in PET.
• Reduction in recycling of non-DRS glass.
• Upsizing by consumers.
• Market distortion due to higher producer fees for glass.
• Market distortion due to substitution for non-DRS packaging materials.
Increase in PET
Figure 44 shows the impact the introduction of the recycling DRS in Germany had on the market share of glass in the carbonates category. This shows that before the implementation of DRS in 2000, there was more glass than PET, but the implementation of the DRS in 2003 killed the market for one-way glass and it has never recovered. It could be argued that the decline of the one-way glass pre-dates the DRS, but during this time the new policy would have been discussed resulting in producers deciding to switch sooner rather than later.
Figure 44: Carbonate sales in Germany by packaging type
Source: GlobalData. Adapted by Oakdene Hollins.

Recycling DRS in Scotland
82
Reduction in recycling of non-DRS glass
The limited quantity and quality of glass remaining outside the deposit scheme could jeopardise the Local Authority current collection provisions (kerbside or bring banks) for such glass. This is seen in Estonia and Croatia, where the capture rate in the recycling DRS far exceeds the overall country-level glass packaging recycling rate. There is evidence that some Scottish Local Authorities are cutting back on their glass recycling services and, with reduced obligation to provide these services, this is likely to occur more often. The success of the DRS to increase recycling rates depends also on the non-DRS collection schemes.
The recycling of glass jars and bottles for food would be a particular area of concern since they are currently one of the least recycled glass containers. Ironically, they are often made from clear (flint) glass for which there is higher demand in Scotland. Maximising the collection of wine and beer bottles will have most impact on the green and amber glass markets, for which there is less demand from the Scottish glass industry.
Upsizing by consumers
Responsible consumption represents a key area of sensitivity in the alcoholic drinks market. The Croatian beer market is a case in point; since the introduction of the DRS consumers have switched to larger pack sizes in PET and cans (Figure 32 and Figure 33). For glass, Figure 45 shows the decline in market share of the 25cl one-way glass beer bottle in Croatia.
Figure 45: The beer market in one-way glass in Croatia where DRS was introduced in 2006
Source: GlobalData. Adapted by Oakdene Hollins.
Figure 46 shows how highly vulnerable the UK beer market is to upsizing with 90% of the market being in 33cl can or smaller, with the larger 50cl can having sufficient market presence to prompt the switch.

Recycling DRS in Scotland
83
83
83
Figure 46: beer sales in glass in the UK in 2017
Source: GlobalData. Adapted by Oakdene Hollins.
The risk of upsizing may also be relevant within the on-trade where owners switch away from the smaller sized containers to reduce the carrying costs associated with deposits. Smaller containers would also be more likely be taken off the premises by customers wishing to claim the deposits.
Market distortion due to higher producer fees for glass
The evidence from existing recycling DRS shows that the handling and management of glass is far harder than PET or cans and this is reflected in the material level producer fees. Denmark represent the most extreme case, with the producer fees being some 14 times higher for glass (57 Danish øre per unit) than for aluminium cans (4 Danish øre per unit).
Figure 47 shows the market share of glass by product category in Denmark. Although the higher fee for glass collection cannot be singled out as the only reason for any trends in market share, it is in the two markets in which glass competes most against PET and cans where significant market share has been lost, namely beer and soft drinks. Figure 47 shows that, for beer, the market share for non-refillable glass dropped from 86% in 2006 to 44% in 2018 and for soft drinks it dropped from 25% in 2006 to 6% in 2018.

Recycling DRS in Scotland
84
Figure 47: Market share (% of unit sales) of glass by product category in Denmark
Source: GlobalData. Adapted by Oakdene Hollins.
The proposed ‘soft drop’ approach to handling glass reduces the issue of handling broken glass and will promote colour separated glass streams, ensuring that high quality recycled glass is available on the market118. However, it is not without its issues, including:
• Greater storage space requirements (ZWS estimates a 25% increase with 10% increased cost).
• Greater manual handling across the whole value chain.
• Lower transport efficiencies.
• Higher potential risk of fraud.
118 https://www.gov.scot/publications/deposit-return-scheme-scotland-full-business-case-stage-1/

Recycling DRS in Scotland
85
85
85
Market distortion due to substitution for non-DRS packaging materials
Further to the threat of market distortion from materials included within the recycling DRS, there is a significant market presence of non-DRS materials and packaging formats in some product categories in which glass operates (for example wine).
Figure 48 shows the UK glass packaging market by product category. Wine has shown a slight decline, dropping from 95% in 2006 to 90% in 2018, which demonstrates that alternative packaging formats are gaining a foothold in the market. The proposed DRS could accelerate this trend and would represent a particular threat in the hospitality sector and on-line shopping channel, where the return of empty wine bottles would be particularly problematic. Wine in draught format would be a significant competitor in the hospitality sector, and bag-in-box and pouches would represent a major threat across all sales channels. Please note: Bag-in-box and pouches are typically sold in sizes greater than the standard 75cl bottle and hence could represent an additional example of potential ‘upsizing’, discussed above.
Figure 48: Market share (% of unit sales) of glass by product category in the UK
Source: GlobalData. Adapted by Oakdene Hollins.

Recycling DRS in Scotland
86
7 To conclude
The review shows that there are a number of general issues regarding the proposed recycling DRS, including:
• Meeting recycling targets
• EPR
• DRS
• Local authorities
• Data uncertainty
• Refillable culture
• On-trade
• Producer pays
• Consumer pays
• Litter
• Upsizing
7.1 Meeting recycling targets
The UK operates a market-based model, called the Packaging Recovery Note (PRN). Obligated producers have to buy PRNs (1 PRN / 1 tonne) from waste reprocessors or packaging companies to offset their packaging use against the recycling target. If the target is not being met, the PRN price goes up; if the target is met it goes down. Calls are growing for a reform of PRNs.
Figure 2 shows the glass packaging recycling rate in the UK. The most recent EU Directive target for the UK was the 60% target back in 2008 and the UK met the target with a recycling rate of 61.3%119. Since then the UK Government has set its own business packaging waste recycling targets, but the recycling rate has stagnated in the last five recorded years (2012 to 2016) following an increased recycling rate.
New glass recycling targets of 70% by 2025 and 75% by 2030 have been set at a European level120 and based on previous performance it would be anticipated that these targets would be achieved via the existing PRN system. The likelihood of the glass packaging recycling rate in Scotland being higher than today’s 64% in 2025, let alone 2043, is therefore very high.
7.2 EPR
Extended producer responsibility (EPR) schemes, covered by the EU Packaging Directive means obligated121 producers must pay fees to cover the end of life costs of their packaging (i.e. its collection, recycling and disposal). Every time an obligated producer (e.g. a brand) puts a packaged product on the market, it must pay the fee. Most EPR schemes are fee-based models. New EPR rules will now also cover the cost of littering.
EPR schemes have been traditionally implemented to channel producer funding into investment in End of Life (EoL) waste management infrastructure. Spain and the EPR scheme for non-DRS in Finland are examples where the reason for the rapid increase in the recycling
119 https://www.letsrecycle.com/packaging/targets/
120 https://eur-lex.europa.eu/legal-content/EN/TXT/?uri=LEGISSUM%3Al21207 (EU Directive, 2018) 121
See Section 3.1.1 for an explanation of the term ‘obligated’.

Recycling DRS in Scotland
87
87
87
rates was the introduction of the EPR. Figure 3 shows the overall recycling rates for glass packaging for the EU-28, Norway and Switzerland, in 2016, with the countries operating recycling DRS for one-way glass beverage containers shown in red. The top four performing countries (Slovenia, Belgium, Luxembourg and Sweden) do not operate a recycling DRS for glass, but instead operate an EPR scheme to cover all glass packaging. All achieve over 90%.
7.3 DRS
The recycling DRS for glass represents an additional recycling system. The DRS proposed by Scotland only covers part of the packaging put on the market and therefore can only be introduced alongside investment in existing or new collection schemes. An estimated 26% of glass packaging will fall outside the DRS, much of which is clear glass needed by the Scottish glass manufacturers. The two ‘dual’ systems would have to be maintained in parallel. The widely recyclable components will be removed from the existing collection systems making them less efficient. The limited quantity and quality of glass remaining outside the deposit scheme could jeopardise the Local Authority current collection provisions (kerbside or bring banks) for such glass.
7.4 Local authorities
This analysis shows that in many of the Local Authorities the glass collection infrastructure is not well established, irrespective of whether it is an urban or rural Local Authority. This can be due to the motivation of the individual Local Authorities to deliver the service, but often this will be due to the budgetary constraints of having to balance the provision of this service against many others.
There is no harmonisation of waste management systems in place across the Local Authorities in Scotland from both a general household waste, and more specifically, packaging glass collection, perspective.
The budgetary constraints on Local Authorities means that the aggregates option is an attractive means of meeting their recycling obligations. For example, an impact assessment by Defra in 2014 compares the net cost of recycling glass through remelt and aggregates. This showed that in 2014 the lower ‘collection and sorting for recycling’ to aggregates resulted in this being cheaper than the remelt route, Table 9. Due to the much higher environmental benefits of closed loop (remelt) recycling, discussed in Section 6, this is considered a market failure.
Removing the easy to recycle fraction from the Local Authorities collection schemes, could render the schemes inefficient and withdrawal of the services and some authorities have already made such a decision Clackmannanshire (ranked 4th on Figure 10)122 and Inverclyde (ranked 6th poorest) have made the decision to withdraw their kerbside glass collection services as a cost cutting exercise.
7.5 Data uncertainty
Unit sales of container glass in the UK according to Global Data were used to estimate the quantities being placed on the market in Scotland, British Beer and Pub Association (BBPA)
122 https://www.clacks.gov.uk/document/meeting/266/912/6398.pdf (Clackmannanshire Council, 2019)

Recycling DRS in Scotland
88
data was also used to determine the contribution of Scotland. In addition, a population proxy was used.
The three estimates differ significantly from the 0.33 billion containers estimated within the Scottish Governments Full business and regulatory impact assessment Table 13. This level of uncertainty over the scale of the glass that would be included within the scheme places concerns over the cost modelling that has been undertaken and places a risk to the glass producers that they will be faced with extremely inflated costs.
7.6 Refillable culture
From a consumer and retailer perspective, the return of glass containers to the point of purchase via a ‘soft drop’ RVM or manual system is similar for both refillable and one-way containers. Therefore, countries that operate a voluntary DRS are best placed to transition or add on a recycling DRS.
Figure 21 shows that in 2000 all the EU-28MS that now have a recycling DRS for glass (Croatia, Denmark, Estonia, Finland, Germany and Lithuania) had a significant dependence on refillables, i.e. the market share of refillables in all six countries was above 50% of the total market. Both Croatia and Germany can be seen to have maintained their refillables market with only a slight drop in share observed in 2017. However, market share in Denmark, Finland, Estonia and Lithuania can be seen to have dropped significantly and this was driven by the conscious decision by the governments of these countries to switch from a voluntary DRS driven refillable system to a mandatory DRS driven scheme for one-way containers.
The UK alongside France, Italy and Ireland, do not have the return structure that the aforementioned six countries have. The cost of resources needed to transition from this position - in terms of infrastructure requirements, consumer behaviour change, product rebranding, etc. - cannot be overestimated.
7.7 On-trade
The on-trade (pubs, hotels, restaurants, etc) represents a particular issue, especially since the intention is for the containers to be recovered via the existing outbound delivery system.
To demonstrate the numbers of bottles that would potentially have to be returned via the outbound delivery vehicles, Figure 22 shows that there are an estimated 16.5 million bottles in the Scottish on-trade. The Scottish Government reports123 a total estimated 45.5 million DRS-eligible containers sold in Scottish pubs and clubs each year. This estimation is potentially very low given the fact that glass wine bottles alone are estimated to account for 16.5 million containers or 36% of the total. This excludes beer, spirits, bottled water and soft drinks containers (glass, PET and cans).
Key issues and challenges around the proposed recycling DRS for the on-trade (hospitality trade) are:
• Secure storage on-site to prevent public access to the containers.
• High volume manual handling.
• Reverse logistics cannot be utilised for some of the legs of the journey
123 https://www.gov.scot/publications/deposit-return-scheme-scotland-full-business-regulatory-impact-assessment/pages/1/

Recycling DRS in Scotland
89
89
89
• Vehicle management. High outbound volume (of products) on deliveries later in the week and high inbound volume (of empty containers) early in the week and seasonality / event issues in balancing outbound and inbound capacity.
• Traceability of returns. One vehicle may collect empty containers from about 10 drops on a round; so how to ensure that the deposits are returned to the correct outlet?
• Crate or container management?
7.8 Producer pays
Producers will not pay full net costs: The recycling DRS cannot be considered a policy mechanism that forces producers to cover the ‘full net costs’ of the downstream management of the products they place on the market, i.e. the ‘producer pays’ principle. This is not unique to the proposed scheme in Scotland since the same is the case in Norway. Figure 24 shows that at the target capture rate of 90% the producer fees account for just 32% of the total revenue. This cannot therefore be considered a system where the producer pays the full net costs of waste management.
7.9 Consumer pays
Figure 25 shows a breakdown of the direct cost of operating the recycling DRS to consumers at various capture rates. This shows that at a capture rate of 80% the consumers would be paying £67.8 million in unredeemed deposits which equates to 84% of the scheme revenue. This suggests that Producer Fees are likely to be very modest in the first few years of the scheme while the scheme is in its infancy and capture rates slowly increase.
7.10 Litter
Table 23 shows that the societal benefits assigned to the EPR model that includes a litter enforcement strategy was £252 million, just 23% of that modelled for the DRS (£1,101 million) shown in Table 22. Please note: The Scottish Governments report states that with respect to the comparison of the DRS versus EPR options that “it is not possible to isolate the costs and benefits of DRS containers within the EPR output, so the NPV analysis provided includes wider household packaging”. It is suggested that this unfairly penalizes the EPR option since it would heavily inflate the costs to business of operating the EPR for all household packaging shown in Table 23.
Furthermore, the estimated costs to business of implementing the EPR appears to be very high, since the major component of the costs is the transfer of the waste management costs from the Local Authorities to businesses, in line with the ‘polluter pays’ principle, and Table 23 shows the Local Authority benefits (£284 million) to be much lower than the £670 million costs incurred by business. Additional costs to business would include the cost of littering and possibly fly tipping, although fly tipping is less prevalent for beverage containers than other forms of waste. Although the actual estimated cost to business can be challenged , Table 23 does demonstrate the true ‘polluter pays’ nature of the EPR with business accounting for £670 million of the £675 million costs at zero cost to Local Authorities and Society.
7.11 Upsizing
Responsible consumption represents a key area of sensitivity in the alcoholic drinks market.

Recycling DRS in Scotland
90
The introduction of a scheme with a flat deposit can potentially encourage consumers to upsize and is a particularly contentious issue for alcoholic beverages. The Croatian beer market is an example where this occurred after the introduction of such a scheme. Since the introduction of the DRS consumers have switched to larger pack sizes in PET and cans (Figure 32 and Figure 33). For glass, Figure 45 shows the decline in market share of the 25cl one-way glass beer bottle in Croatia.
In conclusion, there is no guarantee that the Recycling DRS will increase overall glass packaging recycling rates nor provide the recyclate needed to make a circular economy in Scotland. Many glass packaging products covered by the current EPR scheme would fall outside the proposed recycling DRS scheme. Furthermore, the cost to consumers is substantial and the measure will have unintended consequences.

Recycling DRS in Scotland
91
91
91
Annex A: Example MSs operating an EPR for packaging
Austria
Figure 49 shows that the glass packaging recycling rate in Austria has been above 82% for at least the last 10 recorded years.
Figure 49: The glass packaging recycling rate Austria
Source: Eurostat
Currently (2016), 85% of glass (around 240,000 tonnes) is collected through the EPR scheme. Vetropack reports that there is no kerbside collection of glass from households, instead a bring bank is, on average, located within 300-400 metres of every household. The glass is not typically colour-separated at bring banks, but Vetropack collects, colour sorts and reprocesses it at one of its two factories in Austria. Vetropack reports that the contamination rate is 5-6% in the glass collected from the bring banks.124 According to Austria Glas Recycling125 the high recycling rate and the low contamination rate in Austria is explained by very strong educational messages targeted at primary school level. However, there is a marked rural/urban split, with high contamination rates in Vienna while the quality of glass collected in rural settings approaches 100%.
More than 80% of the collected material is recycled domestically by Vetropack Austria GmbH (in Pöchlarn, Lower Austria, and Kremsmünster, Upper Austria) and by Stölzle Oberglas GmbH (in Köflach, Styria); the remaining cullet is exported to glass reprocessors in Germany, Italy, Croatia, Slovakia and the Czech Republic.
124 Vetropack Austria GmbH. Personal communication 27 August 2018. 125 Austria Glas Recycling GmbH. Personal communication 27 July 2017.

Recycling DRS in Scotland
92
Table 36 shows the breakdown of the costs of operating the scheme (across all packaging) and the recovered material. In 2014, glass accounted for 221,733 tonnes of the total packaging recovered, or 27.5% of the total. Most of it was collected via the 74,900 waste glass containers126 across Austria, in which clear glass and coloured glass are collected separately.
Table 36: The breakdown of the costs of operating the EPR scheme in Austria, 2012 to 2014
2012 2013 2014
Number of licence partners 15,550 16,035 16,341
License fee revenues in million euro 143.8 135.8 132.7
Waste managed, tonnes 829,607 835,465 844,948
Waste recovered, tonnes 778,240 782,781 805,142
Cost of waste recovered in euro/tonne 184.8 173.5 164.8 Source: ARA: Sustainability report 2014
Table 37 shows the license rates as of 1 January 2015, and it is reported that the rates reflect the expenses the various materials cause in the collection and recovery cycle. The table shows that the tariff for glass is one of the lowest, signifying that from a weight-based perspective it is one of the cheapest materials to recover using this system. For example, the 0.082 euro/kg tariff for household glass equates to 82 euro/tonne which is much lower than the average cost of waste recovery of 164.8 euro/tonne shown in Table 36.127
Table 37: The breakdown of the material specific packaging tariffs in Austria in 2014
Material Packaging tariff (€/kg)
Household Commercial
Paper 0.095 0.035
Glass 0.082 0.05
Ferrous metal 0.24 0.06
Aluminium 0.29 0.08
Plastic 0.565
Beverage cartons 0.59
Other composite materials 0.565 0.1
Ceramics 0.14 0.14
Wood 0.018 0.008
Textile fibres 0.2 0.2
Biodegradable materials 0.45 0.1 Source: ARA: Sustainability report 2014
The revenue for the glass cullet sold to the glass industry accounts for 25% of the total costs, and 75% is covered by the EPR contributions.
In Austria, the Federal Ministry of Sustainability and Tourism has recently launched Reinwerfen statt Wegwerfen (English: Toss it in the bin), a voluntary initiative for businesses and social partners to improve the ecological performance of packaging (mainly beverage containers). This nationwide anti-littering campaign receives between 700,000 and 1 million
126 According to the ARA website there were 80,600 glass waste containers in Austria in 2017. 127 The weight-based tariffs also motivate producers to lightweight their containers.

Recycling DRS in Scotland
93
93
93
euro of annual funding from packers/fillers and retailers and seeks to raise public awareness to prevent littering and promote the separate collection and recycling of packaging.
Figure 50 shows that over the last 12 years the glass market has been relatively stable with only beer & cider showing any significant change with a significant growth between 2008 and 2010.
Figure 50: Market share of glass (% of unit sales) by product category in Austria
Source: GlobalData. Adapted by Oakdene Hollins.
Spain
Spain has seen a rapid growth in recycling from just 36.3% in 2002 to 70.4% in 2015. Figure 51 shows the incremental increase in recycling rates between 2007 and 2016. In 1997, the Packaging and Packaging Waste legislation (97/11) was introduced, which included the introduction of the EPR scheme. The EPR scheme operates like many of the Green Dot schemes operated across Europe, whereby packaging companies finance the scheme based on the weight of material they place on the market. The national EPR administrator for glass, Ecovidrio, has focussed on increasing the number of collection points (bottle banks called ‘igloos’). Figure 52 shows how the number of igloos has increased in Spain and the subsequent increase in glass recycling.

Recycling DRS in Scotland
94
Figure 51: The glass packaging recycling rate in Spain
Source: Eurostat
Figure 52: The number of ‘igloos’ and the recycling rate in Spain 2007 to 2016
Source: Produced by Oakdene Hollins using data from Ecovidrio
Ecovidrio128 states that the key factors for the growth in glass recycling have been:
• Significant focus on the hotels, restaurants and catering (HORECA) sector. They are large generators of one-way glass containers and Ecovidrio has invested a lot of resources and effort in trying to recycle more and more. For example, special containers were introduced (self-loading, with a system that allows easy management of large amounts of waste), provision of resources (delivery of cubes etc), informative visits and training. Figure 53 shows an example of the bottle banks used for the HORECA channel in Spain.
128 Ecovidrio. Personal communication July 2018.

Recycling DRS in Scotland
95
95
95
Figure 53: An example of the bottle banks in operation for the HORECA channel in Spain
Source: Oakdene Hollins
• Promotion of direct collection. The Ecovidrio model is unique. Two options are offered to the local authorities: financing at zero cost for them with the selective collection of glass containers or (preferred by Ecovidrio) managing the system directly and taking care of collection, etc.
• Effort in supplying more containers (‘igloos’). Spain has one of the highest concentrations of containers in Europe, with a ratio of 1 container per 213 residents. It is one of Ecovidrio’s strategic plans, to continue investing in containers.
• 315 awareness campaigns per year. Ecovidrio is very well-known for campaigns in the media, on the streets, at parties, workshops in schools, social media, etc.
A report undertaken by UNESCO on the review of a recycling DRS in Spain concluded that129:
“The vast majority of the financial and human resources the change would require would be better devoted to improving the existing system and the processing of other types of waste that are more abundant and environmentally problematic. Packaging waste is a small and relatively problem free fraction of all municipal waste, and the packaging proposed for the DRS is the kind that is handled well by the current system.”
The contamination rate in the glass containers igloos in Spain is less than 2%. The mono-material container with its small mouth provides the highest quality material. The contamination in the containers (usually plastics, plugs, lids and in some cases ceramic or crystal) is easily removed at the treatment plants with manual or optical sorting: in the case of glass, it is reported not to be a problem at all.
Figure 54 shows the comparison between the unit sales of bottled water, beer and soft drinks in one-way glass containers and the recycling rate for glass between 2007 and 2016.
129 https://repak.ie/wp-content/uploads/2017/12/PMCA-Report-on-Deposit-and-Return-Scheme-in-Ireland-041217-FINAL.pdf
(Repak/PMCA Economic Consulting, 2017)

Recycling DRS in Scotland
96
This shows that the recycling rate increased from 55.8% to 72%, but there has been no apparent impact on the unit sales in one-way glass.
Figure 54: A comparison between the unit sales of bottled water, beer and soft drinks in one-way glass containers and the recycling rate for glass packaging in Spain
Source: GlobalData and Eurostat. Adapted by Oakdene Hollins.
Figure 55 shows that glass has lost market share most significantly in the wine category, with more minor losses in beer.
Figure 55: Market share of glass (% of unit sales) by product category in Spain
Source: GlobalData. Adapted by Oakdene Hollins.
0,0%
10,0%
20,0%
30,0%
40,0%
50,0%
60,0%
70,0%
80,0%
0
500
1000
1500
2000
2500
3000
3500
2007 2008 2009 2010 2011 2012 2013 2014 2015 2016
Rec
yclin
g ra
te (
%)
Un
it s
ales
(M
illio
ns)
Unit sales Recycling rate

Recycling DRS in Scotland
97
97
97
Annex B: MS and EFTA countries operating a recycling DRS including glass
Croatia
Fact sheet on the glass recycling DRS in Croatia
Population: 4.3m
Date of introduction: 2006
Packaging materials: Plastic (predominantly PET), metal (aluminium/tinplate), glass
Unit size of packaging: Variable
Product categories: Juices; mineral water; other waters; beer; wine; hard liquor and milk drinks in volume <0.2l
Deposit value: €0.066 (0.5 HRK)
Capture rate of the DRS: 82% (2016)
Overall glass packaging recycling rate: 56.4% (2016)
Recent history in refillable bottles: 56.9% (2000) to 46.1% (2017) in the beer, bottled water and soft drinks markets
Percentage of glass recovered through the DRS: 82% (35,819 tonnes of the total 43,682 tonnes recycled)
Alternative policies for recovering non-DRS beverage packaging: EPR

Recycling DRS in Scotland
98
Figure 56 shows the glass packaging recycling rate in Croatia. This highlights the fact that Croatia have the lowest overall glass packaging recycling rate of the countries that operate a recycling DRS that includes glass.

Recycling DRS in Scotland
99
99
99
Figure 56: The glass packaging recycling rate (%) in Croatia
Source: Eurostat
In Croatia, a returnable fee of €0.06 per container is applied to all containers within the recycling DRS, irrespective of material or size. The scheme was introduced in 2006 and Figure 57 shows the impact the introduction of the DRS had on the small 25cl one-way glass market for beer, dropping from 84% of the packaged beer market in 2006 to 5.5% in 2017. Initially (2006 to 2007) the larger 33cl glass bottle gained market share (from 6% in 2006 to 12% in 2007), but this has fallen back to 9% in 2017. PET is the market leader for packaged beer in Croatia and the Croatian Brewers Association reports the popularity of beer packaged in PET is due in part to the fact that it is generally priced lower than regular beers.130
Figure 57: The beer market in one-way glass in Croatia
Source: GlobalData. Adapted by Oakdene Hollins.
130 www.ey.com/Publication/vwLUAssets/EY_%E2%80%93_The_Contribution_made_by_Beer_to_the_European_Economy/$FILE/EY-The-
Contribution-made-by-Beer-to-the-European-Economy.pdf (EY, 2013)
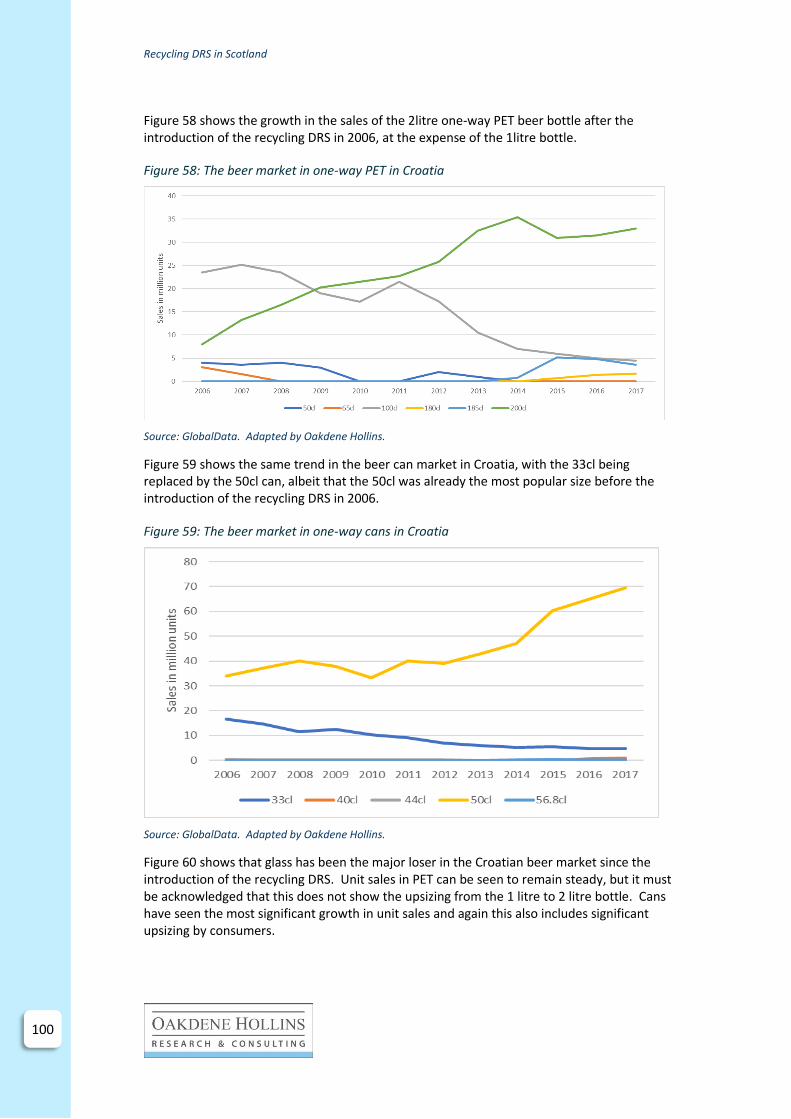
Recycling DRS in Scotland
100
Figure 58 shows the growth in the sales of the 2litre one-way PET beer bottle after the introduction of the recycling DRS in 2006, at the expense of the 1litre bottle.
Figure 58: The beer market in one-way PET in Croatia
Source: GlobalData. Adapted by Oakdene Hollins.
Figure 59 shows the same trend in the beer can market in Croatia, with the 33cl being replaced by the 50cl can, albeit that the 50cl was already the most popular size before the introduction of the recycling DRS in 2006.
Figure 59: The beer market in one-way cans in Croatia
Source: GlobalData. Adapted by Oakdene Hollins.
Figure 60 shows that glass has been the major loser in the Croatian beer market since the introduction of the recycling DRS. Unit sales in PET can be seen to remain steady, but it must be acknowledged that this does not show the upsizing from the 1 litre to 2 litre bottle. Cans have seen the most significant growth in unit sales and again this also includes significant upsizing by consumers.
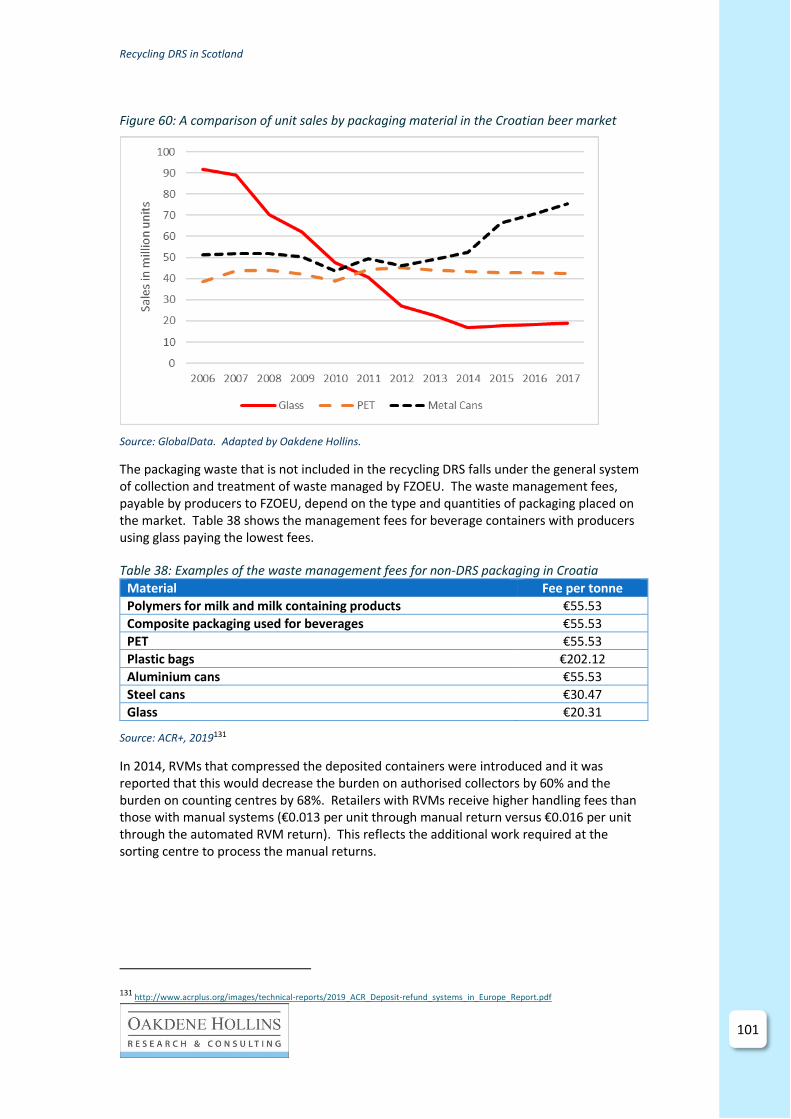
Recycling DRS in Scotland
101
101
101
Figure 60: A comparison of unit sales by packaging material in the Croatian beer market
Source: GlobalData. Adapted by Oakdene Hollins.
The packaging waste that is not included in the recycling DRS falls under the general system of collection and treatment of waste managed by FZOEU. The waste management fees, payable by producers to FZOEU, depend on the type and quantities of packaging placed on the market. Table 38 shows the management fees for beverage containers with producers using glass paying the lowest fees.
Table 38: Examples of the waste management fees for non-DRS packaging in Croatia
Material Fee per tonne
Polymers for milk and milk containing products €55.53
Composite packaging used for beverages €55.53
PET €55.53
Plastic bags €202.12
Aluminium cans €55.53
Steel cans €30.47
Glass €20.31
Source: ACR+, 2019131
In 2014, RVMs that compressed the deposited containers were introduced and it was reported that this would decrease the burden on authorised collectors by 60% and the burden on counting centres by 68%. Retailers with RVMs receive higher handling fees than those with manual systems (€0.013 per unit through manual return versus €0.016 per unit through the automated RVM return). This reflects the additional work required at the sorting centre to process the manual returns.
131 http://www.acrplus.org/images/technical-reports/2019_ACR_Deposit-refund_systems_in_Europe_Report.pdf

Recycling DRS in Scotland
102
Denmark
Fact sheet on the glass recycling DRS in Denmark
Population: 5.6m
Date of introduction: 2002
Packaging materials: Plastic (predominantly PET), metal (aluminium), glass
Unit size of packaging: Variable
Product categories: Beer (alcohol content > 0.5% by volume); carbonated soft drinks (alcohol content of 0–0.5%); energy drinks; mineral water; iced tea; ready-to-drink beverages (incl. lemonade, alcopops, energy drinks and cider products); mixer products where spirits, wine or other fermented products are mixed with other beverages such as soft drinks, cider, chocolate or juice (alcohol content 0.5% - 10%)
Deposit value: Metal, glass, plastic < 1l: €0.13 (1 DKK) Plastic 0.5l: €0.2 (1.5 DKK)
Metal, glass, plastic ≥ 1l: €0.4 (3 DKK)
Capture rate of the DRS: 90% (2016)
Overall glass packaging recycling rate: 85% (2016)
Recent history in refillable bottles: 90.3% (2000) to 16.9% (2017) in the beer, bottled water and soft drinks markets
Percentage of glass recovered through the DRS:
Alternative policies for recovering non-DRS beverage packaging: No EPR, reliant on Municipalities to fund the scheme
Figure 61 shows that the overall glass packaging recycling rate in Denmark is high, but with a high level of fluctuation. The much-cited border trade with Germany is considered a key factor in the fluctuation.
Figure 61: The glass packaging recycling rate in Denmark
Source: Eurostat

Recycling DRS in Scotland
103
103
103
The recycling DRS in Denmark operates with a variable deposit, dependent on material, size and packaging format (refillable or one-way). Wine and spirits are excluded since ‘wine and spirits bottles are generally not considered as an environmental problem’132.
Table 39 shows the breakdown of the revenue generated in the scheme. This shows that the unredeemed deposits account for nearly one-third of the revenue (31.7%) and this is a cost to the consumers who have not returned the containers. However, ‘operating fees’ paid by the producers represents the main revenue stream, accounting for 44.8% of revenue. Operating fees cover the full cost of operating and administering the DRS (covering collection and logistics).
Table 39: Revenue generated in the Danish recycling DRS in 2017
Revenue stream
% of total
revenue
Revenue
Unredeemed deposits
31.7% €23.31m
Operating fees
44.8% €32.96m
Scrap material sales
21.3% €15.68m
Other 2.1% €1.54m
Total €73.5m
Source: ACR+, 2019133
Dansk Retursystem reports that 93% of the 1.2 billion containers recovered through the recycling DRS are PET and cans. The RVMs crush these containers which improves transport and storage efficiencies. This makes handling these materials cheaper, which reduces the fees on plastic and aluminium. For glass, Dansk Retursystem reports that134:
‘In relation to glass, we have not achieved the same efficiency. Although we have introduced special solutions where the counting takes place in the shops, we cannot crush glass in the shops. Therefore, glass is expensive to transport, and it also requires extra safety equipment at our factories. The charge on glass therefore rises based on the actual cost of handling the material, and since glass only accounts for about 7% of the market, the costs are distributed on fewer packages’.
The impact of the greater difficulty in handling glass in the recycling DRS is reflected in the fees. Dansk Retursystem reports that:
‘In 2018, we have a goal of implementing a fee reduction that is on average 10% lower than in 2017. On 1 July 2018, the fees were regulated. The fees for aluminium, steel and plastic packaging are reduced, while the charges for glass packaging are rising’.
Table 40 shows the operating fees before the fee changes in the first 6 months of 2018 versus the 2019 fees. This shows the significant difference in operating fees between the packaging types that are easy to recover through the recycling DRS, e.g. aluminium (4 Danish
132 http://www.acrplus.org/images/technical-reports/2019_ACR_Deposit-refund_systems_in_Europe_Report.pdf (ACR+, 2019)
133 http://www.acrplus.org/images/technical-reports/2019_ACR_Deposit-refund_systems_in_Europe_Report.pdf 134
https://www.danskretursystem.dk/implementering-af-ny-gebyrmodel-2/ (Dansk Retursystem, accessed 2019)
http://www.acrplus.org/images/technical-reports/2019_ACR_Deposit-refund_systems_in_Europe_Report.pdf

Recycling DRS in Scotland
104
øre per unit (0.0054€)), as opposed to the harder to handle glass (77 Danish øre per unit, eqv. 0.08 €).
Table 40: Operating fees by packaging type
Packaging type
Size Operating fee (Danish øre per unit)
2018 (Jan to
June) 135
2019136
Aluminium Under 1 litre
9 (0.12€)
4 (0.0054€)
Steel Under 1 litre
21 (0.028€)
16 (0.021€)
1 litre and over
64 (0.086€)
23 (0.031€)
Plastic Under 1 litre
21 (0.028€)
17 (0.023€)
1 litre and over
27 (0.036€)
17 (0.023€)
Glass Under 1 litre
41 (0.055€)
57 (0.076€)
1 litre and over
70 (0.094€)
77 (0.103€)
Furthermore, in 2018, Denmark introduced a Circular Economy Fee that is paid if the following are used:
• Coloured plastic (7 Danish øre (0.0094€) per unit)
• Composite plastic (4 Danish øre (0.0054€) per unit)
• Plastic or aluminium sleeves (7 Danish øre (0.0094€) per unit)
• Composite aluminium (6 Danish øre (0.0080€) per unit)
• Glass sleeves (2 Danish øre (0.0027€) per unit)
• Patent stoppers (57 Danish øre (0.076€) per unit)
This shows that the operating fee for glass (Figure 62) that is readily recyclable is higher than any of the fees that are in place to encourage a switch away from the non-recyclable / harder to recycle materials.
Figure 62 shows the market share of glass by product category. In most categories the market share has remained quite stable except for beer & cider which showed a significant drop between 2006 (28.8%) to 2008 (19.4%). Furthermore, glass lost market share in the wine category with a significant drop between 2008 and 2012, but the market share in glass
135 https://www.danskretursystem.dk/wp-content/uploads/2017/12/Hjemmeside_Gennemsnitsgebyr-og-pantetiketter-2018-1.-januar-
30.-juni-2018-20171222.pdf (Dansk Retursystem, 2018) 136 https://www.danskretursystem.dk/wp-content/uploads/2018/11/Hjemmeside_Gennemsnitsgebyr-og-pantetiketter-2019.pdf (Dansk
Retursystem, 2019)

Recycling DRS in Scotland
105
105
105
remains in the high 80s. This trend is similar across many of the Nordic countries with ‘paper and board’ having a relatively significant market share.
Figure 63 shows how the can industry has grown since the introduction of the scheme in 2002. Furthermore, the whole packaged beer market in one-way containers has grown from 18 million units at the time the recycling DRS was introduced to 622 million units in 2018. Glass accounted for 1.29 million units in 2002 and 79 million units in 2018.
Denmark is the one country in the EU -28MS that does not operate an EPR scheme for packaging, and in which the collection of the non-DRS packaging falls under the responsibility of municipalities. The municipalities should provide collection schemes for recyclable glass, metal and plastic packaging.
Figure 62: Market share of glass (% of unit sales) by product category in Denmark
Source: GlobalData. Adapted by Oakdene Hollins.
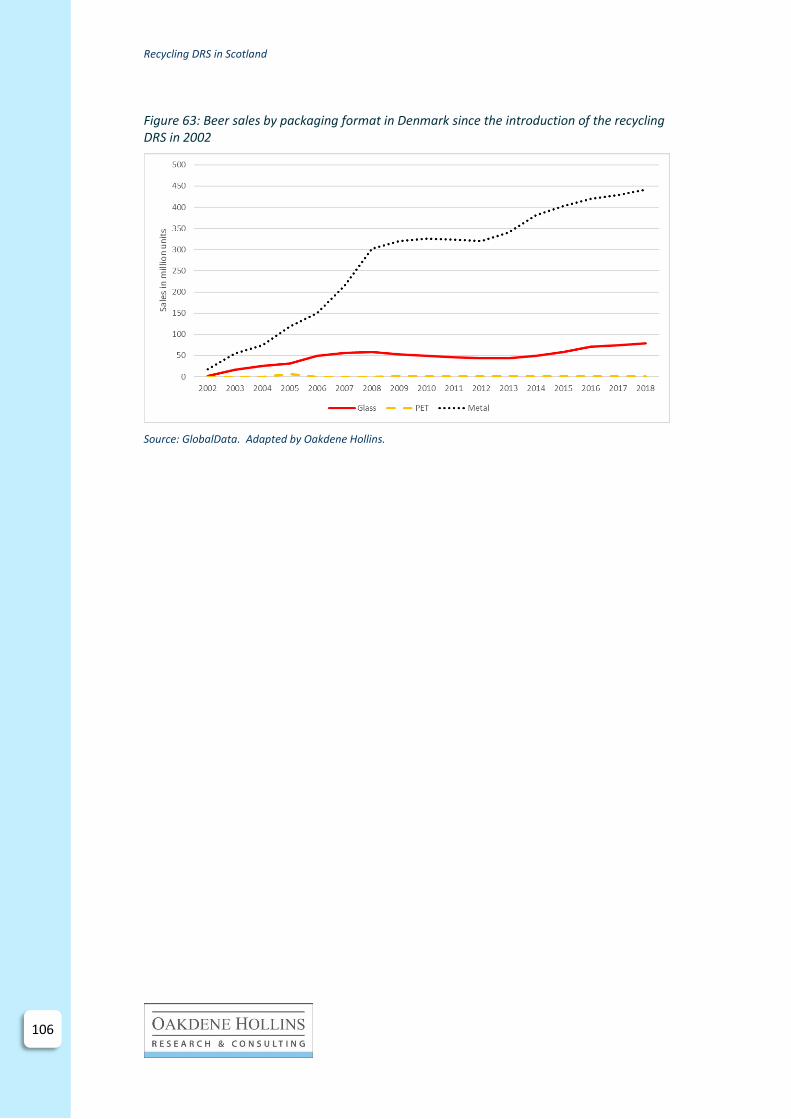
Recycling DRS in Scotland
106
Figure 63: Beer sales by packaging format in Denmark since the introduction of the recycling DRS in 2002
Source: GlobalData. Adapted by Oakdene Hollins.

Recycling DRS in Scotland
107
107
107
Estonia
Fact sheet on the recycling DRS in Estonia
Population: 1.3m
Date of introduction: 2005
Packaging materials: Plastic (mainly PET), metal (aluminium/steel), glass
Unit size of packaging: Variable
Product categories: Soft drinks; water; beer; cider; juice; juice concentrates; nectars; low-ethanol alcoholic beverages (up to 6% volume)
Deposit value: € 0.10
Capture rate of the DRS: 89% (2017)
Overall glass packaging recycling rate: 63.4% (2017)
Recent history in refillable bottles: 52.8% (2000) to 23.4% (2017) in the beer, bottled water and soft drinks markets
Percentage of glass recovered through the DRS:
Alternative policies for recovering non-DRS beverage packaging: EPR
Figure 64 shows the overall glass packaging recycling rate in Estonia between 2011 and 2016. This shows that after steady increases between 2011 and 2014, there was a significant drop in 2015 that continued through to 2016.
Figure 64: The glass packaging recycling rate in Estonia
Source: Eurostat
The deposit rate for both refillables and one-way containers is set at €0.10 per unit, irrespective of packaging format, material or size in volumes between 0.1 and 3 litres.

Recycling DRS in Scotland
108
Figure 65 shows that much like Croatia, at the time of the introduction in the recycling DRS in 2005 beer consumers upsized, in this case moving from the 33cl can to the 50cl can. Although the chart shows the 33cl can to be the market leader, the combined sales of the 50cl and 56.8cl (British pint size) is higher and highlights that the upsizing continued. Please note: all glass packaging for beer in Estonia is in refillable glass bottles.
Figure 65: The beer market in one-way cans in Estonia
Source: GlobalData. Adapted by Oakdene Hollins.
Recycling DRS in Scotland
109
109
109
Table 41 shows that 86.7% of revenue is generated through unredeemed deposits, and hence it cannot be regarded as a full net cost EPR scheme, since the consumer is paying such a significant amount. A high percentage of the unredeemed deposits will be generated from cans, due to the large share of metal cans being exported to Finland for personal use. For example, the recovery target for cans in the recycling DRS is 50% and the overall recycling target for metal packaging in Estonia is 60%. Eesto Pandipakend LLC (EPP), the system administrators in Estonia, expect this trade with Finland to slow down. Heavy taxes on beer in Finland encouraged Finns to travel to Estonia to purchase the lower tax canned beer. EPP expects a decline in can sales since a new tax was placed on canned beer in Estonia in 2016 and predicts the end of this ‘travel trade’ by 2018.

Recycling DRS in Scotland
110
Table 41: Revenue generated in the Estonian recycling DRS in 2017
Revenue stream
% of total
revenue
Revenue
Unredeemed deposits
86.7 €29.255m
Revenue from sold material
9.4 €3.182m
Collected operating fees
3.7 €1.258m
Other 0.01 €0.054m
Total €33.759
Source: ACR+, 2019137
In 2017, there were a total of 850 collection points, of which 670 used automated RVMs. The RVMs use a soft drop system for glass, to accommodate the refillable glass containers that are deposited in the same machines.
Clear glass bottles are recycled in Estonia and turned into new bottles and jars. Coloured glass is sold to recyclers abroad, as there are no coloured glass manufacturers in Estonia.
Figure 66 shows that one-way glass has a very low market share in the three product categories most commonly found in a recycling DRS. It is suggested that the high level of refillable glass in the system and the well-established return infrastructure is a reason for the inclusion of one-way glass, i.e. very little investment would have been required to integrate one-way glass into the system.
137 http://www.acrplus.org/images/technical-reports/2019_ACR_Deposit-refund_systems_in_Europe_Report.pdf

Recycling DRS in Scotland
111
111
111
Figure 66: Beverage sales of beer, bottled water and soft drinks by container type in Estonia
0
20
40
60
80
100
120
140
160
180
2000 2001 2002 2003 2004 2005 2006 2007 2008 2009 2010 2011 2012 2013 2014 2015 2016 2017
Un
its
sale
s (
Mil
lio
ns)
Beverages sales by container type
R- Glass One way Glass One way Metal One way PET
Source: GlobalData. Adapted by Oakdene Hollins.

Recycling DRS in Scotland
112
Finland
Fact sheet on the glass recycling DRS in Finland
Population: 5.4m
Date of introduction: 1996 (cans) / 2008 (PET) / 2012 (glass)
Packaging materials: Plastic (predominantly PET), metal (aluminium), glass
Unit size of packaging: Variable
Product categories: Almost all soft drinks; water; beer; cider; long drinks; sport drinks; juice; liquor/spirits/wine sold by Alko
Deposit value: Plastic < 0.5l: €0.10 Plastic 0.5l - 1l: €0.20 Plastic > 1l: €0.40 Metal: €0.15 Glass: €0.10
Capture rate of the DRS: 87% (2017)
Overall glass packaging recycling rate: 89.8% (2016)
Recent history in refillable bottles: 75.5% (2000) to 6.2% (2017) in the beer, bottled water and soft drinks markets
Percentage of glass recovered through the DRS: 86.6% (51,500 tonnes of the 59,500 tonnes recycled) in 2015. Please note: this will have reduced significantly due to the introduction of an EPR for non-DRS packaging
Alternative policies for recovering non-DRS beverage packaging: EPR

Recycling DRS in Scotland
113
113
113
Figure 67 shows the overall glass packaging recycling rate in Finland.
Figure 67: Glass packaging recycling rates in Finland
Source: Eurostat
Table 42 shows that, in 2015, a glass packaging recycling rate of 78% was achieved, and provides a breakdown of the performance of the two systems used in Finland. This shows that the deposit scheme accounts for 68.5% of the glass and recorded a recycling rate of 99%. However, the non-deposit glass, which accounted for the remaining 31.5% of the glass, had a recycling rate of just 33%.
Table 42: Summary of glass recycling in Finland in 2015
System Put on the market (Tonnes)
Recycled (Tonnes)
Recycled (%)
RINKI’s customers (non-deposit glass)
23,900 8,000 33
Other systems (mostly deposit system)
51,900 51,500 99
Total 75,800 59,500 78
Source: Finnish Packaging Recycling RINKI Ltd. EPR of non-deposit glass packaging in Finland. FERVER, General Assembly, 7 June 2018, Helsinki.
RINKI, the operator of Finland’s EPR scheme, reports that since 2015 the glass packaging recycling rate for non-deposit glass has increased significantly from 33% in 2015 to 94% in 2017 (Table 43).
Table 43: The glass packaging recycling rate for non-deposit glass in Finland 2015 to 2017
Year Put on the market (Tonnes)
Recycled (Tonnes)
Recycled (%)
2015 23,900 8,000 33
2016 24,000 15,200 63
2017 24,000 22,600 94
Source: Finnish Packaging Recycling RINKI Ltd. EPR of non-deposit glass packaging in Finland. FERVER, General Assembly, 7 June 2018, Helsinki.
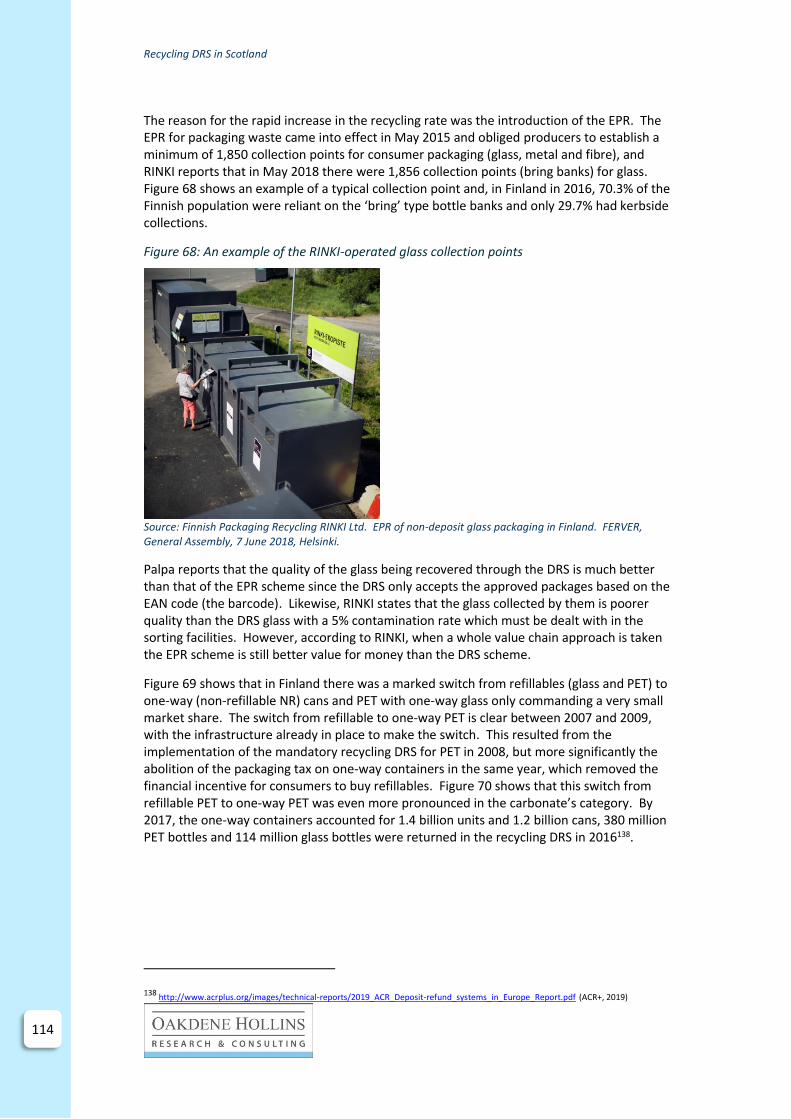
Recycling DRS in Scotland
114
The reason for the rapid increase in the recycling rate was the introduction of the EPR. The EPR for packaging waste came into effect in May 2015 and obliged producers to establish a minimum of 1,850 collection points for consumer packaging (glass, metal and fibre), and RINKI reports that in May 2018 there were 1,856 collection points (bring banks) for glass. Figure 68 shows an example of a typical collection point and, in Finland in 2016, 70.3% of the Finnish population were reliant on the ‘bring’ type bottle banks and only 29.7% had kerbside collections.
Figure 68: An example of the RINKI-operated glass collection points
Source: Finnish Packaging Recycling RINKI Ltd. EPR of non-deposit glass packaging in Finland. FERVER, General Assembly, 7 June 2018, Helsinki.
Palpa reports that the quality of the glass being recovered through the DRS is much better than that of the EPR scheme since the DRS only accepts the approved packages based on the EAN code (the barcode). Likewise, RINKI states that the glass collected by them is poorer quality than the DRS glass with a 5% contamination rate which must be dealt with in the sorting facilities. However, according to RINKI, when a whole value chain approach is taken the EPR scheme is still better value for money than the DRS scheme.
Figure 69 shows that in Finland there was a marked switch from refillables (glass and PET) to one-way (non-refillable NR) cans and PET with one-way glass only commanding a very small market share. The switch from refillable to one-way PET is clear between 2007 and 2009, with the infrastructure already in place to make the switch. This resulted from the implementation of the mandatory recycling DRS for PET in 2008, but more significantly the abolition of the packaging tax on one-way containers in the same year, which removed the financial incentive for consumers to buy refillables. Figure 70 shows that this switch from refillable PET to one-way PET was even more pronounced in the carbonate’s category. By 2017, the one-way containers accounted for 1.4 billion units and 1.2 billion cans, 380 million PET bottles and 114 million glass bottles were returned in the recycling DRS in 2016138.
138 http://www.acrplus.org/images/technical-reports/2019_ACR_Deposit-refund_systems_in_Europe_Report.pdf (ACR+, 2019)
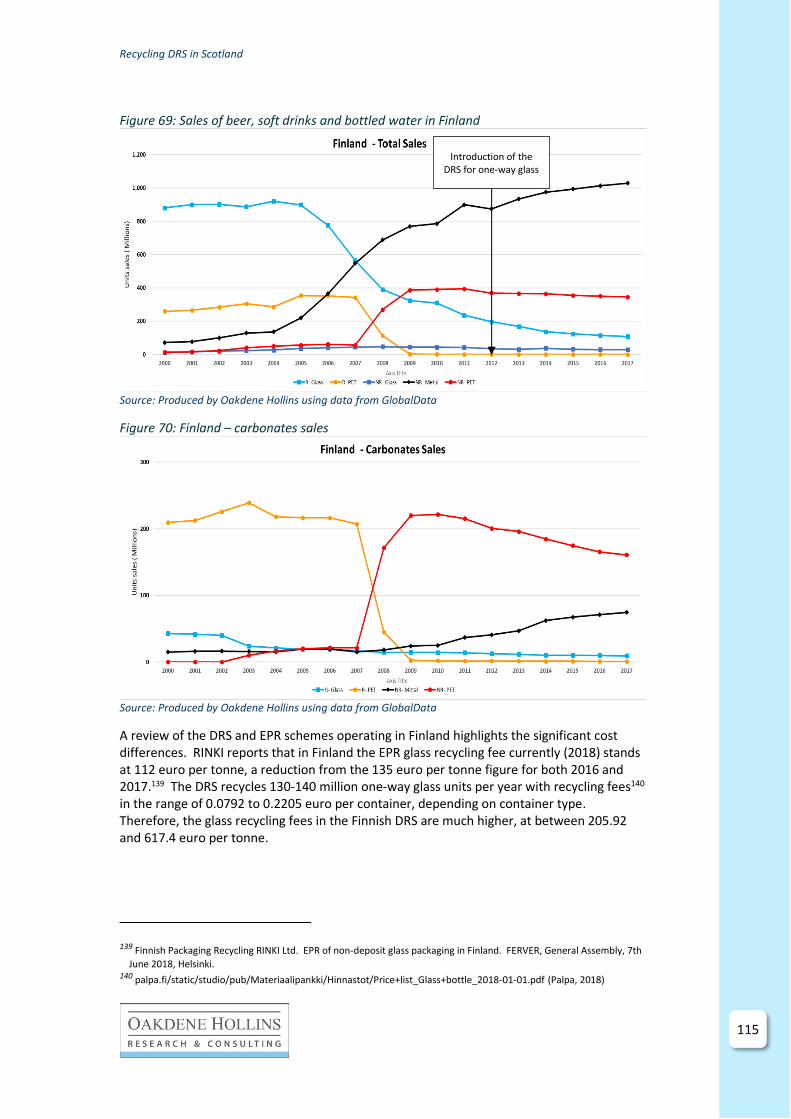
Recycling DRS in Scotland
115
115
115
Figure 69: Sales of beer, soft drinks and bottled water in Finland
Source: Produced by Oakdene Hollins using data from GlobalData
Figure 70: Finland – carbonates sales
Source: Produced by Oakdene Hollins using data from GlobalData
A review of the DRS and EPR schemes operating in Finland highlights the significant cost differences. RINKI reports that in Finland the EPR glass recycling fee currently (2018) stands at 112 euro per tonne, a reduction from the 135 euro per tonne figure for both 2016 and 2017.139 The DRS recycles 130-140 million one-way glass units per year with recycling fees140 in the range of 0.0792 to 0.2205 euro per container, depending on container type. Therefore, the glass recycling fees in the Finnish DRS are much higher, at between 205.92 and 617.4 euro per tonne.
139 Finnish Packaging Recycling RINKI Ltd. EPR of non-deposit glass packaging in Finland. FERVER, General Assembly, 7th
June 2018, Helsinki. 140 palpa.fi/static/studio/pub/Materiaalipankki/Hinnastot/Price+list_Glass+bottle_2018-01-01.pdf (Palpa, 2018)
Introduction of the DRS for one-way glass

Recycling DRS in Scotland
116
RINKI suggests141 that this is due to the relatively high cost of DRS infrastructure - i.e. expensive reverse vending machines versus cheap ‘bring banks’ - and the far greater number of collection points.
Figure 71 shows that only in the product categories of wine and spirits does glass have a market share of over 10%. Wine shares a similarity to the other Scandinavian countries, with ‘paper and board’ having a quite significant market share.
Figure 71: Market share of glass (% of unit sales) by product category in Finland
Source: Produced by Oakdene Hollins using data from GlobalData
Figure 72 shows beer sales by packaging type in Finland. This shows the same trend as seen in Denmark with can sales rocketing and the overall market growing from 58.8 million units in 1999 to 874 million units in 2018. Two slight blips occurred in the growth of cans in 2008/9 and 2012 do coincide with the introduction of the recycling DRS for PET in 2008 and the recycling DRS for glass in 2012, but the blips were both very short lived and can sales continued their growth trajectory.
141 Finnish Packaging Recycling RINKI Ltd. Personal communication 21 August 2018.

Recycling DRS in Scotland
117
117
117
Figure 72: Beer sales by packaging type in Finland
Source: GlobalData. Adapted by Oakdene Hollins.
Glass bottles are recycled in Finland to new bottles or to raw materials, such as, insulation products in the construction sector.
In terms of impact on littering, it is reported that142 “no specific studies have been done concerning litter, perception of stakeholders or comparisons with a container-based system. General studies indicate that Finnish consumers have a high level of environmental awareness, enhanced by a long history of recycling and taking care of the environment”.
142 http://www.acrplus.org/images/technical-reports/2019_ACR_Deposit-refund_systems_in_Europe_Report.pdf (ACR+, 2019)

Recycling DRS in Scotland
118
Germany
Fact sheet on the glass recycling DRS in Germany
Population: 81.9m
Date of introduction: 2003
Packaging materials: Plastic (predominantly PET), metal (aluminium), glass
Unit size of packaging: Variable
Product categories: Water (mineral water carbonated or non-carbonated, spring water, healing water, table water, water with additives, e.g. aroma, caffeine, oxygen, all other drinkable waters); beer & mixed drinks containing beer (incl. alcohol free beer); carbonated/noncarbonated soft drinks; mixed alcoholic drinks
Capture rate in the DRS: Not available
Overall glass packaging recycling rate: 85.5% (2016)
Deposit value: Metal, plastic, glass (0.1l – 3l): €0.25
Recent history in refillable bottles: 71.1% (2000) to 54.9% (2017) in the beer, bottled water and soft drinks markets
Percentage of glass recovered through the DRS: A maximum of 4.6% (105,000 tonnes of the 2,292,000 tonnes recycled in 2015)
Alternative policies for recovering non-DRS beverage packaging: EPR
Figure 73 shows that the overall glass packaging recycling rate in Germany has been over 80% for at least the last sixteen recorded years. There was a significant drop in the recycling rate in 2004 of 4.4%, but no direct link could be found between this and the introduction of the recycling DRS in 2003.
Figure 73: The glass packaging recycling rate in Germany
Source: Eurostat
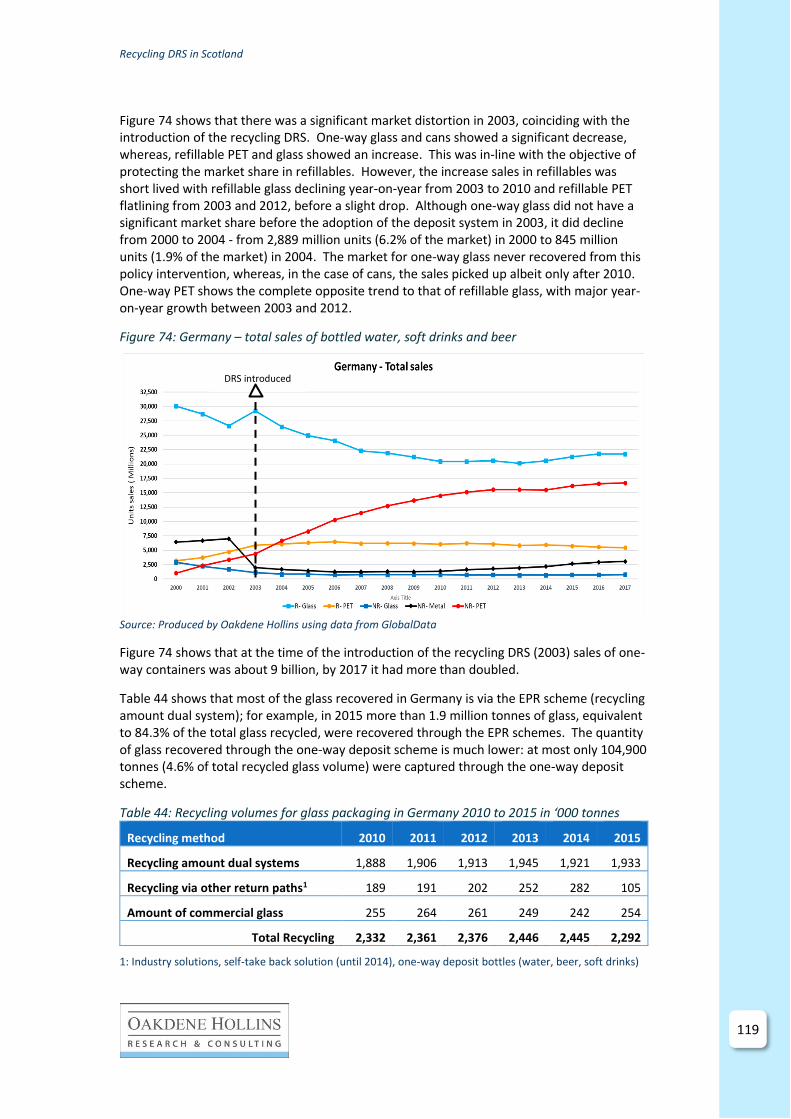
Recycling DRS in Scotland
119
119
119
Figure 74 shows that there was a significant market distortion in 2003, coinciding with the introduction of the recycling DRS. One-way glass and cans showed a significant decrease, whereas, refillable PET and glass showed an increase. This was in-line with the objective of protecting the market share in refillables. However, the increase sales in refillables was short lived with refillable glass declining year-on-year from 2003 to 2010 and refillable PET flatlining from 2003 and 2012, before a slight drop. Although one-way glass did not have a significant market share before the adoption of the deposit system in 2003, it did decline from 2000 to 2004 - from 2,889 million units (6.2% of the market) in 2000 to 845 million units (1.9% of the market) in 2004. The market for one-way glass never recovered from this policy intervention, whereas, in the case of cans, the sales picked up albeit only after 2010. One-way PET shows the complete opposite trend to that of refillable glass, with major year-on-year growth between 2003 and 2012.
Figure 74: Germany – total sales of bottled water, soft drinks and beer
Source: Produced by Oakdene Hollins using data from GlobalData
Figure 74 shows that at the time of the introduction of the recycling DRS (2003) sales of one-way containers was about 9 billion, by 2017 it had more than doubled.
Table 44 shows that most of the glass recovered in Germany is via the EPR scheme (recycling amount dual system); for example, in 2015 more than 1.9 million tonnes of glass, equivalent to 84.3% of the total glass recycled, were recovered through the EPR schemes. The quantity of glass recovered through the one-way deposit scheme is much lower: at most only 104,900 tonnes (4.6% of total recycled glass volume) were captured through the one-way deposit scheme.
Table 44: Recycling volumes for glass packaging in Germany 2010 to 2015 in ‘000 tonnes
Recycling method 2010 2011 2012 2013 2014 2015
Recycling amount dual systems 1,888 1,906 1,913 1,945 1,921 1,933
Recycling via other return paths1 189 191 202 252 282 105
Amount of commercial glass 255 264 261 249 242 254
Total Recycling 2,332 2,361 2,376 2,446 2,445 2,292
1: Industry solutions, self-take back solution (until 2014), one-way deposit bottles (water, beer, soft drinks)
DRS introduced
Recycling DRS in Scotland
120
Although the quantity of glass collected through the DRS is modest, the quality of the glass (in terms of contamination with ceramics, pharmaceutical glass and other unwanted materials) recovered through the RVMs is higher than that of the glass recovered through the EPR scheme via the bottle banks. This is because RVMs only accept containers that bear deposits.
Figure 75 shows the material flows for the EPR scheme, with the reject rates at 18-26%, which includes a significant portion of glass disposed of as residual waste (not collected through the bottle bank system) and glass contaminants estimated at 2.5-10%. The closed-loop recycling rate is about 75-81%.143 The relatively high yield losses are due to factors associated with collection and reprocessing rather than due to the quality of the glass being recovered.
Figure 76 shows the material flows for the deposit-bearing one-way glass bottles, with the reject rate at 1-4% and the closed-loop recycling rate of 95-98%. Conversely, to enable a fair comparison with the EPR scheme, discussed above, where the glass lost through the residual waste system is included, the losses through unredeemed deposits should be included. Unfortunately, the capture rate in the German recycling DRS are not disclosed. Assuming the system operates at 90% capture rate, which is the highest disclosed by other countries in Europe,
143 Reuse and recycling systems for selected beverage packaging from a sustainability perspective. (PWC, 2011)

Recycling DRS in Scotland
121
121
121
Table 24, then the reject rate is 11-14%, i.e. much closer to the 18-26% in the EPR.
Figure 75: Material flows for one-way glass bottles disposed of through the dual system
Source: PwC, 2011143
Figure 76: Material flows of deposit one-way glass bottles
Source: PwC, 2011144
Figure 77 shows that, with the exception of a decline in the market share in beer & cider between 2006 and 2012, the one-way glass market has remained relatively steady over the period 2006 to 2018.
144 Reuse and recycling systems for selected beverage packaging from a sustainability perspective. (PWC, 2011)

Recycling DRS in Scotland
122
Figure 77: Market share of glass (% of unit sales) by product category in Germany
Source: GlobalData. Adapted by Oakdene Hollins.
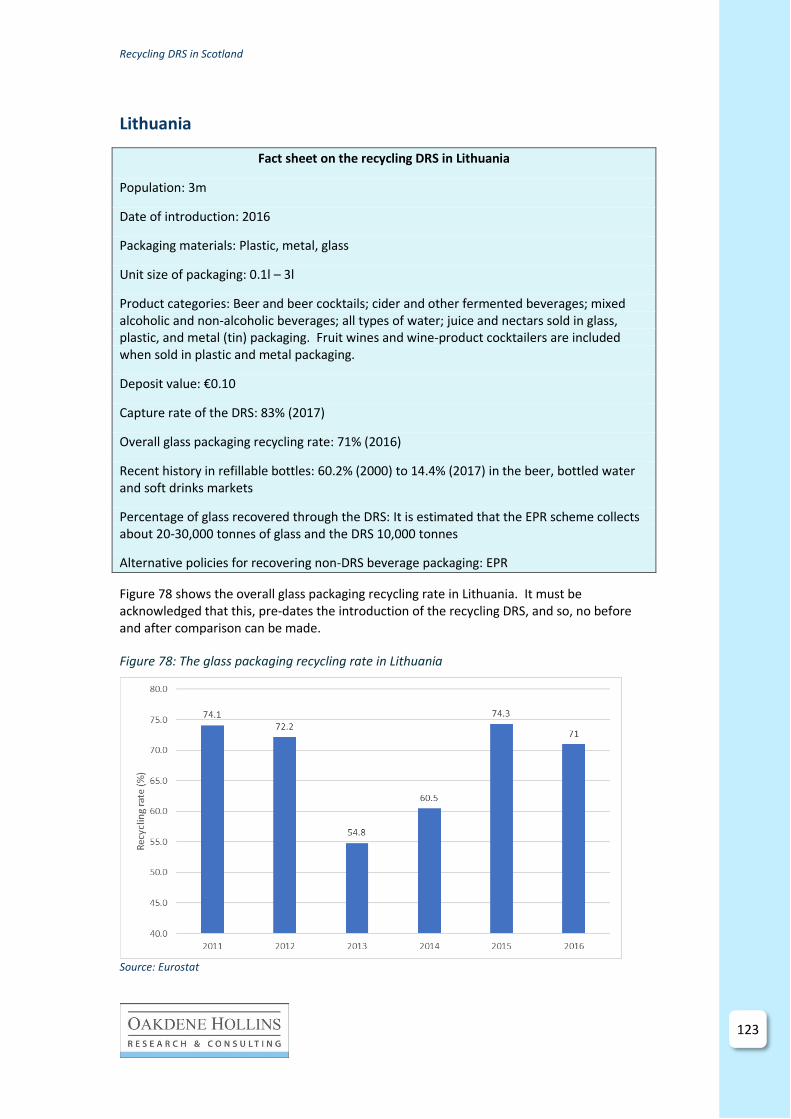
Recycling DRS in Scotland
123
123
123
Lithuania
Fact sheet on the recycling DRS in Lithuania
Population: 3m
Date of introduction: 2016
Packaging materials: Plastic, metal, glass
Unit size of packaging: 0.1l – 3l
Product categories: Beer and beer cocktails; cider and other fermented beverages; mixed alcoholic and non-alcoholic beverages; all types of water; juice and nectars sold in glass, plastic, and metal (tin) packaging. Fruit wines and wine-product cocktailers are included when sold in plastic and metal packaging.
Deposit value: €0.10
Capture rate of the DRS: 83% (2017)
Overall glass packaging recycling rate: 71% (2016)
Recent history in refillable bottles: 60.2% (2000) to 14.4% (2017) in the beer, bottled water and soft drinks markets
Percentage of glass recovered through the DRS: It is estimated that the EPR scheme collects about 20-30,000 tonnes of glass and the DRS 10,000 tonnes
Alternative policies for recovering non-DRS beverage packaging: EPR
Figure 78 shows the overall glass packaging recycling rate in Lithuania. It must be acknowledged that this, pre-dates the introduction of the recycling DRS, and so, no before and after comparison can be made.
Figure 78: The glass packaging recycling rate in Lithuania
Source: Eurostat

Recycling DRS in Scotland
124
Figure 79 shows the steady decline of the refills market since 2005. One-way glass can be seen to have a modest market share.
Figure 79: Lithuania – Unit sales of beer, bottled water and soft drinks
Source: Produced by Oakdene Hollins using data from GlobalData
It is estimated that the EPR scheme collects about 20-30,000 tonnes of glass and the DRS 10,000 tonnes. However, although the EPR Green Dot scheme collects more, it is reported that DRS has a very important part to play in targeting the sort of product groups which people might consume away from home with a high risk that they will be discarded as litter.
In 2017, the option to include all alcoholic beverages was considered and dismissed, noting that this would result in 84% of the glass currently covered by separate collection being transferred to the recycling DRS. This would result in the alternative systems becoming nearly redundant due to inefficiencies and high cost145.
It is reported that the average return rate from the deposit scheme reached 91.9% by the end of 2017, with the material specific recovery rates of 83% for glass, 92% for PET and 93% for cans. The PET recovery rate is considered a success since the recovery rate was only 34% before the implementation of the scheme. However, the increase in recycling rate for glass is less pronounced since the overall glass packaging recycling rate in 2015 was 74.3%, and the recycling rate for the type of beverage containers included in the deposit scheme would likely be higher than this overall recycling figure.
The cost and funding to pay for the overall recycling DRS scheme is split between three income streams (2018):
• Material sales – €6.58 million.
• Unredeemed deposits – €4.05 million
• Industry fee – €13.23 million.
However, the proportion of each income stream depends on the material. For example, for glass, the industry fee will usually be higher due to the lower material value and the fewer unredeemed deposits.146
145 http://www.acrplus.org/images/technical-reports/2019_ACR_Deposit-refund_systems_in_Europe_Report.pdf (ACR+, 2019) 146 Earth Care Ltd. Personal communication 14 August 2018.

Recycling DRS in Scotland
125
125
125
Annex C: Countries that operate a recycling DRS that excludes glass
Netherlands
Fact sheet on the recycling DRS in the Netherlands
Population: 17.07 million.
Date of introduction: 1991.
Packaging materials: PET bottles
Unit size of packaging: above 0.75 litres
Product categories: Soft drinks and water
Deposit value: €0.25
Recent history in refillable bottles: 61.1% (2000) to 33.1% (2017) in the beer, bottled water and soft drinks markets
Percentage of glass recovered through the DRS: 0%
Alternative policies for recovering non-DRS beverage packaging: The Packaging Management Decree foresees that companies that placed packaged goods on the market are legally obliged to contribute to their recycling - through the Packaging Waste Fund
Figure 80 shows the glass packaging recycling rate in the Netherlands. This shows that except for 2012 the glass packaging recycling rate has been one of the highest in Europe. The Netherlands is unique across Europe having a recycling DRS only for large PET containers (above 0.5 litre), proposals to extend this to all PET or to other materials have been debated but, as yet, no changes have been made.
Figure 80: The glass packaging recycling rate in the Netherlands
Source: Eurostat

Recycling DRS in Scotland
126
The ACR+ report states that to tackle the littering issues associated with small bottles, in 2002 producers agreed to reduce the number of bottles and cans in litter by 80% by 2005. Furthermore, in 2018, the government had given the packaging producers until 2021 to boost the recycling of small bottles or face the introduction of a deposit on them. The producers must therefore ensure that 90% of one-way plastic bottles are recycled and that the number of plastic bottles in litter is reduced by 70%-90%. The results of the producers’ efforts will be assessed in autumn 2020.
Figure 81 shows the impact the recycling DRS had on the 150cl PET carbonates market in 2005 with a complete switch from refillable to one-way container. In 1999 the 150cl refillable bottle had a market share in carbonates of 75.4% and the three refillable formats 93.1%. However, in 2018 refillables accounted for just 7%. The consumers used to the refill system would not have seen a significant difference in the return systems used and the infrastructure (RVMs etc) would also have been very similar.
Figure 81: The impact the introduction of the Recycling DRS had on refillable and one-way 150cl PET containers
Source: GlobalData. Adapted by Oakdene Hollins.
Figure 82 shows that glass has retained market share in all product categories between 2006 and 2018 with wine and spirits being the two dominant product categories.
Figure 82: Market share of glass (% of unit sales) by product category in the Netherlands
Source: GlobalData. Adapted by Oakdene Hollins.

Recycling DRS in Scotland
127
127
127
Norway
Fact sheet on the recycling DRS in Norway
Population: 5.258 million
Date of introduction: 1996
Packaging materials: Plastic (PET and HDPE) and cans
Unit size of packaging: All
Product categories: Beer, carbonated beverages, wine, liquor, non-carbonated beverages, fruit and vegetable juices, concentrates, milk products
Deposit value: <0.5l (€0.2) and ≥0.5l (€0.3)
Overall glass packaging recycling rate: 89.4% (closed loop recycling of clear glass = 92%. Remaining 8% is coloured glass which is recycled into other products)
Recent history in refillable bottles: 71.1% in 2000 to 11.8% (2017) in the beer, bottled water and soft drinks markets
Percentage of glass recovered through the DRS: 0%
Alternative policies for recovering non-DRS beverage packaging: EPR (Basic tax and environmental tax)
Figure 83 shows that the glass packaging recycling rate is impressive in Norway with a recycling rate above 85% for the last eight recorded years.
Figure 83: The glass packaging recycling rate in Norway
Source: Eurostat
The recycling DRS in Norway is only applied to PET and cans (The deposit is 2,00 or 3,00 NOK, depending on bottle/can size). There is now only one-way glass bottles in Norway and the

Recycling DRS in Scotland
128
glass containers are collected from bottle banks or bins closer to home147. The glass is comingled with metal containers. Figure 84 shows the growth in non-refillable (one-way) bottles versus refillables with much of the steep changes occurring since 2012.
Figure 84: Sales of beer, soft drinks and bottled water by packaging format in Norway
Source: GlobalData. Adapted by Oakdene Hollins.
Figure 85 shows that despite being excluded from the recycling DRS the trend in the market share of beer in glass is very similar to Denmark and Finland, the two Nordic countries with a recycling DRS, namely a significant reduction in market share. The wine market is again similar to the other Scandinavian countries with ‘paper and board’ having a quite significant market share.
Figure 85: Market share of glass (% of unit sales) by product category in Norway
Source: GlobalData. Adapted by Oakdene Hollins.
147 Vennlig Hilsen. Infinitum. Personal Communication July 2019.

Recycling DRS in Scotland
129
129
129
Table 45 shows that unredeemed deposits (income from DRS) is the main revenue stream from the recycling DRS, accounting for 86.2% of revenue.
Table 45: A breakdown of revenue streams in the Norwegian recycling DRS in 2017.
Revenue (000’s) Revenue (%)
Administration fees €10,254 5.0%
Income from DRS €175,491 86.2%
Sale of material €14,476 7.1%
Other revenue €3,254 1.6%
Total €203,475
Source: Infinitum 2017 annual report148
148 https://issuu.com/infinitum-norway/docs/infinitum_annual_report_2017_pages

Recycling DRS in Scotland
130
Sweden
Fact sheet for the recycling DRS in Sweden
Population: 9.995 million
Date of introduction: 1984 for aluminium cans and 1994 for PET
Packaging materials: Plastic (PET) and metal (aluminium/tinplate)
Unit size of packaging: All
Product categories: All ready-for-consumption beverages including beer, soft drinks, cider, bottles water
Deposit value: Metal (€0.11), Plastic <1l (€0.11) and >1l (€0.22)
Recent history in refillable bottles: 39.9% (2000) to 6.0% (2017) in the beer, bottled water and soft drinks markets
Percentage of glass recovered through the DRS: 0%
Alternative policies for recovering non-DRS beverage packaging: EPR
Figure 86 shows the glass packaging recycling rates in Sweden have been above 88% for the last 10 recorded years
Figure 86: The glass packaging recycling rate in Sweden
Source: Eurostat
Household packaging is mainly collected through a national network of 5,800 bring sites, where clear and coloured glass are collected separately. Only one-third of households have access to ‘close to home’ collection, mainly in apartment buildings, but the plan is to increase this in line with higher recycling targets for 2020 set out by revised legislation in

Recycling DRS in Scotland
131
131
131
2014.149 The bring sites (recycling stations) are primarily financed by producer fees and supplemented with incomes from the sale of secondary raw materials.
Sveriges Bryggerier (The Swedish Brewers Association) reports that the quality of glass recovered by the SGÅ is extremely high due to Sweden’s long experience (since the 1950s) with recycling waste packaging at bring banks.
Figure 87 shows that the market share for glass remained stable between 2006 and 2018. Wine is again like the other Scandinavian countries with ‘paper and board’ having a quite significant market share. Beer & cider showed a growth in share from 15.9% in 2006 to 23.8% in 2018.
Figure 87: Market share of glass (% of unit sales) by product category in Sweden
Source: GlobalData. Adapted by Oakdene Hollins.
Figure 88 shows that the two growth packaging formats in the Swedish beer market are 33cl one-way glass that is not in the recycling DRS and cans that are included in the scheme. This highlights the fact that the inclusion or exclusion of glass does not impact on can sales.
149 PMCA Economic Consulting. A deposit-refund system for Ireland? Experiences from other European countries.
December 2017.

Recycling DRS in Scotland
132
Figure 88: Beer sales in Sweden by packaging type
Source: GlobalData. Adapted by Oakdene Hollins.

Recycling DRS in Scotland
133
133
133
Annex D: Review of current producer responsibility scheme against a critical criteria
Within the Scottish Government’s publications on the proposed recycling DRS for Scotland is a whole host of different policy issues they wish the scheme to address. We have attempted to capture these issues within Table 46 (System criteria) and to review how well the current producer responsibility scheme addresses each issue. We have done this through the use of a RAG (red, amber, green) system. This exercise was also undertaken for the proposed recycling DRS (Annex E) and allows a comparison of the two schemes to be undertaken.
Table 46: A review of the effectiveness of the current PRN scheme against the proposed system criteria (Green = good performance, Amber = medium performance and Red = poor performance)
System criteria Current system Relative
performance of
current system
Ensuring the UK meets its
EU recycling targets Yes, the UK has met all its recycling targets
over the last 20 years
Compliance costs have
been kept to a minimum for
business
Yes, the compliance costs are the lowest
across all Member States. It enables the UK
industry to meet targets by paying only the
added cost of recycling more, rather than the
full cost of managing packaging recycling
and waste
Increased domestic
recycling No, the current system does not differentiate
in terms of prioritising domestic recycling.
Figure 43, Section 6.2.10, shows the heavy
reliance on exporting packaging waste for
reprocessing
Producers pay 100% of
municipal packaging waste
management costs
No, only 7% of the costs of managing
municipal packaging waste are covered by
industry. The management of packaging
waste costs UK local authorities in the region
of £820 million per year150
Motivating product design
(re-use, recycled content,
recyclability, etc)
The system does not sufficiently motivate
product design
Increased quality of
collected materials No, in the case of glass, the very loose use of
the term ‘recycling’ resulted in the
subsidising of the glass to aggregate route at
the expense of the remelt industry
150 https://consult.defra.gov.uk/environmental-quality/consultation-on-reforming-the-uk-packaging-
produce/supporting_documents/packagingeprconsultdoc.pdf (Defra, 2019)

Recycling DRS in Scotland
134
System criteria Current system Relative
performance of
current system
Increased demand amongst
(domestic) reprocessors for
collected materials
No, in Scotland there is limited competition
among competitors for glass
Local Authorities have
received financial support
or direct financial reward
for collection of packaging
waste
No, Local Authorities have received little
support
Local Authorities have
received financial support
or direct financial reward
for disposal of packaging
waste
The current PRN system only covers around
10% of packaging waste disposal costs, with
the remaining 90% funded by the taxpayer.
It is estimated that it costs local authorities
£174 million annually to treat packaging
waste disposed of in the residual waste
stream151
The system addresses the
environmental externality
issue around carbon
emissions
No, the issue of one-third of all glass
‘recycled’ as aggregate in the UK with zero
environmental benefit is a case in point
The system addresses the
environmental externality
issue around littering
No. ZWS have funded about 4,000 new on-
the-go bins in Scotland in recent years, but
this is not linked to the existing scheme151.
The system is transparent,
in terms of how the fees are
currently used
No, currently producers do not know how
their PRN fees are currently used
Significant increase in
investment in recycling
capability, communications
or research and
development
No, there has not been any significant
increase
Reduced confusion over
what can and can’t be
recycled
No. WRAP reported that 34% of
householders in a survey raised confusion
over what can be recycled151
The system has helped UK
reprocessors to operate on a
level playing field
No, there is no significant evidence to
demonstrate this
151 https://consult.defra.gov.uk/environmental-quality/consultation-on-reforming-the-uk-packaging-
produce/supporting_documents/packagingeprconsultdoc.pdf (Defra, 2019)

Recycling DRS in Scotland
135
135
135
System criteria Current system Relative
performance of
current system
Export regulation is
suitably monitored and
enforced
No
The opportunities for fraud
are minimised There are risks of fraud and error in the
system152
Source: Oakdene Hollins
152 https://www.nao.org.uk/wp-content/uploads/2018/07/The-packaging-recycling-obligations.pdf

Recycling DRS in Scotland
136
Annex E: Review of the proposed recycling DRS against critical criteria
This section follows on from that of Annex D, where a review of the current producer responsibility scheme was undertaken against critical criteria (developed from Scottish Government publications on the proposed recycling DRS). Using the same ‘system criteria’ we have attempted to capture the potential performance of the proposed recycling DRS, Table 47. We have done this through the use of a RAG (red, amber, green) system.
Table 47: A review of the effectiveness of the proposed DRS scheme in Scotland against the proposed system criteria (Green = good performance, Amber = medium performance and Red = poor performance)
System criteria Current system Relative
performance
of current
system
Ensuring the UK meets
its EU recycling targets Although the recycling rate of the materials in
the DRS may be high, targeting only a portion of
the material means that there is no direct link
between the recycling rate in the DRS and the
overall material recycling rate
Compliance costs have
been kept to a minimum
for business
Businesses will have to modify packaging
designs to incorporate the DRS label etc.
However, they will not be obligated to incur the
full compliance cost. At a capture rate of 90%,
it is estimated153 that business fees will account
for only 32% of overall revenue (£25.9 million)
Increased domestic
recycling There is no direct link between domestic
recycling and the DRS scheme
Producers pay 100% of
municipal packaging
waste management costs
No, it is reported that at the target 90% capture
rate unredeemed deposits, i.e. consumers not
returning containers will account for 42% of the
system revenue.153 A capture rate below 90%
will result in this figure increasing for
consumers. Furthermore, Local Authorities will
still have to pay for the waste management of
packaging falling outside the recycling DRS
153 https://www.gov.scot/binaries/content/documents/govscot/publications/foi-eir-release/2019/05/foi-19-01048/documents/foi-19-
01048-document1/foi-19-01048-document1/govscot%3Adocument/DRSPB16_03a%2BThe%2BCase%2Bfor%2BGlass%2Breport.pdf (ZWS, 2018)

Recycling DRS in Scotland
137
137
137
System criteria Current system Relative
performance
of current
system
Incentivising product
design (re-use, recycled
content, recyclability,
etc)
The DRS provides no direct incentive. Most of
the containers in the DRS will already be
recyclable since they are monomaterials (PET,
glass, metal). Lightweighting will be an
ongoing initiative undertaken by the producers,
but the driver for this is the reduction in raw
material costs and not the DRS
Increased quality of
collected materials The RVMs include a barcode reader and will
only accept deposit bearing containers
Increased demand
amongst (domestic)
reprocessors for
collected materials
No direct link
Local Authorities have
received financial
support or direct
financial reward for
collection of packaging
waste
TBC
Local Authorities have
received financial
support or direct
financial reward for
disposal of packaging
waste
TBC
The system addresses the
environmental
externality issue around
carbon emissions
Although the quality of the material is fit for
closed loop recycling the DRS does not directly
influence the end fate. For example, in Iceland,
no glass collected via the recycling DRS is
currently recycled154
The system addresses the
environmental
externality issue around
littering
Yes, the deposit should provide consumers with
a financial incentive to not litter or, if the
container is littered, for a third party to pick up
the container and redeem the deposit
154 http://www.acrplus.org/images/technical-reports/2019_ACR_Deposit-refund_systems_in_Europe_Report.pdf (ACR+, 2019)

Recycling DRS in Scotland
138
System criteria Current system Relative
performance
of current
system
The system is
transparent, in terms of
how the fees are
currently used
Having one system administrator will assist in
improving transparency
Significant increase in
investment in recycling
capability,
communications or
research and
development
No direct link
Reduced confusion over
what can and can’t be
recycled
The RVMs include a barcode reader and will
only accept deposit bearing containers.
Consumers will therefore quickly become aware
of what can and cannot be returned
The system has helped
UK reprocessors to
operate on a level
playing field
No direct link
Export regulation is
suitably monitored and
enforced
No direct link
The opportunities for
fraud are minimised The Scottish Government estimates that the
value of fraudulently redeemed containers
would be £74.3 million per year155
Source: Oakdene Hollins
155 https://www.gov.scot/publications/deposit-return-scheme-scotland-full-business-regulatory-impact-assessment/pages/1/

Recycling DRS in Scotland
This page is intentionally blank

Recycling DRS in Scotland
Value-driven consulting
Science-led research
Oakdene Hollins Ltd Ardenham Court Oxford Road Aylesbury Buckinghamshire HP19 8HT +44(0)1296 423915 [email protected] www.oakdenehollins.com www.remancouncil.eu www.eu-ecolabel.uk Registered in England&Wales no: 2937129
About the authors
Peter Lee PhD, Head of Operations
Peter has project-managed and written major studies on resource efficiency, sustainability, carbon reduction and energy, with much of his focus being on the food manufacturing and retail sectors. His specialisms include: waste prevention, waste logistics and reverse supply chains, packaging and waste management in the food and drink industry, environmental impact assessments, and recycling technologies. An expert in Lean techniques, he has worked with manufacturing clients to implement waste prevention.
Tania Garcia MAAT
Tania joined Oakdene Hollins’ Finance team in 2015,and has since gained membership of the Association of Accounting Technicians. Her data analysis skills, and her expertise in graphics and infographics, have been invaluable in the production of this report.
Nia Bell PhD MPhys, Senior Consultant
With a degree in Theoretical Physics and a PhD in Materials Science, Nia’s background is in nanomaterial research at the UCal San Diego and at the NPL, UK. She has a critical and thorough approach to analysing complex technical data sets, and the ability to concisely communicate complex topics. Recent work includes several market studies, in-depth EPR research, and analysis and tracking of UK legislation in the chemicals sector.
Jake Harding BSc, Research Consultant
Jake is our newest consultant who has a background in the sciences and a keen interest in technology, raw materials and the Circular Economy.
His key skills include data processing, critical analysis and problem solving, which have been utilised in the development of outputs, most recently within the area of electronics.
From its offices in Aylesbury and Brussels, Oakdene Hollins provides research and consulting services to clients under three main themes:
• Circular Economy • Sustainable Products • Innovative Technologies & Materials For more information visit oakdenehollins.com