An interesting alternative raw material for a sustainable Portland ...

Resources, Conservation and Recycling 48 (2006) 339–356
Recycling contaminated soil as alternativeraw material in cement facilities:
Life cycle assessment
R. Navia a,∗, B. Rivela b, K.E. Lorber c, R. Mendez b
a Department of Chemical Engineering, University of La Frontera, Casilla 54-D, Temuco, Chileb Department of Chemical Engineering, School of Engineering, University of Santiago
de Compostela, c/Lope de Marzoa s/n, E-15782 Santiago de Compostela, Spainc Department of Sustainable Waste Management and Technology, University of Leoben,
Peter Tunner Strasse 15, A-8700 Leoben, Austria
Received 22 December 2004; accepted 23 January 2006Available online 6 March 2006
Abstract
Volcanic soil can be used to remove metals from wastewaters. Once used, it is disposed in landfills.The utilization of this material in the cement industry as an alternative raw material was evaluated usinglife cycle assessment (LCA) methodology. This possibility has been studied from an environmentalpoint of view in a Chilean cement facility, representative of the current operation state of art, includingboth technical and economic analysis. Two scenarios were compared: Scenario 1, which correspondsto the existing cement production process, and Scenario 2, which represents cement production usingspent volcanic soil. With the exception of the categories of carcinogens (C) and minerals (M), thecomparative results are favourable to Scenario 2, specially regarding to the category of ecotoxicity (E),mainly due to the avoided landfilling emissions of the volcanic soil. When considering the damageassessment, damage to human health (HH), ecosystem quality (EQ) and resources (R) are lowerin Scenario 2. In addition, sensitivity analyses were performed to study the influence of particularparameters (i.e., transport of spent volcanic soil, CO2 emissions from the clinkerization processand heavy metals leaching from the spent volcanic soil) on the results of the assessment. The useof alternative raw materials (in this case, spent volcanic soil), which present the advantage to bewastes from other technical systems, appear to allow the development of cement production in amore sustainable way, slightly improving the economy of the process. The spent volcanic soil can
∗ Corresponding author. Tel.: +56 45 325472; fax: +56 45 325053.E-mail address: [email protected] (R. Navia).
0921-3449/$ – see front matter © 2006 Elsevier B.V. All rights reserved.doi:10.1016/j.resconrec.2006.01.007

340 R. Navia et al. / Resources, Conservation and Recycling 48 (2006) 339–356
be treated with zero cost for the wastewater treatment plant with savings of 0.23D for each tonne ofclinker production. Establishing a sound management way for the spent volcanic soil could fomentits possible use as mineral adsorbent in industrial wastewater treatment facilities.© 2006 Elsevier B.V. All rights reserved.
Keywords: Cement industry; Clinker; Contaminated soil; LCA; Environmental improvement
1. Introduction
During the last decade, there has been an increasing interest in assessing, measuring anddocumenting the environmental performance of industries. The need for tools allowing aproper and objective quantification of environmental issues in companies performance isnowadays unquestionable (Tyteca, 1996). Efforts to achieve a better knowledge on envi-ronmental impacts associated to the products may lead to the compilation of environmentaldata reports to customers.
1.1. The cement production process
Cement is one of the most important construction materials marketed world-wide,both in terms of volumes and capital. The clinker/cement process contains three mainstages: raw materials milling, pyroprocessing (clinkerization) and final milling of theclinker mixed with gypsum and other additive materials for obtaining cement as a finalproduct (Fig. 1). Limestone rock (75–80%) and clays (20–25%) are the main raw mate-rials in the clinker production. Limestone rock supplies the necessary CaCO3, whichis present in limestone rocks, up to 95%. SiO2 (45–65%), Al2O3 (10–15%), Fe2O3(6–12%) and CaO (4–10%) are the main clay components. In addition, depending onthe limestone rock and clay compositions, correction materials could be needed. High-purity limestone, silica and iron-rich clays are the most used materials (Navia et al.,2004a).
The mixture of raw materials is milled to a final particle size of less than 300 �m,obtaining a fine powder called crude or raw meal, which goes through the clinkerizationprocess. In the clinkerization process, the crude is treated thermally in the kiln at bedtemperatures up to 1450 ◦C corresponding to a gas temperature of about 2000 ◦C, obtainingfinally a transformed vitreous material. In this stage, the CaCO3 is thermally decomposedinto CaO and CO2.
The cooling step of the clinker (from 1450 to 200 ◦C) is needed to stop the reactions andpromote the calcium compounds final crystallization. After that, the clinker (80%) is mixedwith gypsum and other additive materials (20%) and milled to produce the final cement. Thedifferent additive materials (e.g. high-purity limestone, puzzolane, siderurgical and glassslag and fly ashes from thermal power stations, among others) can give the final cement therequired character and mechanical properties (Navia et al., 2004a).
The cement consumption per capita and year (kg/cap yr) ranges between values of217 kg/cap yr for a developing economy like Brazil and developed economy values of

R. Navia et al. / Resources, Conservation and Recycling 48 (2006) 339–356 341
Fig. 1. Scheme of cement production.
545 kg/cap yr for Austria and 1051 kg/cap yr for Spain (data of year 2001). In the caseof Chile, the yearly cement consumption in the period 1993–2001 has increased from 218to 234 kg/cap yr and is likely to continue to grow. This growth is directly related with theeconomy growth (internal gross product), which has been continuously increasing in Chilein the last 14 years (ICH-Instituto, 2005). In the year 2005, the total Chilean cement pro-duction reached 4.0 million tonnes, distributed in the three main production companies(ICH-Instituto, 2005).
1.2. Towards a more sustainable cement industry in the world
Over 30 years have passed since the beginning of the systematical waste managementin the clinker and cement industries all over the world. The negative environmental impactfrom cement manufacturing and cement can be minimized in numerous ways, which canbe classified in four categories (Gabel, 2001):
• Substitution of inputs in the process: raw materials, fuels and additives.• Process development: developing and optimizing the existing process.• End of pipe solutions: adding emission reduction systems.• Product development: developing new products or changing cement composition and
performance.
This management has allowed cost reductions in cement production and developed amore sustainable way to reuse important amounts of different types of residues, mainly asalternative fuels.

342 R. Navia et al. / Resources, Conservation and Recycling 48 (2006) 339–356
Table 1Main possible utilization of wastes as raw material and fuel in the cement industry (Navia, 2004)
Waste reuse as Introduction in/as Waste type
Fuel Primary combustion; secondarycombustion; precalcinator;gasification and combustion
Used oil; reffinery/destillation residues;chlorine-free solvents; dried sludge;chlorine-poor plastic residues; woodresidues and sawdust; swarfs; scrap-tires;rubber residues; used paper
Partial crude substitution Milled limestone substitute; claysubstitute; correction materialssubstitute
Foundry sand; ashes; contaminated soil;milled glass slag; clay and silt fromsoil-washing
Additive material Cement mixture previous to milling Fly-ashes; puzzolane; glass slag; driedgypsum sludge; lime sludge
Auxiliary material DENOX reagent Photography wastewaters;ammonia-containing wastewaters
There is no doubt that the emission factors of cement production are lower than yearsago, but up to date significant reductions of the emission factors are mainly caused bythe improvements in technology (Von Bahr et al., 2003). Alternative raw materials, fuelsand cement additives have the advantage to be by-products or wastes from other technicalsystems. More and more different kinds of wastes, such as waste oil, dried sewage sludge,plastic wastes or spent solvents are being used as alternative fuels, but a comprehensiveresearch in raw material alternatives is still lacking (Houillon and Jolliet, 2006; Seyler etal., 2005). In Table 1, the main possible waste utilizations as raw materials and fuels in thecement industry are shown (Navia, 2004).
1.3. Selection of alternative raw material
Volcanic soils have demonstrated a great capacity to adsorb phenolic compounds andcolor from bleached Kraft mill effluents (Navia et al., 2003), as well as chlorophenols (Naviaet al., 2004b) and heavy metals (Navia et al., 2004c) from contaminated water streams. Inthe case of Southern Chile, allophane is the main component of the clay fraction of thesevolcanic soils (Andisols) and it is considered a non-crystalline hydrous aluminosilicate,characterized by a short-range ordered nature and by the presence of Si–O–Al bonds. Itsmain physicochemical properties are an elevated specific surface between 310 and 672 m2/gand its capacity to develop a pH-variable charge (Mora and Canales, 1995). No industrial useof this volcanic soil as a natural adsorbent has been performed yet; nevertheless, establishinga sustainable management option for the spent volcanic soil could foment the use of thismineral adsorption material. The main possible uses of this volcanic soil are in the pulpand paper, textile and tanning industry effluents treatment, as well as in landfill leachatedepuration.
Previous studies showed that considerable environmental and monetary benefits resultfrom using municipal and industrial wastes as energy and material resources (Boughtonand Horvath, in press; Greer, 1992; Van Oss and Padovani, 2003). Regarding contaminatedsoil use in the cement industry, a soil with a high content of CaCO3 will be useful as milledlimestone substitute. Moreover, a soil with a high SiO2, Al2O3, Fe2O3 and CaO content will

R. Navia et al. / Resources, Conservation and Recycling 48 (2006) 339–356 343
be very useful as clay substitute or as correction material. In addition, a contaminated soilcould be also useful as additive material, depending on its composition. Due to its nature,the utilization of heavy metals contaminated volcanic soil in the cement industry could beof great interest looking for a sustainable waste management route. In fact, recent researchindicates that the heavy metals present in wastes and alternative fuels used in clinker kilnsare incorporated into the clinker crystalline phases (Andrade et al., 2003; Ract et al., 2003).
1.4. Life cycle assessment
Life cycle assessment (LCA) has been proved to be a tool with the potential for industrialprocess improvement, used to avoid sub-optimization in the development of more environ-mental adapted cement and concrete products and manufacturing processes (Boughton andHorvath, in press; Gabel et al., 2004; Lee and Park, 2004; Lundstrom, 1997). In addi-tion, LCA has been extensively applied to evaluate several techniques of contaminated soilremediation (Toffoletto et al., 2005; Volkwein et al., 1999).
LCA is compiled of several interrelated components: goal definition and scope, inventoryanalysis, impact assessment and interpretation (ISO 14040, 1997), which are detailed inSection 2.
2. Methodology
2.1. Mass balance in a Chilean cement facility
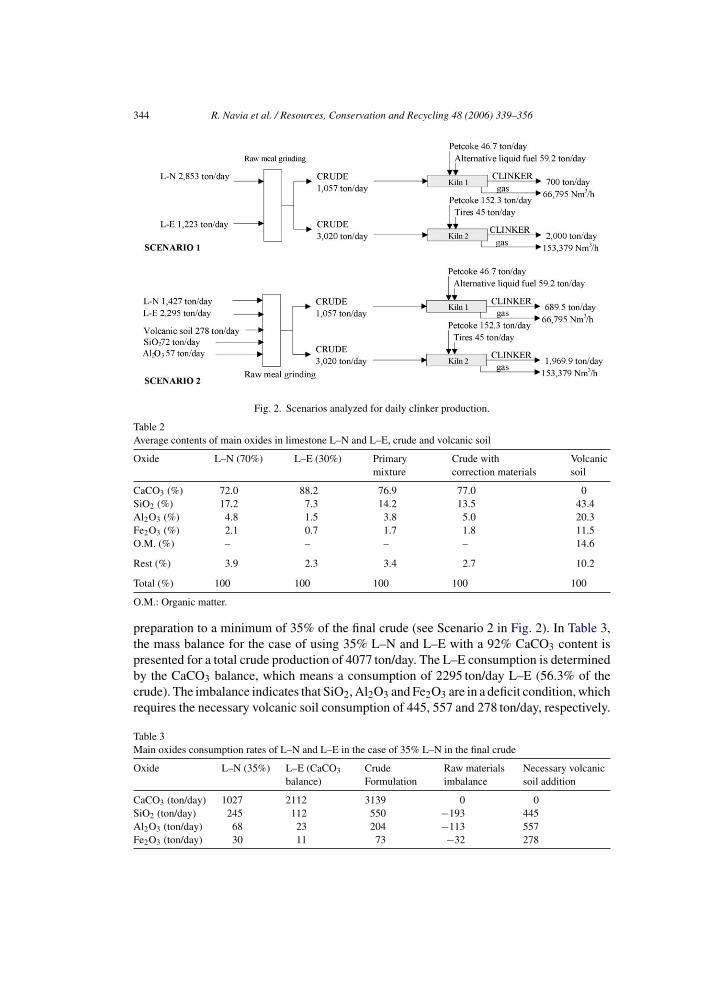
A Chilean cement facility with a 1,300,000 ton/yr cement production was selected asrepresentative of the current operation state of art. The plant has ISO 14001 certificationand burns normally pet-coke in the clinker units (rotary kilns 1 and 2). The plant currentlyreplaces the pet-coke by alternative liquid fuels (up to 50%) in the rotary kiln 1 and byscrap-rubber tires (up to 20% of the required energy) in the rotary kiln 2 (see Scenario 1 inFig. 2).
The cement plant uses two types of limestone for its crude formulation:
• L–N, from a mine located 15 km away from the cement facility.• L–E, from different mines located in average 20 km away from the cement facility.
The normal limestone consumption is 70% of L–N and 30% of L–E. The rest of the crudecomponents are mainly MgO, K2O, Na2O, SO3 and H2O. The main imbalance producedunder these conditions is by the Al2O3 content in the primary mixture; thus, clay andcorrection materials rich in Al2O3 are often required (Table 2). The total crude productionprevious to the clinkerization process at the plant is about 4077 ton/day. 25.9% of the crudeis processed in kiln 1, while the remaining 74.1% is processed in kiln 2.
For a possible use of the contaminated volcanic soil as an additive in crude mixing, ahigher level of CaCO3 in the primary mixture has to be achieved. For this, a 92% CaCO3content in the L–E seems to be a reasonable value, considering the average CaCO3 con-centration in all limestone mines located in average 20 km far away from the cement plant.Moreover, the cement facility would decrease its L–N consumption level for the crude
344 R. Navia et al. / Resources, Conservation and Recycling 48 (2006) 339–356
Fig. 2. Scenarios analyzed for daily clinker production.
Table 2Average contents of main oxides in limestone L–N and L–E, crude and volcanic soil
Oxide L–N (70%) L–E (30%) Primarymixture
Crude withcorrection materials
Volcanicsoil
CaCO3 (%) 72.0 88.2 76.9 77.0 0SiO2 (%) 17.2 7.3 14.2 13.5 43.4Al2O3 (%) 4.8 1.5 3.8 5.0 20.3Fe2O3 (%) 2.1 0.7 1.7 1.8 11.5O.M. (%) – – – – 14.6
Rest (%) 3.9 2.3 3.4 2.7 10.2
Total (%) 100 100 100 100 100
O.M.: Organic matter.
preparation to a minimum of 35% of the final crude (see Scenario 2 in Fig. 2). In Table 3,the mass balance for the case of using 35% L–N and L–E with a 92% CaCO3 content ispresented for a total crude production of 4077 ton/day. The L–E consumption is determinedby the CaCO3 balance, which means a consumption of 2295 ton/day L–E (56.3% of thecrude). The imbalance indicates that SiO2, Al2O3 and Fe2O3 are in a deficit condition, whichrequires the necessary volcanic soil consumption of 445, 557 and 278 ton/day, respectively.
Table 3Main oxides consumption rates of L–N and L–E in the case of 35% L–N in the final crude
Oxide L–N (35%) L–E (CaCO3
balance)CrudeFormulation
Raw materialsimbalance
Necessary volcanicsoil addition
CaCO3 (ton/day) 1027 2112 3139 0 0SiO2 (ton/day) 245 112 550 −193 445Al2O3 (ton/day) 68 23 204 −113 557Fe2O3 (ton/day) 30 11 73 −32 278
R. Navia et al. / Resources, Conservation and Recycling 48 (2006) 339–356 345
As the crude composition is based on a standard formulation, the maximum volcanic soilto be used in the cement facility under these conditions will be 278 ton/day, closing theFe2O3 balance and supplying 121 ton/day of SiO2 and 56 ton/day of Al2O3. To close theimbalance, for SiO2 and Al2O3 also, clay and correction materials are needed to providethe required SiO2 and Al2O3 (72 and 57 ton/day, respectively).
2.2. Life cycle assessment
2.2.1. Goal and scope2.2.1.1. Purpose. The goals of this study were to assess and compare the environmentalimpacts in a product scenario using a LCA approach. The LCA of two main scenarios wasperformed from a ‘gate-to-gate’ perspective. Fig. 2 shows the flow diagram of the scenariosanalyzed:
• Scenario 1: clinker production with conventional raw materials (current operation of theplant).
• Scenario 2: recycling of contaminated soil to substitute traditional raw materials in theclinker production.
The main objectives considered were the identification and quantification of the mostimportant environmental burdens related to the alternatives under analysis as a basis toimprove the environmental performance of cement industry.
2.2.1.2. Functional unit. This unit provides a reference to which the inputs and outputsare related (ISO 14040, 1997). The functional unit selected was the production of 1 ton ofclinker.
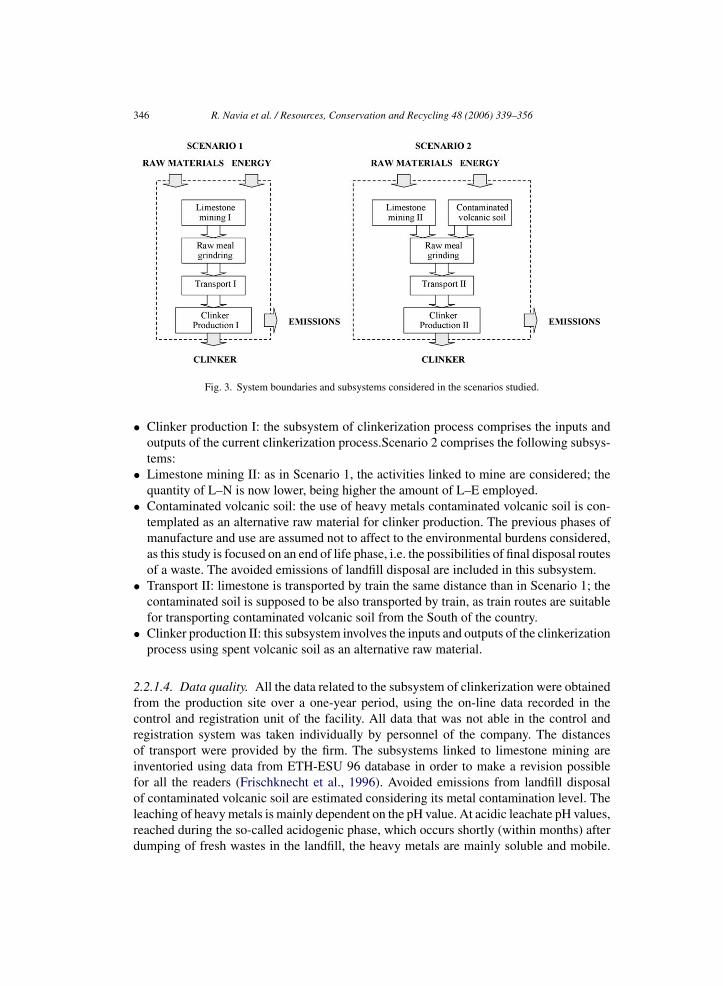
2.2.1.3. System boundaries. This term is defined as the interface between the productsystem and the environment or other product systems (ISO 14040, 1997). Deciding whichprocesses can be excluded from the system boundary (cut off criteria) is a complex matter.Different methods are used in practice for compiling the life cycle inventory (LCI) (Raynoldset al., 2000a; Raynolds et al., 2000b; Suh et al., 2004). Depending on data availability, aprocess analysis or an economic input–output approach can be considered to define thesubsystems under study. In the present work, a process analysis was applied to identifythe subsystems analyzed. Fig. 3 illustrates the subsystems under study, which are furtherdescribed in this section. Environmental burdens from infrastructures as well as the burdenslinked to the preparation of fuels used in the kilns and the activities of raw meal grindingare not taken into account, in accordance with the principle of excluding identical activitiesfor comparative assessments (Consoli, 1993).
Scenario 1 includes the following subsystems:
• Limestone mining I: the energy consumption of mining and internal transport in theexcavation is computed for the two types of limestones (L–N and L–E).
• Transport I: limestone has to be triturated and transported for further processing. Thetwo different types of limestone are transported by train, 15 km in the case of L–N and20 km in average in the case of L–E.
346 R. Navia et al. / Resources, Conservation and Recycling 48 (2006) 339–356
Fig. 3. System boundaries and subsystems considered in the scenarios studied.
• Clinker production I: the subsystem of clinkerization process comprises the inputs andoutputs of the current clinkerization process.Scenario 2 comprises the following subsys-tems:
• Limestone mining II: as in Scenario 1, the activities linked to mine are considered; thequantity of L–N is now lower, being higher the amount of L–E employed.
• Contaminated volcanic soil: the use of heavy metals contaminated volcanic soil is con-templated as an alternative raw material for clinker production. The previous phases ofmanufacture and use are assumed not to affect to the environmental burdens considered,as this study is focused on an end of life phase, i.e. the possibilities of final disposal routesof a waste. The avoided emissions of landfill disposal are included in this subsystem.
• Transport II: limestone is transported by train the same distance than in Scenario 1; thecontaminated soil is supposed to be also transported by train, as train routes are suitablefor transporting contaminated volcanic soil from the South of the country.
• Clinker production II: this subsystem involves the inputs and outputs of the clinkerizationprocess using spent volcanic soil as an alternative raw material.
2.2.1.4. Data quality. All the data related to the subsystem of clinkerization were obtainedfrom the production site over a one-year period, using the on-line data recorded in thecontrol and registration unit of the facility. All data that was not able in the control andregistration system was taken individually by personnel of the company. The distancesof transport were provided by the firm. The subsystems linked to limestone mining areinventoried using data from ETH-ESU 96 database in order to make a revision possiblefor all the readers (Frischknecht et al., 1996). Avoided emissions from landfill disposalof contaminated volcanic soil are estimated considering its metal contamination level. Theleaching of heavy metals is mainly dependent on the pH value. At acidic leachate pH values,reached during the so-called acidogenic phase, which occurs shortly (within months) afterdumping of fresh wastes in the landfill, the heavy metals are mainly soluble and mobile.
R. Navia et al. / Resources, Conservation and Recycling 48 (2006) 339–356 347
On the other hand, during the so-called landfill methanogenic phase (years), the leachatepH values are in the neutral to slightly alkaline region (around pH 7.5), and the heavymetals are less mobile and tend to precipitate. For metal emissions, the total leaching wassupposed to be on average 30% of metal content of volcanic soil. This assumption is basedon data reported by Navia et al. (2005), in which heavy metals leaching from volcanic soilappear mainly dependant on pH and complexation processes in soil. However, the variabilitybetween 0% and 100% of metal content in soil was further assessed. The biogas generatedwas calculated using the Tabasaran and Rettenberger prediction model (Rettenberger andTabasaran, 1982), considering an average temperature of 33 ◦C in the landfill. The biogas isconsidered to be released to atmosphere, as landfill gas collection is not the most-commonmanagement of Chilean landfills.
2.2.1.5. Sensitivity analysis. A sensitivity analysis can be used to study the influence ofparticular hypothesis and figures on the results of the assessment. To estimate the variabilityof the results obtained, the influence of the main assumptions has been considered:
• Influence of the transport of contaminated soil.• Influence of the CO2 emissions from the clinkerization process.• Influence of the estimated metals leaching.
2.2.2. Life cycle inventoryLife cycle inventory (LCI) analysis involves data collection and calculation procedures to
quantify relevant inputs and outputs of a product system, including the use of resources andreleases to air, water and land associated with the system (ISO 14040, 1997). New materialsand fuels lead to new combinations and concentrations of organic and inorganic compoundsin the clinker production system. The qualitative and quantitative data for inclusion inthe inventory have been collected for each process unit that is included within the systemboundaries. Data sources used in this work were explained in the sub-section of data quality.They will be detailed in Section 3.
2.2.3. Impact assessmentImpact assessment is a technical, quantitative and/or qualitative process to characterize
and assess the effects of the environmental burdens identified in the inventory (Consoli,1993). Damage oriented impact assessment methodology has received attention in recentyears (Erlandsson and Lindfors, 2003; Goedkoop and Spriensma, 2000; Hertwich andHammitt, 2001; Seppala and Hamalainen, 2001). This approach provides not only charac-terization (potential impacts of impact categories such as climate change), but also damageassessment for safeguard subjects such as human health (Goedkoop et al., 1998). This impactassessment was performed with the Ecoindicator 99 methodology (hierarchist perspective),which reflects the state of art in LCA (Itsubo, 2002; Rivela et al., 2004; Rivela et al., 2005).
2.2.4. InterpretationThe interpretation phase may involve the iterative process of reviewing and revising
the scope of the LCA, as well as the nature and quality of the data collected consistentwith the defined goal. The findings of the interpretation phase should reflect the results of

348 R. Navia et al. / Resources, Conservation and Recycling 48 (2006) 339–356
Table 4Selected parameters of inventory data for 1 ton of clinker production in Scenario 1
Inputs from technosphere
Materials (kg)L–N 1056.67L–E 452.96Total 1509.63
Transport (t km)Train L–N 15.85Train L–E 9.06
Energy (kJ)Pet coke 2.39 × 10⁶
Auxiliary liquid fuel 8.98 × 10⁵
Tires 5.42 × 10⁵
Outputs
To technosphereProducts and co-products (kg)
Clinker 1000To environment
Emissions to air (kg)Chromium kiln 1 2.36 × 10⁻³
Chromium kiln 2 2.36 × 10⁻³
Lead kiln 1 1.69 × 10⁻³
Lead kiln 2 2.91 × 10⁻³
Zinc kiln 1 5.11 × 10⁻³
Zinc kiln 2 3.85 × 10⁻²
Carbon dioxide kiln 1 20.61Carbon dioxide kiln 2 16.56
any sensitivity analysis that is performed. Though subsequent decisions and actions mayincorporate environmental implications identified in the findings of the interpretation, theylie beyond the scope of the LCA study, since other factors such as technical performance,economic and social aspects are also considered.
3. Results and discussion
3.1. Life cycle inventory
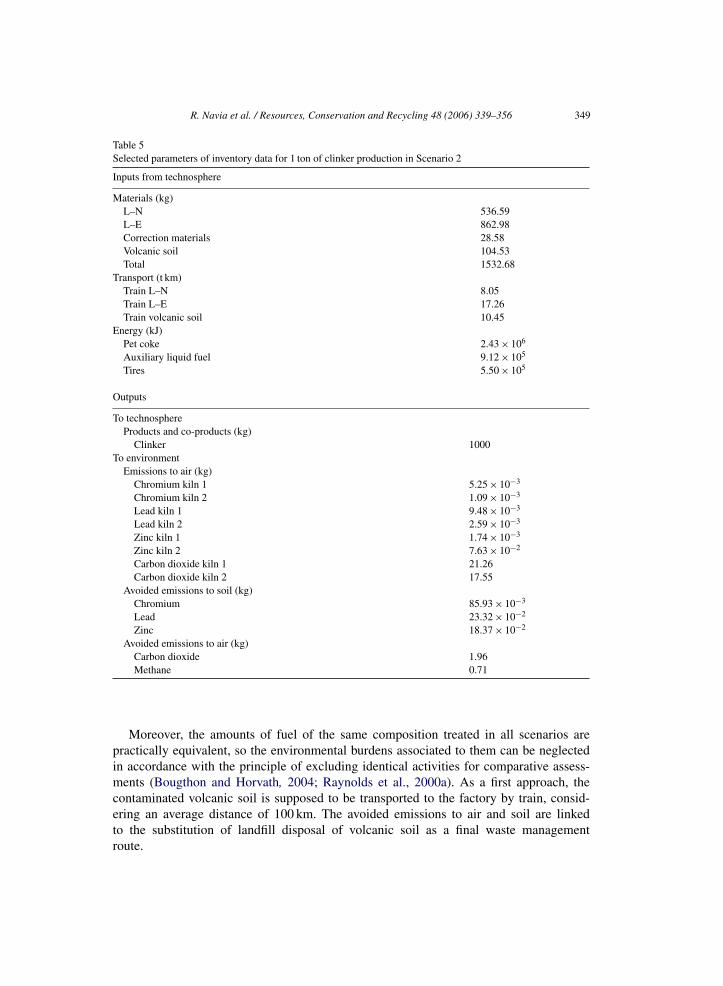
The inventory data of 1 ton of clinker processing in both scenarios are summarized inTables 4 and 5. It is remarkable that there is an overall reduction of 110 kg in the consumptionof limestone per ton of clinker produced, due to the higher CaCO3 content in the used L–Elimestone.
The emissions to air from the clinker production system largely depend on the designof the system and the nature and composition of raw materials and fuels (Gabel, 2001).Emissions of metals and carbon dioxide are detailed for each kiln of the plant. For a detaileddescription see Navia (2004).
R. Navia et al. / Resources, Conservation and Recycling 48 (2006) 339–356 349
Table 5Selected parameters of inventory data for 1 ton of clinker production in Scenario 2
Inputs from technosphere
Materials (kg)L–N 536.59L–E 862.98Correction materials 28.58Volcanic soil 104.53Total 1532.68
Transport (t km)Train L–N 8.05Train L–E 17.26Train volcanic soil 10.45
Energy (kJ)Pet coke 2.43 × 10⁶
Auxiliary liquid fuel 9.12 × 10⁵
Tires 5.50 × 10⁵
Outputs
To technosphereProducts and co-products (kg)
Clinker 1000To environment
Emissions to air (kg)Chromium kiln 1 5.25 × 10⁻³
Chromium kiln 2 1.09 × 10⁻³
Lead kiln 1 9.48 × 10⁻³
Lead kiln 2 2.59 × 10⁻³
Zinc kiln 1 1.74 × 10⁻³
Zinc kiln 2 7.63 × 10⁻²
Carbon dioxide kiln 1 21.26Carbon dioxide kiln 2 17.55
Avoided emissions to soil (kg)Chromium 85.93 × 10⁻³
Lead 23.32 × 10⁻²
Zinc 18.37 × 10⁻²
Avoided emissions to air (kg)Carbon dioxide 1.96Methane 0.71
Moreover, the amounts of fuel of the same composition treated in all scenarios arepractically equivalent, so the environmental burdens associated to them can be neglectedin accordance with the principle of excluding identical activities for comparative assess-ments (Bougthon and Horvath, 2004; Raynolds et al., 2000a). As a first approach, thecontaminated volcanic soil is supposed to be transported to the factory by train, consid-ering an average distance of 100 km. The avoided emissions to air and soil are linkedto the substitution of landfill disposal of volcanic soil as a final waste managementroute.

350 R. Navia et al. / Resources, Conservation and Recycling 48 (2006) 339–356
3.2. Scenario 1 versus scenario 2
The analysis of the contribution of the different subsystems to the impact categories isrequired to detect the “hot spots”. According to the accepted LCA protocol of Ecoindicator99, a systematic procedure for classifying and characterizing the types of environmentaleffects of each element was followed and potential environmental impacts were assessed(Rivela et al., 2004).
Fig. 4 shows the environmental fingerprint of both Scenario 1 and 2. The diagram allowscomparing the environmental burdens of both scenarios. For each category, a characteriza-tion value was obtained and the value 1 is assigned to the least favourable alternative in thecategory in question; the characterization result for each category of the option favourableis divided by the factor corresponding to the other one, so it is easily identified how morefavourable or unfavourable they are. It is remarkable that a negative value was obtained inthe category of ecotoxicity (E) for Scenario 2 (as a result of the avoided emissions); a valueof zero was assigned in the figure to illustrate this fact. The comparable activities in bothoptions turn into very similar values in five of the categories analyzed; with the exceptionof the categories of carcinogens (C) and minerals (M), which are related with the emissionsto air from the kilns and transport, respectively, the comparative results are favourable toScenario 2.
The damage assessment as the computation of all the individual contributions of thecategories was also considered. Damage to human health (HH) is related to the categoriesof carcinogens, respiratory organics, respiratory inorganics, climate change, radiation and
Fig. 4. Environmental fingerprint of Scenario 1 vs. Scenario 2. C: carcinogens; RO: respiratory organics;RI: respiratory inorganics; CC: climate change; R: radiation; OL: ozone layer; E: ecotoxicity; A/E: acidifica-tion/eutrophication; LU: land use; M: minerals; FF: fossil fuels. Symbols: (�) Scenario 1; (�) Scenario 2.
R. Navia et al. / Resources, Conservation and Recycling 48 (2006) 339–356 351
ozone layer; damage to ecosystem quality (EQ) is associated to the categories of ecotox-icity, acidification/eutrophication and land use and damage to resources (R) is related tothe categories of minerals and fossil. The damage to HH is slightly higher in Scenario 1(1.62 × 10⁻⁵ disability life years or DALY in Scenario 1 and 1.30 × 10⁻⁵ DALY in Sce-nario 2). The damage to EQ, expressed in potentially disappeared fraction (PDF) of speciesdue to an environmental impact, multiplied by the area size and the time period (m2 andyear), is favourable to Scenario 2 (158 PDF m2 yr for Scenario 1 against a negative valueof −4.87 × 10⁻² PDF m2 yr for Scenario 2, caused by the avoided emissions). On the otherhand, Scenario 1 presents the largest contribution of damage to R, expressed as the surplusenergy for the future mining of the resources (14.7 MJ surplus in Scenario 1 and 13.9 MJsurplus in Scenario 2).
When analysing the contribution to damage of the different subsystems, it is observedthat the subsystem of Limestone mining I presents the largest contribution to both damageto HH and R (85% and 88%, respectively) in Scenario 1, whereas, damage to EQ is mainlycaused by the subsystem of Clinker production I. Regarding Scenario 2, the distributionof damage between subsystems is similar to Scenario 1 when considering damage to HHand R, but the avoided emissions involved in subsystem contaminated volcanic soil lead toa different profile in damage to EQ (negative value resulting from the contribution of thissubsystem).
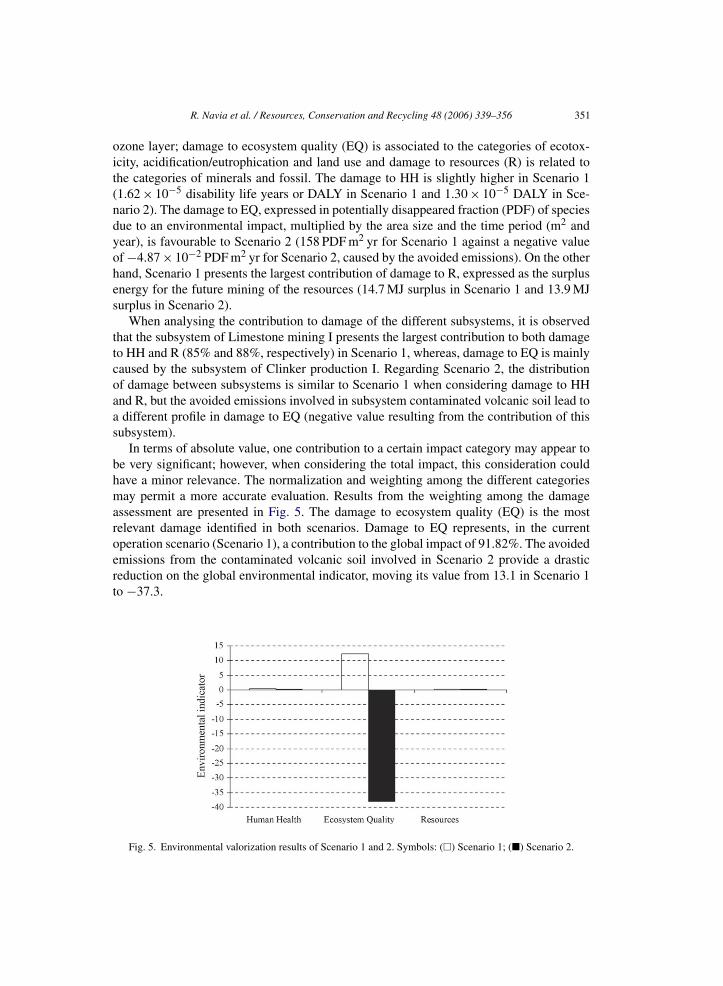
In terms of absolute value, one contribution to a certain impact category may appear tobe very significant; however, when considering the total impact, this consideration couldhave a minor relevance. The normalization and weighting among the different categoriesmay permit a more accurate evaluation. Results from the weighting among the damageassessment are presented in Fig. 5. The damage to ecosystem quality (EQ) is the mostrelevant damage identified in both scenarios. Damage to EQ represents, in the currentoperation scenario (Scenario 1), a contribution to the global impact of 91.82%. The avoidedemissions from the contaminated volcanic soil involved in Scenario 2 provide a drasticreduction on the global environmental indicator, moving its value from 13.1 in Scenario 1to −37.3.
Fig. 5. Environmental valorization results of Scenario 1 and 2. Symbols: (�) Scenario 1; (�) Scenario 2.

352 R. Navia et al. / Resources, Conservation and Recycling 48 (2006) 339–356
An objective judgment about the sustainability of the use of contaminated soil couldnot be achieved without qualitative considerations. In order to discuss the obstacles andlimitations of this work, a sensitive analysis was carried out to assess the influence of themain assumptions considered.
3.3. Influence of the transport of contaminated soil
The transport of contaminated soil in Scenario 2 was supposed to be by train an averagedistance of 100 km, assuming that sources of contaminated soil will be in the Southern regionof Chile. A sensitivity analysis was carried out considering a range from zero to 500 km;the possibility of using a lorry instead train for transport purposes was also evaluated.Fig. 6 shows the variation of the environmental indicators with the distance. Obviously,the environmental impact increases as the distance increases, being slightly higher if thetransport is made by lorry (Fig. 6b), but the differences in the global environmental impactare not relevant (the worst case, transport by lorry 500 km means a worsening of 2.38%).
3.4. Influence of CO2 emissions estimated
Emissions of carbon dioxide from the kilns can vary with operational conditions. Theinfluence of this fact was evaluated in both scenarios. Considering the maximum emission
Fig. 6. Influence of the contaminated soil transport: Variation of environmental indicators with the distance; (a)transport by train; (b) transport by lorry. Symbols: (�) indicator of human health; (�) indicator of ecosystemquality; (�) indicator of resources.

R. Navia et al. / Resources, Conservation and Recycling 48 (2006) 339–356 353
in Scenario 1 (98.03 kg CO2 per ton of clinker produced), there is a minor variation in thecategory of climate change (an increase in the characterization factor from as 1.01 × 10⁻⁵
to 2.29 × 10⁻⁵ DALY), as well as there is no significant effect in the other categories.Regarding the modelled damage, only the final indicator of HH increases, with an overallvariation in the environmental indicator of 3%. As far as Scenario 2 is of concern, the sametendency is observed; with a global worsening of 0.9%.
3.5. Influence of estimated heavy metals leaching in landfill
The pH dependence of heavy metals leaching in landfills does not allow establishing anaccurate percentage of metal amounts released from the volcanic soil. As a first approach, a30% of metal release was considered, but a sensitive analysis was carried out to evaluate allthe possible leaching conditions. A heavy metals leaching range between 0% and 100% wasassessed and the correspondent variation of the environmental indicators with the metalsleaching percentage was established for Scenario 2 (Fig. 7). It is observed that there is nosignificant variation for HH and R indicators, but there is a major effect on the EQ indicator.The EQ indicator for Scenario 1 has been drawn in the figure to visualize the relative impactof Scenario 2. It is remarkable that for a heavy metals leaching higher than 8.8%, the globalimpact is favourable to Scenario 2. Moreover, considering a 14.0% of metals leaching, theEQ damage indicator becomes equal zero (which can be considered an improvement degreeof 100%). The worst case analyzed (100% leaching of metal content of volcanic soil) leadsto an EQ indicator value of −205.6, which means a major enhancement in the environmentalperformance of the system.
3.6. Preliminarily costs analysis
A sustainable cement process should be socially acceptable and cost-effective. SinceLCA only includes environmental aspects, it needs to be complemented with the evaluationof the costs associated to the implementation of the improvement actions (Lundin andMorrison, 2002). The action costs estimated in this analysis were restricted to internaldirect costs. Fixed assets are not necessary to be acquired and there is not additional energy
Fig. 7. Influence of estimated heavy metals leaching in landfill. Symbols: (�) indicator of human health; (�)indicator of ecosystem quality; (�) indicator of resources.

354 R. Navia et al. / Resources, Conservation and Recycling 48 (2006) 339–356
Fig. 8. Total cost variation in 1 ton of clinker production in relation with volcanic soil costs.
consumption in Scenario 2; differences between both scenarios in transport and limestoneconsumption have a minor effect on the total cost of the process. The use of volcanic soil as analternative raw material can enhance the economy of the process. Fig. 8 shows the variationof total cost in clinker production (D /ton) with the cost of the volcanic soil. Negative costscorrespond to a hypothetic situation where the cement company charges for the volcanic soilmanagement. In practice, the producer of spent volcanic soil would pay for the managementof the waste; when considering the management of a waste from wastewater treatment, thecost can be up to 100 D /ton. It is remarkable that the spent volcanic soil can be treated withzero cost for the wastewater treatment plant with savings of 0.23D for each ton of clinkerproduction.
Further research must be done to demonstrate improved environmental performance andeconomy of process innovations.
4. Conclusions
Alternative raw materials in the cement industry like spent volcanic soil, which presentthe advantage to be by-products or waste from other technical systems, appear to allowthe development of cement production in a more sustainable way. An overall reduction of110 kg in the consumption of limestone per ton of clinker produced, due to the higher CaCO3content in the used L–E limestone was achieved for Scenario 2. In addition, a negative valuewas obtained in the category of Ecotoxicity (E) for Scenario 2, as a result of the avoidedemissions. The comparable activities in both scenarios turn into very similar values in fiveof the categories analyzed; with the exception of the categories of carcinogens (C) andminerals (M), which are related with the emissions to air from the kilns and transport,respectively, the comparative results are favourable to Scenario 2.
The accomplishment of cleaner technologies in the cement industry depends on a demon-strated reduction of the emission loads with quantifiable economical benefits referred toproduct quality improvement, material or cost reduction. The option proposed, whichpresent ease of application, provides not only a reduction of the global environmentalimpacts, but also a reduction of costs, which makes it more viable.

R. Navia et al. / Resources, Conservation and Recycling 48 (2006) 339–356 355
Acknowledgement
This work was funded by the Austria–Spain integrated action (Project Ref: HY 2002-2004).
References
Andrade FRD, Maringolo V, Kihara Y. Incorporation of V, Zn and Pb into the crystalline phases of Portland clinker.Cement Concr Res 2003;33:63–71.
Bougthon B, Horvath A. Environmental assessment of used oil management methods. Environ Sci Technol2004;38:353–8.
Boughton B, Horvath A. Environmental assessment of shredder residue management. Resource Conserv Recycl,in press.
Consoli F. Guidelines for life cycle assessment: a code of practice. Sesimbra: SETAC; 1993.Erlandsson M, Lindfors L. On the possibilities to apply the result from an lca disclosed to public. Int J Life Cycle
Ass 2003;8(2):65–73.Frischknecht R, Bollens U, Bosshart S, Ciot M, Ciseri L, Doka G, Dones R, Gantner U, Hischier R, Mar-
tin A. Oko-inventare von Energiesystemen. Bundesamt fur Energie, Bern; 1996. Accessed at http://www.energieforschung.ch.
Gabel K. Cement manufacturing-process and material technology and related environmental aspects. Gothenburg,Sweden: Environmental Systems Analysis, Chalmers University of Technology; 2001.
Gabel K, Forsberg P, Tillman AM. The design and building of a life cycle-based process model for simulatingenvironmental performance, product performance and cost in cement manufacturing. J Clean Prod 2004;12:77–93.
Goedkoop M, Hofsteletter P, Muller-Wenk R, Spriemsma R. The eco-indicator 98 explained. Int J Life Cycle Ass1998;3(6):352–60.
Goedkoop M, Spriensma R. The eco-indicator 99—a damage oriented method for life cycle impact assessment.Methodology report, Pre Consultants B.V., 2000.
Greer W. Air pollution engineering manual air and waste management association. New York, NY: Van NostrandReinhold; 1992.
Hertwich EG, Hammitt J. A decision-analytic framework for impact assessment, Part 2: midpoints, endpoints, andcriteria for method development. Int J Life Cycle Ass 2001;6(5):265–72.
Houillon G, Jolliet O. Life cycle assessment of processes for the treatment of wastewater urban sludge: energyand global warming analysis. J Clean Prod 2006;13(3):287–99.
ICH-Instituto, del Cemento y del Hormigon de Chile, 2005; http://www.ich.cl.ISS 14040. Environmental management – life cycle assessment – principles and framework. Geneva, Switzerland:
International Organization for Standardization; 1997.Itsubo N. Impact assessment based on the damage of safeguard subjects: indicators and methodology for human
health—workshop report. Int J Life Cycle Ass 2002;7(3):178.Lee K-M, Park P-J. Estimation of the environmental credit for the recycling of granulated blast furnace slag based
on LCA. Resource Conserv Recycl 2004;44:139–51.Lundin M, Morrison GM. A life cycle assessment based procedure for development of environmental sustainability
indicators for urban water systems. Urban Water 2002;4:145–52.Lundstrom K. Miljoanpassad betong—Slutrapport. Stockholm, Sweden: Finncement AB; 1997 (in Swedish).Mora ML, Canales J. Interactions of humic substances with allophanic compounds. Commun Soil Sci Plan Anal
1995;26(17/18):2805–17.Navia R. Environmental use of volcanic soil as natural adsorption material. Ph.D. Thesis. Department of Sustainable
Waste Management and Technology, University of Leoben, Austria, 2004.Navia R, Bezama A, Lorber KE, Valenzuela R, Reyes C. Contaminated soil as an alternative raw material in
Chilean cement production facilities. In: Abfall-und Deponietechnik Altlasten, Abfallwirtschaft Lorber, et al.,editors. Depotech 2004. Essen, Deutschland: Verlag Gluckauf; 2004a, ISBN 3-7739-5993-1 p. 733–6.

356 R. Navia et al. / Resources, Conservation and Recycling 48 (2006) 339–356
Navia R, Fuentes B, Bezama A, Lorber KE, Diez MC. The use of volcanic soil as a sanitary landfill liner and itscapacity to retain some specific heavy metals. In: Proceedings of the ISWA world environment congress andexhibition; 2004c.
Navia R, Fuentes B, Lorber KE, Diez MC. The use of volcanic soil as mineral landfill liner. III. Heavy metalsretention capacity. Waste Manage Res 2005;23:260–9.
Navia R, Lorber KE, Gallardo F, Mora ML, Diez MC. The capacity of volcanic soil to adsorb and bioremediatesome specific chlorophenols present in contaminated water. In: Proceedings of the 4th IWA world watercongress and exhibition; 2004b.
Navia R, Levet L, Mora ML, Vidal G, Diez MC. Allophanic soil adsorption system as a bleached Kraft mill effluentpost-treatment. Water Air Soil Poll 2003;148:321–31.
Ract PG, Espinosa DCR, Tenorio JAS. Determination of Cu and Ni incorporation ratios in Portland cement clinker.Waste Manage 2003;23:281–5.
Raynolds M, Fraser R, Checkel D. The relative mass-energy-economic (RMEE) method for system boundaryselection. Int J Life Cycle Ass 2000a;5(1):37–46.
Raynolds M, Fraser R, Checkel D. The relative mass-energy-economic (rmee) method for system boundaryselection. Int J Life Cycle Ass 2000b;5(2):96–104.
Rettenberger G, Tabasaran O. Untersuchung zur Entstehung, Ausbreitung und Ableitung von Zersetzungsgasen.Technical Report 10302207, Part I, German Federal Environmental Agency, Germany, 1982.
Rivela B, Hospido A, Moreira M T, Feijoo G. Life cycle inventory of particleboard: a case study in the woodsector. Int J LCA 2005, accepted: http://dx.doi.org/10.1065/lca2005.05.206.
Rivela B, Moreira MT, Bornhardt C, Mendez R, Feijoo G. Life cycle assessment as a tool for the environmentalimprovement of the tannery industry in developing countries. Environ Sci Technol 2004;38:1901–9.
Seppala J, Hamalainen RP. On the meaning of the distance-to-target weighting method and normalization in lifecycle impact assessment. Int J Life Cycle Ass 2001;6(4):211–8.
Seyler C, Hellweg S, Monteil M, Hungerbuhler K. Life cycle inventory for use of waste solvent as fuel substitutein the cement industry. A multi-input allocation model. Int J Life Cycle Ass 2005;10(2):120–30.
Suh S, Lenzen M, Treloar GJ, Hondo H, Horvath A, Huppes G, Jolliet O, Klann U, Krewitt W, MoriguchiY, Munskgaard J, Norris G. System boundary selection in life-cycle inventories using hybrid approaches.Environ Sci Technol 2004;38:657–64.
Toffoletto L, Deschenes L, Samson R. LCA of Ex-Situ Bioremediation of Diesel-Contaminated Soil. Int J LifeCycle Ass 2005;10(6):406–16.
Tyteca D. On the measurement of the environmental performance of firms—a literature review and a productiveefficiency perspective. J Environ Manage 1996;46:281–308.
Volkwein S, Hurtig HW, Klopffer W. Life cycle assessment of contaminated sites remediation. Int J Life CycleAss 1999;5:263–74.
Van Oss H, Padovani A. Cement manufacture and the environment. Part II. Environmental challenges and oppor-tunities. J Ind Ecol 2003;7(1):93–126.
Von Bahr B, Hanssen OJ, Vold M, Pott G, Stoltenberg-Hansson E, Steen B. Experiences of environmental perfor-mance evaluation in the cement industry. Data quality of environmental performance indicators as a limitingfactor for benchmarking and rating. J Clean Prod 2003;11:713–25.