Recycling and Waste in Queensland 2017 report - … · The Recycling and Waste ... Queenslanders...
31
Recycling and waste in Queensland 2017
Transcript of Recycling and Waste in Queensland 2017 report - … · The Recycling and Waste ... Queenslanders...

Recycling and wastein Queensland
2017

2
Minister’s forewordThe Recycling and Waste in Queensland 2017 report provides important information and data about waste generation and resource recovery at both a state and regional level.
These details give us a point-in-time picture not only of the progress Queenslanders have made in reducing waste and increasing recycling in this state, but also the areas in which we can do better.
Across 2016-17, Queenslanders increased their recycling effort for household and business wastes by almost 320,000 tonnes, resulting in close to 4.4 million tonnes of materials diverted away from landfill.
As our population grows and consumption increases, we need to continue to develop effective, fit-for-purpose waste avoidance and resource recovery pathways and solutions.
A key focus for the Queensland Government is the delivery of a comprehensive waste management and resource recovery agenda. While we have made good progress in some areas, there is still room for improvement.
This report helps us further understand the monetary cost to government of managing the problem of waste, litter and illegal dumping as well as the significant environmental cost these cause.
In 2018, the Queensland Government will introduce historic reforms to combat plastic litter and improve recycling rates in Queensland, with the introduction of a container refund scheme (scheme) and a ban on the supply of lightweight single-use plastic shopping bags.
Under the scheme, people will receive a 10 cent refund for each eligible drink container they return to a container refund point. Alternatively, they may donate their 10 cent refund to a charity or community group.
The scheme will help tackle the problem of beverage container litter, which is largely associated with consumption in open air settings such as parks and beaches. At the same time, the scheme will improve Queenslanders’ recycling performance, particularly in 44 Council areas that will enjoy recycling for the first time. Importantly, the scheme will enable our regional communities and businesses to share in the economic benefits the scheme will deliver.
The lightweight single-use plastic shopping bag ban will also significantly reduce the amount of plastic litter that is affecting our precious wildlife and environment. To complement the ban, Queensland is leading the way at a national level by working with retailers to adopt a voluntary phase-out of thicker single-use ‘boutique’-style plastic shopping bags. A staggering 900 million of these bags are supplied annually by retailers across Australia.
Plastic pollution is a growing problem and one that the Queensland Government is confronting. In 2018, we will continue our work on a Plastic Pollution Reduction Plan. Working with representatives from academia, science and research centres, environmental groups, industry sectors and local government, the reduction plan will identify and coordinate a strategic approach to reducing plastic pollution.
The Queensland Government will continue to introduce a range of initiatives for emerging priorities such as food and organic waste. Already, a number of pilot projects are taking innovative approaches to divert these wastes away from landfill.
At a national level, Queensland is leading the development of a product stewardship program for end-of-life rechargeable batteries, and collaborating on market development solutions for end-of-life tyres. Through the environmentally sound re-use and recovery of these materials, we can convert waste products into resources with higher-value uses.
There is significant potential to increase resource recovery and landfill diversion in Queensland. Innovation and collaboration will be key to developing new solutions that will deliver better outcomes for our environment, our economy and our communities.
Leeanne Enoch MP Minister for Environment and the Great Barrier Reef, Minister for Science and Minister for the Arts

33
Contents
ContentsMinister's foreword .............................................................................................................................................................2
In 2016-2017 ......................................................................................................................................................................4
Introduction ........................................................................................................................................................................5
Key findings of this report ...................................................................................................................................................5
Headline wastes ............................................................................................................................................................. 5
Local governments .......................................................................................................................................................... 5
Materials recovered ........................................................................................................................................................ 5
Other .............................................................................................................................................................................. 5
1. Summary account of headline waste streams generated in 2016–17 .............................................................................6
1.1 Municipal solid waste.......................................................................................................................................... 6
1.2 Commercial and industrial waste ......................................................................................................................... 6
1.3 Construction and demolition waste ..................................................................................................................... 6
2. Selected trends for headline waste streams ...................................................................................................................8
2.1 Kerbside domestic bin collection ......................................................................................................................... 8
2.2 Segregated green waste and other domestic waste ............................................................................................. 10
2.3 Commercial and industrial waste ......................................................................................................................... 10
2.4 Construction and demolition waste ..................................................................................................................... 11
3. Headline waste disposal in regional Queensland ...........................................................................................................12
4. Waste recovery ..............................................................................................................................................................14
4.1 Local government activity .................................................................................................................................... 14
4.1.1 Paper and packaging materials ........................................................................................................................... 14
4.1.2 Other materials ................................................................................................................................................... 17
4.2 Organic processors .............................................................................................................................................. 18
4.3 Overall recovery of materials ............................................................................................................................... 20
5. Other data and trends ....................................................................................................................................................22
5.1 Other waste streams ........................................................................................................................................... 22
5.2 Cross-border movements of waste ....................................................................................................................... 23
5.3 Waste reduction and recycling plans ................................................................................................................... 24
6. How this report was put together ...................................................................................................................................26
Glossary .............................................................................................................................................................................28
Appendix 1: Local government waste services in 2017 ........................................................................................................30

4
In 2016–2017...
of headline wastes reported
9.8million tonnes
in the amount of waste from
61%increase
sent to Queensland waste facilities interstate sources
of illegally disposed of waste
$18m8,500tonnes
It cost local governments
to deal with
of materials recovered were recycled in
80% Queensland
overall recovery rate forheadline wastes
45%
of paper and packaging to recyclers
Local governments sent
335 000 tonnes
of mixed domestic waste picked up by
weekly council kerbside collection
1.3mtonnes
IntroductionThis report presents data on, and trends in, waste recovery and disposal in Queensland during the 2016–17 financial year.
The data was derived from surveys submitted by 373 reporting entities including local governments; private landfill operators; recyclers; organic processors; waste transporters and transfer station operators; incinerator operators; and industrial and mining monofill operators, in compliance with the Waste Reduction and Recycling Act 2011’s mandatory annual reporting requirements.
into products such as soil, potting mixes and mulches
Organic processors converted
1.4 million tonnes
55
Key findings for 2016–17
Key findings for 2016–17
1 ABS 3218.0 Regional Population Growth, Australia, 28 July 2017 (http://www.abs.gov.au/AUSSTATS/[email protected]/DetailsPage/3218.02016)
2 ABS State Details, June quarter 2017 (http://www.qgso.qld.gov.au/products/reports
/national-accounts-state-details/national-accounts-state-details-201706.pdf)
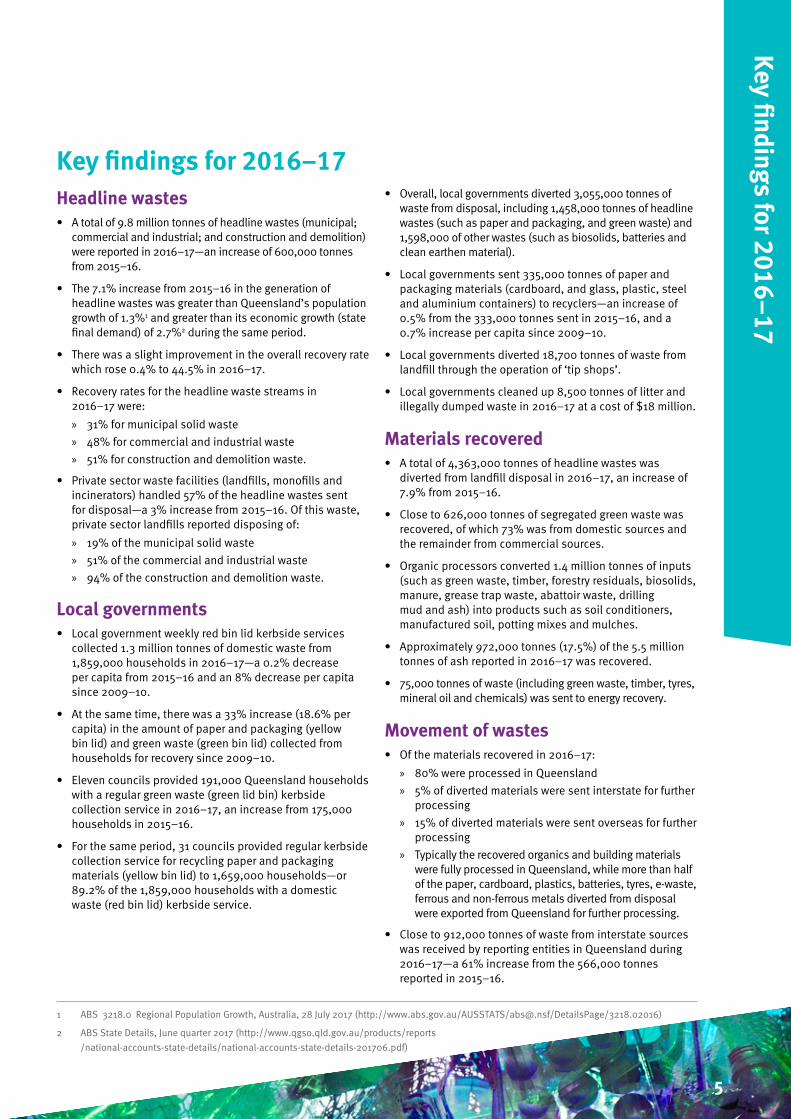
Headline wastes• A total of 9.8 million tonnes of headline wastes (municipal;
commercial and industrial; and construction and demolition) were reported in 2016–17—an increase of 600,000 tonnes from 2015–16.
• The 7.1% increase from 2015–16 in the generation of headline wastes was greater than Queensland’s population growth of 1.3%1 and greater than its economic growth (state final demand) of 2.7%2 during the same period.
• There was a slight improvement in the overall recovery rate which rose 0.4% to 44.5% in 2016–17.
• Recovery rates for the headline waste streams in 2016–17 were:
» 31% for municipal solid waste
» 48% for commercial and industrial waste
» 51% for construction and demolition waste.
• Private sector waste facilities (landfills, monofills and incinerators) handled 57% of the headline wastes sent for disposal—a 3% increase from 2015–16. Of this waste, private sector landfills reported disposing of:
» 19% of the municipal solid waste
» 51% of the commercial and industrial waste
» 94% of the construction and demolition waste.
Local governments• Local government weekly red bin lid kerbside services
collected 1.3 million tonnes of domestic waste from 1,859,000 households in 2016–17—a 0.2% decrease per capita from 2015–16 and an 8% decrease per capita since 2009–10.
• At the same time, there was a 33% increase (18.6% per capita) in the amount of paper and packaging (yellow bin lid) and green waste (green bin lid) collected from households for recovery since 2009–10.
• Eleven councils provided 191,000 Queensland households with a regular green waste (green lid bin) kerbside collection service in 2016–17, an increase from 175,000 households in 2015–16.
• For the same period, 31 councils provided regular kerbside collection service for recycling paper and packaging materials (yellow bin lid) to 1,659,000 households—or 89.2% of the 1,859,000 households with a domestic waste (red bin lid) kerbside service.
• Overall, local governments diverted 3,055,000 tonnes of waste from disposal, including 1,458,000 tonnes of headline wastes (such as paper and packaging, and green waste) and 1,598,000 of other wastes (such as biosolids, batteries and clean earthen material).
• Local governments sent 335,000 tonnes of paper and packaging materials (cardboard, and glass, plastic, steel and aluminium containers) to recyclers—an increase of 0.5% from the 333,000 tonnes sent in 2015–16, and a 0.7% increase per capita since 2009–10.
• Local governments diverted 18,700 tonnes of waste from landfill through the operation of ‘tip shops’.
• Local governments cleaned up 8,500 tonnes of litter and illegally dumped waste in 2016–17 at a cost of $18 million.
Materials recovered• A total of 4,363,000 tonnes of headline wastes was
diverted from landfill disposal in 2016–17, an increase of 7.9% from 2015–16.
• Close to 626,000 tonnes of segregated green waste was recovered, of which 73% was from domestic sources and the remainder from commercial sources.
• Organic processors converted 1.4 million tonnes of inputs (such as green waste, timber, forestry residuals, biosolids, manure, grease trap waste, abattoir waste, drilling mud and ash) into products such as soil conditioners, manufactured soil, potting mixes and mulches.
• Approximately 972,000 tonnes (17.5%) of the 5.5 million tonnes of ash reported in 2016–17 was recovered.
• 75,000 tonnes of waste (including green waste, timber, tyres, mineral oil and chemicals) was sent to energy recovery.
Movement of wastes • Of the materials recovered in 2016–17:
» 80% were processed in Queensland
» 5% of diverted materials were sent interstate for further processing
» 15% of diverted materials were sent overseas for further processing
» Typically the recovered organics and building materials were fully processed in Queensland, while more than half of the paper, cardboard, plastics, batteries, tyres, e-waste, ferrous and non-ferrous metals diverted from disposal were exported from Queensland for further processing.
• Close to 912,000 tonnes of waste from interstate sources was received by reporting entities in Queensland during 2016–17—a 61% increase from the 566,000 tonnes reported in 2015–16.

66
1. Summary account of headline waste streams generated in 2016–17
This section reports on the headline waste streams—municipal solid waste; commercial and industrial waste; and construction and demolition waste. These are general wastes arising from everyday household and business activities.
Reporting entities handled 9,814,000 tonnes of headline waste in 2016–17 (Figure 1.1). This was 648,000 tonnes more than the total reported in 2015–16.
A total of 5,450,000 tonnes was disposed of, and 4,363,000 tonnes went to recovery. The overall recovery rate for headline waste was 44.5%, an increase on the 44.1% achieved in 2015–16.
1.1 Municipal solid wasteApproximately 832,000 tonnes (or 30.9%) of the 2.7 million tonnes of municipal solid waste reported in 2016–17 was recovered. This was a decline from the 32.8% achieved in 2015–16, and can largely be attributed to a decrease in the amount of domestic green waste reported by local governments.
Local governments reported managing 8,500 tonnes of litter and illegally dumped waste in 2016–17 at a cost of $18 million—down from the 12,600 tonnes reported in 2015–16. Fifty councils provided data on the types of litter and illegally dumped waste collected, the most common of which were tyres (reported by 48% of councils); household litter (46%); large household items including white goods, furniture and mattresses (42%); green waste (26%); construction and demolition waste (20%); cars (16%) and asbestos (14%).
1.2 Commercial and industrial wasteJust over 1.3 million tonnes (or 47.8%) of the 2.8 million tonnes of commercial and industrial waste reported in 2016–17 was recovered. This is similar to the 47.2% recovery rate reported in 2015–16.
Paper and packaging materials, scrap metal and green waste were the main materials recovered (Table 1.1).
1.3 Construction and demolition wasteApproximately 2.2 million tonnes (or 50.8%) of the 4.4 million tonnes of construction and demolition waste reported in 2016–17 was recovered. While the recovery rate is a small increase on the 49.7% reported in 2015–16, the total amount of construction and demolition waste was 606,000 tonnes greater than the 3.8 million tonnes reported in 2015–16. This included a 145,000 tonne increase in the amount received from interstate sources.
Concrete was the main material recovered (Table 1.2).
Table 1.1 Commercial and industrial waste materials recovered during 2016–17
Material Amount recovered (tonnes)
Paper and packaging 376,164
Non-packaging glass 8,306
Non-packaging plastic 9,544
Ferrous scrap metal 377,661
Non-ferrous scrap metal 61,230
Timber 97,968
Green waste 208,484
Cotton gin trash 5,185
Food waste 68,635
Drilling mud 64,260
Tyres 32,246
Other rubber 849
Other mixed waste 8,380
Table 1.2 Construction and demolition waste materials recovered during 2016–17
Material Amount recovered (tonnes)
Concrete 1,476,739
Asphalt 348,671
Bricks and tiles 41,908
Plasterboard 19,043
Timber 20,957
Non-packaging glass 8,306
Non-packaging plastic 1,060
Ferrous scrap metal 279,104
Non-ferrous scrap metal 16,084

777
Summ
ary account of headline waste stream
s in 2016–2017
Figure 1.1: Headline wastes generated and recovery rates in Queensland during 2016–17TOTAL Municipal
Commercial Construction
44.5% 30.9%
47.8% 50.8%
Disposed
TOTAL Municipal
Commercial Construction
44.5% 30.9%
47.8% 50.8%
Disposed
TOTAL Municipal
Commercial Construction
44.5% 30.9%
47.8% 50.8%
Disposed
TOTAL Municipal
Commercial Construction
44.5% 30.9%
47.8% 50.8%
Disposed
DisposedRecovered
Recovery rate
Municipal solid wasteCommercial and industrial waste
Construction and demolition waste
5,450,451 tonnes4,363,392 tonnes
Recovered Disposed832,058 tonnes 1,861,501 tonnes
Recovered Disposed1,318,912 tonnes 1,442,642 tonnes
Recovered Disposed2,212,422 tonnes 2,146,308 tonnes

88
2. Selected trends for headline waste streamsThis section reviews the management of selected headline waste streams using a series of graphs to illustrate 8–10 year trends.
2.1 Kerbside domestic bin services
3 In the Cairns region, waste from some of the domestic red bin lid services is not sent direct to landfill but is sent to an alternative waste treatment
facility for recovery of the organic fraction of the waste.
In 2016–17, local governments provided kerbside bin collection services:
• for domestic waste (red bin lid) to 1,859,000 households
• for recovering paper and packaging materials (yellow bin lid) to 1,659,000 households
• for recovering green waste (green bin lid) to 191,000 households.
In effect, 89.2% of households with a red bin lid service also had a yellow bin lid service, while 10.3% also had a green bin lid service. In 2016–17, 71,000 households had no kerbside bin collection service.
The numbers of red bin lid and yellow bin lid services have largely kept pace with population growth in Queensland, averaging 386 and 334 services per thousand people respectively during the past nine years (Figure 2.1).
In contrast, the number of green bin services has grown from seven services per thousand people in 2008–09 (28,539) to 39 services per thousand people in 2016–17 (191,471). In addition, Ipswich City Council also collects food waste through its green lid bin service.
A breakdown of local government bin services (by region) is available in Appendix 1.
Compared to 2015–16, there was an 18,000 tonne (1.5%) increase in the amount of domestic waste (red bin lid) sent to landfill; a 2,500 tonne (4.3%) decrease in the amount of domestic waste (red bin lid) sent to an alternative waste treatment facility for recovery; a 1,100 tonne (0.3%) decrease in the amount of paper and packaging collected via the yellow bin lid service; and a 2,700 tonne (5.5%) increase in the amount of green waste collected3.
Local governments collected an average of 700 kg of domestic waste per red bin lid service; 210 kg of paper and packaging materials per yellow bin lid service; and 280 kg of green waste per green bin lid service, per year.
Figure 2.2 shows the trends in the management of wastes collected by local governments from households. Note that the amounts sent for recovery were greater than the amounts actually recovered due to the generation of residuals in the recovery process.
While the 1,314,000 tonnes of domestic waste (red bin lid) collected in 2016–17 was only 2.6% greater than the 1,281,000 tonnes reported in 2009–10, the amount of yellow and green bin lid material collected increased by 33% from 297,000 tonnes in 2009–10 to 395,000 tonnes in 2016–17. On a per capita basis, the amount of red bin waste collected decreased by 8.4% between 2009–10 and 2016–17, while the combined amount of green and yellow bin materials increased by 18.6%.
700 KG
210 KG
280 KG
of waste per bin lid service
1.859 m 1.659
m0.191
m
Services provided to households in 2017

999
Figure 2.1: Trends in the provision of kerbside bin services by local governments (2009–17)
Figure 2.2: Trends in the disposal and recovery of domestic waste picked up via kerbside collections in Queensland (2010–17)
0
50
100
150
200
250
300
350
2016–172015–162014–152013–142012–132011–122010–112009–10
900
975
1050
1125
1200
1275
1350
1425
1500
2016–172015–162014–152013–142012–132011–122010–112009–10
0
50
100
150
200
2016–17
2015–16
2014–15
2013–14
2012–13
2011–12
2010–11
2009–10
2008–09
1300
1400
1500
1600
1700
1800
1900
2000
2016–172015–162014–152013–142012–132011–122010–112009–102008–09
30003100320033003400350036003700380039004000
2015–162014–152013–142012–132011–122010–112009–102008–09
'000
tonn
es
'000
bin
ser
vice
s
'000
tonn
es
'000
bin
ser
vice
s
'000
tonn
es
0
50
100
150
200
250
300
350
2016–172015–162014–152013–142012–132011–122010–112009–10
900
975
1050
1125
1200
1275
1350
1425
1500
2016–172015–162014–152013–142012–132011–122010–112009–10
0
50
100
150
200
2016–17
2015–16
2014–15
2013–14
2012–13
2011–12
2010–11
2009–10
2008–09
1300
1400
1500
1600
1700
1800
1900
2000
2016–172015–162014–152013–142012–132011–122010–112009–102008–09
30003100320033003400350036003700380039004000
2015–162014–152013–142012–132011–122010–112009–102008–09'0
00 to
nnes
'000
bin
ser
vice
s
'000
tonn
es
'000
bin
ser
vice
s
'000
tonn
es
0
50
100
150
200
250
300
350
2016–172015–162014–152013–142012–132011–122010–112009–10
900
975
1050
1125
1200
1275
1350
1425
1500
2016–172015–162014–152013–142012–132011–122010–112009–10
0
50
100
150
200
2016–17
2015–16
2014–15
2013–14
2012–13
2011–12
2010–11
2009–10
2008–09
1300
1400
1500
1600
1700
1800
1900
2000
2016–172015–162014–152013–142012–132011–122010–112009–102008–09
30003100320033003400350036003700380039004000
2015–162014–152013–142012–132011–122010–112009–102008–09
'000
tonn
es
'000
bin
ser
vice
s
'000
tonn
es
'000
bin
ser
vice
s
'000
tonn
es
0
50
100
150
200
250
300
350
2016–172015–162014–152013–142012–132011–122010–112009–10
900
975
1050
1125
1200
1275
1350
1425
1500
2016–172015–162014–152013–142012–132011–122010–112009–10
0
50
100
150
200
2016–17
2015–16
2014–15
2013–14
2012–13
2011–12
2010–11
2009–10
2008–09
1300
1400
1500
1600
1700
1800
1900
2000
2016–172015–162014–152013–142012–132011–122010–112009–102008–09
30003100320033003400350036003700380039004000
2015–162014–152013–142012–132011–122010–112009–102008–09
'000
tonn
es
'000
bin
ser
vice
s
'000
tonn
es
'000
bin
ser
vice
s
'000
tonn
es
Red bin service
Red bin service
Red bin service
Yellow bin service
Yellow bin service
Green bin service
Green bin service
Sent to recovery
Sent to landfill
Selected trends for headline w
aste streams

1010
400
600
800
1000
Self-hauled & Bulky Item WasteSegregated Green Waste
2016–172015–162014–152013–142012–132011–122010–112009–102008–092007–08
500
1000
1500
2000
C&I recoveredC&I landfilled
2016–172015–162014–152013–142012–132011–122010–112009–102008–092007–08
500
1000
1500
2000
2500
C&D recoveredC&D landfilled
2016–172015–162014–152013–142012–132011–122010–112009–102008–092007–08
'000
tonn
es'0
00 to
nnes
'000
tonn
es
*No C&I recovered data available for 2010–11
2.2 Segregated green waste and other domestic wasteIn 2016–17, 634,000 tonnes of segregated green waste was reported. Overall the amount of green waste decreased by 127,000 tonnes from 2015–16 (Figure 2.4).
Green waste is sourced from both domestic and commercial sources. Of the green waste recovered, 73% was received from domestic sources and was classified as municipal solid waste, with the remainder classified as commercial and industrial waste.
The 526,000 tonnes of domestic waste self-hauled by residents to council facilities or through bulky item kerbside collections was similar to the amount reported in previous years (Figure 2.3).
2.3 Commercial and industrial wasteThe total amount of commercial and industrial (C&I) waste sent to disposal in 2016–17 was 1,443,000 tonnes, a 2% (33,000 tonne) decrease from 2015–16 and 4,000 tonnes more than the 2008–16 average of 1,439,000 tonnes (Figure 2.5).
The 1,319,000 tonnes recovered in 2016–17 was a 1,000 tonne (0.1%) increase on the amount recovered in 2015–16, and was 188,000 tonnes more than the 2008–16 average of 1,131,000 tonnes.
Figure 2.4
Figure 2.5

111111
400
600
800
1000
Self-hauled & Bulky Item WasteSegregated Green Waste
2016–172015–162014–152013–142012–132011–122010–112009–102008–092007–08
500
1000
1500
2000
C&I recoveredC&I landfilled
2016–172015–162014–152013–142012–132011–122010–112009–102008–092007–08
500
1000
1500
2000
2500
C&D recoveredC&D landfilled
2016–172015–162014–152013–142012–132011–122010–112009–102008–092007–08
'000
tonn
es'0
00 to
nnes
'000
tonn
es
2.4 Construction and demolition wasteThe trend for increasing amounts of disposal of construction and demolition (C&D) waste continued in 2016–17 (Figure 2.6). The 2,146,000 tonnes landfilled was a 261,000 tonne (14%) increase on the amount reported in 2015–16. A contributing factor was a 145,000 tonne increase in the amount of construction and demolition waste received from interstate.
The 2,212,000 tonnes of construction and demolition waste recovered in 2016–17 was a 346,000 tonne increase on the amount reported in 2015–16.
Key changes include a 158,000 tonne increase in the amount of concrete recovered and a 199,000 tonne increase in the amount of asphalt recovered.
Selected trends for headline w
aste streams
Figure 2.6
1212
3. Headline waste disposal in regional Queensland
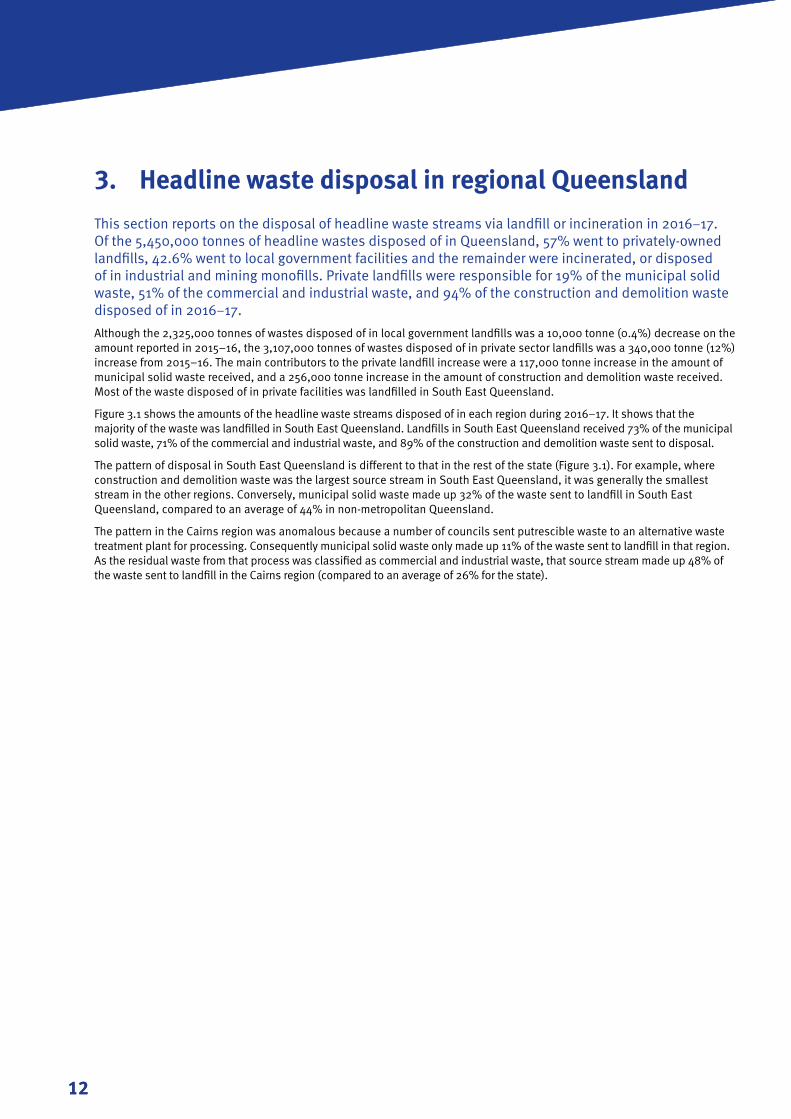
This section reports on the disposal of headline waste streams via landfill or incineration in 2016–17. Of the 5,450,000 tonnes of headline wastes disposed of in Queensland, 57% went to privately-owned landfills, 42.6% went to local government facilities and the remainder were incinerated, or disposed of in industrial and mining monofills. Private landfills were responsible for 19% of the municipal solid waste, 51% of the commercial and industrial waste, and 94% of the construction and demolition waste disposed of in 2016–17.
Although the 2,325,000 tonnes of wastes disposed of in local government landfills was a 10,000 tonne (0.4%) decrease on the amount reported in 2015–16, the 3,107,000 tonnes of wastes disposed of in private sector landfills was a 340,000 tonne (12%) increase from 2015–16. The main contributors to the private landfill increase were a 117,000 tonne increase in the amount of municipal solid waste received, and a 256,000 tonne increase in the amount of construction and demolition waste received. Most of the waste disposed of in private facilities was landfilled in South East Queensland.
Figure 3.1 shows the amounts of the headline waste streams disposed of in each region during 2016–17. It shows that the majority of the waste was landfilled in South East Queensland. Landfills in South East Queensland received 73% of the municipal solid waste, 71% of the commercial and industrial waste, and 89% of the construction and demolition waste sent to disposal.
The pattern of disposal in South East Queensland is different to that in the rest of the state (Figure 3.1). For example, where construction and demolition waste was the largest source stream in South East Queensland, it was generally the smallest stream in the other regions. Conversely, municipal solid waste made up 32% of the waste sent to landfill in South East Queensland, compared to an average of 44% in non-metropolitan Queensland.
The pattern in the Cairns region was anomalous because a number of councils sent putrescible waste to an alternative waste treatment plant for processing. Consequently municipal solid waste only made up 11% of the waste sent to landfill in that region. As the residual waste from that process was classified as commercial and industrial waste, that source stream made up 48% of the waste sent to landfill in the Cairns region (compared to an average of 26% for the state).

131313
Headline w
aste disposal in regional Queensland
Figure 3.1: Amounts of headline waste landfilled or incinerated in Queensland by region in 2016–17
Key
Municipal solid waste
Commercial and industrial waste
Construction and demolition waste
Wide Bay
58.77% 110,776 tonnes
25.89% 48,793 tonnes
15.35% 28,928 tonnes
Southeast Queensland
31.65% 1,361,314 tonnes
23.74% 1,021,053 tonnes
44.62% 1,919,441 tonnes
Mackay
42.33% 61,502 tonnes
46.61% 67,721 tonnes
11.06% 16,067 tonnes
Fitzroy
49.27% 74,486 tonnes
41.34% 62,497 tonnes
9.39% 14,188 tonnes
Remote Queensland
52.70% 46,250 tonnes
31.43% 27,583 tonnes
15.87% 13,932 tonnes
Darling Downs–Maranoa
65.82% 108,377 tonnes
20.21% 33,286 tonnes
13.97% 23,002 tonnes
Townsville
45.08% 72,335 tonnes
38.01% 60,988 tonnes
16.91% 27,126 tonnes
Cairns
10.55% 26,461 tonnes
48.13% 120,722 tonnes
41.32% 103,624 tonnes
1414
4. Waste recovery
This section reports on materials that were diverted from disposal through a variety of means, including recycling, organic processing and energy recovery.
4.1 Local government activityLocal governments were the main collection point for domestic waste, and for wastes generated outside of South East Queensland. In 2016–17, local governments diverted 3,055,000 tonnes of waste from disposal, including 1,458,000 tonnes of headline wastes.
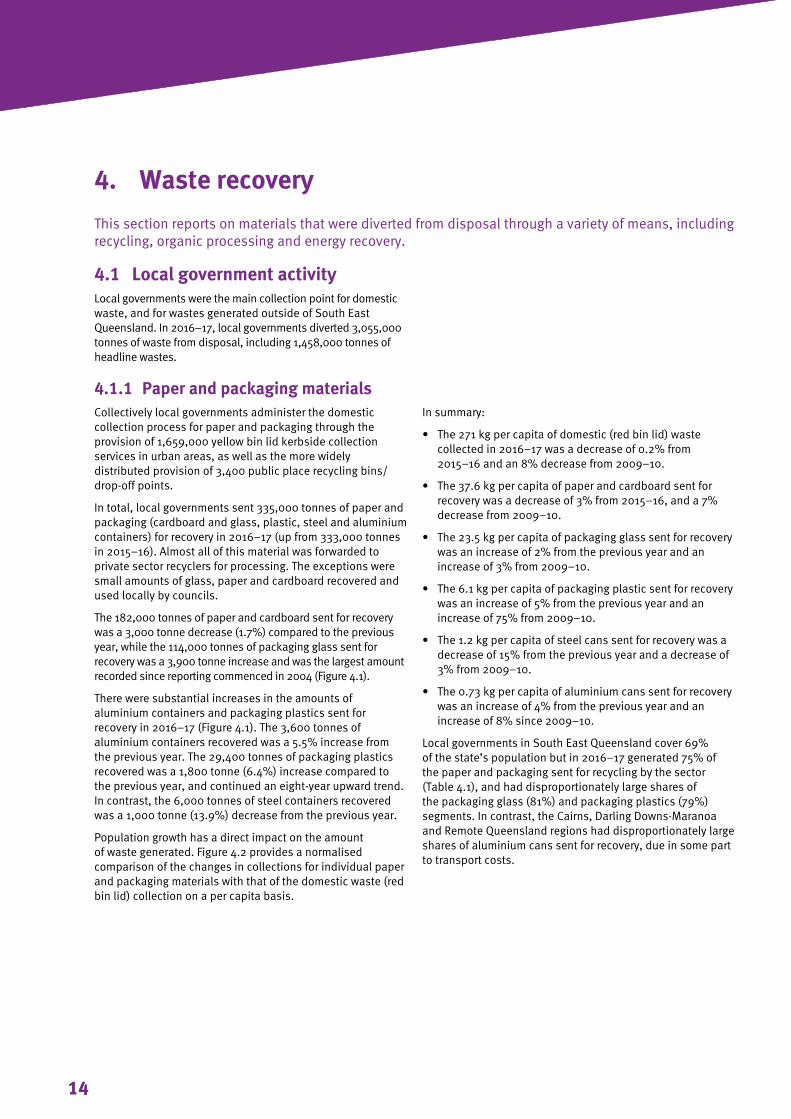
4.1.1 Paper and packaging materialsCollectively local governments administer the domestic collection process for paper and packaging through the provision of 1,659,000 yellow bin lid kerbside collection services in urban areas, as well as the more widely distributed provision of 3,400 public place recycling bins/drop-off points.
In total, local governments sent 335,000 tonnes of paper and packaging (cardboard and glass, plastic, steel and aluminium containers) for recovery in 2016–17 (up from 333,000 tonnes in 2015–16). Almost all of this material was forwarded to private sector recyclers for processing. The exceptions were small amounts of glass, paper and cardboard recovered and used locally by councils.
The 182,000 tonnes of paper and cardboard sent for recovery was a 3,000 tonne decrease (1.7%) compared to the previous year, while the 114,000 tonnes of packaging glass sent for recovery was a 3,900 tonne increase and was the largest amount recorded since reporting commenced in 2004 (Figure 4.1).
There were substantial increases in the amounts of aluminium containers and packaging plastics sent for recovery in 2016–17 (Figure 4.1). The 3,600 tonnes of aluminium containers recovered was a 5.5% increase from the previous year. The 29,400 tonnes of packaging plastics recovered was a 1,800 tonne (6.4%) increase compared to the previous year, and continued an eight-year upward trend. In contrast, the 6,000 tonnes of steel containers recovered was a 1,000 tonne (13.9%) decrease from the previous year.
Population growth has a direct impact on the amount of waste generated. Figure 4.2 provides a normalised comparison of the changes in collections for individual paper and packaging materials with that of the domestic waste (red bin lid) collection on a per capita basis.
In summary:
• The 271 kg per capita of domestic (red bin lid) waste collected in 2016–17 was a decrease of 0.2% from 2015–16 and an 8% decrease from 2009–10.
• The 37.6 kg per capita of paper and cardboard sent for recovery was a decrease of 3% from 2015–16, and a 7% decrease from 2009–10.
• The 23.5 kg per capita of packaging glass sent for recovery was an increase of 2% from the previous year and an increase of 3% from 2009–10.
• The 6.1 kg per capita of packaging plastic sent for recovery was an increase of 5% from the previous year and an increase of 75% from 2009–10.
• The 1.2 kg per capita of steel cans sent for recovery was a decrease of 15% from the previous year and a decrease of 3% from 2009–10.
• The 0.73 kg per capita of aluminium cans sent for recovery was an increase of 4% from the previous year and an increase of 8% since 2009–10.
Local governments in South East Queensland cover 69% of the state’s population but in 2016–17 generated 75% of the paper and packaging sent for recycling by the sector (Table 4.1), and had disproportionately large shares of the packaging glass (81%) and packaging plastics (79%) segments. In contrast, the Cairns, Darling Downs-Maranoa and Remote Queensland regions had disproportionately large shares of aluminium cans sent for recovery, due in some part to transport costs.

151515
Figure 4.1: Trends in the amounts of glass, paper/cardboard, plastics, steel cans and aluminum cans sent for recycling by local governments (2004–16)
Figure 4.2: Normalised per capita rates for paper and packaging sent for recovery versus domestic kerbside waste collected by local governments (2009–10 = 1.000)
0
20000
40000
60000
80000
100000
120000
140000
160000
180000
200000
Aluminium containers
Steel containers
Plastics
Glass
Paper and cardboard
2016–17
2015–16
2014–15
2013–14
2012–13
2011–12
2010–11
2009–10
2008–09
2007–08
2006–07
2005–06
2004–05
2003–04
Aluminium CansSteel CansPlasticsGlassPaper/Cardboard
Waste recovery in Q
ueensland
0.75
1.00
1.25
1.50
1.75Red bin waste
Aluminium containers
Steel containers
Plastics
Glass
Paper and cardboard
2016–172015–162014–152013–142012–132011–122010–112009–10
Aluminium Cans Red binSteel CansPlasticsGlassPaper/Cardboard

1616
Table 4.1: Paper and packaging collected by local governments and sent for recovery in 2016–17 by region (tonnes)
Region Paper and Cardboard
Packaging Glass
Packaging Plastics
Steel Cans Aluminum Cans
Regional total
Southeast Queensland 129,657 91,869 23,400 4,570 2,364 251,860
Darling Downs-Maranoa 7,109 5,511 1,123 230 291 14,264
Wide Bay 15,528 1,967 1,386 430 263 19,574
Fitzroy 6,959 4,067 954 229 128 12,337
Mackay 10,270 3,290 574 149 157 14,440
Townsville 6,383 4,202 1,077 263 117 12,042
Cairns 5,861 3,025 906 92 230 10,114
Remote Queensland 384 71 18 4 9 486
Subtotal 182,151 114,002 29,438 5,967 3,559 335,117

171717
Waste recovery in Q
ueensland
4.1.2 Other materialsOther wastes sent for recovery by local governments in 2016–17 included:
• 570,000 tonnes of green waste
• 27,000 tonnes of timber
• 2,400 tonnes of lead acid batteries
• 3,100 tonnes of e-waste
• 96,000 tonnes of other ferrous metal
• 5,500 tonnes of other non-ferrous metal
• 155,000 tonnes of concrete
• 191,000 tonnes of asphalt
• 1,200 tonnes of bricks and tiles
• 1,400 tonnes of tyres
• 1,700 tonnes of mineral oil
• 19,000 tonnes of tip shop items.
Local governments played an important role in the collection and management of green waste, handling 91% of the total reported in 2016–17.
While local governments sent all of the mineral oil and e-waste to recyclers for processing, they typically processed all the concrete and asphalt they received.
Table 4.2 provides a regional breakdown of selected wastes sent for recovery by local governments. South East Queensland recovered the largest amounts, particularly for e-waste and asphalt, with 83% and 94% of the state totals collected there. Green waste was the largest material by weight recovered by councils in all regions except Remote Queensland, where ferrous metal was the largest. Concrete was typically the second or third largest material recovered in all regions, except Cairns and Remote Queensland. In these regions, concrete ranked fourth.
Table 4.2 Amounts of other selected wastes sent for recovery by local governments in 2016–17 by region (tonnes
Region Green waste
Timber Concrete Asphalt Ferrous metal
Non-ferrous metal
E-waste Tip shop sales
South East Queensland
344,048 16,922 91,818 178,733 58,221 1,867 2,616 10,642
Darling Downs-Maranoa
55,686 8,035 21,657 196 8,638 23 46 1,507
Wide Bay 46,857 1,123 12,606 1,071 6,291 1,687 40 1,080
Fitzroy 30,943 777 8,448 3,059 5,707 341 141 341
Mackay 35,817 0 3,652 0 2,255 788 30 4,010
Townsville 21,586 0 15,523 5,778 3,931 30 86 356
Cairns 33,534 17 979 2,200 8,414 486 162 639
Remote Queensland
1,745 2 159 1 2,522 232 19 0
Subtotal 570,216 26,876 154,842 191,038 95,979 5,454 3,140 18,575

1818
4.2 Organic processorsThe 59 entities responding to the 2016–17 organic processing survey collectively managed:
• 209,000 tonnes of green waste
• 187,000 tonnes of forestry residuals
• 12,000 tonnes of agricultural residuals
• 48,000 tonnes of drilling mud
• 80,000 tonnes of timber, wood and sawdust
• 5,000 tonnes of cotton gin trash
• 44,000 tonnes of abattoir waste
• 272,000 tonnes of manure
• 72,000 tonnes of biosolids (dry solids equivalent)
• 117,000 tonnes of grease trap waste and other organic sludges
• 34,000 tonnes of food waste
• 40,000 tonnes of food processing waste
• 19,000 tonnes of ash.
Collectively these organic processors produced:
• 536,000 tonnes of manufactured soil
• 315,000 tonnes of soil conditioner
• 111,000 tonnes of potting mix
• 27,000 tonnes of organic fertiliser
• 216,000 tonnes of mulch
• 73,000 tonnes of direct land application
• 97,000 tonnes of composted manure
• 14,000 tonnes of playground surfacing
• 25,000 tonnes of other products.
Organic wastes were typically processed in the region in which they were produced (Table 4.3). South East Queensland managed the largest amounts of green waste, timber, forestry residuals, biosolids, grease trap waste and other organic sludges, abattoir waste, waste food, food processing waste and ash. The Darling Downs–Maranoa processed the most manure and drilling mud, Fitzroy processed the most cotton gin trash, and Wide Bay processed the most agricultural residuals.
Table 4.3: Selected wastes handled by organic processors in 2016–17 by region (tonnes)
Waste material
Region
South East Queensland
Darling Downs - Maranoa
Wide Bay Fitzroy Mackay Townsville CairnsRemote
Qld
Timber, wood and sawdust
50,489 4,896 15,168 224 646 3,300 5,393 0
Green waste 152,206 8,290 1,987 10,000 15,300 9,500 11,536 0
Forestry residuals 155,156 0 31,610 40 0 0 0 0
Agricultural residuals 1,630 0 8,300 589 0 800 1,000 0
Manure 60,357 185,916 5,821 0 0 1,175 18,829 0
Abattoir waste 30,533 2,979 3,726 5,506 1,000 0 0 0
Cotton gin trash 0 0 0 5,185 0 0 0 0
Waste food 33,920 0 0 392 0 21 0 0
Food processing waste 39,107 0 1,000 0 0 0 0 0
Biosolids (DSE) 61,449 6,514 395 886 0 16 2,963 118
Grease trap & other organic sludges
98,713 2,851 0 12,010 0 2,204 1,484 0
Ash 17,169 500 260 0 430 30 1,000 0
Drilling mud 3,400 44,334 0 28 250 0 0 0

191919
Wide Bay
68,267 tonnes
Southeast Queensland
704,129 tonnes
Mackay
17,626 tonnes
Fitzroy
34,860 tonnes
Remote Queensland
118 tonnes
Darling Downs–Maranoa
256,280 tonnes
Townsville
17,046 tonnes
Cairns
42,205 tonnes
Figure 4.3: Regional subtotals of selected wastes handled by organic processors during 2016–17
Waste recovery in Q
ueensland

2020
4.3 Overall recovery of materialsMany of the waste materials diverted from disposal are transferred between agents within the waste and recycling sector. For example, skip bin operators may deposit materials at council transfer stations, local governments may forward material to recyclers and organic processors, and recyclers may in turn forward materials to other recyclers for further processing. Table 4.4 provides an overall summary of materials recovered in 2016–17, distinguishing between material and energy recovery, as well as the last reported destination of the materials (Queensland, interstate or overseas).
Of the 6.2 million tonnes of materials tracked in Table 4.4, 80% were either fully recovered in Queensland or sent to another entity in Queensland, 5% were sent interstate, and 15% were sent overseas. Typically, building materials and organic wastes were recovered in Queensland, while the majority of ferrous and nonferrous metals, lead acid batteries, paper, cardboard, plastics and tyres were sent either interstate or overseas for recovery.
Just over 75,000 tonnes of the materials reported were sent to energy recovery, including 14% of the timber, 6% of the green waste, 10% of the mineral oil, 34% of the tyres, and 63% of the paint, solvents and chemicals reported.
Compared with the previous reporting period:
• the amount of concrete recovered increased by 158,000 tonnes (12%) to 1,477,000 tonnes
• the amount of asphalt recovered increased by 199,000 tonnes (133%) to 349,000 tonnes
• the amount of ferrous metal (excluding steel cans) recovered increased by 116,000 tonnes (20%) to 698,000 tonnes
• the amount of nonferrous metal (excluding aluminium cans) recovered increased by 22,000 tonnes (37%) to 80,000 tonnes
• the amount of packaging glass recovered decreased by 16,000 tonnes (15%) to 91,000 tonnes
• the amount of green waste recovered decreased by 128,000 tonnes (17%) to 626,000 tonnes.
Table 4.4: Recovery methods and destinations for selected materials recovered by reporting entities in Queensland during 2016–17 (tonnes)
Material Quantity recovered or sent for recovery in Queensland*
Quantity combusted for energy recovery in Queensland
Quantity sent interstate for further processing
Quantity sent interstate for energy recovery
Quantity sent overseas for further processing
Quantity sent overseas for energy recovery
Total reported in 2017
Change from 2016 to 2017
Packaging glass 90,607 - - - - - 90,607 -15.37%
Non packaging glass
16,371 - 241 - - - 16,612 11.16%
Paper 85,780 - 33,599 - 138,565 - 257,944 -1.65%
Cardboard 90,772 - 123,065 - 88,332 - 302,169 3.09%
Packaging plastics
12,755 - 2,915 - 15,109 - 30,779 -5.13%
Non packaging plastics
4,391 - - - 6,213 - 10,604 -12.97%
Steel cans 2,476 - 65 - 3,201 - 5,742 -33.08%
Other ferrous metals
11,843 - 135,025 - 550,892 - 697,760 20.03%
Aluminium cans 822 - 100 - 5,144 - 6,066 61.98%
Other nonferrous metals
416 - 2,398 - 77,606 - 80,420 36.77%
Lead acid batteries
12,267 - 23,204 - - - 35,471 18.71%
Other batteries 17 - 264 - - - 281 -22.59%
E-waste NEC** 112 - 1,347 - 256 - 1,715 -67.41%
Catalysts 148 - 19 - - - 167 42.74%

212121
Waste recovery in Q
ueensland
Material Quantity recovered or sent for recovery in Queensland*
Quantity combusted for energy recovery in Queensland
Quantity sent interstate for further processing
Quantity sent interstate for energy recovery
Quantity sent overseas for further processing
Quantity sent overseas for energy recovery
Total reported in 2017
Change from 2016 to 2017
Concrete 1,476,739 - - - - - 1,476,739 11.97%
Asphalt 348,671 - - - - - 348,671 133.14%
Bricks and tiles 41,908 - - - - - 41,908 -50.12%
Plasterboard/fibro
19,043 - - - - - 19,043 -22.88%
Timber/sawdust 102,751 16,167 7 - - - 118,925 -39.92%
Green waste 588,040 37,874 - - - - 625,914 -16.97%
Forestry residuals
186,806 - - - - - 186,806 -2.75%
Agricultural residuals
12,319 - - - - - 12,319 -12.14%
Manure 272,098 - - - - - 272,098 1.65%
Abattoir waste 64,030 - - - - - 64,030 -20.04%
Cotton gin trash 5,185 - - - - - 5,185 -28.06%
Vegetable oil 18,223 - - - 5,970 - 24,193 23.08%
Waste food 68,635 - - - - - 68,635 258.43%
Food processing waste
40,107 - - - - - 40,107 9.16%
Mineral oil 61,552 2,238 8,838 2,594 199 3,424 78,845 -22.90%
Biosolids (DSE) 77,392 - - - - - 77,392 24.25%
Grease trap waste & sludges
117,262 - 15 - - - 117,277 -31.22%
Oily water 12,131 - - - - - 12,131 13.91%
Ash 972,018 - - - - - 972,018 4.49%
Red mud 500 - - - - - 500
Drilling mud 64,260 - - - - - 64,260 98.86%
Tyres 12,522 - 11 - 8,909 10,804 32,246 6.16%
Other rubber 849 - - - - - 849 328.79%
Paint, solvents & chemicals
159 2,298 1,191 - - - 3,648 61.56%
Tip shop 18,673 - - - - - 18,673 22.27%
Destination subtotal
4,910,650 58,577 332,304 2,594 900,396 14,228 6,218,749 4.83%
* Recovered in Queensland means the material was either fully recovered by the reporting entity or was sent to another (non-reporting) operator in Queensland for further processing. It is possible that materials last tracked to a Queensland site were subsequently sent interstate or overseas.
** Residual amount not reported elsewhere (as ferrous metal, non ferrous metal, non packaging glass, non packaging plastic).

2222
5. Other data and trends
This section reports on data and trends from other waste streams and cross border movements as well as mandatory government planning for waste minimisation.
5.1 Other waste streamsData on other wastes generated during 2016–17 are shown in Figure 5.1. Some of these streams (such as asbestos) had zero recovery, while others (such as biosolids) had very high rates of recovery.
Figure 5.1: Other wastes
Waste streamAmount generated
(tonnes)Amount disposed of
(tonnes)Amount recovered
(tonnes)Recovery rate
Asbestos 102,168 102,168 0 0.00%
Biosolids (DSE) 86,288 8,896 77,392 89.69%
Contaminated soil 1,047,717 1,016,535 31,182 2.98%
Potential/acid sulfate soil
23,921 17,338 6,583 27.52%
Ash 5,540,762 4,568,744 972,018 17.54%
Red mud 6,874,515 6,874,015 500 0.01%
The 5,541,000 tonnes of ash generated in 2016–17 represents a slight (66,000 tonne) decrease from the 5,607,000 tonnes generated in 2015–16, and is close to the nine-year average amount of 5,497,000 tonnes (Figure 5.2). The 972,000 tonnes of ash recovered in 2016–17 was above the nine-year average of 886,000 tonnes, and the recovery rate of 17.5% was also above the nine-year average of 16.2%, although lower than the peak of 19.4% achieved in 2013–14.
Figure 5.2: Amounts of ash landfilled and recovered in Queensland during 2008-2016 (tonnes)
'000
tonn
es'0
00 to
nnes
0
1,000,000
2,000,000
3,000,000
4,000,000
5,000,000Ash recovered
Ash land�lled
2016–172015–162014–152013–142012–132011–122010–112009–102008–092007–08
Landfilled Recovered
0
100,000
200,000
300,000
400,000
500,000
600,000
700,000
800,000
Contaminated soil
Construction and demolition waste
Commercial and industrial waste
Municipal solid waste
2016–172015–162014–152013–14

232323
Other data and trends
5.2 Cross-border movements of wasteDuring 2016–17, wastes moved both into Queensland, and from Queensland, into other states or overseas.
In 2016–17, 335,000 tonnes of the materials listed in Table 4.4 were sent interstate for recovery while 915,000 tonnes were sent overseas.
The 912,000 tonnes of waste reported as being received from interstate sources in 2016–17 was a 346,000 tonne (61.1%) increase from the 566,000 tonnes reported in 2015–16. This included approximately:
• 53,000 tonnes of municipal solid waste
• 23,000 tonnes of commercial and industrial waste
• 640,000 tonnes of construction and demolition waste
• 190,000 tonnes of contaminated soil
• 1,000 tonnes of acid sulfate soil
• 5,000 tonnes of regulated waste.
While the amounts of municipal solid waste, commercial and industrial waste, and regulated waste were comparable to those reported in previous years, there was a 145,000 tonne (29%) increase in the amount of construction and demolition waste and a 174,000 tonne (1066%) increase in the amount of contaminated soil received from interstate. (Figure 5.3).
Figure 5.3: Four–year trend in wastes received by Queensland waste operators from interstate sources
'000
tonn
es'0
00 to
nnes
0
1,000,000
2,000,000
3,000,000
4,000,000
5,000,000Ash recovered
Ash land�lled
2016–172015–162014–152013–142012–132011–122010–112009–102008–092007–08
Landfilled Recovered
0
100,000
200,000
300,000
400,000
500,000
600,000
700,000
800,000
Contaminated soil
Construction and demolition waste
Commercial and industrial waste
Municipal solid waste
2016–172015–162014–152013–14

242424
5.3 Waste reduction and recycling plansChapter 6 of the Waste Reduction and Recycling Act 2011 requires Queensland Government departments and local governments to develop and implement waste reduction and recycling plans. These plans include waste reduction and recycling targets, actions to be taken to improve waste reduction and recycling, and performance monitoring measures. Local governments also have the option to develop shared regional plans.
In summary, for 2016–17:
• 51 (of 77) councils had waste plans in place, with the plans of 35 of these available on council websites (see Appendix 1)
• two joint local government plans were in place, covering the North Queensland and the Wide Bay Burnett regions
• 21 of 22 Queensland Government departments and agencies had waste plans in place, and 20 produced an annual report on the operation of the plan for 2016–17 (Table 5.1).
Table 5.1: Queensland Government departments with waste plans in place in 2017
DepartmentDuration of plan
Availability2017 report received
Aboriginal and Torres Strait Islander Partnerships
2015–2018Department of Communities, Child Safety and Disability Services website
Yes
Agriculture and Fisheries 2015–2018 Department of Agriculture and Fisheries website Yes
Communities, Child Safety and Disability Services
2015–2018Department of Communities, Child Safety and Disability Services website
Yes
Education and Training 2015–2018Available on request from the Department of Education and Training (3034 4520)
Yes
Energy and Water Supply 2015–2018 Department of Energy and Water Supply website Yes
Environment and Heritage Protection 2015–2018 Department of Environment and Heritage Protection website Yes
Housing and Public Works 2017–2020 Department of Housing and Public Works website Yes
Infrastructure, Local Government and Planning
2015–2018Available on request from the Department of Infrastructure, Local Government and Planning (3452 6901)
Yes
Justice and Attorney-General 2017–2020 Department of Justice and Attorney-General website Yes
National Parks, Sport and Racing 2015–2018 Department of National Parks, Sport and Racing website Yes
Natural Resources and Mines 2015–2018 Department of Natural Resources and Mines website Yes
Premier and Cabinet 2016–2019 Department of Premier and Cabinet website Yes
Public Safety Business Agency 2017–2021 On the Public Safety Business Agency website Yes
Public Service Commission 2015–2018 Department of Public Service Commission website Yes
Queensland Fire and Emergency Services
2015–2018 Public Safety Business Agency website Yes
Queensland Health Not specified Waste plan still being finalised. Yes
Queensland Police Service 2015–2018 Public Safety Business Agency website Yes
Queensland Treasury 2015–2018 Available on request from Queensland Treasury (3035 3526) Yes
Science, Information Technology and Innovation
2015–2018 Department of Science, Information Technology and Innovation website
Yes
State Development 2015–2018 Available on request from the Department of State Development (3452 6901)
Yes
Tourism, Major Events, Small Business and the Commonwealth Games
2016–2018 Department of Tourism, Major Events, Small Business and the Commonwealth Games website
Yes
Transport and Main Roads 2016–2021 Department of Transport and Main Roads website Yes

252525
How
this report was com
piled
6. How this report was compiledLocal governments and private sector waste and recycling entities are required by the Waste Reduction and Recycling Act 2011 to report to the department by 31 August each year on the wastes they have managed during the preceding financial year.
The department collects the data using surveys administered via the Queensland Waste Data System.
The department validates the data as it is submitted, checking to ensure it is correctly formatted and comparable to amounts reported in previous years. Where potential issues are identified (e.g. data entered as kilograms rather than tonnes), the department contacts the respondent, and if warranted, amends the data in the system.
When the validation process has been completed, the data is compiled for analysis. Wastes are counted at the final point of disposal or recovery in the reporting chain (to avoid double-counting for wastes that are transferred between respondents).
Wastes sent to disposal are aggregated by source stream (municipal solid waste, commercial and industrial waste, construction and demolition waste) and waste type (clean earthen material, contaminated soil, acid sulfate soil, asbestos, ash, red mud and other regulated waste).
Wastes sent to recovery are aggregated by material type (such as asphalt, concrete, paper, packaging glass, non-packaging plastics, ferrous metal, green waste, mineral oil, or tyres).
Recovered materials are assigned to source streams for the purpose of calculating recovery rates:
• Green waste, paper and packaging materials, and scrap metal collected by local governments from households are deemed to be municipal solid waste, as are items sold through council tip shops and domestic waste recovered by alternative waste treatment.
• Concrete, asphalt, plasterboard, bricks and tiles, as well as building-related ferrous metal, nonferrous non-packaging metal, timber, non-packaging glass and non-packaging plastic, are deemed to be construction and demolition waste.
• Food waste, cotton gin trash, tyres, other rubber, drilling mud, the remaining paper and packaging materials, green waste, timber, non-packaging plastic, and non-packaging glass are deemed to be commercial and industrial waste.
The regions used in this report are broadly aligned with the Australian Bureau of Statistics SA4 regions. However, because local government areas are the fundamental building blocks for the reporting regions, this report uses local government boundaries for its regions rather than the ABS framework (where the SA4 boundaries cut through local government areas). As a result, Toowoomba Regional Council is included in the Darling Downs-Maranoa region; and Mareeba Shire Council is included in the Cairns region.
The other difference with the ABS regions is that this report uses a combined South East Queensland region. This combines elements of 12 ABS SA4 regions and largely matches the area covered by the Council of Mayors, South East Queensland (excluding Toowoomba).

2626
GlossaryAlternative waste treatment includes a range of processes that convert mixed waste that would otherwise be landfilled into useful products such as compost, fuel or biogas.
Ash is a residue resulting from the combustion of coal and other materials. It contains silica and lime, and can be used in concrete production, organic processing and waste fixation, etc.
Biosolids are organic solids derived from biological wastewater treatment processes that are in a state where they can be used as nutrients and soil conditioning agents, as a source of energy or for some other use. Sewage treatment plants are the main source of biosolids in Queensland.
Commercial and industrial waste (C&I) is produced by business and commerce, and includes waste from schools, restaurants, offices, retail and wholesale businesses, and manufacturing industries. In this report, it includes green waste arising from commercial activities.
Construction and demolition waste (C&D) is non-putrescible waste arising from construction or demolition activity. It may include materials such as concrete, asphalt, bricks, treated timber and steel.
Domestic waste is waste resulting from the ordinary domestic use or occupation of a house, flat, apartment, unit, boarding house, hostel or guesthouse. It does not include waste discharged to a sewer. Domestic waste may also be referred to as household waste. In practice, domestic waste includes the material that householders place in their general waste bins or the mixed waste they self-deliver to landfills and transfer stations.
Drilling mud is a viscous fluid mixture used by the drilling industry to protect drill bits and to transport rock cuttings to the surface.
E-waste comprises waste electrical and electronic products, such as end-of-life computers, televisions, and kitchen appliances etc.
Green waste includes grass clippings, tree, bush and shrub trimmings, branches and other similar material resulting from domestic or commercial gardening, landscaping or maintenance activities. In practice, the green waste data referred to in this report relates to separated material delivered directly to local government facilities and organic processors, and does not include garden waste mixed with other materials in household waste bins.
Headline waste streams (municipal solid waste, commercial and industrial waste, and construction and demolition waste) are wastes generated from everyday household and business activities. These wastes form the basis of state and federal waste targets and reporting. This category does not include hazardous or regulated wastes.
Illegal dumping is the unlawful disposal of large volumes (greater than 200 litres) of waste.

272727
Glossary
Litter is made up of scattered items of rubbish (less than 200 litres), such as cigarette butts, discarded food wrappers and beverage containers.
Monofills are landfills or long-term storage facilities that receive only one type of solid waste (such as tyres, sewage sludge or fly ash) or receive waste from a single source (such as a power station, refinery or mining operation).
Municipal solid waste (MSW) is a combination of domestic waste and other wastes arising from council activities (such as the management of parks and gardens, and the collection of litter and illegally dumped waste).
Organic processing involves the recovery of putrescible wastes through activities such as mulching, composting or vermiculture etc.
Packaging material includes paper, cardboard, glass, plastic, aluminium and steel containers.
Putrescible material describes things that can rot/decay, such as fruit and vegetables.
Recycling involves the collection and processing of waste for use as a raw material in the manufacture of the same or similar products.
Recovered material is waste that has been diverted from landfill. It includes material that has been recycled, reprocessed or stockpiled for future use.
Recovery rate is the proportion of a waste stream that is recovered.
Red mud is a caustic residual from the refining of bauxite into alumina.
Regulated waste includes hazardous wastes listed in Schedule 7 of the Environmental Protection Regulation 2008. This category includes asbestos, pesticides, a range of waste chemicals and chemical compounds, and other industrial wastes.
Reprocessing is the activity of recovering materials from a waste stream for use as a substitute for raw materials. For example, green waste and biosolids can be mulched or composted.
Tip shops are sales outlets at waste facilities (such as local government transfer stations) for items that have been salvaged prior to landfill.

28
Appendix 1: Local government waste services in 2017
Council Population*
Number of red bin
services
Number of yellow bin services
Number of public place
recycling bins
Number of non-residential
services
Number of green bin services
Waste plan published
on web
South-east Queensland
Brisbane City Council 1,184,215 451,657 427,484 827 985 83,934 yes
Gold Coast City Council
576,918 235,837 177,869 96 2,750 23,533 yes
Ipswich City Council 200,123 71,600 71,600 24 300 14,452 yes
Lockyer Valley Regional Council
39,486 14,642 14,642 8 645 0 yes
Logan City Council 313,785 108,261 106,128 31 506 0 yes
Moreton Bay Regional Council
438,313 160,520 158,830 245 2,786 0 yes
Noosa Shire Council 54,033 30,514 26,118 90 309 5,132 yes
Redland City Council 151,987 58,646 58,646 103 2,113 10,348 yes
Scenic Rim Regional Council
40,975 14,145 14,145 207 540 0 yes
Somerset Regional Council
25,173 8,968 1,717 4 38 0 yes
Sunshine Coast Regional Council
303,389 112,058 107,770 213 2,882 22,792 yes
Darling Downs-Maranoa
Balonne Shire Council 4,480 2,383 2,156 0 227 0
Goondiwindi Regional Council
10,837 4,883 0 0 0 0 yes
Maranoa Regional Council
12,928 3,862 0 0 0 0 yes
Southern Downs Regional Council
35,622 11,075 11,075 172 0 0 yes
Toowoomba Regional Council
164,595 58,703 57,939 402 1,694 25,332 yes
Western Downs Regional Council
34,197 10,474 10,474 30 1,241 0
Wide Bay
Bundaberg Regional Council
94,453 39,400 39,400 78 1,277 0 yes
Cherbourg Aboriginal Shire Council
1,296 280 280 2 0 0
Fraser Coast Regional Council
102,953 42,211 41,888 77 2,213 0
Gympie Regional Council
50,292 19,602 19,602 28 849 0
North Burnett Regional Council
10,623 3,154 0 6 0 0
South Burnett Regional Council
32,747 11,282 0 1 0 0

2929
Appendix 1
Council Population*
Number of red bin
services
Number of yellow bin services
Number of public place
recycling bins
Number of non-residential
services
Number of green bin services
Waste plan published
on web
Fitzroy
Banana Shire Council 14,607 4,363 0 2 0 0 yes
Central Highlands Regional Council
28,783 9,742 9,742 0 0 0 yes
Gladstone Regional Council
63,288 25,256 25,256 258 1,603 0
Livingstone Shire Council
37,055 11,760 11,750 30 298 0 yes
Rockhampton Regional Council
81,589 31,649 31,649 50 1,680 0 yes
Woorabinda Aboriginal Shire Council
992 245 0 0 0 245
Mackay
Isaac Regional Council 21,563 7,899 8,343 29 2,065 0 yes
Mackay Regional Council
117,703 49,930 49,930 78 883 0 yes
Whitsunday Regional Council
34,626 13,105 0 16 0 0 yes
Townsville
Burdekin Shire Council
17,313 7,084 7,084 68 416 5,352 yes
Charters Towers Regional Council
12,074 4,068 0 1 0 0 yes
Hinchinbrook Shire Council
10,990 5,560 5,560 32 0 0 yes
Palm Island Aboriginal Shire Council
2,602 500 0 0 0 0
Townsville City Council
192,058 79,299 77,296 165 824 0 yes
Cairns
Cairns Regional Council
162,451 71,015 64,828 9 141 0 yes
Cassowary Coast Regional Council
29,396 12,983 0 7 0 0 yes
Douglas Shire Council 11,997 7,328 7,328 24 324 0 yes
Mareeba Shire Council 22,157 6,639 0 1 0 0
Tablelands Regional Council
25,312 12,500 12,500 0 0 0
Yarrabah Aboriginal Shire Council
2,703 470 0 0 0 0

30
Council Population*
Number of red bin
services
Number of yellow bin services
Number of public place
recycling bins
Number of non-residential
services
Number of green bin services
Waste plan published
on web
Remote Queensland
Aurukun Shire Council
1,323 339 0 0 0 0
Barcaldine Regional Council
2,909 1,316 0 0 0 0
Barcoo Shire Council 272 129 0 0 0 0
Blackall-Tambo Regional Council
1,924 642 0 0 0 0
Boulia Shire Council 437 151 0 0 0 0 yes
Bulloo Shire Council 360 100 0 0 0 0 yes
Burke Shire Council 342 120 0 0 0 0
Carpentaria Shire Council
2,051 679 0 0 0 0
Cloncurry Shire Council
3,114 1,069 0 0 0 0
Cook Shire Council 4,424 1,186 0 10 0 0
Croydon Shire Council
300 89 0 0 0 0
Diamantina Shire Council
297 122 0 0 0 0
Doomadgee Aboriginal Shire Council
1,474 410 0 1 0 0
Etheridge Shire Council
819 89 0 0 0 0
Flinders Shire Council 1,569 534 0 0 0 0 yes
Hope Vale Aboriginal Shire Council
967 257 0 0 0 0
Kowanyama Aboriginal Shire Council
984 280 0 0 0 0
Lockhart River Aboriginal Shire Council
747 176 0 0 0 0
Longreach Regional Council
3,727 1,400 0 0 0 0
Mapoon Aboriginal Shire Council
322 110 0 0 0 0
McKinlay Shire Council
810 287 0 0 0 0
Mornington Shire Council
1,196 450 0 0 0 0
Mount Isa City Council
19,332 6,613 0 0 0 0
Murweh Shire Council 4,391 1,804 0 0 0 0
Napranum Aboriginal Shire Council
1,001 260 0 0 0 260

3131
Appendix 1
Council Population*
Number of red bin
services
Number of yellow bin services
Number of public place
recycling bins
Number of non-residential
services
Number of green bin services
Waste plan published
on web
Northern Peninsula Area Regional Council
2,952 950 0 0 0 0
Paroo Shire Council 1,686 551 0 0 0 0
Pormpuraaw Aboriginal Shire Council
785 225 0 0 1 0
Quilpie Shire Council 833 386 0 0 0 0
Richmond Shire Council
800 317 0 0 0 0 yes
Torres Shire Council 3,789 679 0 0 0 0
Torres Strait Island Regional Council
4,785 1,175 0 0 0 0
Winton Shire Council 1,156 435 0 0 0 0 yes
Wujal Wujal Aboriginal Shire Council
296 91 0 1 0 91
* ABS 3218.0 Regional Population Growth, Australia (28 July 2017), Table 3. Estimated Resident Population, Local Government Areas, Queensland