RECRUITING TRENDS Brief 1 Hiring Outlook 2017-18 … TRENDS Brief 1 Hiring Outlook ... Recruiting...
7
RECRUITING TRENDS 2017-18 47th Edition Recruiting Trends 2017—2018 is published by Career Services and the Collegiate Employment Research Institute and copyrighted, © 2017-2018, by Michigan State University. All rights reserved. This electronic version is for individual use only. No part of this electronic report may be reproduced in any form by any electronic or mechanical means (including photocopying, recording, or information storage and retrieval) without written permission from the Institute. Users are not permitted to mount this file on any network servers or distribute this report by email without written permission from the Institute. Material from this report can be used in classrooms and newsletters with proper citation of Michigan State University and the Collegiate Employment Research Institute. BRIEF 1 Hiring Outlook for the Class of 2017-18, including Hiring Plans by Organization Size Key findings from 2017-18 are presented in this research brief. We have broken the release of employer information into a series of short briefs that will be made available over the next six weeks. You can download the briefs from the Collegiate Employment Research Institute.
Transcript of RECRUITING TRENDS Brief 1 Hiring Outlook 2017-18 … TRENDS Brief 1 Hiring Outlook ... Recruiting...
1Recruiting Trends 2017-18
Brief 1: Hiring OutlookRECRUITING TRENDS 2017-18
47th Edition
Recruiting Trends 2017—2018 is published by Career Services and the Collegiate Employment Research Institute and copyrighted, © 2017-2018, by Michigan State University. All rights reserved. This electronic version is for individual use only. No part of this electronic report may be reproduced in any form by any electronic or mechanical means (including photocopying, recording, or information storage and retrieval) without written permission from the Institute. Users are not permitted to mount this file on any network servers or distribute this report by email without written permission from the Institute. Material from this report can be used in classrooms and newsletters with proper citation of Michigan State University and the Collegiate Employment Research Institute.
BRIEF 1Hiring Outlook for the Class of 2017-18, including Hiring Plans by Organization Size
Key findings from 2017-18 are presented in this research brief. We have broken the release of employer information into a series of short briefs that will be made available over the next six weeks. You can download the briefs from the Collegiate Employment Research Institute.
Role in College RecruitingFull-time positions 71%
Internship or co-op positions only 12%
Short-term hiring 7%
Experienced hiring 10%
Key Economic SectorsProfessional, business & scientific services 19%
Manufacturing 12%
Educational services 11%
Finance & insurance services 8%
Government 7%
Healthcare & social assistance 8%
Nonprofits 8%
Key StatesMichigan 16%
Utah 7%
Illinois 6%
Massachusetts 6%
New York 6%
Institutions Where Companies Recruit TalentTwo-year public college 31%
Four-year public college 53%
Four-year private college 43%
Two- & four-year for-profit institution 24%
Institution with bachelor’s & advanced degree programs
72%
Institution with advanced degrees only 11%
Historically black college & university 19%
Hispanic-serving institution 17%
Asian, Asian-Pacific serving institutions 16%
Active Recruiting by Region
International 8%
Entire U.S. 32%
Regional recruiting only 60%
Meet the Completers
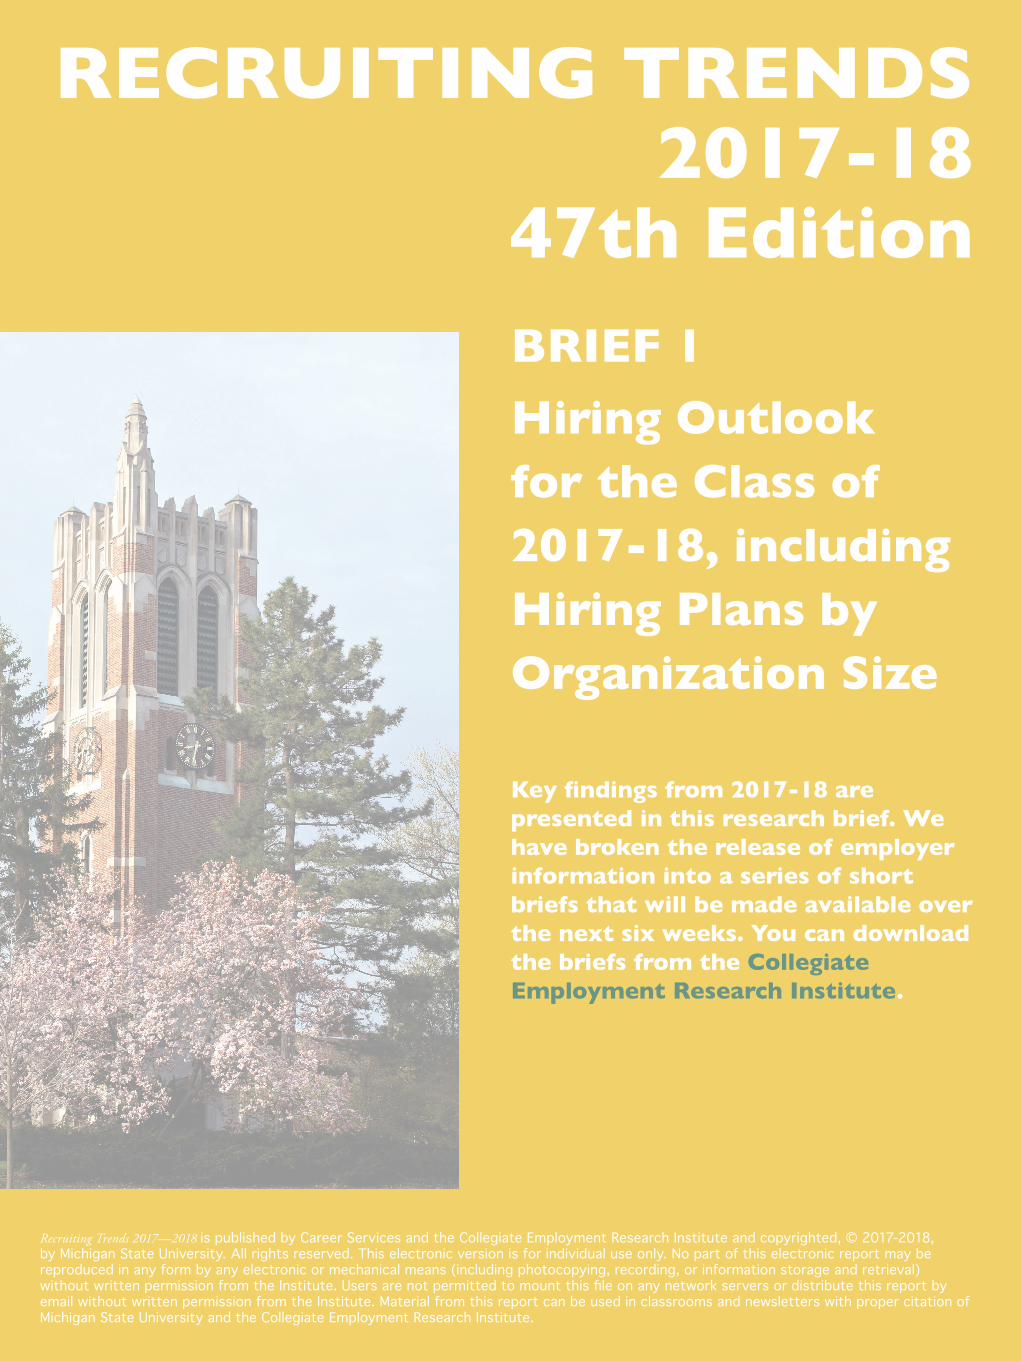
We generated this convenience sample from employers currently seeking college talent through their interactions with college and university career services offices. Nearly 200 career service centers from around the country invited their employers to participate in this study. Approximately 3,370 employers provided information useful for understanding recruiting trends and practices. We will use information provided by those recruiting talent for full-time positions, internships, and co-ops for these research briefs. Readers can use the following key sample characteristics to determine how applicable our survey results are for their campus employer base.
ACKNOWLEDGMENTS
Recruiting Trends 2017-18 is made possible by the efforts of many dedicated and generous colleagues, friends of the institute, and corporate sponsors. We thank all the colleges and universities who encouraged local, regional, and national organizations to participate in our survey and for their confidence in our contribution to research on college recruiting. We also thank our editor, Stephanie Schlick.
We extend special appreciation to several people whose special insights contribute to CERI’s research activities: Jeff Beavers (University of Illinois), Duncan Ferguson (Managing Director, Vantage Leadership Consulting), and James Spohrer (IBM Almaden Research Center).
Survey respondents by organization sizeVery small < 49 employees 27%
Small 50-499 employees 37%
Midsize 500-3,999 employees 20%
Large 4,000-24,999 employees 9%
Very large > 25,000 employees 6%
1Recruiting Trends 2017-18
Brief 1: Hiring Outlook
The college labor market entered unchartered waters by projecting another very strong year for new graduates seeking jobs.
This year we are reporting seven consecutive years of expanding job opportunities. We have never witnessed such a stretch in the 47 years of this report. Usually we set the context for
Recruiting Trends by reviewing various economic indicators and outlooks from differing viewpoints. This year all the indicators point in the same direction. The fundamentals underlying the economy are solid. Job expansion has been strong over the past twelve months. Even the disappointing September jobs report, tempered by several severe weather events, could not dampen the outlook. Moody’s chief economist Mark Zandi predicted a strong economic outlook for the next three years, allowing for the longest sustained job growth in history. . This historic run appears to be full of opportunities and challenges, as detailed in this series of briefs.
Our employersThis year approximately 3,400 employers provided enough information for our analyses. Due to weather events during the data collection period and changes in contacts at key partner schools, the number of respondents fell short of the previous three years. Seventy-one percent are recruiters seeking full-time talent or hiring managers overseeing talent acquisition within their organizations. Other contributors include internship and co-op managers (12%), recruiters seeking experienced talent (10%), and those filling short-term assignments of six months or less (7%). The results presented here focus on the information provided in this and subsequent briefs by full-time recruiters, hiring managers, and internship and co-op managers.
The respondents represent the rich diversity of companies and organizations seeking new college talent. Twenty-seven percent were organizations with 49 or fewer employees; 37 percent, between 50 and 499; 20 percent, between 500 and 3,999; 9 percent, between 4,000 and 25,000; and 6 percent, more than 25,000 employees.
Every major industrial sector (based on major NAIC codes) provided information for this survey. Sectors providing the highest number of respondents included: educational services, finance and insurance services, healthcare and social assistance, manufacturing, and business, professional, and scientific services.
An employer from every state and several territories appeared among the respondents. The respondents were geographically distributed across the country. States providing the highest number of respondents included Illinois, Massachusetts, Michigan, New York, and Utah. (Employers also responded from several foreign countries.)
Gauging employer optimism Eighty-two percent of respondents reported that they hired at least one new college graduate during the 2016-17 academic year. While this figure dropped five percentage points from last year, the good news is that eighteen percent of employers who were not actively hiring last year are entering the college market this year. In examining these expectations in more detail, we find only about three percent of those who hired last year do not intend to hire any new personnel this year. For those entering the labor market after an absence, eighty-six percent expect to hire new college talent.
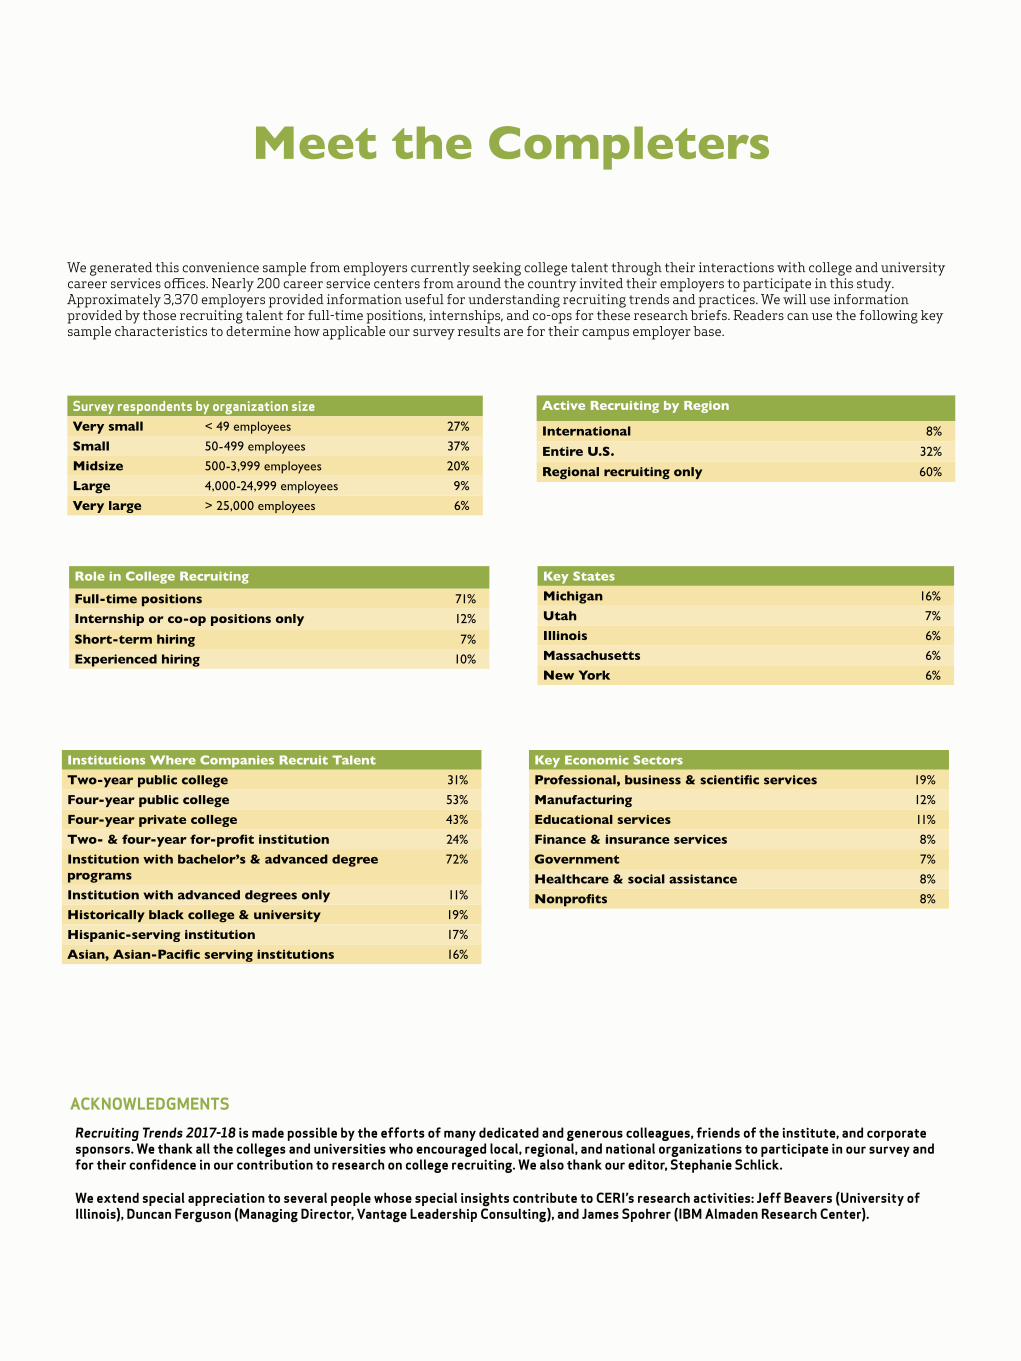
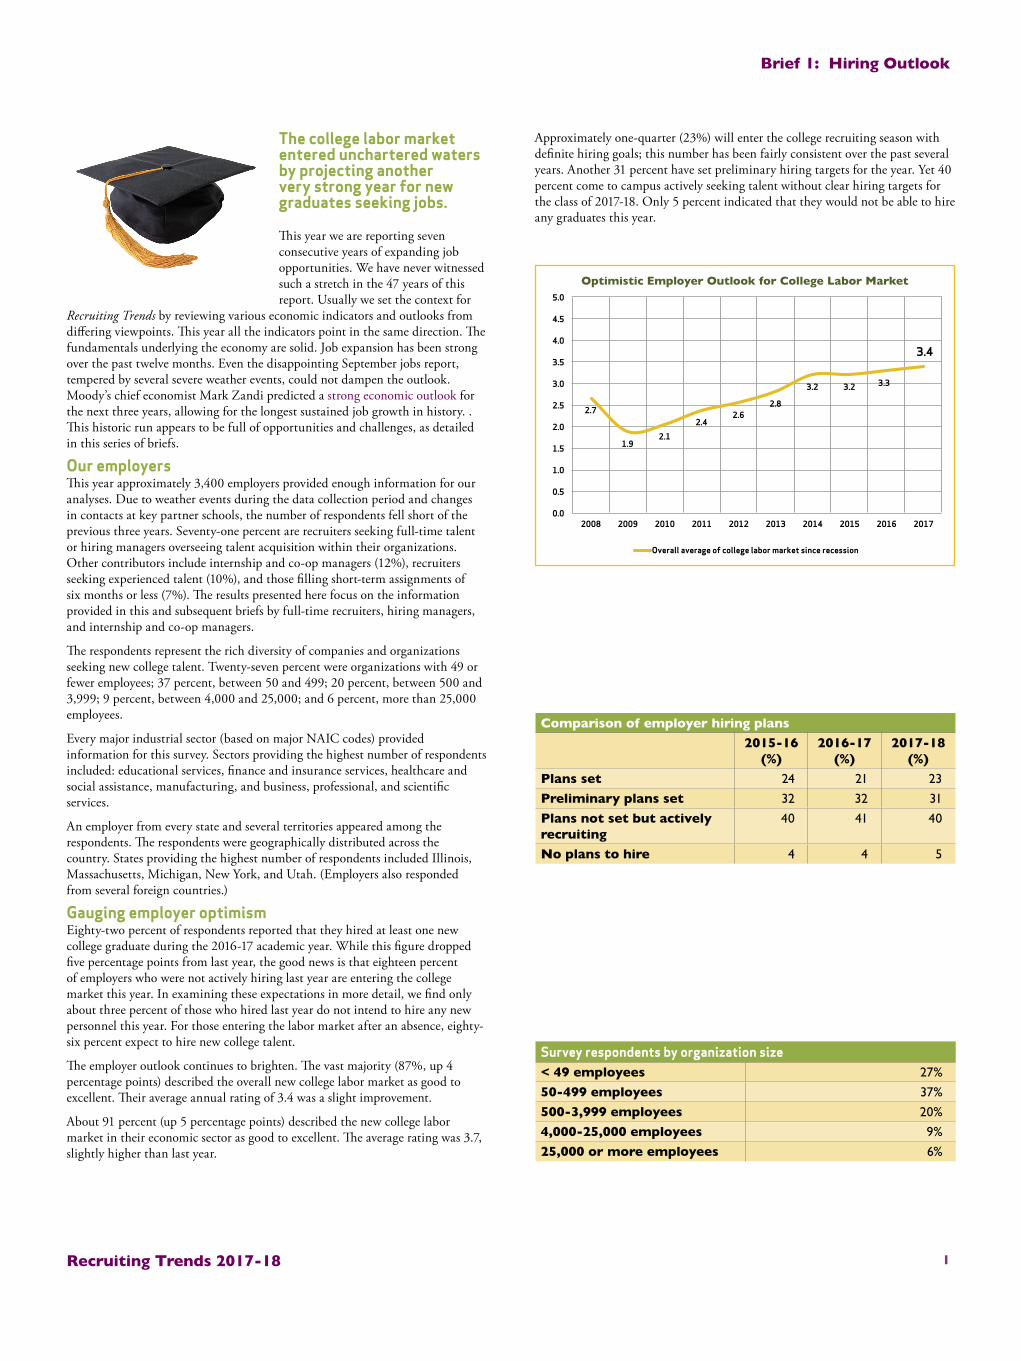
The employer outlook continues to brighten. The vast majority (87%, up 4 percentage points) described the overall new college labor market as good to excellent. Their average annual rating of 3.4 was a slight improvement.
About 91 percent (up 5 percentage points) described the new college labor market in their economic sector as good to excellent. The average rating was 3.7, slightly higher than last year.
Approximately one-quarter (23%) will enter the college recruiting season with definite hiring goals; this number has been fairly consistent over the past several years. Another 31 percent have set preliminary hiring targets for the year. Yet 40 percent come to campus actively seeking talent without clear hiring targets for the class of 2017-18. Only 5 percent indicated that they would not be able to hire any graduates this year.
Survey respondents by organization size < 49 employees 27%
50-499 employees 37%
500-3,999 employees 20%
4,000-25,000 employees 9%
25,000 or more employees 6%
Comparison of employer hiring plans2015-16
(%)2016-17
(%)2017-18
(%)Plans set 24 21 23
Preliminary plans set 32 32 31
Plans not set but actively recruiting
40 41 40
No plans to hire 4 4 5
2.7
1.9 2.1
2.4 2.6
2.8
3.2 3.2 3.3
3.4
0.0
0.5
1.0
1.5
2.0
2.5
3.0
3.5
4.0
4.5
5.0
2008 2009 2010 2011 2012 2013 2014 2015 2016 2017
Optimistic Employer Outlook for College Labor Market
Overall average of college labor market since recession
2Recruiting Trends 2017-18
Brief 1: Hiring Outlook
Employers remain optimistic: 54 percent across all degree levels intend to increase the number of new hires in 2017-18 over the previous year. The increase in hires provides an additional gauge on the level of optimism in the market.
More than 50 percent of employers seeking associate’s degrees (59%, up three percentage points) and bachelor’s degrees (52%, same as last year) plan to increase hiring. About 44 percent of employers recruiting master’s degrees (up 2 percentage points) and 40 percent (drop of 4 percentage points) seeking MBAs expect to increase hiring.
For those organizations that will decrease the number of new college hires compared to last year, the decreases generally fall in the range from 1 to 6 positions (20% of employers across all degree levels). Seventeen percent of organizations seeking associate degrees will be in this range and 21 percent will be decreasing a similar number of bachelor’s degrees. Thirty-eight percent of organizations seeking MBAs and 32 percent of those seeking Master’s degrees will be in this range. Only a few organizations will be reducing the number of positions by 100 or more (1% across all degree levels and 1% among bachelor’s degrees).
Organizations expecting to increase hiring will typically add 1 to 7 positions (38% among these employers across all degree levels). Forty-eight percent of organizations seeking associate’s degrees will be in the range and 39 percent will be adding similar number of bachelor’s degrees. A small group of organizations will be adding more than 100 positions this year (1% at the associate’s level and 2% at the bachelor’s level).
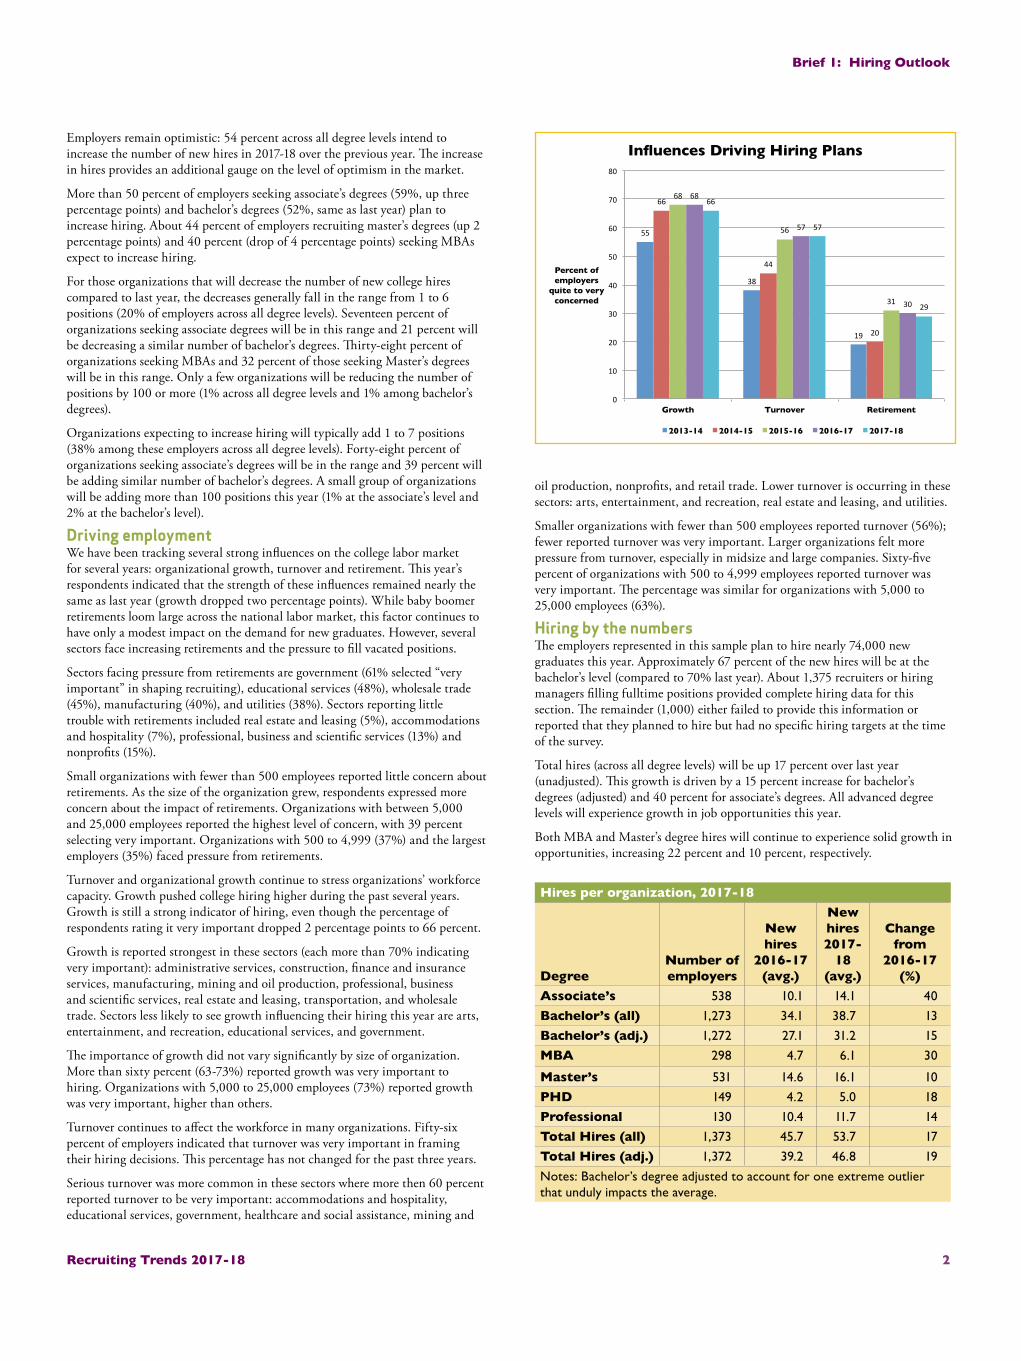
Driving employmentWe have been tracking several strong influences on the college labor market for several years: organizational growth, turnover and retirement. This year’s respondents indicated that the strength of these influences remained nearly the same as last year (growth dropped two percentage points). While baby boomer retirements loom large across the national labor market, this factor continues to have only a modest impact on the demand for new graduates. However, several sectors face increasing retirements and the pressure to fill vacated positions.
Sectors facing pressure from retirements are government (61% selected “very important” in shaping recruiting), educational services (48%), wholesale trade (45%), manufacturing (40%), and utilities (38%). Sectors reporting little trouble with retirements included real estate and leasing (5%), accommodations and hospitality (7%), professional, business and scientific services (13%) and nonprofits (15%).
Small organizations with fewer than 500 employees reported little concern about retirements. As the size of the organization grew, respondents expressed more concern about the impact of retirements. Organizations with between 5,000 and 25,000 employees reported the highest level of concern, with 39 percent selecting very important. Organizations with 500 to 4,999 (37%) and the largest employers (35%) faced pressure from retirements.
Turnover and organizational growth continue to stress organizations’ workforce capacity. Growth pushed college hiring higher during the past several years. Growth is still a strong indicator of hiring, even though the percentage of respondents rating it very important dropped 2 percentage points to 66 percent.
Growth is reported strongest in these sectors (each more than 70% indicating very important): administrative services, construction, finance and insurance services, manufacturing, mining and oil production, professional, business and scientific services, real estate and leasing, transportation, and wholesale trade. Sectors less likely to see growth influencing their hiring this year are arts, entertainment, and recreation, educational services, and government.
The importance of growth did not vary significantly by size of organization. More than sixty percent (63-73%) reported growth was very important to hiring. Organizations with 5,000 to 25,000 employees (73%) reported growth was very important, higher than others.
Turnover continues to affect the workforce in many organizations. Fifty-six percent of employers indicated that turnover was very important in framing their hiring decisions. This percentage has not changed for the past three years.
Serious turnover was more common in these sectors where more then 60 percent reported turnover to be very important: accommodations and hospitality, educational services, government, healthcare and social assistance, mining and
oil production, nonprofits, and retail trade. Lower turnover is occurring in these sectors: arts, entertainment, and recreation, real estate and leasing, and utilities.
Smaller organizations with fewer than 500 employees reported turnover (56%); fewer reported turnover was very important. Larger organizations felt more pressure from turnover, especially in midsize and large companies. Sixty-five percent of organizations with 500 to 4,999 employees reported turnover was very important. The percentage was similar for organizations with 5,000 to 25,000 employees (63%).
Hiring by the numbersThe employers represented in this sample plan to hire nearly 74,000 new graduates this year. Approximately 67 percent of the new hires will be at the bachelor’s level (compared to 70% last year). About 1,375 recruiters or hiring managers filling fulltime positions provided complete hiring data for this section. The remainder (1,000) either failed to provide this information or reported that they planned to hire but had no specific hiring targets at the time of the survey.
Total hires (across all degree levels) will be up 17 percent over last year (unadjusted). This growth is driven by a 15 percent increase for bachelor’s degrees (adjusted) and 40 percent for associate’s degrees. All advanced degree levels will experience growth in job opportunities this year.
Both MBA and Master’s degree hires will continue to experience solid growth in opportunities, increasing 22 percent and 10 percent, respectively.
55
38
19
66
44
20
68
56
31
68
57
30
66
57
29
0
10
20
30
40
50
60
70
80
Growth Turnover Retirement
Percent of employers
quite to very concerned
Influences Driving Hiring Plans
2013-14 2014-15 2015-16 2016-17 2017-18
Hires per organization, 2017-18
DegreeNumber of employers
New hires
2016-17 (avg.)
New hires 2017-
18 (avg.)
Change from
2016-17 (%)
Associate’s 538 10.1 14.1 40
Bachelor’s (all) 1,273 34.1 38.7 13
Bachelor’s (adj.) 1,272 27.1 31.2 15
MBA 298 4.7 6.1 30
Master’s 531 14.6 16.1 10
PHD 149 4.2 5.0 18
Professional 130 10.4 11.7 14
Total Hires (all) 1,373 45.7 53.7 17
Total Hires (adj.) 1,372 39.2 46.8 19
Notes: Bachelor’s degree adjusted to account for one extreme outlier that unduly impacts the average.
3Recruiting Trends 2017-18
Brief 1: Hiring Outlook
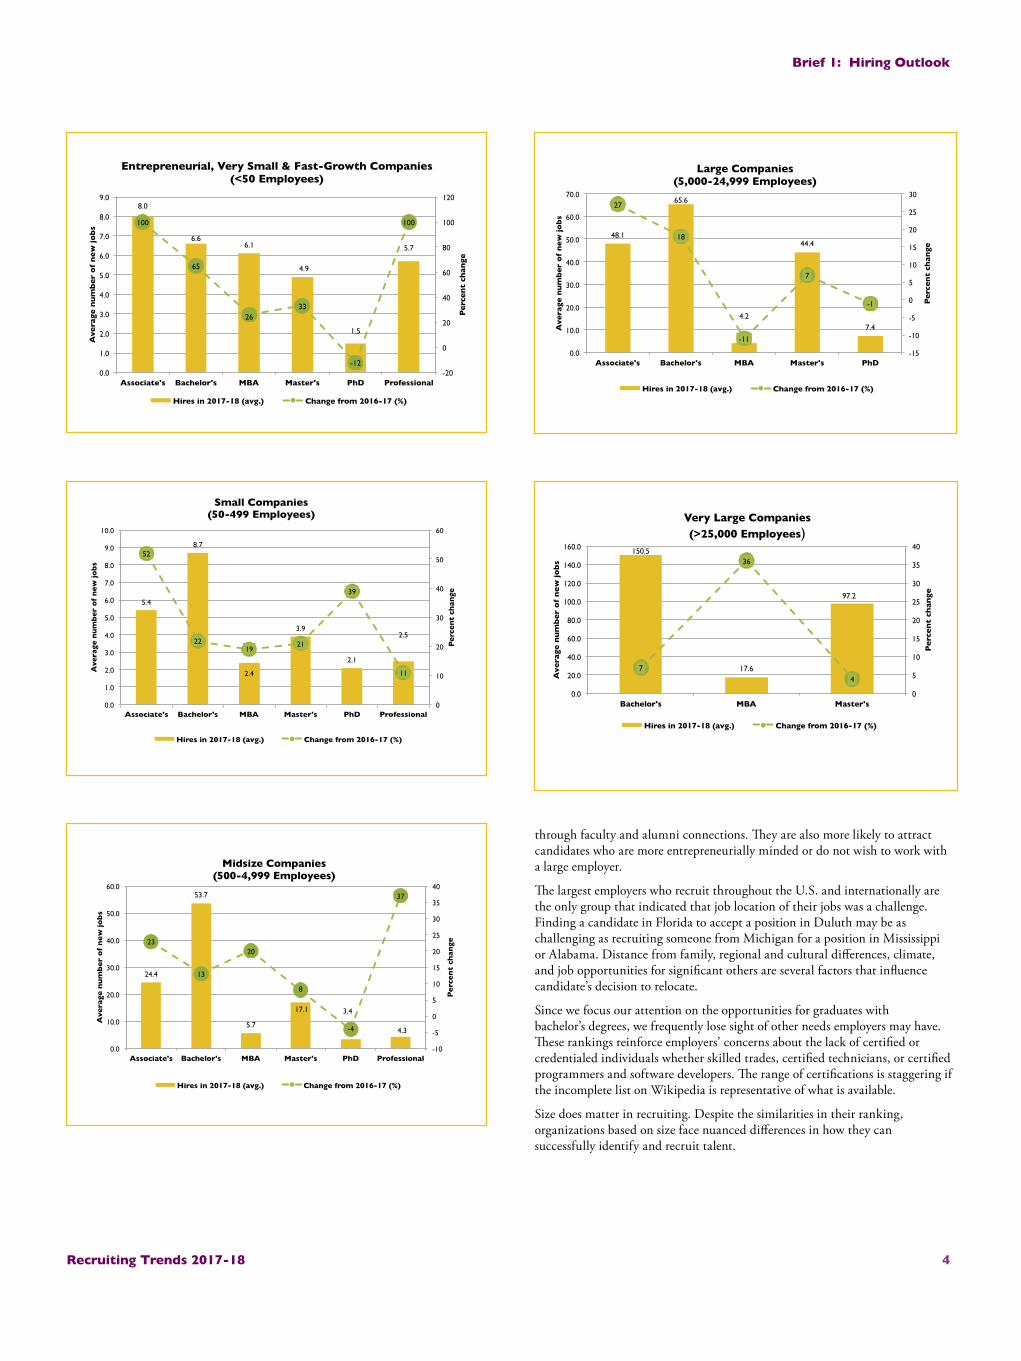
Larger companies are also indicating strong expansion in opportunities, especially at the associate’s and bachelor’s degree levels. For example, bachelor’s opportunities will increase by 13 percent at organizations with 500 to 4,999 employees and 18 percent for those with 5,000 to 24,999. Companies in the 5,000 to 24,999 expressed a weakening of the market for MBAs; this decline was offset by gains in other degree categories. Both these groups reported lower numbers for PhD hires than last year.
The largest companies appear to have backed off their aggressive hiring of the past two years. For the past two yeas, job growth for bachelor’s degrees had exceeded 15 percent for the largest companies, this year the growth is a modest 7 percent; this growth is in line with historical patterns in mature labor markets. These organizations expect to hire more MBAs than last year, up 36 percent.
As you review the following figures you will notice information for selected degrees is missing. All degrees across all size groups are being recruited; however, for those degrees with no information the reporting sample was too small to provide reliable figures. Readers should use caution when interpreting these figures due to the small number of responses for some groups, especially at the higher degree levels.
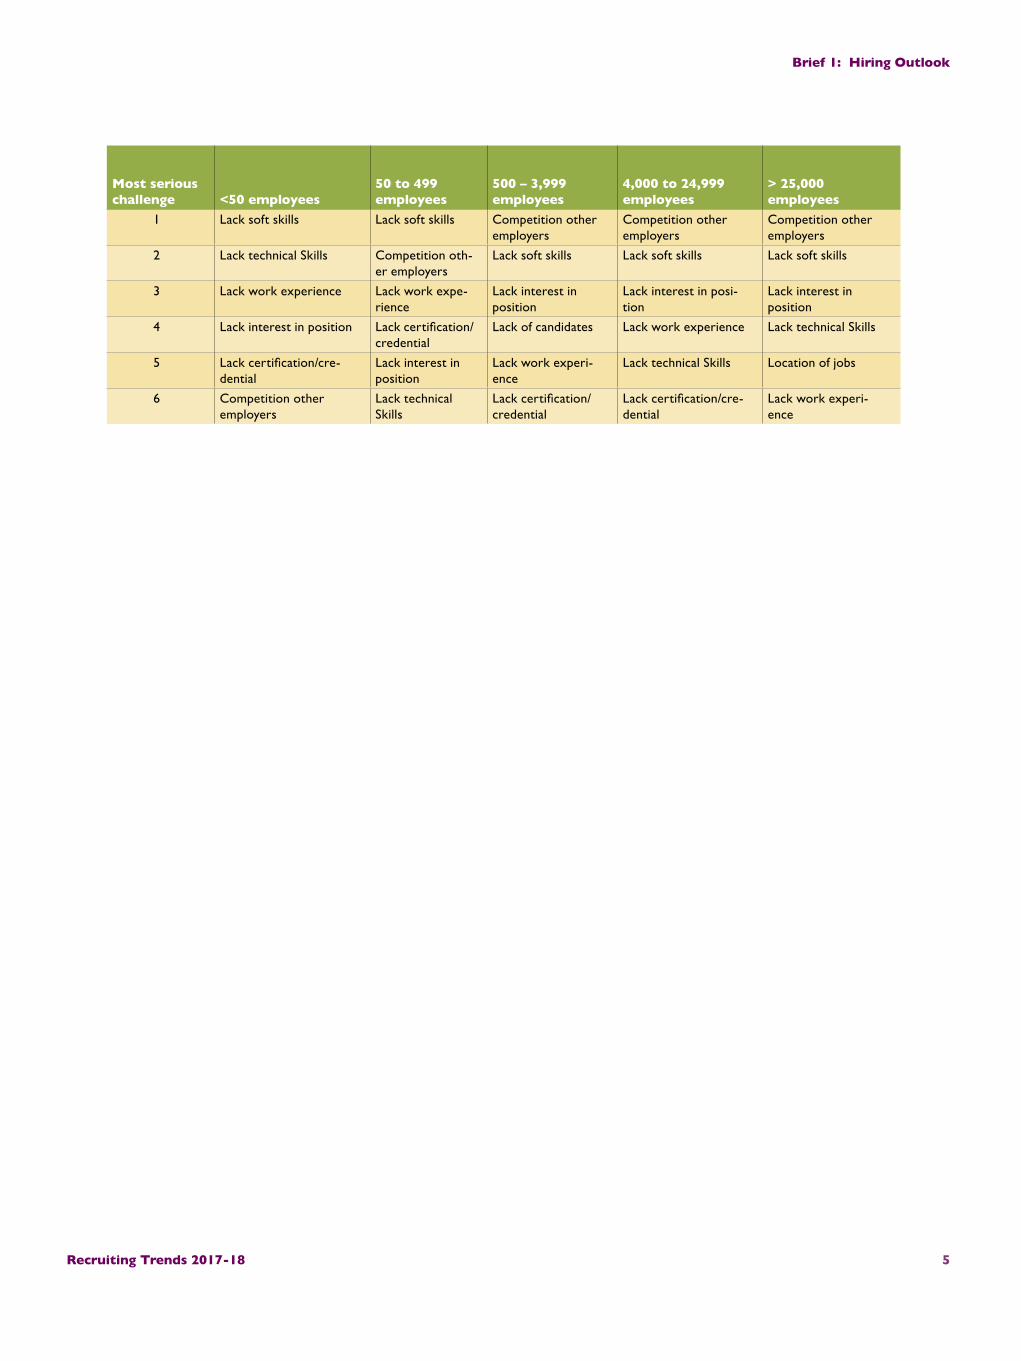
Recruiting Challenges by Organization SizeThe challenges hiring managers and recruiters experience vary depending on organization size. We found subtle differences emerged when we compared rankings. The following table presents the top six challenges for each group in decreasing seriousness with number 1 being the most serious challenge. Smaller organizations (those with fewer than 499 employees) ranked challenges differently from larger organizations. In some cases, however, the smallest organizations and the largest organizations ranked their challenges similarly.
Some insights from the following table are worth mentioning.
Finding candidates with soft skills is the most serious problem for organizations under 499 employees. While larger organizations rank this challenge second overall, their biggest challenge is competition from other employers.
When we think of competition, we often assume an insufficient number of candidates (supply shortage) are available. However, only one group (organizations with 500 to 3,999 employees) placed lack of candidates within their top six challenges. The largest organizations are likely to maintain high visibility among their core recruiting campuses, making it easier to assemble a pool of potential candidates. Because the large organizations often cast a smaller net, they encountered stiff competition from other large companies whose candidates overlapped. Midsize organizations often struggle because they lack that visibility on campus, making it harder to assemble a pool of candidates. Small organizations usually do not visit campus but maintain relationships
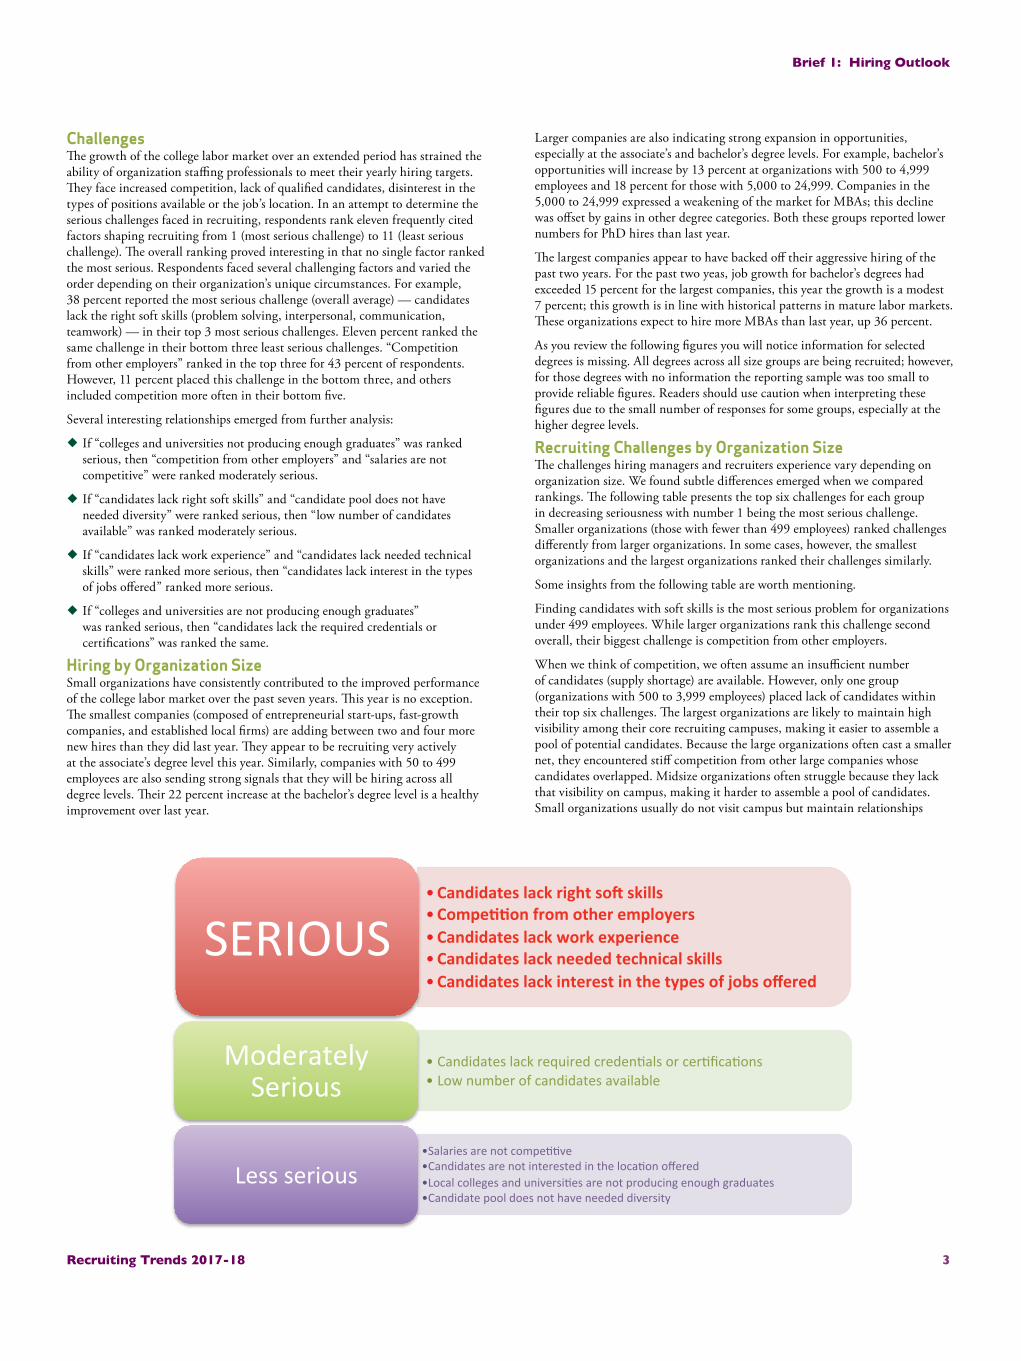
ChallengesThe growth of the college labor market over an extended period has strained the ability of organization staffing professionals to meet their yearly hiring targets. They face increased competition, lack of qualified candidates, disinterest in the types of positions available or the job’s location. In an attempt to determine the serious challenges faced in recruiting, respondents rank eleven frequently cited factors shaping recruiting from 1 (most serious challenge) to 11 (least serious challenge). The overall ranking proved interesting in that no single factor ranked the most serious. Respondents faced several challenging factors and varied the order depending on their organization’s unique circumstances. For example, 38 percent reported the most serious challenge (overall average) — candidates lack the right soft skills (problem solving, interpersonal, communication, teamwork) — in their top 3 most serious challenges. Eleven percent ranked the same challenge in their bottom three least serious challenges. “Competition from other employers” ranked in the top three for 43 percent of respondents. However, 11 percent placed this challenge in the bottom three, and others included competition more often in their bottom five.
Several interesting relationships emerged from further analysis:
¿ If “colleges and universities not producing enough graduates” was ranked serious, then “competition from other employers” and “salaries are not competitive” were ranked moderately serious.
¿ If “candidates lack right soft skills” and “candidate pool does not have needed diversity” were ranked serious, then “low number of candidates available” was ranked moderately serious.
¿ If “candidates lack work experience” and “candidates lack needed technical skills” were ranked more serious, then “candidates lack interest in the types of jobs offered” ranked more serious.
¿ If “colleges and universities are not producing enough graduates” was ranked serious, then “candidates lack the required credentials or certifications” was ranked the same.
Hiring by Organization Size Small organizations have consistently contributed to the improved performance of the college labor market over the past seven years. This year is no exception. The smallest companies (composed of entrepreneurial start-ups, fast-growth companies, and established local firms) are adding between two and four more new hires than they did last year. They appear to be recruiting very actively at the associate’s degree level this year. Similarly, companies with 50 to 499 employees are also sending strong signals that they will be hiring across all degree levels. Their 22 percent increase at the bachelor’s degree level is a healthy improvement over last year.
• Candidateslackrightso1skills• Compe44onfromotheremployers• Candidateslackworkexperience• Candidateslackneededtechnicalskills• Candidateslackinterestinthetypesofjobsoffered
SERIOUS
• Candidateslackrequiredcreden7alsorcer7fica7ons• Lownumberofcandidatesavailable
ModeratelySerious
• Salariesarenotcompe77ve• Candidatesarenotinterestedintheloca7onoffered• Localcollegesanduniversi7esarenotproducingenoughgraduates• Candidatepooldoesnothaveneededdiversity
Lessserious
4Recruiting Trends 2017-18
Brief 1: Hiring Outlook
through faculty and alumni connections. They are also more likely to attract candidates who are more entrepreneurially minded or do not wish to work with a large employer.
The largest employers who recruit throughout the U.S. and internationally are the only group that indicated that job location of their jobs was a challenge. Finding a candidate in Florida to accept a position in Duluth may be as challenging as recruiting someone from Michigan for a position in Mississippi or Alabama. Distance from family, regional and cultural differences, climate, and job opportunities for significant others are several factors that influence candidate’s decision to relocate.
Since we focus our attention on the opportunities for graduates with bachelor’s degrees, we frequently lose sight of other needs employers may have. These rankings reinforce employers’ concerns about the lack of certified or credentialed individuals whether skilled trades, certified technicians, or certified programmers and software developers. The range of certifications is staggering if the incomplete list on Wikipedia is representative of what is available.
Size does matter in recruiting. Despite the similarities in their ranking, organizations based on size face nuanced differences in how they can successfully identify and recruit talent.
8.0
6.66.1
4.9
1.5
5.7
100
65
2633
-12
100
-20
0
20
40
60
80
100
120
0.0
1.0
2.0
3.0
4.0
5.0
6.0
7.0
8.0
9.0
Associate's Bachelor's MBA Master's PhD Professional
Perc
ent
chan
ge
Ave
rage
num
ber
of n
ew jo
bs
Entrepreneurial, Very Small & Fast-Growth Companies (<50 Employees)
Hires in 2017-18 (avg.) Change from 2016-17 (%)
5.4
8.7
2.4
3.9
2.1
2.5
52
2219
21
39
11
0
10
20
30
40
50
60
0.0
1.0
2.0
3.0
4.0
5.0
6.0
7.0
8.0
9.0
10.0
Associate's Bachelor's MBA Master's PhD Professional
Perc
ent
chan
ge
Ave
rage
num
ber
of n
ew jo
bs
Small Companies(50-499 Employees)
Hires in 2017-18 (avg.) Change from 2016-17 (%)
24.4
53.7
5.7
17.1 3.4
4.3
23
13
20
8
-4
37
-10
-5
0
5
10
15
20
25
30
35
40
0.0
10.0
20.0
30.0
40.0
50.0
60.0
Associate's Bachelor's MBA Master's PhD Professional
Perc
ent
chan
ge
Ave
rage
num
ber
of n
ew jo
bs
Midsize Companies(500-4,999 Employees)
Hires in 2017-18 (avg.) Change from 2016-17 (%)
48.1
65.6
4.2
44.4
7.4
27
18
-11
7
-1
-15
-10
-5
0
5
10
15
20
25
30
0.0
10.0
20.0
30.0
40.0
50.0
60.0
70.0
Associate's Bachelor's MBA Master's PhD
Perc
ent
chan
ge
Ave
rage
num
ber
of n
ew jo
bs
Large Companies(5,000-24,999 Employees)
Hires in 2017-18 (avg.) Change from 2016-17 (%)
150.5
17.6
97.2
7
36
4
0
5
10
15
20
25
30
35
40
0.0
20.0
40.0
60.0
80.0
100.0
120.0
140.0
160.0
Bachelor's MBA Master's
Per
cent
cha
nge
Ave
rage
num
ber
of n
ew jo
bs
Very Large Companies(>25,000 Employees)
Hires in 2017-18 (avg.) Change from 2016-17 (%)
5Recruiting Trends 2017-18
Brief 1: Hiring Outlook
Most serious challenge <50 employees
50 to 499 employees
500 – 3,999 employees
4,000 to 24,999 employees
> 25,000 employees
1 Lack soft skills Lack soft skills Competition other employers
Competition other employers
Competition other employers
2 Lack technical Skills Competition oth-er employers
Lack soft skills Lack soft skills Lack soft skills
3 Lack work experience Lack work expe-rience
Lack interest in position
Lack interest in posi-tion
Lack interest in position
4 Lack interest in position Lack certification/credential
Lack of candidates Lack work experience Lack technical Skills
5 Lack certification/cre-dential
Lack interest in position
Lack work experi-ence
Lack technical Skills Location of jobs
6 Competition other employers
Lack technical Skills
Lack certification/credential
Lack certification/cre-dential
Lack work experi-ence