
RECREATIONAL LOCK, RECREATIONAL BOATERS' S … · VA 1222024302, Arnd to thre O"Kfc Of Managetment...
85
NATURAL RESOURCES TECHNICAL SUPPORT PROGRAM MISCELLANEOUS PAPER H.92 5 RECREATIONAL USE OF CHICKAMAUGA LOCK, TENNESSEE, AND RECREATIONAL BOATERS' S .. PERCEPTIONS OF LOCK USE CONFLICTS AD-A262 810 by IN I~fl IDl11~ ~~I I I~Michael E. Patterson, Williamn E.Hamt Department of Forestry, Wildlife. and Fisheries University of Tennessee Knoxville, Tennessee and John P. Titre. Jr. Environmental Laboratory DEPARTMENT OF THE ARMY Waterways Experiment Station, Corps of Engineers 3909 Halls Ferry Road. Vicksburg. Mississippi 39180-6199 DTIC ~wAy ELECTE U / - APR 12 1993 \-, ... --- . / December 1992 Final Report Ap rowvd F9r Pubic Hi iasiŽ. Disir bjio 1 , fl wdparcd for DEPARTMENT OF THE ARMY US. Army Corps of Engineers Washington. DC 20314-1000 .'-ind U.S. Army Engineer District. Nashville Nashville, Tennessee 37202- 1070 S09 079
Transcript of RECREATIONAL LOCK, RECREATIONAL BOATERS' S … · VA 1222024302, Arnd to thre O"Kfc Of Managetment...

NATURAL RESOURCESTECHNICAL SUPPORT PROGRAM
MISCELLANEOUS PAPER H.92 5
RECREATIONAL USE OF CHICKAMAUGA LOCK,TENNESSEE, AND RECREATIONAL BOATERS'
S .. PERCEPTIONS OF LOCK USE CONFLICTS
AD-A262 810 by
IN I~fl IDl11~ ~~I I I~Michael E. Patterson, Williamn E.HamtDepartment of Forestry, Wildlife. and Fisheries
University of TennesseeKnoxville, Tennessee
and
John P. Titre. Jr.
Environmental Laboratory
DEPARTMENT OF THE ARMYWaterways Experiment Station, Corps of Engineers
3909 Halls Ferry Road. Vicksburg. Mississippi 39180-6199
DTIC~wAy ELECTE U/ - APR 12 1993
\-, ... --- . /
December 1992
Final Report
Ap rowvd F9r Pubic Hi iasiŽ. Disir bjio 1 ,
fl wdparcd for DEPARTMENT OF THE ARMYUS. Army Corps of EngineersWashington. DC 20314-1000
.'-ind U.S. Army Engineer District. Nashville
Nashville, Tennessee 37202- 1070
S09 079

Destroy this report when no longer needed Do not return itto the originator.
The findings in this report are not to be construed as anofficial Department of the Army position unless so
designated by other authorized documents
The contents of this report are not to be used foradvertising, publication, or promotional purposes.
Citation of trade names does not constitute anofficial endorsement or approval of the use
of such commercial products.

Form Approved
REPORT DOCUMENTATION PAGE OMo NO 0704-0188
PUOI~C reporting burden for IN% cofle(1iOn of e'tOrMjt.Ot q etirnatec to AverageI hour per lenloa'e, ncludrg tole t."r tot teve'e.mn irrntr.clions. scora.'ng e-sting oat* Wdurtir%gathrering And maintaining tthe data needed, and COrn0le!Ifg and revitwinn the collection of rntOrnhatiof ln d commWisenbre.ding T' ourden rwrln~atv 0' AnyI Other aunlofC 0* rhocollection ot Information rr. cluanq nrggestoni tor reducing INS burden to VVathInqton nteed uartees Services, Directorate for tntorirraro, Otee atiofi nd cir8 R.c. 1115 jetewnoD.,trHrghrway.lu~te1204. Arlington. VA 1222024302, Arnd to thre O"Kfc Of Managetment and budget. Pavenoworit Okedwrtion Protect(0704O0184) *.r~lr~frto'r DC 10l03
1. AGENCY USE ONLY (Leave blank) 2. REPORT DATE 3. REPORT TYPE AND DATES COVERED
December 1992 Final report4. TITLE AND SUBTITLE S, FUNDING NUMBERS
Recreational Use of Chickamauga Lock, Tennessee, andRecreational Boaters' Perceptions of Lock Use Conflicts
6. AUTHOR(S)
Michael E. Patterson, William E. Hammitt,John P. Titre, Jr.
7. PERFORMING ORGANIZATION NAME(S) AND ADORESS(ES) 8. PERFORMING ORGANIZATIONUniversity of Tennessee, Department of Forestry, REPORT NUMBERWildlife, and Fisheries, Knoxville, TN 37996;U.S. Army Engineer Waterways Experiment Station, Miscellaneous PaperEnvironmental Laboratory, 3909 Halls Ferry Road, R-92-5Vicksburg, MS 39180-6199
9. SPONSORING/MONITORING AGENCY NAME(;i AND ADDRESS(ES) 10. SPONSORING/MONITORINGAGENCY REPORT NUMBER
U.S. Army Corps of Engineers,Washington, DC 20314-1000;U.S. Army Engineer District, Nashville,
Nashville, TN 37202-1070
11. SUPPLEMENTARY NOTES
Available from National Technical Information Service, 5285 Port Royal RoadSpringfield, VA 22161.
12a. DISTRIBUTION/ AVAILABILITY STATEMENT 12b. DISTRIBUTION CODE
Approved for public release; distribution is unlimited.
13. ABSTRACT (Maximum 200 words)
Recreational use of the Chickamauga Lock has more than doubled since 1984,when 3,139 recreational craft used the lock. Forty percent of the total annualuse occurs during the month of June. The most common reason for heavy use duringthe month is to attend special events, although other locks in the TennesseeRiver Navigation System have also shown an increase in recreational use since1984. Overall, the study suggests a low level of conflict between recreationaland commercial users. Conflict among recreational users appears to be even lessof a problem. The biggest source of conflict at the current time is not theactual delays, but recreational boaters' inability to predict whether the lockwill be available for use prior to arriving at the dam. Nearly one half of the
boaters indicated that this is a common problem during special events. The Corpscan reduce this source of conflict to some extent by using an FM repeater to
(Continued)
14. SUBJECT TERMS 15. NUMBER OF PAGES
Conflict Recreational boating 82
Lock usage 16. PRICE CODE
17. SECURITY CLASSIFICATION 18. SECURITY CLASSIFICATION 19. SECURITY CLASSIFICATION 20. LIMITATION OF ABSTRACT
OF REPORT OF THIS PAGE OF ABSTRACT
UNCLASSIFIED UNCLASSIFIED
NSN 7540-01-280-5500 Standard Form 298 (Rev 2-89)Preswcribd bV ANSI $10 139-1S•9S8-102

13. (Concluded).
announce the estimated time of recreational and commercial lockages. A major-ity of the respondents supported this management alternative. The second mostpopular management alternative was the construction of a separate lock forcommercial traffic.

PREFACE
The work reported herein was conducted for the U.S. Army Engineer Dis-
trict, Nashville, and was published and distributed under the Natural
Resources Technical Support (NRTS) Program. The NRTS is managed under the
Environmental Resources Research and Assistance Programs (ERRAP), Mr. J. L.
Decell, Manager. Dr. A. J. Anderson was Assistant Manager, ERRAP, for the
NRTS.
This report was prepared by Messrs. Michael E. Patterson and William E.
Hammitt of the University of Tennessee, Department of Forestry, Wildlife, and
Fisheries, and Mr. John P. Titre, Jr., of the EL, WES. Technical reviewers
were Messrs. Jim E. Henderson and Chris W. White of the EL.
The work was conducted under the supervision of Mr. H. Roger Hamilton,
Chief, Resource Analysis Group; D-:. Conrad J. Kirby, Chief, Environmental
Resource Division; and Dr. John Harrison, Director, EL.
At the time of publication of this report, Director of WES was
Dr. Robert W. Whalin. Commander was COL Leonard G. Hassell, EN.
This report should be cited as follows:
Patterson, Michael E., Hammitt, William E., and Titre, John P., Jr.1992. "Recreational Use of Chickamauga LUck, Tennessee, and Recrea-tional Boaters' Perceptions of Lock Use Conflicts," MiscellaneousPaper R-92-5, U.S. Army Engineer Waterways Experiment Station,Vicksburg, MS.
NTIS '[A&I
i~-A
.A,,aI d tl d i Or
Dist

CONTENTS
PREFACE . . . . . . . . . . . . . . . . . . . . . . . . . . . . . . . . 1
CONVERSION FACTORS, NON-SI TO SI UNITS OF MEASUREMENT ..... ......... 4
PART I: STUDY OVERVIEW ............. ........................... 5
Organization of the Report ................... 5Purpose ........................ ............................. 5Scope .......................... ............................. 5Study Need ....................... ........................... 6Statement of the Problem ................ .................... 6Specific Study Objectives ................. .................... 8Executive Summary .................... ........................ 8
PART II: TECHNICAL APPROACH ........... ..................... .I..11
PART III: STUDY AREA ............... ......................... .... 14
PART IV: METHODS .................. .......................... ... 16
Sampling Procedure .............. ....................... ... 16Mail Questionnaire .............. ....................... ... 16Secondary Data ................ ......................... ... 18
PART V: RESULTS .................. .......................... ... 19
Past Lock Use Records ................... ...................... 19Annual use trends ............. ..................... ... 19Use patterns .............. ....................... ... 19Characteristics of recreational lockages .. ......... ... 24
Boater Characteristics ............ ..................... ... 24Socioeconomic characteristics ..... ............... ... 24Boating experience ............ .................... ... 25Origin of boaters ........... ..................... .... 25Reasons for using Chickamauga Lock .... ............ .. 26
Boaters' Perceptions - Typical Weekends .... ............. ... 26Boater reported delays .......... .................. ... 26Boaters' perceptions of problems .... ............. ... 27Avoidance of lock ................. ..................... 29
Boaters' Perceptions - Special Events ..... .............. ... 29Boater reported delays .......... .................. ... 29Boater perception of problems ..... ............... ... 31Avoidance of lock ................. ..................... 31
Support for Potential Management Actions .... ............ .. 32Future Use of the Lock ................. ..................... 33Additional Comments .......................................... 34
PART VI: DISCUSSION OF FINDINGS ......... ................... ... 36
Reasons for Using The Lock ........ .................... ... 36Use Patterns .................. .......................... ... 36
Origin of users ............... ...................... ... 36Distribution of use ............. .................... ... 37Use trends ...................... ........................ 37Future lock use ............... ...................... ... 37
Delays and Perceived Conflict ......... .................. ... 38Commercial delays ............. ..................... ... 38
2

Recreational delays ............. .................... ... 40Delays and lock operation ....... ................. ... 40
Other Potential sources of conflict ..... ............... .. 41Management Alternatives ............. ..................... ... 41Future assessments of conflict ........ ................. ... 43
REFERENCES ...................... ............................. .. 45
TABLES 1-33
APPENDIX A: ONSITE CONTACT SHEET ............... ................... Al
APPENDIX B: MAIL QUESTIONNAIRE ................. .................... B1
3

CONVERSION FACTORS, NON-SI TO SIUNITS OF MEASUREMENT
Non-SI units of measurement used in this report can be converted to SI units
as follows:
Multiply By To Obtain.
feet 0.3048 meters
miles (US statute) 1.609347 kilometers
tons (2,000 pounds, mass) 907.1847 kilograms
4

RECREATIONAL USE OF CHICKAMAUGA LOCK AND RECREATIONAL
BOATERS' PERCEPTIONS OF LOCK USE CONFLICTS
PART I: STUDY OVERVIEW
Organization of the Report
This report is organized into six parts. PART I, STUDY OVERVIEW, con-
tains the study goals and an executive summary of study findings. PARTII,
TECHNICAL APPROACH, presents the framework for viewing conflict in recre-
ational settings that was used as the basis for this study and also discusses
study limitations. PART III, STUDY AREA, describes the study area. PART IV,
METHODS, describes the sampling procedure and survey instrument. PART V,
RESULTS, is a detailed presentation of the study findings. (Tables showing
results are presented in APPENDIX I.) PART VI, DISCUSSION OF FINDINGS, pro-
vides an interpretation of the results in light of study objectives.
Purpose
The purposes of this study were (1) to describe recreational boating use
patterns at Chickamauga Lock, (2) to determine recreational boaters' percep-
tions of the extent and severity of conflicts between lock users, and (3) to
identify recreational boater support for management alternatives that could
reduce the level of conflict. The results of this study extend beyond Chicka-
mauga Lock and can be applied in a general sense to other lock and/or conflict
situations.
ScO~e
The scope of this study included a mail questionnaire survey of recre-
ational boaters who either have used or are interested in using Chickamauga
Lock. The survey focused on use of Chickamauga Lock, perceptions of problems
and conflicts at the lock, and support for various management alternatives to
alleviate perceived problems. The study area was defined as Chickamauga Res-
ervoir from Chickamauga Dam upstream to Watts Bar Dam. Boaters were contacted
5

at the lock and at marinas upstream from the lock. A total of 308 boaters
were contacted during May and June, 1989. Two hundred eighty-nine boaters
(94 %) expressed willingness to participate in the mail questionnaire survey.
Lock use statistics were obtained from two sources within the U.S. Army
Corps of Engineers (CE). Data on past use of the lock (1977-1988) were
obtained from the computerized Performance Monitoring System (PMS). Data on
recreational lockages for the month of June 1989 were provided by Chickamauga
Lock operators.
Study Need
Identification and resolution of user conflicts before these problems
enter the political and legal arena are important to recreation managers.
Once the political stage is reached, recreation managers and planners often
have little control over the situation (Hammitt 1988). Currently, the US Army
Corps of Engineers has no information on the degree of perceived conflict
between recreational and commercial lock users. This study is needed to pro-
vide information on the existing level of conflict from the recreationists'
standpoint. Additionally, information from this study can be used to help
determine, from a recreational standpoint, whether or not an upgrade or modi-
fication of lock facilities is justified.
Statement of the Problem
Navigation on the Tennessee River is supported by 10 locks from Kentucky
Lock in western Kentucky to Fort Loudoun Lock in eastern Tennessee (Figure 1).
The primary users of the lock are commercial barge operators and recreational
boaters. Commercial traffic has priority at the lock. Under current
U.S. Army Corps of Engineers policy, when the two types of users are competing
for limited space in the lock, only one recreational lockage is allowed for
every three commercial lockages. As a result, there is a potential for recre-
ational users to be delayed by commercial use of the lock.
Of the 10 locks in the Tennessee River Navigation System, the potential
for delays and user conflicts is greatest at Chickamauga Lock for two reasons.
The first reason is simply the amount of recreational traffic that the lock
handles. For the last two years (1987-1988), Chickamauga Lock has handied
more recreational craft than any other lock in the system.
6

E-4
zz
* -J U
- 1 ,
M >
2
U
ZI Z I.
* 0
[_ 0
i. 0
.i.
4-
0 4
SII
7

The second reason is the small size of the lock chamber. Unlike the six
downstream locks which are at least 600 by 110 ft,* Chickamauga Lock is only
360 ft by 60 ft. This has a major impact on commercial use of the lock.
While the downstream locks can handle up to four barges at a time, Chickamauga
lock can handle only one barge per lockage. Thus, although Chickamauga has
ranked seventh in terms of the total number of commercial tows and barges
handled during each of the last four years (only the three upstream locks
received less commercial traffic), Chickamauga has ranked second or third in
terms of the total number of individual commercial lockages.
The average tow size at Chickamauga is 4.8 barges, and individual com-
mercial lockages may take up to one hour to complete. Since the current
policy is three commercial lockages for every recreational lockage when compe-
tition occurs, three hour delays are a distinct possibility for recreational
boaters. These long delays may cause frustration, greatly reduce the quality
of the boating trip, and lead to unsafe boating practices.
Specific Study Objectives
Data on the amount of traffic, length of delay, and recreational
boaters' opinions about these delays are necessary to determine the degree of
conflict between recreational and commercial users and to determine if reme-
dial measures are necessary. The objectives of this study were to
1) Determine historical recreational use trends at Chickamauga Lock.
2) Identify daily and seasonal recreational use patterns at ChickamaugaLock.
3) Project future use of the lock.
4) Determine recreational boaters' perceptions of problems and con-flicts at Chickamauga Lock.
5) Identify techniques for reducing perceived problems.
Executive Summary
Recreational use of Chickamauga Lock has more than doubled since 1984
when 3139 recreational craft used the lock. Over the past three years, the
increase in use has occurred primarily during May, June, and July.
* A table of factors for converting non-Si units of measurement to SI unitsis presented on page 4.
8
Recreational use of the lock is not evenly distributed throughout the
year. Forty percent of the total annual use occurs during the month of June.
Heavy use during this month is primarily due to two special events (the Annual
Raft Race and the River Bend Festival) which are held in the city of
Chattanooga.
The most common reason boaters gave for using the lock was to attend the
special events that are held in or below the city of Chattanooga. It is
likely that a large portion of the 4ncrease in use over the past 10 years is
due to increased interest in special events, particularly the River Bend Fes-
tival. However, some of the increase in lock use is probably attributable to
a general increase in boating activity during the period. Seven of eight
other locks in the Tennessee River Navigation System also have shown an
increase in recreational use since 1984.
If future growth in recreational use of the lock follows the pattern set
over the past 10 years, recreational use of the lock will likely reach
15,000 craft by 1993. However, this projection should be considered unreli-
able since it is based only on past use trends. Such a projection cannot
account for the changes in boating facilities which are planned on both sides
of Chickamauga dam. Additionally, while past increases in use are thought to
be largely associated with increased interest in special events, the study
results suggest that recreational use of the lock during special events may be
reaching a saturation point, and that future increases in use may be distri-
buted to less heavily trafficked periods.
Overall, the study results suggest a low level of conflict between rec-
reational and commercial users of the lock at the current time. Less than
30 % of the recreational users felt that commercial delays were a common prob-
lem during typical weekends and less than 20 % felt that such delays were a
common problem during special events.
Conflict among recreational users appears to be even less of a problem.
Even during special events, only 23 % of the respondents perceived
recreational delays to be a common problem. Additionally, less than one-
quarter of the respondents felt that behavior of other recreationists w.3 a
common problem.
The results also suggest that it may be possible to use quantitative
measures associated with delays (frequency of delays and length of delays) as
indicators of the level of perceived conflict. However, the thresholds sug-
gested in this study should be viewed as tentative findings.
9

The biggest source of corflict at the current time is not the actual
delays, but recreational boaters' inability to predict whether or not the lock
will be available for use prior to arriving at the dam. Almost 40% of the
boaters indicated that this is a common problem during special events. Addi-
tionally, this was the only issue for which the number of boaters who felt it
was a common problem exceeded the number who felt it was rarely a problem.
The US Army Corps of Engineers can reduce this source of conflict tosome extent by using an FM repeater to announce the estimated time of
recreational and commercial lockages. Almost 80 % of the study respondents
supported this management alternative. The second most popular management
alternative was construction of a separate lock for commercial traffic; 64 %
of the study respondents supported this action.
10

PART II: TECHNICAL APPROACH
Conflict is often seen only as competition among users for scarce
resources (Hammitt 1988). Considering the nature of the problem in question,
this view may be, to a large extent, true. For most recreationists, lock use
is probably not a goal in itself, but rather a means of reaching specific
recreational opportunities. However, even in this situation, a space alloca-
tion perspective by itself is too limited to adequately address the issue of
conflict.
An appropriate approach for viewing recreational conflict was presented
by Jacob and Schreyer (1980) who defined conflict as "goal interference
attributed to another's behavior." As this definition implies, conflict goes
beyond simple measures such as length of delays. More important than this
type of quantitative measure are boaters' qualitative evaluations of condi-
tions. Rather than knowing that boaters are delayed an average of 30 minutes,
managers need to know if boaters consider this to be a long or a short delay,
and if the delay is so lengthy that it interferes with their recreational
goals.
Another key aspect of Jacob and Schreyer's definition is that goal
interference is attributed to some entity. Originally, recreational conflict
research focused on conflict between users. However, Little and Noe (1984)
pointed out that there may be a number of entities which recreationists iden-
tify as being the source of conflict including: other users, managers, and
the community.
Most relevant to this study are conflicts between recreational and com-
mercial users, conflicts among recreational users, and conflicts between rec-
reational users and lock management. Potential conflicts between recreational
and commercial users were addressed in this study by examining recreational
boaters' perceptions about the frequency and length of delays caused by
commercial use of the lock. These same issues were examined when considering
conflict among recreational users. Additionally, boaters' perceptions about
crowding and the behavior of other boaters were examined.
Conflict between recreational boaters and lock management was not con-
sidered in the original study plans. However, during pre-survey discussions
with marina owners, three potential management related problem areas were
identified. These were the inability of recreational boaters to predict when
the lock will be available for use by recreational craft, the danger of
11

getting trapped on the wrong side of the dam on the return trip, and the num-
ber of recreational boats allowed in the lock at one time. All three of these
issues were examined in the survey.
Before continuing with a discussion of the study, it is necessary to
recognize study assumptions and limitations. The first limitation is the fact
that sampling was conducted during a limited time frame (May-June). This
means it is possible that some lock user groups were not surveyed. For exam-
ple, if some boaters only use the lock during October, to see the Fall colors
in the scenic gorge, we would not have contacted them at the lock during our
study.
Additionally, the heavy rains during June of this year may have influ-
enced the study results. The water level in Chickamauga reservoir rose so
high during some sampling periods that water was being released over the
spillway at a rate exceeding 100,000 cu ft/sec. This apparently caused some
individuals to avoid the lock during these period-, as reflected by the fact
that use of the lock during June 1989 was lower than the use levels recorded
for the last three years. Thus the attitudes of boaters who used the lock
during these periods may not be representative of the attitudes of the entire
boating population. However, we attempted to reduce the effects of the two
problems just described by contacting boaters at marinas as well as at the
lock.
A third limitation of the study is the fact that it represents an
assessment of conditions at one point in time. Thus, although the study pro-
vides information regarding the current level of conflict, it does not provide
any insight into the rate at which the level of conflict is changing. Given
the rate of change in recreational use of the lock over the last five years,
knowing the rate of increase in the level of conflict would be quite useful in
determining the need for conflict management strategies. Unfortunately, there
was no way to obtain this information.
Another study limitation is the fact that users were asked to report the
frequency and length of delays. Previous research (Shelby and Colvin 1982)
suggests that visitors do not always accurately report actual conditions
encountered. A related problem is the fact that boaters were asked about the
'average' experience rather than a specific experience. While this was the
most appropriate approach for assessing the overall level of conflict, it is
not the best way to determine how specific levels of various factors (e.g.
length of delay) influence boaters' perception of conflict. These final two
12

limitations suggest that conclusions drawn about the effects of specific
levels of the quantitative variables examined (frequency and length of delays)
should be viewed as tentative findings.
13

PART III: STUDY AREA
Chickamauga Dam is one of 10 dams in the Tennessee River Navigation
System (Figure 1). It is located on the Tennessee River on the outskirts of
Chattanooga, Tennessee. Chickamauga dam is located at river mile 471, approx-
imately 46 miles upstream from Nickajack Dam and 58 miles downstream of Watts
Bar Dam.
The lock at Chickamauga Dam has a single chamber that measures 360 ft.
long by 60 ft. wide. It was opened to navigation in 1940. Currently, the
lock serves both recreational and commercial users of the river. In 1988,
this lock was used by 7149 recreational craft. Four major special events in
the Chattanooga area encourage recreational boaters to use the lock. These
are the Annual Raft Race (June), the River Bend Festival (June), the Fall
Color Cruise (October), and Christmas on the River (December). An additional
attraction is a scenic gorge below the city of Chattanooga, which is sometimes
promoted as "the Grand Canyon of the east."
Commercial use of the lock in 1988 amounted to approximately 2.5 million
tons. This is relatively low compared to the six downstream locks (5.2 to
32.4 million tons). Two factors contributing to the low volume of commercial
traffic are the upstream location of the lock, and the small size of the lock
chambers at Chickamauga and the two other upstream dams (Tennessee Valley
Authority (TVA) 1988). Currently, these three upstream locks have an annual
capacity of only 5-6 million tons, while the downstream locks can handle
30-35 million tons.
Between Chickamauga Dam and Watts Bar Dam, there are 46 public launch
ramps and 14 marinas with boat mooring facilities. The existing marinas pro-
vide approximately 1100 floating slips and 750 dry storage berths (TVA 1988).
Between Chickamauga Dam and Nickajack Dam, there are only three marinas with
boat mooring facilities and only 14 public ramps. The marinas are Ross's
Landing (in the city of Chattanooga), Walker's Landing (river mile 438), and
Hale's Bar (river mile 431). The first two marinas have mooring facilities
for only 10-15 boats while the third has approximately 50 slips.
Originally, the study area was to include Watts Bar Dam. However, due
to the lower amount of traffic at Watts Bar (in 1988 it handled only about
two-thirds the amount of commercial tonnage and one-third the number of recre-
ational craft that Chickamauga handled) and the lock master's opinion that
14

conflicts were not a problem at the current time, data collection was limited
to Chickamauga Lock.
15

PART IV: METHODS
,Samoling Procedure
The study population consisted of past and present recreational users ofChickamauga Lock. Sampling was conducted at the lock during periods of high
use (weekends and special events). Due to the possibility that some boaters
avoid the locks during peak use periods, sampling also was conducted at six
launch sites (five marinas and one public ramp). Due to the limited number of
downstream marinas, their small size, and/or their distance from the lock,
sampling was conducted only at upstream marinas. The marinas selected ranged
from Chickamauga Marina (less than one mile from the lock) to Shady Grove
Marina (over 16 miles from the lock) (Figure 2). Recreational boaters were
contacted in these areas during May and June. Specific sampling dates and
numbers of boaters contacted are presented in Table 1.
At marinas, boaters were asked to participate in a short (2-3 minute)
on-site interview. The on-site interview included questions dealing with pastuse of Chickamauga Lake and Lock (Appendix II). Boaters were then asked if
they would be willing to participate at a later date in a longer mail survey,
If they were, their names and addresses were obtained. Eight people (5 %)were unwilling to participate in the on-site interview and another twelve
people (8 %) declined to participate in the mail survey. A total of 156 peo-
ple participated in the on-site interviews and 145 people agreed to partici-
pate in the mail survey. In addition, two boaters at Lake Shore Marina were
mailed questionnaires after they encountered a researcher wearing an identifi-
cation tag and expressed a desire to participate in the study.
At the lock, boaters were contacted in the process of locking through.Due to the limited amount of time, it was not possible to conduct the on-site
survey. Boaters at the lock were asked if they would be willing to complete amail-questionnaire. Volunteers were then asked to provide their name and
address. All 142 individuals contacted at the lock expressed willingness to
participate in the study.
Mail Ouestionnaire
The questionnaire had a color cover, was 10 pages long, and measured
7 in. x 10 in. (Appendix III). It was designed to obtain information on:
16

0)
4o
-4 4 fa
U)
04.)
4)
- -4)
'44
C4)
14bLo"4)
17.

(i) general use of Chickamauga Lake, (2) use of Chickamauga Lock, (3) percep-
tions of problems and conflicts at the lock during typical weekends, (4) per-
ceptions of problems and conflicts at the lock during special events,
(5) support for management alternatives to reduce conflicts, and (6) respon-
dent characteristics. A survey package was mailed to respondents within
7 days of the on-site contact. In addition to the 10-page questionnaire, the
survey package contained a postage-paid return envelope and a cover letter
that explained the purpose of the study, assured confidentiality, and stressed
the importance of the reply. After the initial mailing, three follow-up
reminders were mailed at intervals of 7-10 days. The second follow-up mailing
contained a replacement questionnaire while the first and third mailings were
postcard reminders.
Two hundred eighty-nine questionnaires were mailed. Four were returneddue to undeliverable addresses. The response rate for the remaining 285 ques-
tionnaires was 76%.
Secondary Data
Data on past use of Chickamauga Lock were obtained from the U.S. Army
Corps of Engineers Performance Monitoring System. Information obtained
included annual use summaries 1977-1988; monthly use summaries 1985-1988; and
data from individual lockages for June 1988. Data on recreational lockages
for June 1989 were recorded by lock operators at Chickamauga Dam. The infor-
mation recorded included time of lockage, size of lockage, and number of dif-
ferent types of boats in the lockage.
18
PART V: RESULTS
Past Lock Use Records
Annual use trends
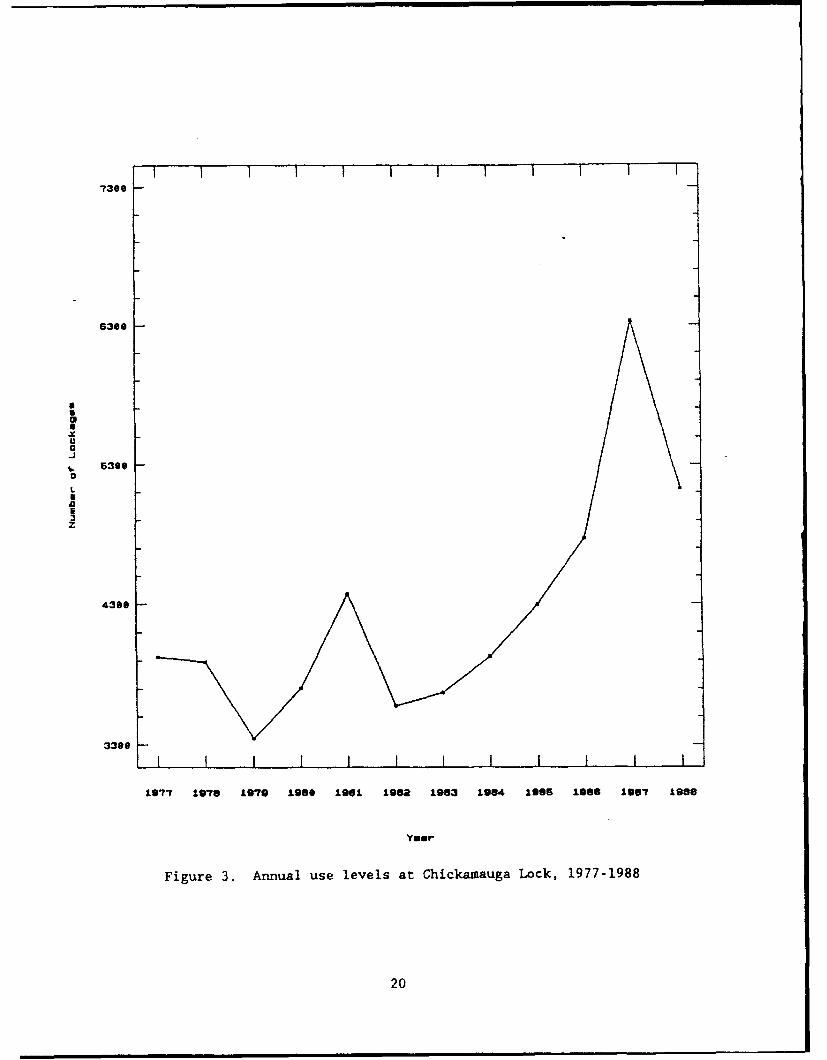
Annual use levels at Chickamauga Lock during the last 12 years
(1977-1988) are presented in Figure 3. Total use in 1977 was 3922 lockages
and total use in 1988 was 5128 lockages. In 1988, 45 % of the lockages were
for recreational traffic, 54 % were for commercial traffic, and the remainder
were for other types of traffic.
Recreational traffic through the lock has increased every year since
1981. (Figure 4). The number of recreational craft using the lock has more
than doubled during this period. The average annual percent increase in the
number of recreational craft during this period was 23.8% (Table 2). The
average annual increase in the number of recreational craft between 1984 and
1987 was 1226 boats per year. However, the annual increase dropped sharply in
1988. During 1988, there was an increase of only 333 recreational boats.
Seven other locks in the Tennessee River Navigation System have shown a
similar trend in recreational use between 1984 and 1988. (Kentucky Lock was
not included in this analysis due to its closure during the summer of 1986.)
The average percent increase in recreational traffic at these locks ranged
from 9 1% to 34.5 % (Table 2). Melton Hill Lock was the only lock to show a
net decrease in use during this period.
Between 1977 and 1988, commercial use levels at Chickamauga Lock have
been cyclical, but the number of lockages during the last four years is
greater than at the beginning of the period (Figure 5). Most years show only
slight changes in use, except for 1987 when the number of commercial lockages
increased 54 %. However, in 1988, the number of commercial lockages dropped
back down to a level similar to that recorded for 1984-1986.
Use patterns
Commercial use of the lock is evenly distributed throughout the year
(Figure 6). Most recreational use of the lock occurs during the month of June
(Figure 6). For the last three years, over 40% of the annual recreational use
of the lock has occurred during this month. Table 3 shows the fluctuations in
monthly use levels between years. Three months (May, June, and July) have
consistently shown large increases in use levels over the last three years.
19
7300
5360a
0E
z
4300
3300
1977 1978 1979 198* 1901 1962 1963 1984 loss less 1967 1966
Year
Figure 3. Annual use levels at Chickamauga Lock, 1977-1988
20

Bases
6259 -
"Craft
L •*- Lockaue
3Cz 45,,
C
a.4
* .*.,,, ... .
". . .. . .... , m . . . . . . . . . ,, .
lee.
1977 1970 1979 1980 1961 1902 1963 1984 1865 1986 1967 1988
Figure 4. Recreational use of Chickamauga Lock, 1977-1988
21

sees ~
4000
" Lockage*
- Tows
3009L
I F- ,4
1977 1978 1979 1960 1981 19t92 1903 1994 less less 1967 less
Year
Figure 5. Commercial use of Chickamauga Lock, 1977-1988
22

I I I I ItI11!I60 -
4.
* Commer. Use
Recree. Use
C
' 38
0
,IJcS
UII
ie
L 2
Ug
I I I I
Jan. grb. Mar, Apr. MaW Jun. Jul. Aug. Sep. Oct. NOV. Dec.
Month
Figure 6. Monthly distribution of commercial and recreationaluse of Chickamauga Lock
23

Other months have shown only slight increases in use or have shown an irregu-
lar pattern of increases and decreases. Only September and November have
shown a net decrease in use since 1985.
The use patterns described in the remainder of this section are based on
data for the month of June. Commercial use of the lock appears to be evenly
distributed throughout the week. Seventy-one percent of the commercial lock-
ages in June of 1988 occurred during the week (Monday-Friday) and 29% occurred
during the weekend (Saturday-Sunday). As might be expected, recreational
traffic is heavier during the weekend than during individual week days
(Table 4). The greatest use occurred on the day of the annual raft race
(511 craft locked through).
On a daily basis, recreational use of Chickamauga Lock begins to
increase at about OOO hours and remains relatively constant until approxi-
mately 2200 hours (Table 5). The amount of time per day devoted to recre-
ational lockages during June 1988 ranged from 1-13 hours during the weekdays
(Monday-Friday) to 8-16 hours on the weekends (Table 6).
Characteristics of recreational lockages
The average size of recreational lockages in June 1989 was 4.6 boats.
Forty-three percent of the recreational lockages contained only one boat. The
largest single lockage contained 55 boats. The most common types of boats
using the lock were runabouts, cabin cruisers, and house boats (Table 7). The
average length of recreational lockages in 1988 was 23 minutes.
Acccrding to PMS data, recreational boaters in 1988 were delayed prior
to entering the lock during 63% of the recreational lockages. On average, the
maximum waiting time (start of lock - arrival time of first boat having to
wait) for those having to wait before entering the lock was 22.17 minutes, or
the equivalent of one recreational lockage.
Boater Characteristics
Socioeconomic characteristics
The boaters' socioeconomic characteristics are presented in Table 8.
Ninety-one percent of the respondents were male. Age of respondents ranged
from 17 to 72 years. The average age was 42 years. Respondents were well
educated, the median education level being 15 years. Average household income
was also high; 69% of the respondents had a household income of $40,000 or
more.
24

Boating exverience
Eighty-six percent of the respondents had boated on Chickamauga Lake
prior to 1989. For those who had boated on the lake during previous years,
the average experience level was 14.5 years. Boaters are most active in the
summer (x-26.9 days) and least active in the winter (x-4.8 days) (Table 9).
Seventy-seven percent of the respondents stated that they had used
Chickamauga Lock at least once previously. The average lock use experience
level was 9.9 years. Twenty-one percent of the respondents had been using the
lock for more than 15 years. The respondents use the lock most frequently in
the summer (x-8.2 times) and least frequently in the winter (x-0.4 times)
(Table 10).
Origin of boaters
Eighty percent of the boaters contacted during the study were residents
of Tennessee (Table 11). Another 18 % were residents of Georgia a-d 1 % were
from Alabama. Most Georgia boaters (75 %) were from the four counties which
border Tennessee in the vicinity of Chattanooga (Table 11). Only 3 % of the
entire sample population were from the Atlanta region (Table 11).
The following data were collected only for boaters who had previous lock
use experience. The type of boats most frequently used by these respondents
were runabouts, cabin cruisers, and house boats (Table 12). Sixty-eight per-
cent of the respondents were marina users while 13 % launched boats from pub-
lic ramps (Table 13). The average distance from respondents' residence to the
location of the launch site was 13.7 miles. Less than 10 % of the respondents
live more than 30 miles from their launch site.
The data in the preceding paragraph describing launch facilities used by
boaters may be biased since sampling was conducted at five marinas and only
one public ramp. Therefore, the following discussion considers only boaters
who were contacted at the lock. The majority of these boaters (61 %) were
from marinas (Table 13). The most frequently cited marina (35 %) was Lake
Shore (Table 8). The percentage of ramp users was somewhat higher than indi-
cated above, but was still less than 20 % of the total number of users
(Table 13).
A final way to examine the origin of boaters is to look at the percent-
age of boaters contacted at various launch sites who indicated that they use
the lock. At least 50 % of the boaters contacted at the five marinas indi-
cated that they have used the lock previously (Table 15). The percentage was
highest for marinas nearest the lock (72 - 87 %) and lowest for marinas
25
farthest from the lock (50 - 57 %). Finally, the percentage of boaters using
the lock was lowest (37.5 %) for boaters contacted at Harrison Bay State Park
ramp. This may reflect the distance from the lock as well as the fact that
most of the ramp users appeared to be primarily interested in fishing. As
indicated in the following section, few individuals use the lock to reach
better fishing areas.
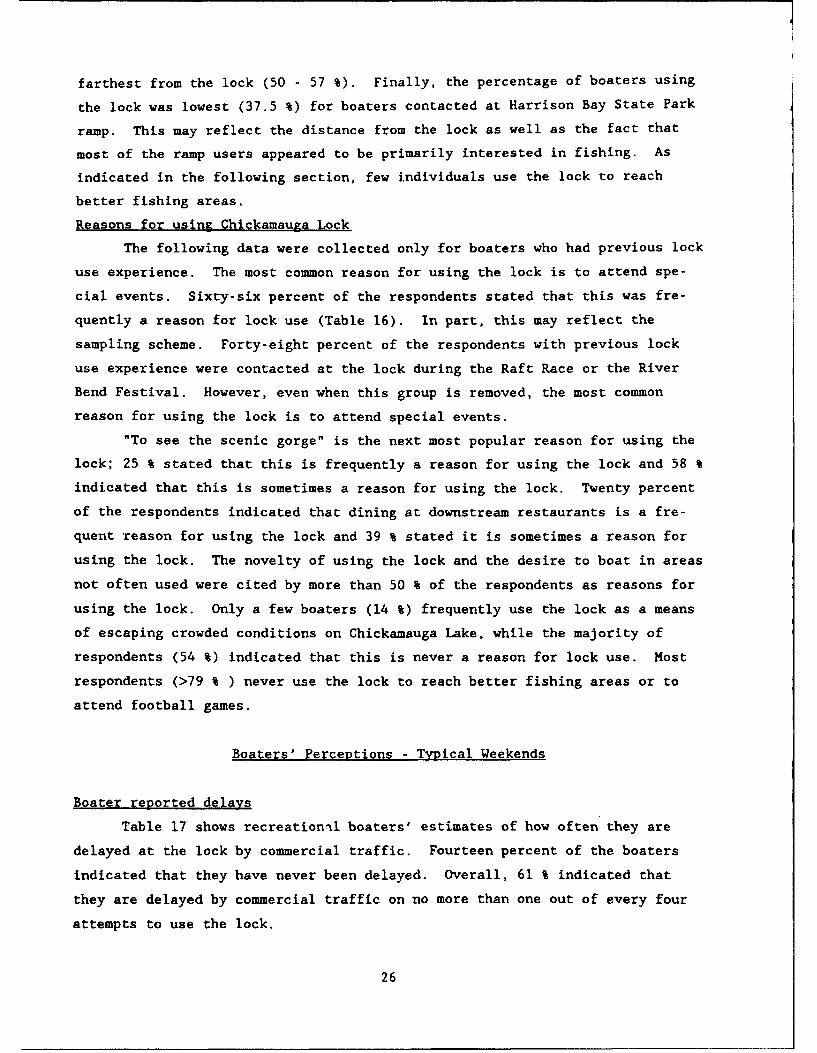
Reasons for using Chickamauga Lock
The following data were collected only for boaters who had previous lock
use experience. The most common reason for using the lock is to attend spe-
cial events. Sixty-six percent of the respondents stated that this was fre-
quently a reason for lock use (Table 16). In part, this may reflect the
sampling scheme. Forty-eight percent of the respondents with previous lock
use experience were contacted at the lock during the Raft Race or the River
Bend Festival. However, even when this group is removed, the most common
reason for using the lock is to attend special events.
"To see the scenic gorge" is the next most popular reason for using the
lock; 25 % stated that this is frequently a reason for using the lock and 58 %
indicated that this is sometimes a reason for using the lock. Twenty percent
of the respondents indicated that dining at downstream restaurants is a fre-
quent reason for using the lock and 39 % stated it is sometimes a reason for
using the lock. The novelty of using the lock and the desire to boat in areas
not often used were cited by more than 50 % of the respondents as reasons for
using the lock. Only a few boaters (14 %) frequently use the lock as a means
of escaping crowded conditions on Chickamauga Lake, while the majority of
respondents (54 %) indicated that this is never a reason for lock use. Most
respondents (>79 % ) never use the lock to reach better fishing areas or to
attend football games.
Boaters' Perceptions - Typical Weekends
Boater reported delays
Table 17 shows recreationil boaters' estimates of how often they are
delayed at the lock by commercial traffic. Fourteen percent of the boaters
indicated that they have never been delayed. Overall, 61 % indicated that
they are delayed by commercial traffic on no more than one out of every four
attempts to use the lock.
26

The average reported length of commercial delays was 72.9 minutes.
Almost 90% of those encountering delays felt that these delays detracted from
the quality of the boating experience (Table 18). Over one-third indicated
that the delays detracted greatly from the experience. Examining length of
the delays versus the effect on trip quality suggests that delays of 60 or
more minutes tend to have a large negative impact on trip quality while
shorter delays have only a slight adverse effect. Only twenty-three percent
of the boaters who reported average delays of 60 minutes or less indicated
that these delays detract greatly from the quality of the boating trip (Fig-
ure 7). However, 63 % of the boaters reporting average delays of more than
60 minutes indicated that these delays detracted greatly from trip quality.
Delays caused by recreational use of the lock are less common.
Thirty-nine percent of the respondents indicated that they have never
encountered such delays and only 14 % indicated that they encounter this type
of delay more than 25 % of the time (Table 19). For those who have encoun-
tered recreational delays, the average reported length of delays was 37.6 min-
utes. While 65 % of the respondents indicated that these delays detracted
from the quality of the experience, only 11 % indicated that the delays
detracted greatly from the experience (Table 20).
Boaters' perceptions of Droblems
Less than 30 % of the boaters felt that delays due to commercial traffic
are a common (often-almost always) problem during weekends (Table 21). A
slightly larger group (32 %) felt these delays are rarely (seldom-never) prob-
lems, and the rest described these delays as sometimes a problem. The vast
majority of respondents (75 %) think that delays due to recreational traffic
are rarely a problem (Table 21).
The uncertainty associated with being able to determine when the lock
will be available for use by recreational craft appears to be a more extensive
problem. Forty-three percent of the respondents described the inability to
predict when the lock will be available for use as a common (often-almost
always) problem and 32 % listed the possibility of getting caught on the wrong
side of the dam as a common problem (Table 21). However, in both cases,
slightly more than one-third of the respondents felt that these were rarely
(seldom-never) problems.
27

100
8o
z"' 60z0a-
W DETRACTS GREATLY
U.0
DETRACTS A LITTLEz
c[Z] NO EFFECT/IL POSITIVE EFFECT
20
0 -DELAYS OF DELAYS GREATER60 MINUTES THAN 60 MINUTES
OR LESS LONG
Figure 7. Length of commercial delay versus effect onrecreational boaters' trip quality during typical week-
ends at Chickamauga Lock
Behaviors of other boaters (rowdy or obnoxious behavior, intoxication,
and unsafe boating practices) were not perceived to be commonplace problems by
most boaters (Table 21). In each case, the majority of boaters (at least
59 %) felt that these are infrequent (seldom-never) problems. Similarly, the
number of boaters allowed in the lock at one time is not seen as a problem by
most boaters (Table 21).
28

Avoidance of lock
Thirty-eight percent of all respondents indicated that they specifically
avoid the lock on some occasions during typical weekdays or weekends. The
most frequently cited reason for avoiding the lock was the possibility of
getting trapped on the wrong side of the dam (Table 22). Sixty-five percent
of those who have specifically avoided the locks indicated that this was one
reason for doing so. The amount of time required to lock through was also
listed as a reason for avoiding the lock by a majority of respondents (56 %).
On the other hand, the presence (too crowded) and behavior (unsafe boating
practices and rowdy behavior) of other boaters do not influence most respon-
dents' decision to avoid the lock (Table 22).
Boaters' Perceptions - Special Events
Boater reDorted delays
Table 23 suggests that delays due to commercial traffic are slightly
less common during special events than during typical weekends. One-third of
the respondents reported never encountering such delays. Overall, 71 % indi-
cated that they are delayed by commercial traffic during no more than one out
of every four attempts to use the lock during special events. Eighty-six per-
cent of those who were delayed by commercial traffic reported that delays
detracted from the quality of the trip experience (Table 24). Forty-one per-
cent indicated that these delays detracted greatly from the experience
(Table 24). The average reported length of delays was 84.4 minutes, As with
commercial delays during typical weekends, examination of length of delay
versus the effect on trip quality suggests that delays greater than 60 minutes
tend to detract greatly from the quality of the boating trip, while shorter
delays usually have only a slight adverse impact. Only 15 % of respondents
who reported average delays of 60 minutes or less felt that these delays
detracted greatly from the trip experience, while 73 % of those experiencing
delays of more than 60 minutes indicated the delays greatly detracted from
trip quality (Figure 8).
Delays due to the amount of recreational traffic are more common during
special events than on typical weekends. Only 22% of the respondents indi-
cated that they have never encountered such delays (Table 25). However, the
majority of boaters (60 %) still indicated that they encounter this type of
delay on no more than one out of every four attempts to use the lock. For
29

100
C,)
so.-
zWj 60
13
c DETRACTS GREATLYU.
'Y- DETRACTS A LITTLEz
o • NO EFFECT/
L..L POSITIVE EFFECT
20
0-DELAYS OF DELAYS GREATER60 MINUTES THAN 60 MINUTES
OR LESS LONG
Figure 8. Length of commercial delay versus effect on recreationalboaters' trip quality during special events at Chickamauga Lock
those who have experienced delays, average reported length of delays was
48.6 minutes, only sightly longer than the length of delays during typical
weekends. Although 76 % of the respondents indicated that delays due to rec-
reational traffic detracted from the boating experience, only 20 % indicated
that these delays detracted greatly from the quality of the boating trip
(Table 26). Only 12 % of the boaters who reported average delays of 60 min-
utes or less indicated that these delays detracted greatly from trip quality,
30

while 77 % oi the respondents reporting delays of more than 60 minutes indi-
cated that delays detracted greatly from the experience (Figure 9).
Boater Rerceotion Of problems
Only 20 % of the boaters felt that delay due to commercial traffic is acommon (often-almost always) problem (Table 27). A much larger group (44%)felt that this type of delay is an infrequent (seldom-never) occurrence. Evenfewer boaters (23 %) believe that recreational delays are a common problem,and twice as many (46 %) believe that recreational delays are rarely a problemduring special events (Table 27).
Similar to the results observed in the previous section, the responsesindicate that the uncertainty associated with determining when the lock willbe available for use by recreational craft is viewed as a problem by maayboaters. Thirty-nine percent of the respondents described the possibility ofgetting trapped on the wrong side of the dam for hours as a common problem and38 % described the inability to predict when the lock would be qvailable foruse as a common problem (Table 27). However, in both cases, approximatelyone-third of the respondents indicated that these are rarely problems.
Again, behaviors of boaters (rowdy or obnoxious behavior, intoxication,and unsafe boating practices) are perceived to be rare problems by most(>52 %) boaters (Table 27). Finally, the number of boats allowed in the lockat a single time is not of concern to most boaters (Table 27).
Avoidance of lock
Forty-four percent of all boaters indicated that they specifically avoidthe lock on some occasions during special events. As with avoidance duringtypical weekends, the danger of getting trapped on the wrong s.ie of the damwas a factor in most respondents' (67 %) decision to avoid the lock duringspecial events (Table 28). However, unlike the results for typical weekends,the level of crowding was also a leading reason for avoiding the lock duringspecial events (Table 28). The length of time required to lock through alsowas listed as a reason for avoiding the lock by most (65 %) of the respondentswho avoid the lock. However, for most boaters, the behavior (unsafe boatingpractices, rowdy behavior) of others is not a reason for avoiding the lock
during special events (Table 28).
31

100
80
Qj)
so-
z
0z0w DETRACTS GREATLY0.O- DETRACTS A LITTLEz0u 40o m NO EFFECT/
CJL POSITIVE EFFECT
20
0 -
DELAYS OF DELAYS GREATER60 MINUTES THAN 60 MINUTES
OR LESS LONG
Figure 9. Length of recreational delay versus effect on recreationalboaters' trip quality during special events at Chickamauga Lock
Support for Potential Management Actions
The two management alternatives receiving the most support (79 % of the
respondents) were the two proposing the use of FM repeaters to announce
estimated times of lockages (Table 29). Widespread support for these two
alternatives seems reasonable in light of the fact that so many boaters see
the uncertainty of lock availability as a problem. The other alternative
aimed at reducing this uncertainty (scheduling regular periods for
32

recreational lock use) also was supported by a majority (62 %) of boaters.
However, 21 % were opposed to this alternative.
The third most popular alternative was construction of a separate lock
for commercial traffic (Table 29). However, 15 % of the respondents opposed
this alternative. Creating more ramps downstream and enlarging the size of
the existing lock were supported by approximately half of the respondents,
while creating more ramps upstream was supported less than half of the
respondents.
Future Use of the L o,s
Most respondents (54 %) who have used the lock in the past indicated
that their future lock use level would be similar to the current use level
(Table 30). Thirty-seven percent expect to use the lock more frequently in
the future and 9 % intend to use the lock less frequently. Those indicating
that use would increase in the future included boaters with a long history of
lock use as well as boaters who have been using the lock only a short time.
Almost 50 % of those who stated that use of the lock will increase in the
future have been using the lock for at least six years.
Forty-nine percent of the respondents who had not used the lock previ-
ously indicated that they do intend to use the lock in the future. Those who
expressed an interest in future use of the lock included boaters with exten-
sive experience on the lake as well as new-comers. Fifty-eight percent of
those who indicated that they would use the lock in the future have been boat-
ing on Chickamauga Lake for six or more years.
Table 31 suggests that changes in the length of delays at the lock will
likely affect future use levels. Seventy-three percent indicated that they
would use the lock more frequently if average waiting time decreases by 30 %,
and 70 % indicated that they would use the lock less frequently if average
waiting time increased by 30 %. The responses also suggest that construction
of additional marinas and other docking facilities below Chickamauga Dam would
lead to increased use of the lock (Table 31). On the other hand, changes in
the number of launch ramps on either side of the dam would appear to have
little impact on lock use (Table 31). However, this may reflect the fact that
most boaters in the survey were marina users. Forty-three percent of the ramp
users indicated that lock use would decrease in the future if more ramps were
33

available downstream. On the other hand, 74 % of the ramp users indicated
that use of the lock would not change if more ramps were built upstream.
Future recreational use of the lock was forecasted for the next five
years by projecting trends based on changes in use over the last 10 years
(1979-1988). Trends in overall lake use and historic changes in lock use
relative to changes in marina capacities could have improved these projec-
tions. However, data on use levels of Chickamauga Lake have not been col-
lected since 1980 and, from the available records, it was not possible to
determine size of marinas at various years. Two models were used to forecast
use: a quadratic model and a linear model. The quadratic model (Figure 10)
appeared to fit the data the best and also had the lowest mean absolute error.
According to this projection, use will exceed 10,000 recreational craft per
year by 1990, and 15,000 craft by 1993.
Additional Comments
The final section of the questionnaire included a blank space along with
a request for respondents to use the remaining space for any additional com-
ments they would like to make. Comments made by at least 2 % of the respon-
dents (4 people) are summarized below. One of the largest group of comments
were praises for Chickamauga Lock operators. Four percent of the respondents
(6 % of boaters with previous lock use experience) commented on the fact that
they found lock operators friendly, courteous, and/or helpful. Another 4 % of
the respondents complained that it is often difficult to communicate with lock
operators. These complaints dealt with both the difficulty in raising the
lock operators by radio and the perception of some respondents that there was
no response when they pulled the cord to signal that they were ready to use
the lock.
Four percent of the respondents felt that there is a need to educate
boaters about proper procedures for using the lock. The boaters who made this
comment included people with lock use experience as well as some who have
never used the lock before. Comments regarding the need for better or more
numerous mooring posts within the lock chamber were made by 3 % of the boat-
ers. Two percent of the boaters complained about the amount of debris in the
lock. All of these were boaters who were contacted at the lock during a
weekend following heavy rains. Finally, two percent of the respondents had
additional complaints about commercial use of the lock.
34

1 r I
l s e o e . . ..~........ ......... ................... ......................................... . .. . ........ .... ......... .. . . . . . . . . ..
4.4
0/
44.
0aJ
..... ............ ..... . .....
l I i j I . .I . i i I i I1981 1984 1987 1990 1993
Year
Figure 10. Projection of future recreational use of Chickamauga Lockfor the next 5 years based on use trends for the past 10 years
(1979-1988)
35

PART VI: DISCUSSION JF FINDINGS
Reasons for Using The Lock
Boaters are apparently using the lock as a means to take advantage of
unique opportunities on the downstream side of the dam rather than as a means
to escape crowded conditions on Chickamauga Lake; 54 % stated that escaping
crowds was not a reason for lock use while more than 60 % stated that boating
in an area not often used was a reason that they used the lock. These unique
opportunities on the downstream side of the lock are primarily special events
(e.g. the River Bend Festival) and the opportunity to boat through the scenic
gorge.
Use Patterns
Origin of users
The draft of the land management plan for Chickamauga Reservoir
described the reservoir as "... of extremely significant local and regional
importance, but only marginally significant outside the region" (TVA 1988,
p.40). Our study supports the idea that, from a recreational use standpoint,
the lock is primarily a regional resource. Eighty percent of those contacted
during the study were from Tennessee. Another 14 % were from four counties in
Georgia which border Tennessee. Although it was initially thought that some
of the increase in lock use in recent years might be due to &n influx of boat-
ers who were displaced from crowded lakes in the Atlanta region, this does not
appear to be the case. Only 3 % of the boaters contacted during this study
were from counties in the Atlanta region.
Most boaters contacted at the lock (61 %) originated from commercial
marinas. Fifty-two percent of the marina users contacted at the lock were
from the two marinas closest to the lock (Chickamauga Marina and Lakeshore
Marina). Use of the lock appears to drop off among marina users farther
upstream than Loret marina. Thus, lock users primarily originate frrm commer-
cial marinas within 7 river miles of the lock.
Ramp users are the second most common type of boater; this group com-
prised approximately 18 % of the lock users. However, this group was so
small, it was not realistic to examine the relationship between distance from
the lock and lock use.
36

Distribution of use
Not unexpectedly, recreational use of the lock is heavier on weekends
than on weekdays. On a daily basis, recreational use appears to be relatively
constant between 0900 hours and 2200 hours, with little use occurring after
2200 and before 0900. Forty percent of all recreational use occurs during
June. In June 1988, 2944 recreational craft used the lock. This was
2.8 times more use than was received during the next most heavily used month
(October). Thus problems are most likely to occur during June. The high
level of use during June is most likely due to the two special events held
during this month (the annual raft race and River Bend Festival).
Use trends
The most common reason boaters gave for using the lock was to attend
special events. It seems likely that a large portion of the increase in use
over the past 10 years is due to increased interest in special events, espe-
cially the River Bend Festival which is held during 10 days in June. The fes-
tival began as a series of street concerts in 1981, but by 1987, River Bend
had become one of the top 10 of 5000 festivals held across the United States
(Chattanooga Times 1987, 1988). Growth in attendance at this event is shown
in Table 32.
However, some of the increase In lock use is probably attributable to a
general increase in boating activity during this period. Seven of eight other
locks in the Tennessee River Navigation System have shown an increase in use
similar to that observed at Chickamauga Lock since 1984. The annual percent
increase in use at the seven other locks has ranged from 9.1 to 34.5 % com-
pared to the 23.8 % increase in use observed at Chickamauga.
Future lock use
Future use of the lock is likely to increase for a number of reasons.
First, there were more current users who expected lock use to increase in the
future (37 %) than there were users who indicated that future use would
decrease (9 %). Also, 49 % of the boaters we contacted who did not currently
use the lock indicated that they plan to use the lock in the future. Addi-
tionally, while upstream marinas are currently at capacity, many plan to
expand. All five of the marinas used as sampling sites reported being at
capacity, and managers at all five hope to expand their facilities over the
next five years. The same is true of Lake Shore Marina (the origin of 35 % of
the marina users contacted at the lock).
37

Additionally, new waterfront developments are planned downstream. One
is a freshwater aquarium that will feature restaurants and shops. This
development is unlikely to have permanent storage slips, but day use piers are
expected. Powever, official plans for waterfront development have not yet
been submitted to TVA. Also proposed downstream are two new commercial mari-
nas; one with 40-50 permanent slips and the other with 100 slips. Both of
these would be within the city of Chattanooga. TVA has received plans for
both marinas, however, these plans have not yet been approved.
Forecasts based on past use trends suggest that annual recreational use
of the lock will reach 10,000 craft by 1990 and 15,000 craft by 190. How-
ever, this forecast should be considered unreliable for two reasons. First,
these projections are based on past use trends only, and cannot adequately
address the potential changes in boating facilities described above.
Secondly, while much of the past increase in use appears to have been
due to special events, especially those held during June (the raft race and
the River Bend Fe'cival), this trend may be changing. For the last three
years (1986-1988) Lhe annual increase in use during June has been steadily
declining (Table 3), despite the fac.. thar attendance at the River Bend Fes-
tival has been inczeasing (Table 32). Additionally, in 1988, larger increases
in use occurred during the months of May and July (no special events ;_hed-
uled) than during June. These data may indicate that lock use during special
events, at least those held during the month of June, are reaching a satura-
tion point, and that some boaters may be opting to use the lock during less
heavily trafficked periods. This idea is supported by the facts that:
(1) 30 % of the boaters who have used the lock during previous special events
indicate that they currently avoid the lock during some special events because
the lock is too crowded and (2) 82 % of these individuals expect frequency of
future lock use to remain the same or increase.
Delays and Perceived Conflict
Commercial delays
Delays resulting from commercial use of the lock were slightly less
common and were seen by recreationists as less of a problem during special
events than during typical weekends. This may be due to the limited number of
special event days and the fact that commercial use of the lock is evenly
distributed throughout both the year and the week. However, since the dates
38

of these special events are well publicized beforehand, it is also possible
that commercial users arrange their schedules so that they avoid the lock
during these periods as much as possible.
The results suggest that delays of less than 60 minutes in length have
little or no adverse effect on the quality of the boating trip. However, when
delays exceed 60 minutes, most boaters feel that trip quality is greatly
impacted. Currently, the average reported length of commercial delays exceeds
this 60 minute threshold (x-73 minutes during typical weekends and x-84 min-
utes during s-ecial events.) Thus when recreational boaters are delayed by
commercial traffic, they are likely to feel delays greatly diminish trip
quality.
However, the degree of conflict depends on not only the length of
delays, but also on the frequency with which delays are encountered. We felt
that the question which asked boaters to rate their perception of commercial
delays (never a problem to almost always a problem) addressed both issues and
reflected lock users' assessment of the extent of the problem at the current
time. Table 33 suggests that this was the case. Boaters' perceptions about
commercial delays were significantly related both to the frequency of delay
(P<0.0001) and the length of delay (P-0.0004). Overall, the responses to this
question suggest a low level of perceived conflict at the current time. Less
than 30 % of the respondents felt that commercial delays were a common problem
during typical weekends and less than 20 % felt that these delays were a com-
mon problem during special events.
Furthermore, the analysis presented in Table 33 indicates that boaters
begin to consider commercial delays to be a common problem if these delays are
encountered on more than 25 % of their attempts to use the lock and that boat-
ers almost always consider these delays to be a common problem if they are
encountered during 50 % or more of their attempts to use the lock. However,
the study results indicate that even during weekends, when commercial delays
are more common, only 39 % of the boaters encounter delays more than 25 % of
the time and only 24 % encounter delays 50 % or more of the time. Overall
then, this analysis, in addition to the analysis concerning the length of the
delays, indicates that the low level of perceived conflict at the current time
is mainly due to the fact that commercial delays are viewed as an infrequent
occurrences.
39

Recreational delays
Delays resulting from recreational use of the lock during typical week-
ends are infrequent (less than 15% of the boaters reported encountering such
delays on more than one out of every four attempts to use the lock) and are of
relatively short duration (x-38 minutes). As a result, most boaters did not
perceive these delays to be an extensive problem; 75 % stated that these
delays are seldom to never a problem and only 6 % indicated that these are
common problems, Additionally, only 11 % of the boaters felt these delays are
detracting greatly from trip quality. Finally, even among those who specifi-
cally avoid the lock on weekends, only 25 % indicated that crowded conditions
were a reason for doing so.
Recreational delays are more common during special events and are about
11 minutes longer than on typical weekends. Even so, these delays are not
viewed as an extensive problem by most boaters; only 23 % described them as
common problems. However, unlike typical weekends, the amount of recreational
use the lock receives during special events is an important factor in the
decision of most boaters (67 %) who avoid the lock during these periods. In
summary, although the amount of recreational use the lock receives during
special events is not viewed as a common problem by most lock users, use level
is high enough so that about 28 % of the respondents consider it a reason to
avoid the lock.
Delays and lock operation
As discussed earlier, an important aspect of understanding conflict in
recreational settings is determining the entity to which goal interference is
attributed. For example, problems resulting from delays can be attributed to
other users or to the manner in which the lock is managed. The questionnaire
specifically addressed two areas of potential conflict that might be attri-
buted to lock operation. These were boaters inability to predict when the
lock would be available for use and the potential for getting trapped on the
wrong side of the dam during the return trip.
Of the eight potential problems rated by boaters, these were perceived
to be the most extensive. These were the only issues that more than one-third
of the boaters described as being common problems and the only issues for
which the number of respondents in the 'often-almost always a problem' catego-
ries exceeded the number in the 'seldom-never a problem' categories. Also,
the danger of getting trapped on the wrong side of the dam during the return
trip was the most frequently cited reason for avoiding the lock. Taken with
40

the findings regarding commercial and recreational delays, these results
suggest that the biggest source of conflict at the current time is not the
actual delays themselves, but the uncertainty recreationists face in determin-
ing whether or not they will be able to use the lock, particularly on the
return trip.
Other Potential Sources of Conflict
Four other potential sources of conflict were examined in the study.
Three of these dealt with the behavior of other recreational boaters: rowdy
or obnoxious behavior, unsafe boating practices, and intoxicated boaters. In
no case did more than 21 % of the boaters perceive these behaviors to be com-
mon problems, and in all three cases, over 50 % of the boaters felt that these
behaviors were seldom to never problems. Additionally, the majority of recre-
ational boaters (> 75 %) who avoid the lock during typical weekends indicated
that the behavior of others was not a factor in their decision to avoid the
lock. However, this changed somewhat during special events. Approximately
40 % of those avoiding the lock during special events indicated that the
behavior of others was a reason for doing so. However, this represents only
about 17 % of all the boaters surveyed. In summary, conflict resulting from
the behavior of other boaters does not seem to be an important issue at the,
current time.
The final source of conflict examined dealt with another aspect of lock
operation: the number of boats allowed in the lock at one time. This does
not seem to be a major issue at this time. Only 5 % of the boaters considered
this to be a common problem during typical weekends and only 15 % considered
this to be a common problem during special events.
Management Alternatives
The Corps of Engineers' ability to control between-user conflicts
resulting simply from competition for scarce space is limited since the Corps
cannot restrict the amount of use beyond the physical limitations imposed by
the lock's maximum operating capacity. The two options the Corps has are
enlarging the lock chamber or building a second lock. Slightly less than half
of the boaters (49 %) supported the first option, although only 13 % opposed
41

it. More support was shown for the second option; 64 W of the boaters
supported construction of a second lock.
However, the degree of conflict due to limited space and consequent
delays appears to be relatively low at the current time. The biggest problem
is the uncertainty associated with predicting lock availability. To some
extent, the Corps can reduce this problem by using FM repeaters to announce
the estimated time of the next recreational lockage and/or the next commercial
lockage. There was wide spread suppcrt (almost 80 % of the boaters) for these
management alternatives. Additionally, a repeater would likely reduce the
boaters need to communicate with lock operators on the radio, thereby address-
ing a concern noted in the open ended portion of the questionnaire by 6 % of
the current lock users.
A portion of the FM repeater message could also provide instructions on
lock use procedures. This would serve as a method for educating first time
users, and thus address a concern that 4 % of the respondents expressed in the
open ended portion of the questionnaire.
A second possible means of removing the uncertainty associated with lock
use is scheduling regular periods for recreational lockages. This was sup-
ported by a majority of the respondents (62 %), however, 21 % were opposed.
Those opposed to this alternative may have seen it as an attempt to restrict
recreational use of the lock rather than as a mea.,ý fox making use more pre-
dictable. Finally, another means of reducing the level of uncertainty, sug-
gested by one of the study respondents, would be to install digital signs
displaying the estimated time of the next lockage at both ends of the lock
chamber.
A final way that the Corps could reduce recreational boaters' perception
of conflict with commercial users is by amending the lock use priority policy
so that there is a 1:1 ratio between commercial and recreational lockages.
The benefits of this change, from the recreational standpoint, would be a
reduction in the average length of delay. Since a commercial lockage takes
between 45 anu 60 minutes (H. Lawson pers. commun.), the amended policy should
reduce the average length of delays for recreational boaters to some level
below 60 minutes (the point that our study results suggests may be a threshold
between delays that have little or no effect on trip quality and delays that
detract greatly from trip quality).
42

Future Assessments of Conflict
This study examined the existing level of conflict at Chickamauga Lock.
Overall, although some boaters believe that problems associated with delays
and the beh.avior of other boaters are widespread, the majority of boaters do
not view these as common problems. However, this assessment is only for one
point in time, and the study did not provide insight into the rate at which
perceptions are changing. Therefore, if recreational use of the lock
continues to increase, or if commercial traffic increases, it may become nec-
essary to re-assess boaters' perceptions of conflict.
Our experience during this study suggests that future surveys can be
conducted relatively easily at the lock. We found that it was possible to
contact boaters, inform them of the purpose of the study, and get their names
and addresses in the short time available during lockages. Additionally, we
found that boaters contacted at the lock were very cooperative; all boaters
contacted at the lock agreed to participate in the mail survey and their over-
all response rate was 75 %.
In addition to describing current perceptions of conflict at the lock,
the study results suggest that it may be possible to use quantitative measures
associated with delays (frequency of delays and length of delays) as indica-
tors of the level of perceived conflict. However, the thresholds suggested in
this study should be viewed as tentative findings. This study was not
designed to examine the relationship between quantitative measures and percep-
tions of conflict. Its limitations in this regard have already been described
in the Technical Approach section.
If relationships between quantitative variables and perceived conflict
are examined in a future study, either of the following approaches would be a
more appropriate way of addressing this issue. One approach would be to ask
about reactions to delays encountered during a specific trip, preferably the
trip during which the boater was contacted. Additionally, rather asking about
delays in general, some tije frame should be set. For example frequency of
delays over the past year.
A second technique for addressing this issue is the normative approach.
Norms are evaluative standards that people use to evaluate conditions as
acceptable or unacceptable (Graefe et al. 1984, Shelby, Vaske, and Harris
1988). This approach was first introduced to recreation research in 1978
(Vaske 1978, Shelby and Heberlein 1986), and has been used in a variety of
43

situations including identifying standards for number of encounters (Shelby
1981), identifying standards for perceived ecological impacts (Shelby, Vaske,
and Harris 1988), and identifying standards for wildlife management practices
(Vaske and Donnelly 1988). Methods for applying the normative approach have
been described in detail in Shelby and Heberlein (1986) and Vaske et al.
1986).
44

REFERENCES
Graefe, A. R., Vaske, J. J., and Kuss, F. R. (1984). Social carrying capac-
ity: an integration and synthesis of twenty years of research. Leisure Sci-
ences 6:395-431.
Hammitt, W. E. 1988. The spectrum of conflict in outdoor recreation. In,Proc., Benchmark 1988: a National Outdoor Recreational and Wilderness Forum.USFS-SE Gen. Tech. Rep.
Jacob, G. R. and Schreyer, R. (1980). Conflict in outdoor recreation: atheoretical perspective. J. of Leisure Res 12:368-380.
Little, W. and Noe, F. P. (1984). A highly condensed description of thethought process used in developing visitor research for southeast parks.Xerox paper. Southeast Regional Office, NPS. Atlanta, GA.
Shelby, B. (1981). Encounter norms in backcountry settings: studies of threerivers. Journal of Leisure Research 13:129-138.
Shelby, B. and Colvin, R. (1982). Encounter measures in carrying capacityresearch: actual, reported, and diary contacts. Journal of Leisure Research14:350-360.research.
Shelby, B. and Heberlein, T. A. (1986). Carrying Capacity in Recreation Set-tings. Corvallis, Oregon: Oregon State University Press.
Shelby, B., Vaske, J. J., and Harris, R. (1988). User standards for ecologi-cal impacts at wilderness campsites. Journal of Leisure Research 20:245-256.
Tennessee Valley Authority Resource Development Group. 1988. Draft Chick-amauga Reservoir Management Plan. 213 pp.
Vaske, J. J. (1978). The relationship between personal norms, social norms,and reported contacts in the Brule River visitors' perception of crowding.Masters Thesis, University of Wisconsin, Madison.
Vaske, J. J. and Donnelly, M. P. (1988). Normative evaluations of wildlifemanagement: a comparison of three publics. Paper presented at the NationalRecreation and Park Association Annual Congress, Indianapolis, October.
Vaske, J. J., Shelby, B., Graefe, A. R., and Heberlein, T. A. (1986). Back-country encounter norms: theory, method, and empirical evidence. Journal ofLeisure Research 18:137-153.
45

Table 1
Sample Date. Sample Locations. and Number of Respondents
Contacted for the Chickamauga Lock Study. 1989
Sample Date Number ofSSample Locations Boaters
May 28 Lakesite Marina 19May 29 Shady Grove Marina 28June 3 Chickamauga Lock 11June 4 Gold Point Marina 56
Chickamauga MarinaJune 8 Harrison Bay State Park Ramp 35
Loret MarinaJune 10 Chickamauga Lock 20June 16 Chickamauga Lock 6June 17 Chickamauga Lock 65June 18 Chickamauga Lock 40June 24 Loret Marina 26
TOTAL 306
Table 2
Annual Percent Change in the Number of Recreational Craft
Using Locks in the Tennessee River Navigation
System Between 1984 and 1988
Annual % Change Average % Change
Lock 1985 1986 1987 1988 During Period
Chickamauga 47.9 19.2 23.2 4.9 23.8
Pickwick 90.4 21.1 15.1 11.5 34.5Nickajack 17.9 16.9 20.4 41.4 24.2Wilson 26.1 28.5 9.4 - 0.5 15.9Fort Loudoun 33.4 5.2 11.7 9.7 15.0Guntersville 21.9 15.9 15.6 0.4 13.4Wheeler 18.2 16.6 10.1 3.1 10.9Watts Bar 12.4 7.2 5.6 11.1 9.1Melton Hill -39.0 -33.7 20.3 14.1 - 9.6

Table 3
Between Year Fluctuation in Monthly Recreational Use
of Chickamauga Lock
Change in Number Compared toPrevious Year's Use Level Total Change
MONTH 1986 1987 1988 1985-1988
January -6 12 - 1 5February 5 2 0 7March 30 30 - 4 54April 70 0 84 154May 67 254 137 458June 616 392 126 1134July 187 52 279 518August 262 -39 26 249September -101 121 -224 -204October -274 347 68 141November - 60 142 -179 -97December 94 -29 21 102
Table 4
Distribution of Recreational Lock Use By Period of
Week During the Month of June
Total Lockages Total Craft
Period of Week 928 1989 1989
Weekday (Monday-Friday) 57.1 35.7 13.9
Weekend (Saturday-Sunday) 42.9 67.5 86.1

Table 5
Time of Arrival of Recreational Boats at Chickamauma
Lock During The Month of June, 1988 and 1989.
Arrival % of Total Lockages of Total Boats
Time 1988 1989 1989
0000-0059 3.0 2.5 3.81
0100-0159 1.8 1.3 1.43
0200-0259 0.8 0.9 0.88
0300-0359 0.4 0.6 0.14
0400-0459 0.2 0.0 0.00
0500-0559 0.0 0.3 0.07
0600-0659 1.0 0.0 0.00
0700-0759 2.4 1.3 1.02
0800-0859 2.2 2.2 1.90
0900-0959 4.2 4.1 5.31
1000-1059 4.4 4.4 4.83
1100-1159 5.6 8.1 7.82
1200-1259 6.5 6.2 4.90
1300-1359 6.0 6.9 5.44
1400-1459 6.5 6.9 6.19
1500-1559 6.2 7.5 7.82
1600-1659 7.1 8.1 7.01
1700-1759 6.7 7.8 9.12
1800-1859 5.8 7.8 9.73
1900-1959 6.9 8.1 4.42
2000-2059 6.9 4.4 7.69
2100-2159 6.7 4.7 6.26
2200-2259 4.8 3.4 1.56
2300-2359 4.0 2.5 2.65

Table 6
Amount of Time Devoted To Recreational Lockages
During June 1988
DAY OF TOTAL PERCENTSHOURS OF DAY
1 1.62 6.742 1.52 6.323 . . . .
4 13.48 56.18 Annual Raft Race5 11.50 47.926 3.80 15.837 2.93 12.228 2.95 12.299 1.00 4.17
10 4.12 17.151 1 . . . . .. . . . .12 8.05 33.5413 2.17 9.0314 2.07 8.6115 5.18 21.6016 4.23 17.64 River Bend Festival Starts17 6.97 29.0318 9.48 39.5119 13.28 55.3520 8.58 35.7621 7.10 29.5822 10.25 42.7123 10.68 44.5124 13.13 54.7225 16.12 67.1526 10.92 45.49 River Bend Festival Ends27 6.73 28.0628 2.22 9.2429 1.87 7.7830 1.95 8.13
Time Locking Per Day - SUM(End of lock - Start of lock).

Table 7
Type of Recreational Boats Using Chickamauga Lock
During June 1989
Type of Boat NL Frequency
Runabout 676 51.1
Cabin Cruiser 355 26.8
Houseboat 150 11.3
Pontoon Boat 106 8.0
Bass Boat 26 2.0
Sailboat 9 0.7
Table 8
Chickamauga Lock Use Study Respondents' Socioeconomic
Characteristics. 1989
Number of Percent of
Characteristic Respondents Respondents
GENDER
Male 198 90.8Female 20 9.2
AGE (x - 41.6 yrs)
<20 3 1.420-29 35 16.130-39 66 30.340-49 55 25.250-59 36 16.5
60+ 23 10.6
EDUCATION (median - 15 yrs)
0-12 59 27.113-16 112 51.4
17+ 45 20.6Missing 2 0.9
INCOME
Less than $10,000 3 1.4$10,000-$19,999 10 4.6$20,000-$29,999 25 11.5$30,000-$39.999 30 13.8$40,000-$49,999 40 18.3$50,000-$59,999 25 11.5$60,000 + 68 31.2Missing 17 7.8

Table 9
Chickamauga Lock Use Study Respondents' Level of
Boating Experience
Boating Number of Percent of
Characteristic Respondents Re2ondents
YEARS ON CHICKAMAUGA
LAKE (x-14.5 yrs)
<5 48 26.1
5 - 10 41 22.3
11 - 15 23 12.5
16 - 20 22 12.0
21+ 50 27.2
DAYS PER SEASONSpring (Mar-May) (x-16.8)
<5 28 15.6
5 - 10 52 29.1
11 - 15 31 17.3
16 - 20 29 16.2
21+ 39 21.8
Summer (Jun-Aug) (x-26.9)
<5 5 2.8
5 - 10 25 14.0
11 - 15 28 15.7
16 - 20 31 17.4
21+ 89 50.0
Fall (Sep-Nov) (x-15.7)
<1 42 23.5
5 - 10 44 24.6
11 - 15 31 17.3
16 - 20 30 16.721+ 32 17.9
Winter (Dec-Jan) (x-4.8)
<5 139 76.7
5 - 10 26 14.4
11 - 15 4 2.2
16 - 20 3 1.7
21+ 9 5.0
Table 10Chickawau~a Lock Use Study Respondents' Level of Lock
Use Experience
Boating Number of Percent of
Characteristic Respondens• Respondents
YEARS USING CHICKAMAUGA
LOCK (x-9.9 yrs)
<5 65 40.15 - 10 47 29.0
11 - 15 16 9.916 - 20 14 8.6
21+ 20 12.3
TIMES PER SEASONSpring (Mar-May) (x-3.4)
0 52 32.11- 5 77 47.56 - 10 27 16.7
ii - 20 3 1.921+ 3 1.9
TIMES PER SEASONSummer (Jun-Aug) (x-8.2)
0 10 6.31- 5 69 43.46 - 10 49 30.8
11 - 20 21 13.221+ 10 6.3
TIMES PER SEASONFall (Sep-Oct) (x-3.5)
0 35 22.01- 5 101 63.56 - 10 14 8.8
11 - 20 6 3.821+ 3 1.9
TIMES PER SEASONWinter (Nov-Feb) (x- 0.4)
0 139 86.91- 5 19 11.96 - 10 1 0.6
11 - 20 1 0.621+ 0 0.0

Table 11
County of Residence For Chickamauga Lake Study Respondents
Who Were From The State of Georela
% of Georgia % of TotalN . o$.&.s Boaters
COUNTIES ADJACENT TO TENNESSEE
Whitefield County 16 30.2 5.6Walker County 16 30.2 5.6Catoosa County 7 13.2 2.4Dade County 1 1.9 0.3
CO'UNTIES IN THE ATLANTA REGION
Cobb County 5 9.4 1.7Cherokee Cc-inty 1 1.9 0.3Forsyth County 1 1.9 0.3Fulton County 1 1.9 0.3
INTERMEDIATE COUNTIES
Floyd County 2 3.8 0.7Chattooga County 1 1.9 0.3Gordon County 1 1.9 0.3Rabun County 1 1.9 0.3
Table 12
Type of Boats Respondents Most Freguentlv Use When
Locking Through Chickamauga Dam
Type of Boat N Percent
Runabout 49 31.8
Cabin Cruiser 38 24.7
Houseboat 34 22.1
Bass Boat 10 6.5
Pontoon Boat 13 8.4
Sailboat 2 1.3
>1 Boat Listed 8 5.2

Table 13
Type of Launch Sites Used By Study Respondents When
Locking Through Chickamauga Dar
Type of Boat N Percent
ALL RESPONDENTS
Marina i11 67.7Public Ramp 21 12.8Private Dock 11 6.7Other (Unspecified) 5 3.0>1 Type Listed 16 9.8
RESPONDENTS CONTACTED AT THE LOCK
Marina 54 61.4Public Ramp 16 18.2Private Dock 9 10.2Other 2 2.3>1 Type Listed 7 8.0
Table 14
Marinas Used By Boaters Who Were Contacted at the Lock.
ApproximateDistance Cumulative
Marina N From Lock Percent Percent
Lake Shore 19 0.5 35,2 35.2
Chickamauga 9 0.5 16.7 51.9
Big Ridge 4 4.2 7.4 59.3
Chatt. Yacht Club 1 1.9 61.1
Loret 12 6.5 22.2 83.3
Harrison Bay 3 7.6 5.6 88.9
Harbor Lights 3 10.9 5.6 94.4
Lake Site 2 11.0 3.7 98.1
B and B 1 41.6 1.9 100.0

Table 15
Percent of Respondents At Each Launch Site Who Indicated
That The Have Used Chickamauga Lock
Approximate Boaters That Boaters ThatDistance Have Used Have Not Used
Marina N From Lock. Lock (%) Lock (%)
Chickamauga 32 0.5 72.0 28.0
Gold Point 23 1.5 87.0 13.0
Loret 26 6.5 73.1 26.9
Harrison Bay 32 7.6 37.5 62.5
Lake Site 16 11.0 50.0 50.0
Shady Grove 28 16.9 57.1 42.9
Table 16
Boaters' Ratings of How Often Each of The Following Is
a Reason For Using Chickamauga Lock
Never Sometimes Frequentlya Reason a Reason a Reason
Reason I % %
To attend a special event 11.0 23.2 65.9
To see the scenic gorge 17.8 57.7 24.5
To eat at one of the downstream 40.5 39.3 20.2restaurants
Because it is a novel experience 40.9 43.3 15.9for myself or my guests
To boat in an area I do not 38.9 54.9 6.2often use
To escape crowds on Chickamauga 53.7 32.7 13.6Lake
To reach better fishing areas 79.5 13.7 6.8
To attend football games 95.1 3.7 1.2

Table 17
Percent of Attemnts During Which Recreational Boaters Are
Delayed By Commercial TrAffic When Attempting To
Use Chickamauga Lock During Tvoical Weekends
Percent of Number of Percent of CumulativeAttempts Boaters brSS•._
0 21 14.4 14.41 2 1.4 15.82 1 0.7 16.45 10 6.8 23.3
10 30 20.5 43.815 1 0.7 44.518 1 0.7 45.220 9 6.2 51.425 14 9.6 61.030 10 6.8 67.833 1 0.7 68.535 4 2.7 71.240 7 4.8 76.050 18 12.3 88.460 5 3.4 91.870 2 1.4 93.275 3 2.1 95.280 2 1.4 96.690 2 1.4 97.994 1 0.7 98.6
100 2 1.4 100.0
Table 18
Effect of Commercial Delays on The Quality of The
Boating Trip During Tyvical Weekends
% ofEffect on Experience N Respondents
Detracted greatly from the quality 45 36.6of the boating trip
Detracted a little from the quality 64 52.0of the boating trip
Had no effect on the quality 11 8.9of the boating trip
Had a positive effect on the quality 3 2.4of the boating trip

Table 19
Percent of Attempts During Which Recreational Boaters Are
Delayed By Recreational Traffic When Attempting To
Use Chickamauga Lock During Tyxical Weekends
Percent of Number of Percent of CumulativeAttempts Boaters Boaters Percgnt
0 57 39.0 39.01 3 2.1 41.12 3 2.1 43.25 12 8.2 51.4
10 28 19.2 70.515 2 1.4 71.920 11 7.3 79.525 9 6.2 85.640 4 2.7 88.450 9 6.2 94.560 2 1.4 95.970 1 0.7 96.680 3 2.1 98.690 1 0.7 99.3
100 1 0.7 100.0
Table 20
Effect of Recreational Delays on The Quality of The
Boating TriR During Tyvical Weekends
% ofEffect on Experience N Resoondents
Detracted greatly from the quality 10 11.4
of the boating trip
Detracted a little from the quality 47 54.3of the boating trip
Had no effect on the quality 29 33.0of the boating trip
Had a positive effect on the quality 2 2.3of the boating trip

41 (N 4,0 04 1ý 04
'4- %A -4 C14'0 - r-. 0n (3%
4.)
ci 4) a)
3 4. 0".
:3a 0-
0 w
ad ) 04ul
.0 4) CD 4th cn (N '.40u) 0 0
'-.
~ a)
4N r-4 -44 (No a)~~C; In 0ý IA iC Ný n
04 -4 C4 fn (N N '
ý4 0Cc Z
,4=
4) ~~ C-4 C4 n
061 ul 0') 1ý L44.z 4 C1 "4 V ~ l 44 en
44.4 r. 0140 4)0 0'U..
(A 4)44tU0 :342a -4.
r-4 r4 ) ~ > 0U0 .C 40 4
U 44 U) 01 ) .."1.4 44 Ji 4 0 4
aL 1- 44 U 4) w 0 U) v-co 41. 0v1 .~ 0 2 '
.0 0 4 0)C'-4 b1 0 0. 42.) ".444V XU O .0. 0- > f-4 2 ~ . a
0 to 0.0 c 4) 10 -.V-4 "4 9 ) b''. .0 -X ) u . '4)
0) V) V). r). 4 00 04 2c
~ -.4J r40 0 90 $4 44u 10 J0 4-4 :1 3.0 .00(a
U) 0 U) 4) 4-40 thO 0) C6 .4Jw~, 0 ý. 44 td 0)
0 0.04 424 '0X0 0h 0 4.0)A -4 0 0 (1-4 02 0 w c2 .0 cc
""4 a)4 U 0 0 4J 4-
0 0 ' to4 0 r. 4) 4) .4' w

Table 22
Reasons Boaters Avoid At Chickamauga Lock During Tvyical
Weekends When No Special Events Are Scheduled
Is a Is Not aReason Reason
Danger of getting trapped on wrong 64.6 35.4
side during return trip
Takes too long to lock through 55.7 44.3
Too crowded 26.6 73.4
Unsafe boating practices 22.8 77.2
Rowdy or obnoxious behavior of 19.0 81.0other boaters
Table 23
Percent of Attempts During Which Recreational Boaters Are
Delayed by Commercial Traffic When Attempting To
Use Chickamauza Lock Durinz Special Events
Percent of Number of Percent of CumulativeAttempts Boaters Boaters Percent
0 48 33.8 33.81 3 2.1 35.92 1 0.7 36.65 4 2.8 39.410 23 16.2 55.615 5 3.5 59.220 3 2.1 61.325 14 9.9 71.130 5 3.5 74.633 1 0.7 75.440 6 4.2 79.650 17 12.0 91.557 1 0.7 92.360 1 0.7 93.070 3 2.1 95.175 3 2.1 97.290 1 0.7 97.9
100 3 2.1 100.0

Table 24
Effect of Commercial Delays on The Oualitv of Boating
Trip Experiences During Soecial Events
% ofEffect on Experience A Respondents
Detracted greatly from the quality 40 41.7of the boating trip
Detracted a little from the quality 42 43.8of the boating trip
Had no effect on the quality 9 9.4of the boating trip
Had a positive effect on the quality 5 5.2of the boating trip
Table 25
Percent of Attempts During Which Recreational Boaters Are
Delayed By Recreational Traffic When AttemptinL To
Use Chickamauga Lock During Special Events
Percent of Number of Percent of CumulativeAttempts Boaters Boaters Percent
0 31 21.8 21.81 1 0.7 22.55 8 5.6 28.2
10 26 18.3 46.515 2 1.4 47.920 6 4.2 52.125 11 7.7 59.930 3 2.1 62.033 1 0.7 62.740 2 1.4 64.145 1 0.7 64.850 26 1S.3 83.160 1 0.7 83.875 3 2.1 85.980 4 2.8 88.790 5 3.5 92.395 1 0.7 93.0
100 10 7.0 100.0

Table 26
Effect of Recreational Delays on The Ouality of Boating
Trip Experiences During Sgecial Events
% ofEffect on Experience N Respondents
Detracted greatly from the quality 22 20.0of the boating trip
Detracted a little from the quality 62 56.4of the boating trip
Had no effect on the quality 24 21.8of the boating trip
Had a positive effect on the quality 2 1.8of the boating trip

-4 1-4
0~
C, 0 (% Un Go N~ t-
cc .00
%0 ,-4 V)8 4.4
0W" D0P I q % r.4%0%
C.) 4 Jd
.00
0)
04~
14
4)0
N 41I4 f-4 ý -4 Nl CN N1 N~
"s-I -
Q 4-4 3t 0
4-4 0d a. 10 ,4 ~440to-4 5-1 U 0) w 0 0
4) V 4 0 in.41 V-40d k -4 C6 w.
04.) '4 cc 0
r- 4) 4 ~~ Uc 0c .0 41
4) 41~ :3 4 10 41 0
r-4 ( 0 "40 54).0 0 4) 04)44 bOS.k 0 12. 4J
0 54 -4 :) "4 to mCL4 04) 4.4 - U) M O 0 to )
0.4 0 0 1-4 0 05.w 0 .00441 V 0.0 4) 04 -4 0S
4.)0c ;ý 1- . 41 4) 10 .0 -44) 4) V-4 41 .14 0 0 0 4) 41
Z :0.1 4 *.-4 ( 00 ) 4~410 41 c P4 w .0 .0 0 04)".4 > "-4 b 0 U C
0)U r-4 r.0 4) 4) "~4 w.40"4 -. 40 ;S4.4 a w 4)0 04) W P '0 0 0 0 .0 4J
.- - .0 r) 3k 3t ul U 41 co4))~ 0 0 c: r.
f0-4 064 Cd =- Z

Table 28
Reasons Boaters Avoid at Chickamauga Lock
During Svecial Events
Is a Is Not aReason Reason
Too crowded 67.8 32.2
Danger of getting trapped on wrong 67.0 33.0side during return trip
Takes too long to lock through 65.2 34.8
Unsafe boating practices 40.4 59.6
Rowdy or obnoxious behavior of 39.3 60.7other boaters
'-4 4)-4
to x14).
2 z
"4)
Ai
>. $4 .
4.) 4n '0 0 NJ wl(1 C4j C4,4 C4 ( (
P4)
b) '-4 00 1-. 0 m~ co
09A4
o41) 44) A8
W. -4 .41 . 0 0 44 0.~ -0 0 0 ~ -4 44
0 40 0 ) U IA bO ho t"4' P-4 r-4 u~ V V 06 r.0mV. baD bo4 a4u 0 04 8 "4U 9 9-4 9 0 "-4 bo 4) .41
". '4 4) .4 0 r-4 U W- q~ W. wr-.)4 U -4 -k 4) w "
4.) 0U 0 Z.) 04)44 ".0 0 )4 00 Z 4 0 0 4-44 0 .. 4 4) -4
o) 04 04 4)4 0 0 w-4 P-4~ ~ ~14 11.4) C 0 4404)4 V-4p- 0
40 0 04) 0. z4 co0. r0.U) 0 . )-4 bO 0 4)
w 14i i4 40 4)w N )4) 4) 44 W4)4 .14 w.1-.4 $. -4 w-"" 40 ".J 0 -J v 0 wn 0
cc w) a1444 80)n4i r4) 0-4 d)
0.)0.4 Z~ w- 0 bo 4)4) 4 4J. '0 U 4.) W 4.)
I$4.-4 W. 4)4 4) 0) w4)0 04j 4. 0U v x $ 4) r-4 4)
0~ ~ Iu zE u C 0 C:4 u

Table 30
Respondents' Predictions of How Their Freguency of Use
of Chickamauga Lock Will Chanze Over The
Next Three Years
Future Lock Use Level
Use will decrease 15 9.1
Use will remain the same 88 53.7
Use will increase 50 % 47 28.7
Use will increase 100 % 14 8.5

bo4)
J 0 4 U fn
0
14,
4.) 0 toD 04
44-
00
4))
0 0o 0
"4)
0 41
C ) 1- n 4 V))bo 4)
4) U "0W d 0 -
r-4 Q I * 0 )
*-.. )w~v-
(D~- Aj to - .7% c
0.~ 1-4
000
0. 0w
M~ U) 41
$4 4 )0-40-W
00
r. C: w ~ -
.1 -M 0 co cc

Table 32
Annual Attendance a& Chattanooga's River
Bend Festival (Based On The Number of
Admission Pins Sold) (From
Chattanooga Times)
Year Atendanc&
1982 15,000
1983 26,000
1984 42,000
1985 64,000
1986 75,000
1987 89,000
1988 >100,000

>, 41 00D0%C mc
0 C14 -
*r -4
0 0
014-4 04
40 cc~ c.
r-4
Q 44i 0 O1e j4'
0 00c 0.1.w C'4 .-4 e
rA E- C.)44 (A 14~4 0) )
410
0 01 w
01 0l 4.)4. 0 0D
0 0 0
4 voC r Dc
0 41
4-ý C.)
"0 0 0 '0f40N j
to co $
00
00 4'-4 000r -4
0 4
0 4)4)C
0 .1 0
04 0).Occ C/i
00 r 00
4.)
4:I >1 r
00 CJ4+ ~0.4L) dP E4 1-)> 0a 000
0 0: r4.o

APPENDIX A: ONSITE CONTACT SHEET
Al

1.) How many years have you been boating on Chickamauga Lake? YEARS
2.) Have you noticed an increase in # of boats on Lake over this period?
No ----- > Go to question 3
Yes
a.) When did you first begin to notice this change? (Gradual, Lastyear, last 3 years, last 5 years, etc.).
b). Do you ever avoid going out on lake due to the increased use?
NO
YES (USE IT LESS FREQUENTLY)
3.) Have you used Chickamauga Lock before?
No ----- > Go to question 4
Yes
a.) How many years have you been using Chickamauga Lock? YEARS
b.) Have you noticed an increase in lock use over this period?
c.) When did you first begin to notice this change? (Gradual, Lastyear, last 3 years, last 5 years, etc.).
d.) Do you ever avoid the lock because of the number of boats?
NO
YES
4.) I don't want to take up any more of your free time today, but we do have
a few more specific questions about boating conditions we'd like to ask
regarding use of the area and your opinions about how boating conditions might
be improved. We're looking for volunteers to respond to a mail questionnaire.
Would you be willing to complete a short questionnaire if we mailed it to your
home.
NAME
ADDRESS
CITY STATE
ZIP CODE TIME
MARINA SLIP GAS/STORE UNKNOWN
BOAT TYPE
A3

APPENDIX B: MAIL QUESTIONNAIRE
Bl

0
CHICKAMAUGA LOCK USE STUDY
General Information. We would appreciate a few minutes of your time toanswer this survey. The University of Tennessee in cooperation with the
U.S. Army Corps of Engineers is collecting information about recreational
use of Chickamauga Lake, Nickajack Lake, and Chickamauga Lock in an effort
to better serve your recreation needs.
GENERAL USE OF CHICKAMAUGA LAKE
1.) Is this the first year you have boated on Chickamauga Lake?
YES -- )PmSkip to Question 4
NO
2.) How many years have you been boating on Chickamauga Lake (including
this year)?
YEARS
3.) About how many days per year do you boat on Chickamauga Lake duringthe:
SPRING (Mar-May)?
SUMMER (Jun-Aug)?
FALL (Sep-Nov)?
WINTER (Dec-Feb)?
4.) Have you ever boated on Nickajack Lake?
NO -,10-Skip to Question I on next page
YES
5.) How many years have you been boating on Nickajack Lake (including thisyear if you have already boated on Nickajack Lake)?
YEARS
B3

CHICKAMAUGA LOCK USE
1.) Have you ever used the lock at Chickamauga Dam before?
NO -)P-Skip to Question 11
YES+2.) What type of boat (e.g. bass boat, runabout, pontoon boat, etc.) do you
most frequently use to pass through Chickamauga Lock?
TYPE OF BOAT
a.) What is the length of this boat?
FEET
b.) How long have you owned this boat?
_______YEARS
3.) Please indicate where you typically launch this boat (marina, publicramp, private dock, or other area) on days when you use ChickamaugaLock.
Marina A a.) Which marina?
b.) How far do you live from this marina?
MILES
Public ramp m ' a.) Which ramp? (e.g. Harrison Bay State Park)
b.) How far do you live from this ramp?
MILES
__ __ __ a.) About how many river miles isOther, please this from Chickamauga Lock?indicate. (e.g.private dock) MILES
b.) How far do you live from this area?
MILES
B4

4.) How many years (including this year if you have used Chickamauga Lock)
have you been using the lock?
YEARS
5.) About how many times per year do you use Chickamauga Lock during eachof following seasons? (Count each pass through the lock separately. Forexample, if you went through the the lock twice in one day, that wouldcount as two times).
SPRING (Mar-May)
SUMMER (Jun-Aug)
FALL (Sep-Nov)
WINTER (Dec-Feb)
6.) People may pass through the lock for a variety of reasons. Pleaseindicate how frequently each of the following is a reason that you usethe lock.
Never Sometimes Frequentlya Reason a Reason a Reason
To attend a special event (e.g. Annual ( ) ( ) ( )Raft Race, River Bend Festival, etc.)
To escape the crowds on Chickamauga Lake ( ) ( ) ( )
To reach better fishing areas ( ) ( ) ( )
To see the scenic gorge ( ) ( ) ( )
Passing through the lock is a novel ( ) ( ) ( )experience for myself or my guests
To eat at one of the downstream ( ) ( ) ( )restaurants
To attend football games ( ) ( ) ( )
To boat in an area that I do not ( ) ( ) (often use
Other (Please specify):(B) ( ) (
__ _ _ _ _ _ _ _ _ _ _ _ _ _ _ ( ) ( ) ( )
E5

7.) What times during the week do you use the lock? (Check one)
WEEKDAYS (Mon-Fri) ONLY MoO Skip to Question II
WEEKENDS (Sat-Sun) ONLY
BOTH WEEKENDS AND WEEKDAYS
Please answer Questions 8-10 based on your experiences during a typicalweekend, when no special events such as the Annual Raft Race, River BendFestival, etc. are scheduled. Remember, do not include special event days.
8.) When using Chickamauga Lock on typical weekends, how often (% of times)
are you delayed due to commercial traffic (barges)?
% OF TIMES DELAYED
a.) On those occasions when you are delayed by commercial traffic(barges), how long are you typically delayed?
MINUTES
b.) Do these delays: (Check one)
Detract greatly from the quality of your boating tripDetract a little from the quality of your boatingtripHave no effect on the quality of your boating tripHave a positive effect on the quality of your boating trip
9.) When using Chickamauga Lock on typical weekends, how often (% of times)
are you delayed due to recreational traffic?
Z OF TIMES DELAYED
a.) On those occasions when you are delayed by recreational traffichow long are you typically delayed?
MINUTES
b.) Do these delays: (Check one)
Detract greatly from the quality of your boating tripDetract a little from the quality of your boatingtripHave no effect on the quality of your boating tripHave a positive effect on the quality of your boating trip
B6
10.) Please indicate the extent to which you feel each of the following isa problem at the Chickmagua Lock on a typical weekend when there areno special events.
Never a Seldm a Sometimes Often a Almst AlM s
Prblem ProbleI a Problem Problen a Problem
-Delay before entering lock due ( ) ( ) ( ) ( ) (to commercial traffic
-Delay before entering lock due ( ) ( ) ( ) ( ) ( )to recreational traffic
-Inability to predict when lock ( ) ( ) ( ) ( ) ( )will be available for use
-Possibility of getting trapped ( ) C ) C ) ( ) ( )on wrong side of dam for hourson return trip
-Unsafe boating practices ( ) ( ) ( ) ( ) (
-Number of boats allowed in lock ( ) C) C) () ( )at one time
-Intoxicated boaters ( ) ( ) • ) C ) )
-Rowdy or obnoxious behavior of ( ) C ) ( ) ( ) ( )some boaters
11.) Do you ever specifically avoid Chickamauga Lock on a typical weekdayor weekend (i.e. on days when no special events such as the AnnualRaft Race are scheduled).
_ NO •mP)PSkip to Question 1 on next page
YES
12.) If you sometimes avoid Chickamauga Lock on a typical weekend orweekday, please indicate which of the following reasons influencesyour decision to avoid using the lock. (Check all that apply).
Too crowded__Takes too long to lock through
Unsafe boating practicesRowdy or obnoxious behavior of other boaters
_ Danger of getting "trapped" on wrong side of dam on returntripOther. Please specify.
B7

SPECIAL EVENTS
1.) The following is a list of special events which are held in theChickamauga Lake/Nickajack Lake area.
Annual Raft RaceRiver Bend FestivalFall Color CruiseNational Bass Fishing Tournaments
_ Local Bass Fishing TournamentsChristmas on the River
a.) Have you ever passed through Chickamauga Lock to attend any ofthese events?
_ NO -*-Skip to Question 5
YES
b.) Beside each event, please write the number of times you haveattended the event by passing through Chickamauga Lock.
Please answer Questions 2-6 based on your experiences while attendin;special events such as the Annual Raft Race, River Bend Festival, etc.
2.) When using Chickamauga Lock during special events, how often (% oftimes) are you delayed due to commercial traffic (barges)?
% OF TIMES DELAYED
a.) On those occasions when you are delayed by commercial trafficbarges, how ' ing are you typically delayed?
MINUTES
b.) Do these delays: (Check one)
Detract greatly from the quality of your boating tripDetract a little from the quality of your boating tripHave no effect on the quality of your boating tripHave a positive effect on the quality of your boating trip
3.) When using Chickamauga Lock during special events, how often (% oftimes) are you delayed due to recreational traffic?
% OF TIMES DELAYED
a.) On those occasions when you are delayed by recreational traffichow long are you typically delayed?
MINUTESB8

b.) Do these delays: (Check one)
Detract greatly from the quality of your boating tripDetract a little from the quality of your boating tripHave no effect on the quality of your boating tripHave a positive effect on the quality of your boating trip
4.) Please indicate the extent to which you feel each of the following is aproblem at Chickmagua Lock during special events.
Never a Sel• a Sametimes Often a AJlmt AlwaysProblem Problem a Problem Problem a Problem
-Delay before entering lock due ( ) ( ) ( ) ( ) (to commercial traffic
-Delay before entering lock due ( ) ( ) ( ) ( ) ( )to recreational traffic
-Inability to predict when lock ( ) ( ) ( ) ( ) )will be available for use
-Possibility of getting trapped ( ) ( ) ( ) ( ) ( )on wrong side of dam for hourson return trip
-Unsafe boating practices ( ) ( ) C ) ( ) ( )
-Number of •:oats allowed in lock ( ) C ) ( ) ( ) C )at one time
-Intoxicated boaters ( ) ( ) ( ) C ) ( )
-Rowdy or obnoxious behavior of ( ) C ) ( ) ( ) C )some boaters
5.) Do you ever specifically avoid Chickamauga Lock during special events.
NO -.- Skip to Question i on next page
YES
B9

6.) If you sometimes avoid Chickamauga Lock during special events, pleaseindicate which of the following reasons influences your decision toavoid using the lock. (Check all that apply).
Too crowdedTakes too long to lock throughUnsafe boating practicesRowdy or obnoxious behavior of other boatersDanger of getting "trapped" on wrong side of dam on return trip
_ Other. Please specify
MANAGEMENT AND FUTURE USE OF CHICKAMAUGA LOCK
1.) To what degree would you SUPPORT or OPPOSE each of the followingmanagement alternatives.
Strongly Neither Support Strtrgly
SpOrt SUpport Nor Oppose Oppose Oppose
-Schedule regular periods during ( ) ( ) ( ) ( )which lock would be used forrecreational boats
-Create more public ramps ( ) ( ) ( ) ( ) (downstream
-Create more public ramps upstream ( ) ( ) ( ) ( )
-FM repeater announcing estimatod ( ) ( ) ( ) ( ) ( )times of commercial lockages
-FM repeater announcing estimated ( ) ( ) ( ) ( )times of recreation lockages
-Enlarge size of existing lock ( ) ( ) ( ) ( )
-Construct separate iock for ( ) ( ) ( ) ( )commercial traffic
Other. (Please specify).0( ) ( ) ( ) ( ) (
__ _ _ _ _ _ _ __ _ _ _ _ _ ( ) ( ) ( ) ( ) ( )
BlO
2.) Over the next three years, do you think that the number of times you
use Chickamauga Lock per yea will:
DecreaseRemain the same
____Increase 50% (1.5 times more than current use)Increase 100% (double current use)
3.) Please indicate how each of the following changes would affect thenumber of times you use Chickamauga Lock per year over the next threeyears.
Greatly Slightly No Chwie Slightly Greatly
Increase Use Increase Use In Use Decrease Use Decrease Use
-Average waiting time decreases ( ) ( ) ( ) ( ) ( )by 302
-Average waiting time increases ( ) ( ) ( ) ( ) (by 30 %
-Additional marinas are built ( ) ( ) ( ) ( )downstream
-Additonal ramps are built ( ) ( ) ( ) ( ) (downstream
-Additonal ramps are built ( ) ( ) ) (upstream
VISITOR INFORMATION
This information is important to the success of this study and aids inmaking predictions about river use in the future. All of the information isSTRICTLY CONFIDENTIAL and WILL NOT be associated with you as an individual.
1.) Your present age: YEARS
2.) Sex: MALE FEMALE
3.) Wht is the highest level of education you have completed so far?
(Circle one number)
1 2 3 4 5 6 7 8 9 10 11 12 13 14 15 16 17 18 18+Elementary High School After High School
Bl1

4.) What is your occupation? (Be as clear as possible - tell what kind ofwork you do, not whom you work for. If student, housewife, unemployed,or retired; please say so).
5.) Check the category which includes your 1988 total househeld incomebefore taxes.
Less than $5,000 $30,000 up to $40,000$5,000 up to $10,000 $40,000 up to $50,000$10,000 up to $20,000 __ $50,000 up to $60,000$20,000 up to $30,000 $60,000 or greater
USE THE REMAINING SPACE FOR ANY COMMENTS YOU WOULD LIKE TO MAKE.
PLEASE MAIL THIS COMPLETED SURVEY IN THE SELF-ADDRESSED ENVELOPE. NOSTAMP IS NEEDED, THE POSTAGE HAS ALREADY BEEN ATTACHED.
THANKS FOR YOUR HELP AND COOPERATION
UNIVERSITY OF TENNESSEEDEPARTMENT OF FORESTRY, WILDLIFE, AND FISHERIES
B12