Recreation benefits of Lake Puruvesi under various ......Alvarez-Farizo 2003, Alberini, Zanatta &...
19
Recreation benefits of Lake Puruvesi under various development alternatives Annika Tienhaara & Eija Pouta Natural Resources Institute (LUKE)
Transcript of Recreation benefits of Lake Puruvesi under various ......Alvarez-Farizo 2003, Alberini, Zanatta &...
Recreation benefits of Lake Puruvesi
under various development alternatives
Annika Tienhaara & Eija Pouta
Natural Resources Institute (LUKE)

The project has received funding from the LIFE Programme of the European Union. The material reflects the
views by the authors, and the European Commission or the EASME is not responsible for any use that may be
made of the information it contains.
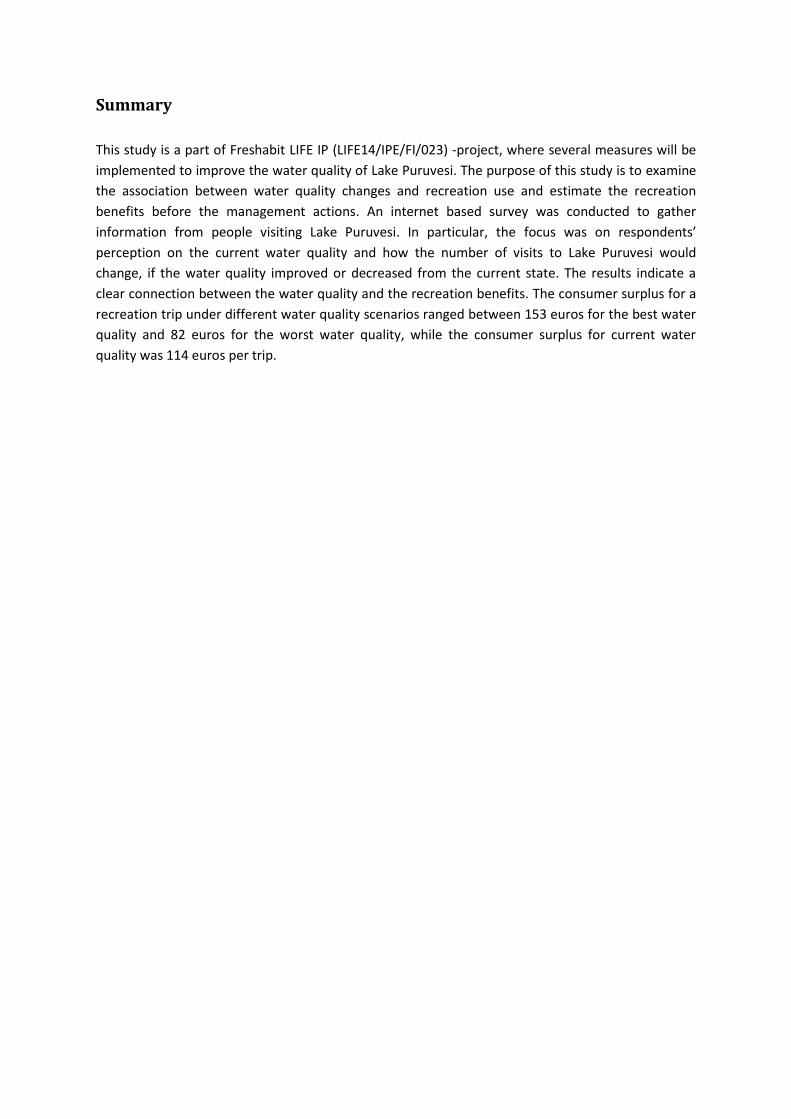
Summary
This study is a part of Freshabit LIFE IP (LIFE14/IPE/FI/023) -project, where several measures will be
implemented to improve the water quality of Lake Puruvesi. The purpose of this study is to examine
the association between water quality changes and recreation use and estimate the recreation
benefits before the management actions. An internet based survey was conducted to gather
information from people visiting Lake Puruvesi. In particular, the focus was on respondents’
perception on the current water quality and how the number of visits to Lake Puruvesi would
change, if the water quality improved or decreased from the current state. The results indicate a
clear connection between the water quality and the recreation benefits. The consumer surplus for a
recreation trip under different water quality scenarios ranged between 153 euros for the best water
quality and 82 euros for the worst water quality, while the consumer surplus for current water
quality was 114 euros per trip.

Introduction
Recreation is one of the key ecosystem services that can be enhanced by management of lake
ecosystems. Developing the quality of environment and the services for recreation affects also
wellbeing effects from recreation. Measuring the changes in recreation behavior and benefits due to
development projects provides information for justifying the management actions and for
prioritizing various management alternatives. In this report, we are interested in the association
between recreation behavior and water quality on a local scale i.e. on Lake Puruvesi in Eastern
Finland.
In Finland, there are almost 190 000 lakes larger than 500 square meters, and nearly ten percent of
the country is covered by water. Thus, it is evident that water recreation is an important leisure time
activity in Finland. For example, about two-thirds of the Finnish population annually swims in natural
water systems, 44% go fishing and almost half uses water bodies for boating (Sievänen & Neuvonen
2011). The water recreation of Finns is further strengthened by the leisure home culture (Sievänen,
Pouta & Neuvonen 2007). Finland has a population of 5 million and there are approximately 500 000
leisure homes, often situated by a lake. Since water recreation is a significant leisure activity in
Finland, it undoubtedly has effects on people’s wellbeing. Thus, it is important to know how the
benefits from recreation would be affected by potential changes in water quality (on national level
Vesterinen et al. 2010; Lankia, Neuvonen & Pouta 2017).
Previous studies have shown the importance of different water quality attributes such as water
clarity, absence of blue green algal blooms and low tendency for sliming (for review Ahtiainen, Pouta
& Artell 2015). However, importance of these water quality attributes is always case specific. In this
report, we are interested in Lake Puruvesi, which is one of the Freshabit LIFE IP project target areas.
Case of Lake Puruvesi is special, as it is currently on excellent state, but facing a threat of
eutrophication. Hence, people’s perception on the water quality and its changes may differ from the
objectively measured quality. This implies special challenges for the study. Regardless of the special
conditions of Lake Puruvesi, this study enables the development of an approach that is applicable to
other sites of lake restoration in Freshabit LIFE IP and other projects.
In this report, we evaluate the benefits of recreation and water conservation on Lake Puruvesi
before management actions. We use the approach of combined contingent behavior and travel cost
method to take into account the wide range of possible water qualities. The estimated demand
functions based on this approach reveal the effect of water quality on water recreation, and allow us
to calculate the welfare effects of water quality changes at the lake scale. Here, we present results of
recreation benefits, but the full statistical models are estimated in future for welfare analysis
(upcoming Deliverable Report of an approach for valuing recreation wellbeing effects). The final
results would facilitate the comparison of recreation benefits with the cost of management. As the
data collection and the analysis reported here takes place before the management actions, it is
important to repeat the data collection and analysis after the implementation of measures to verify
the ex-ante approach.
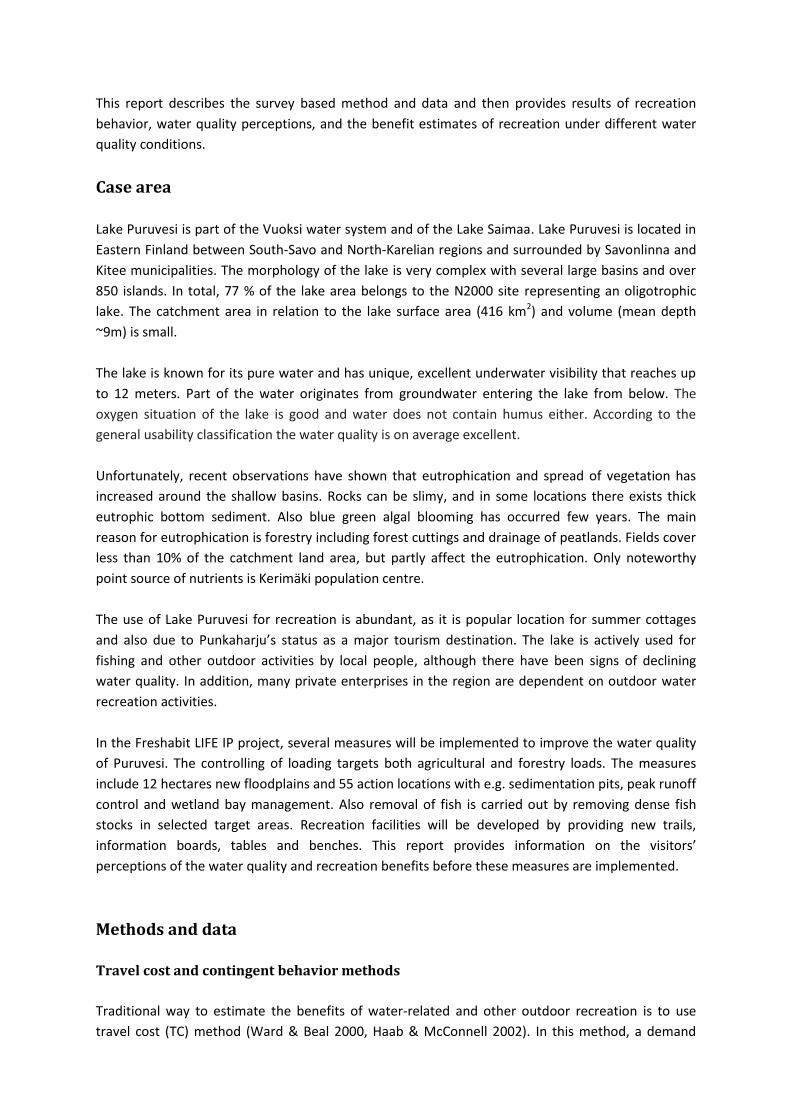
This report describes the survey based method and data and then provides results of recreation
behavior, water quality perceptions, and the benefit estimates of recreation under different water
quality conditions.
Case area
Lake Puruvesi is part of the Vuoksi water system and of the Lake Saimaa. Lake Puruvesi is located in
Eastern Finland between South-Savo and North-Karelian regions and surrounded by Savonlinna and
Kitee municipalities. The morphology of the lake is very complex with several large basins and over
850 islands. In total, 77 % of the lake area belongs to the N2000 site representing an oligotrophic
lake. The catchment area in relation to the lake surface area (416 km2) and volume (mean depth
~9m) is small.
The lake is known for its pure water and has unique, excellent underwater visibility that reaches up
to 12 meters. Part of the water originates from groundwater entering the lake from below. The
oxygen situation of the lake is good and water does not contain humus either. According to the
general usability classification the water quality is on average excellent.
Unfortunately, recent observations have shown that eutrophication and spread of vegetation has
increased around the shallow basins. Rocks can be slimy, and in some locations there exists thick
eutrophic bottom sediment. Also blue green algal blooming has occurred few years. The main
reason for eutrophication is forestry including forest cuttings and drainage of peatlands. Fields cover
less than 10% of the catchment land area, but partly affect the eutrophication. Only noteworthy
point source of nutrients is Kerimäki population centre.
The use of Lake Puruvesi for recreation is abundant, as it is popular location for summer cottages
and also due to Punkaharju’s status as a major tourism destination. The lake is actively used for
fishing and other outdoor activities by local people, although there have been signs of declining
water quality. In addition, many private enterprises in the region are dependent on outdoor water
recreation activities.
In the Freshabit LIFE IP project, several measures will be implemented to improve the water quality
of Puruvesi. The controlling of loading targets both agricultural and forestry loads. The measures
include 12 hectares new floodplains and 55 action locations with e.g. sedimentation pits, peak runoff
control and wetland bay management. Also removal of fish is carried out by removing dense fish
stocks in selected target areas. Recreation facilities will be developed by providing new trails,
information boards, tables and benches. This report provides information on the visitors’
perceptions of the water quality and recreation benefits before these measures are implemented.
Methods and data
Travel cost and contingent behavior methods
Traditional way to estimate the benefits of water-related and other outdoor recreation is to use
travel cost (TC) method (Ward & Beal 2000, Haab & McConnell 2002). In this method, a demand
curve for recreation is derived from the travel cost that varies between individuals. The benefits of
the recreation can then be estimated as a consumer surplus. Nevertheless, the travel cost method
does not take differences in the site quality in to account and, hence, their effect on recreational
value is not provided.
In order to provide information on the effect of water quality on recreational value, travel cost
method can be supplemented with contingent behavior approach (e.g. Bhat 2003, Hanley, Bell &
Alvarez-Farizo 2003, Alberini, Zanatta & Rosato 2007). In this method, the respondents respond to
hypothetical questions concerning their future behavior under different environmental quality
scenarios (Whitehead, Haab & Huang 2000). This makes possible to examine the effect of water
quality that is not currently observed (Englin & Cameron 1996, Eiswerth et al. 2000). Supplementing
travel cost method with contingent behavior method improves validity of the results as the stated
behavior is grounded in real behavior. Also, combining these two approaches provides more than
one observation per respondent, therefore improving statistical efficiency (Hanley et al. 2003).
Survey
To explore the perceptions on the water quality and the recreation use of Lake Puruvesi, we
implemented a survey that targeted people who had visited Puruvesi and used area for recreation
during the last 12 months. The survey began with questions concerning respondents’ relationship
with Puruvesi, recreation activities, evaluation of overall water quality and the importance of
different water quality attributes.
The survey then focused on trips to Puruvesi. It elicited the information needed for a travel cost
model and a contingent behavior model, i.e. both revealed- and stated-preference questions
concerning the trip frequency were asked. The respondents identified the location of their last
visitation site and reported the number of trips taken to this site during the previous twelve months.
The distance from the home or leisure home together with the travel time to the site were used as
the basis for the travel cost variable.
The survey then proceeded to questions concerning site characteristics of the last visited site on
Puruvesi. These questions included the respondents’ perceptions of the water quality. To obtain
water quality variables as usable as possible, it was important to select water quality attributes that
are understandable and easily observed by individuals. The selected water quality indicators, which
are also affected by eutrophication, included water clarity, blue-green algal blooms, the amount of
slime on piers and rocks, vegetation (reed) on the beach and the muddiness of the beach. These
indicators can be measured objectively and are therefore applicable in management design.
Especially water clarity is an important determinant of water recreation (Egan et al. 2009). As it has
been shown to correlate with nutrient levels, water clarity can be improved by using management
activities that decrease nutrient loads (Sandström 1996, Soutukorva 2005).
Respondents evaluated their perception of five different water quality attributes on a scale from one
to four. They were also able to select Don’t know option. For water clarity, a score of one indicated
that the bottom could be seen from the surface at a water depth of over eight meters, and a score
four that the bottom was visible from the surface at a depth of under two meters. For blue-green

algae, score of one indicated that there were no blue-green algal blooms noticeable during the
summer, and a score four that there was blooming during more than 10 days in a summer. For
sliming, a score of one indicated that there was no slime on piers and rocks, and score of four that
there was abundant sliming. Attribute indicating the amount of reed on the beach ranged from none
to abundant, and the muddiness of the beach ranged from no mud to over 10 cm of mud.
Water quality scenarios
After the revealed preferences questions concerning the actual past behavior, the respondents were
presented with four contingent behavior questions asking how their visits to Lake Puruvesi would
change under different water quality scenarios. The respondents were given the following
information before presenting alternative scenarios. Many things affect the water quality of Lake
Puruvesi. The water quality is maintained/improved in the Puruvesi area by many measures, for
example by building wetlands to prevent nutrient flow to waterbodies. Despite these measures, the
water quality may deteriorate locally, if the conditions change in the area, for example due to the
changes in forestry and agriculture.
The respondents were then asked to state how many times they would visit the site they had last
visited under different water quality scenarios. Table 1 presents these four different water quality
scenarios. The first contingent behavior question asked how many times respondents would visit the
site in the next twelve months if the water quality of the water system was the best possible
(Scenario A). The following contingent behavior questions presented rest of the scenarios ending in
the worst water quality in Scenario D. The current measured water quality of Lake Puruvesi is on
average between Scenarios A and B. Overall, the water quality of Lake Puruvesi is excellent,
especially in the middle of the lake, but the quality is inferior near the shoreline.
Table 1. Different water quality scenarios.
Scenario A
Water clarity Over 8 meters Blugreen algae blooms None Sliming None Amount of reed on the beach None Muddiness of the beach No mud
Scenario B
Water clarity 6 meters Blugreen algae blooms 1-4 days Sliming Slight Amount of reed on the beach Individual canes Muddiness of the beach Under 2 cm

Scenario C
Water clarity 4 meters Blugreen algae blooms 5-10 days Sliming Some Amount of reed on the beach Patchy Muddiness of the beach 3-10 cm
Scenario D
Water clarity 2 meters Blugreen algae blooms More than 10 days Sliming Abundant Amount of reed on the beach Abundant Muddiness of the beach Over 10 cm
Data
The data were collected during the end of the year 2016 using an Internet based survey that allowed
incorporation of spatial information. The respondents consisted of those who had responded to
visitor survey in Puruvesi implemented by Metsähallitus (State Forest Enterprise) in the summer
2016. In addition, the survey was sent to the members of Pro Puruvesi association. The purpose of
these data collecting methods was to reach as many respondents who had visited Puruvesi during
the last 12 months as possible.
The questionnaire was tested with a pilot study and then finalized based on the answers obtained
from the pilot. Overall, the survey was sent to 868 recipients and 327 respondents replied to the
survey. Out of these respondents, 251 completed the whole questionnaire, with the response rate
being 29%. Table 2 presents the descriptive statistics of the respondents.
Table 2. Descriptive statistics.
Mean Std.dev. Min Max
Living in Puruvesi 0.22 0.414 0 1 Leisure home 0.69 0.462 0 1 Boat owner (user) 0.83 0.377 0 1 Distance to Puruvesi (km) 158.6 175.62 0.01 1000 Number of recreation activities 5.01 1.78 0 8 Overall water quality 2.56 0.662 0 5 Importance of water quality 1.57 0.438 0 5 Gender (1=male) 0.64 0.481 0 1 Age (years) 57.5 12.3 18 81 High education 0.51 0.50 0 1 Household size (persons) 2.40 1.04 1 6 Individual gross income (€/month) 3197 1264 500 5500
The respondents had a strong connection to Lake Puruvesi as 22% of the respondents lived at the
waterfront and almost 70% had a leisure home in Puruvesi. The majority of the respondents (83%)
had an access to boat. The mean one-way distance travelled to Lake Puruvesi was approximately 158

kilometers, varying from 10 meters to 1000 kilometers. For half of the sample, however, the
distance was only 45 kilometers or less. The respondents were on average engaged in five different
recreation activities during the last twelve months. The perception on the water quality of Lake
Puruvesi in general was 2.65 (scale from 1 – excellent to 4 – poor), and the mean importance of
water quality attributes was 1.57 on a scale ranging from 1 to 4 (very important – not at all
important). The sample consisted of slightly more men than women and the respondents’ average
age was 57 years. The mean monthly gross income was a bit over 3000 euros per respondent.
Results
This section of the report presents the results obtained from the survey implemented in Puruvesi. It
considers the trips made to Lake Puruvesi, the recreational activities, locations for recreation and
the perceived water quality. The benefits of recreation are also estimated.
Use of Lake Puruvesi for recreation
The average number of trips taken to Lake Puruvesi in the previous 12 months was 58, while the
largest reported number was 365, as some of the respondents lived at the waterfront. The median
number of trips was 12, meaning that half of the respondents have taken trips 12 times in a year or
more seldom. The most popular recreation activities were spending time on the beach, swimming
and boating. Different recreation activities and their frequencies are summarized in Table 3.
Table 3. Recreation activities in Lake Puruvesi.
% of the respondents Standard deviation Spending time at the beach 98 0.148 Swimming 95 0.220 Boating 81 0.393 Canoeing or rowing 73 0.446 Fishing in summer 68 0.466 Skiing 44 0.496 Fishing in winter 31 0.462 Skating 20 0.401
As a part of the survey, the respondents were asked to place their last visited site in Lake Puruvesi to
the map. Figure 1 shows these visitation sites. As can be seen, there are observations all around Lake
Puruvesi and they are not concentrated only to couple specific locations.

Figure 1. Map of the respondents’ latest visitation sites in Lake Puruvesi (map by Janne Artell).
Water quality perceptions
The respondents were asked to evaluate the water quality of Lake Puruvesi in general as well as in
the location they had last visited. The respondents also assessed how the water quality has changed
during the last 10 years. The answers indicated that the direction in which the water quality in Lake
Puruvesi is currently developing is somewhat concerning, as 71.2% of the respondents felt that
water quality had deteriorated during the last 10 years. Meanwhile, 16.6% of the respondents
thought that it had stayed the same and only 0.6% considered that the water quality had improved.
A bit over one-tenth (11.5%) of the respondents did not have an opinion on the matter.
Figure 2 presents the perceptions of general water quality of Lake Puruvesi perceived by
respondents. The majority of the respondents considered swimmability, fishability and water clarity
to be in either excellent or good condition. In turn, water level stability, sliming and amount of reed
in beach areas were seen as more problematic.

Figure 2. The overall water quality of Lake Puruvesi perceived by the recreationists.
In addition to their assessment of the current state of water quality attributes, the respondents also
rated how important these quality attributes are to them (Figure 3). Most important attributes were
swimmability, water clarity and the low number of blue-green algal blooms. These attributes were
very important to over 90% of the respondents. Potability (i.e. suitability for drinking) was the least
important among these water quality attributes, but still, it was very important or important to 68%
of the respondents. Overall, all the attributes presented to the respondents were rated highly.
Figure 3. The importance of water quality attributes perceived by recreationists at Lake Puruvesi.

The respondents also assessed the water quality of the last site they had visited in Lake Puruvesi.
Table 4 and figure 4 present respondents’ perceptions on the site-specific water quality. As the scale
was set in such a way that best quality had score of one and worst quality score of four, the lower
the mean value is, the better the perceived state of the water quality attribute. Concerning the
water clarity of the last site visited, the majority (43%) of the sample reported that the bottom of the
water system could be seen from a depth of four meters. As Puruvesi is exceptionally clear watered
lake, respondents also reported the bottom to be visible up to a depth of six meters (25%) and eight
meters or more (6%). Approximately one-fifth of the respondents stated that the water clarity was
two meters or less. A bit under 40% of the respondents reported that there were no blue-green algal
blooms during the summer, and 27% stated that there were algal blooms only during 1-4 days. Only
4% of the respondents reported blue-green algae blooms to be present more often than 10 days in a
summer.
The situation with sliming on piers and rocks was not as good, as only 12% of the respondents
experienced no sliming. Instead, the majority (39%) reported some sliming. Also the amount of reed
in beach areas was not optimal as many respondents reported reed to be either abundant (33%) or
patchy (43%). The muddiness of the beaches appeared to be in better state. There was no mud in
one third of the sites and approximately 30% of the respondents told that the depth of the mud was
under 2 cm, whereas 14% of the sites had mud layer deeper than 10 cm.
Table 4. Site-specific water quality perceptions (1 excellent – 4 poor).
Mean Std.dev.
Water clarity: depth from which the bottom is still visible 2.83 0.83 Bluegreen algae blooms noticeable during summer 1.78 0.87
Sliming: slime on piers and rocks 2.58 0.89 Amount of reed on the beach 3.09 0.82 Muddiness of the beach 2.15 1.06

Figure 4. The respondents’ perceptions on the water quality of the last site they have visited.
0% 10% 20% 30% 40% 50%
Don't know
More than 10 cm
3-10 cm
Under 2 cm
No mud
Muddiness of the beach
0% 10% 20% 30% 40% 50%
Don't know
2 meters or less
4 meters
6 meters
Over 8 meters
Water clarity
0% 10% 20% 30% 40% 50%
Don't know
More often than 10 days
5-10 days
1-4 days
None
Blue-green algae blooms in summer
0% 10% 20% 30% 40% 50%
Don't know
Abundant
Some
Slight
None
Sliming
0% 10% 20% 30% 40% 50%
Don't know
Abundant
Patchy
Individual canes
None
Amount of reed in beach areas

The ratings of these five different water quality attributes were used to calculate the mean water
quality for each visitation site. Figure 5 presents a map showing the respondents’ perceived water
quality on these sites.
Figure 5. Respondents’ perceptions on the water quality in the visitation site (map by Janne
Artell).
Two maps showing the phosphorus and hummus loads in Lake Puruvesi are provided in Appendix.
Comparison of the perceived water quality (figure 5) with these maps shows that the respondents’
perceptions correspond well with the actual observed water quality.
Recreation use under water quality changes
In addition to asking the respondents about their actual trips made to Puruvesi during the last year,
we also examined how their trips would change, if the water quality of Lake Puruvesi changed. We
used contingent behavior questions to present each respondent four different water quality
scenarios with varying water quality. The results showed a clear drop in the amount of trips as the

water quality decreases. Table 5 presents the number of trips (mean and median) under each water
quality scenario.
Table 5. Number of trips under different water quality scenarios.
Water quality Trips
Mean Median Current state 58 12 Scenario A (best water quality) 61* 20 Scenario B 55* 12 Scenario C 47* 10 Scenario D (worst water quality) 30* 5
*hypothetical trips
If the water quality declined according to Scenario D, so that the water clarity was less than two
meters, blue-green algal blooms were present more than 10 days a year, abundant slime was
present, there was abundant reed and mud layer on the beach was over 10 cm, the respondents
would make on average 30 trips in a year. Conversely, after a hypothetical improvement in water
quality from the current state to Scenario A, the mean number of trips would increase to 61. It
should be noted that the median values for the number of trips are noticeably lower than the mean
values. This is because 22% of the respondents are living in Puruvesi, thus visiting the lake daily and
raising the mean.
Benefits of recreation
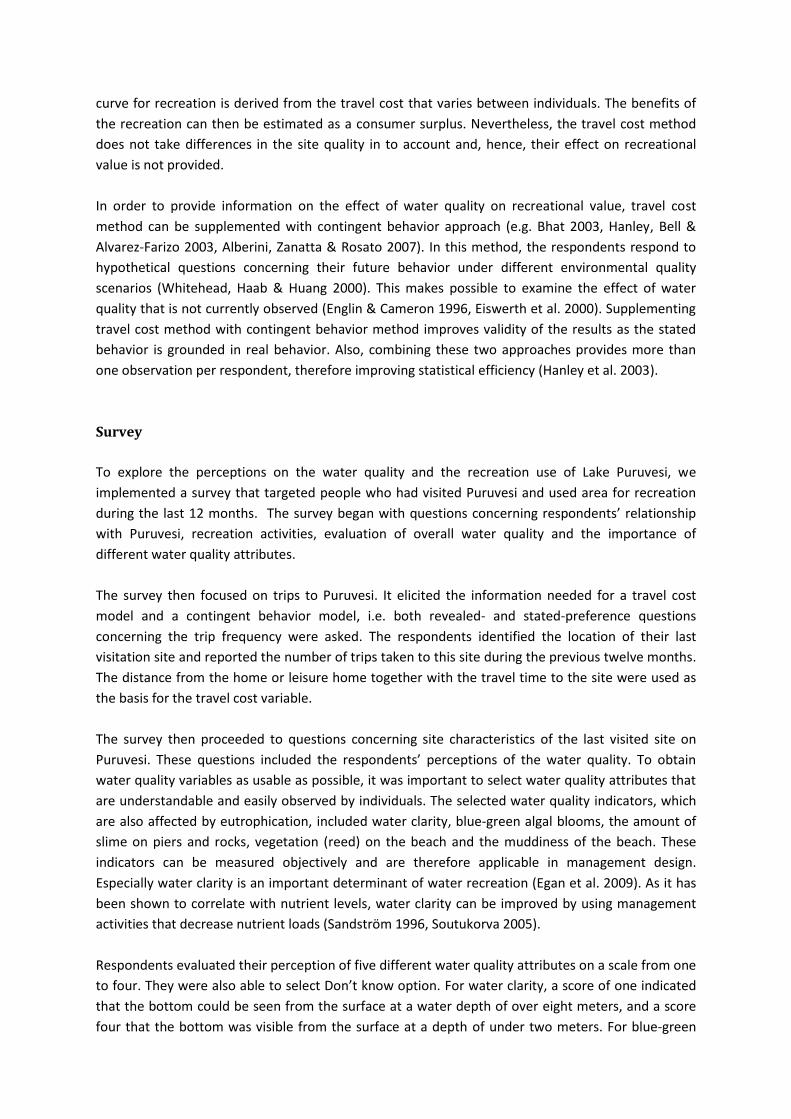
To examine the value of recreation, we utilized travel cost model. Travel cost model was estimated
with panel version of Poisson regression. The results of this model are reported in Table 6. Number
of respondents in the travel cost model is 221, since all of the respondents who did not report their
travel costs were excluded from the model.
As expected, travel cost is negative and significant. Interaction variables between travel cost and
different scenarios were included to measure the welfare effect of water quality changes, as they
allow the slope of the travel cost to vary. All other interaction variables were significant except for
scenario C. The coefficients for interactions with travel cost and scenario A and scenario B were
positive indicating that better water quality affects travel cost positively, i.e. improvements in water
quality would make people less responsive to changes in travel costs. In turn, interaction with travel
cost and scenario D was negative, implying an increase in the price elasticity, i.e. people would be
more sensitive to changes in travel costs in case of decreased water quality. As the interaction
between travel cost and scenario C was not significant, travel costs for current state and scenario C
do not differ.
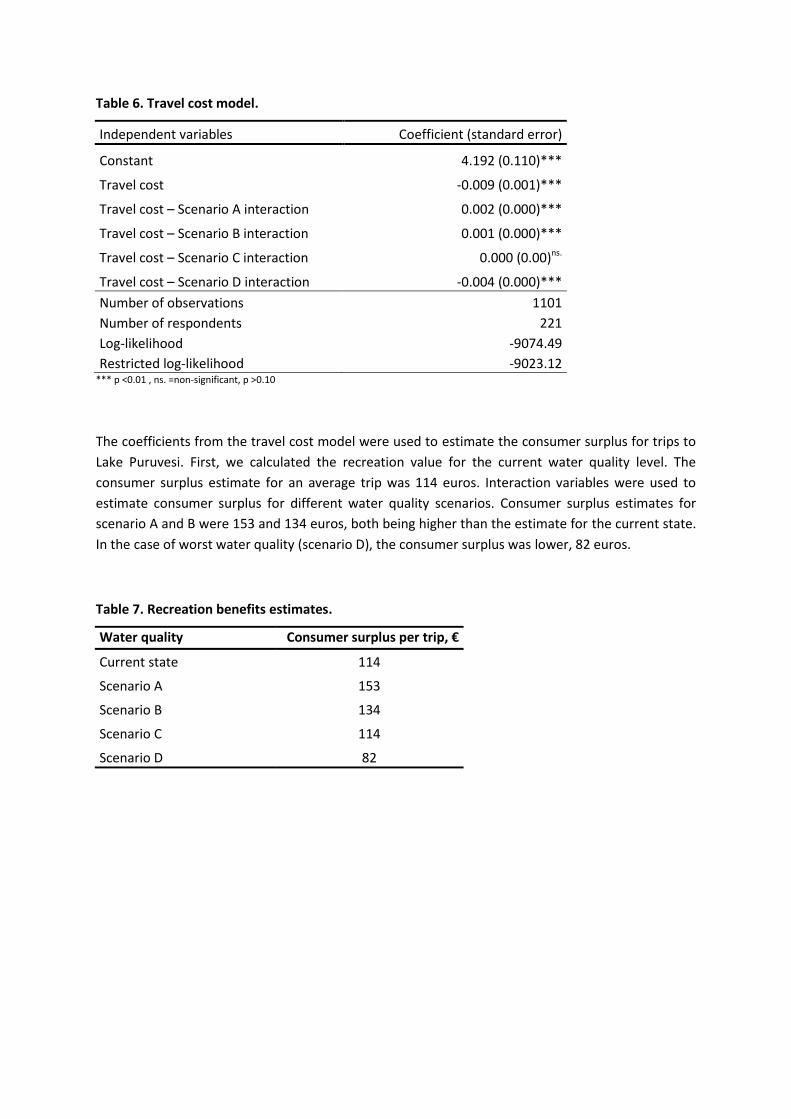
Table 6. Travel cost model.
Independent variables Coefficient (standard error)
Constant 4.192 (0.110)***
Travel cost -0.009 (0.001)***
Travel cost – Scenario A interaction 0.002 (0.000)***
Travel cost – Scenario B interaction 0.001 (0.000)***
Travel cost – Scenario C interaction 0.000 (0.00)ns.
Travel cost – Scenario D interaction -0.004 (0.000)***
Number of observations 1101
Number of respondents 221
Log-likelihood -9074.49
Restricted log-likelihood -9023.12 *** p <0.01 , ns. =non-significant, p >0.10
The coefficients from the travel cost model were used to estimate the consumer surplus for trips to
Lake Puruvesi. First, we calculated the recreation value for the current water quality level. The
consumer surplus estimate for an average trip was 114 euros. Interaction variables were used to
estimate consumer surplus for different water quality scenarios. Consumer surplus estimates for
scenario A and B were 153 and 134 euros, both being higher than the estimate for the current state.
In the case of worst water quality (scenario D), the consumer surplus was lower, 82 euros.
Table 7. Recreation benefits estimates.
Water quality Consumer surplus per trip, €
Current state 114
Scenario A 153
Scenario B 134
Scenario C 114
Scenario D 82

Conclusions
The survey yielded responses all around Lake Puruvesi. The majority of the respondents felt that the
water quality has been deteriorating during the last ten years. The swimmability, fishability and
water clarity were seen to be in excellent or in good condition. These were also considered to be in
top four of the most important water quality attributes. In addition, low number of blue-green algal
blooms was very important to the respondents. While considering the last site they had visited in
Lake Puruvesi, the respondents perceived the current state of water clarity and blue-green algal
blooms as well as muddiness of the beach to be in relatively good level. However, the current state
of sliming and the amount of reed were not as good. Respondents’ perceptions on the water quality
were in line with measured water quality.
The results of this study suggest that Lake Puruvesi produces apparent recreation benefits and these
benefits are clearly linked to the water quality. The number of hypothetical trips made to Lake
Puruvesi changed between different water quality scenarios decreasing as the water quality
decreased. The consumer surplus for a recreation trip ranged between 153 and 82 euros under
different water quality scenarios, while the consumer surplus for current water quality was 114
euros per trip.
The analysis of the data will continue. The next step will be conducting a more comprehensive
welfare analysis to compare the recreation benefits of different water quality scenarios with the cost
of management needed to achieve the corresponding water quality.

References
Ahtiainen, H., Pouta, E & Artell, J. 2015. Modelling asymmetric preferences for water quality in choice experiments with individual-specific status quo alternatives. Water Resources and Economics, 12: 1–13. Alberini, A., Zanatta, V. & Rosato, P. 2007. Combining actual and contingent behavior to estimate the value of sport fishing in the Lagoon of Venice. Ecological Economics 61 (2-3), 530-541. Bhat, M.G. 2003. Application of Non-Market Valuation to the Florida Keys Marine Reserve Management. Journal of Environmental Management 67 (4), 315-325. Egan, K.J., Herriges, J.A., Kling, C.L. & Downing, J.A. 2009. Valuing water quality as a function of water quality measures. American Journal of Agricultural Economics 91 (1), 106-123. Eiswerth, M.E., Englin, J., Fadali, E. & Shaw, W.D. 2000. The Value of Water Levels in Water-Based Recreation: A Pooled Revealed Preference/Contingent behavior model. Water Resources Research 36 (4), 1079-1086. Englin, J. & Cameron, T.A. 1996. Augmenting Travel Cost models with Contingent Behavior data. Environmental and Resource Economics 7 (2), 133-147. Haab, T.C. & McConnell, K.E. 2002. Valuing Environmental and Natural Resources. Edward Elgar, Cheltenham. Hanley, N., Bell, D. & Alvarez-Farizo, B. 2003. Valuing the Benefits of Coastal Water Quality Improvements Using Contingent and Real Behavior. Environmental and Resource Economics 24 (3), 273-285. Lankia, T., Neuvonen, M. & Pouta, E. 2017. Effects of water quality changes on recreation benefits in Finland: Combined travel cost and contingent behavior model. Manuscript. Sandström, M. 1996. Recreational benefits from improved water quality: A random utility model of Swedish seaside recreation. Stockholm School of Economics. Working Paper Series in Economics and Finance, 121. Sievänen, T. & Neuvonen, M. (eds.) 2011. Luonnon virkistyskäyttö 2010. Working Papers of the Finnish Forest Research Institute 212. Sievänen, T., Pouta, E. & Neuvonen, M. 2007. Recreational home users - potential clients for countryside tourism? Scandinavian Journal of Hospitality and Tourism 7 (3), 223-242. Soutukorva, Å. 2005. The value of improved water quality. A random utility model of recreation in the Stockholm archipelago. The Beijer International Institute of Ecological Economics, The Royal Swedish Academy of Sciences. Vesterinen, J., Pouta, E., Huhtala, A. & Neuvonen, M. 2010. Impacts of change in water quality on recreation behavior and benefits in Finland. Journal of Environmental Management 91 (4), 984-994. Whitehead, J.C., Haab T.C. & Huang J-C. 2000. Measuring recreation benefits of quality improvements with revealed and stated behavior data. Resource and Energy Economics 22, 339 – 354.

Appendix
The phosphorus consentration and the amount of humus in Lake Puruvesi. Maps from Puruveden
taustaselvitysraportti (Etelä-Savon ELY-keskus 2013).
Figure 1. Phosphorus consentration in Lake
Puruvesi.
Figure 2. The amount of humus in Lake
Puruvesi.