Recovery of Indium from End-of-Life Liquid Crystal...
60
THESIS FOR THE DEGREE OF LICENTIATE OF ENGINEERING Recovery of Indium from End-of-Life Liquid Crystal Displays Jiaxu Yang Industrial Materials Recycling Department of Chemical and Biological Engineering CHALMERS UNIVERSITY OF TECHNOLOGY Gothenburg, Sweden 2012
Transcript of Recovery of Indium from End-of-Life Liquid Crystal...
THESIS FOR THE DEGREE OF LICENTIATE OF ENGINEERING
Recovery of Indium from End-of-Life Liquid Crystal Displays
Jiaxu Yang
Industrial Materials Recycling
Department of Chemical and Biological Engineering
CHALMERS UNIVERSITY OF TECHNOLOGY
Gothenburg, Sweden 2012

Recovery of Indium from End-of-Life Liquid Crystal Displays Jiaxu Yang © Jiaxu Yang, 2012. Technical report no 2012:18 ISSN:1652-943X Department of Chemical and Biological Engineering Chalmers University of Technology SE-412 96 Gothenburg Sweden Telephone + 46 (0)31-772 1000 Cover: SEM image of a fragmented piece of LCD glass with ITO coating Chalmers Reproservice Gothenburg, Sweden 2012

Recovery of Indium from End-of-Life Liquid Crystal Displays
Jiaxu Yang
Industrial Materials Recycling Department of Chemical and Biological Engineering
Chalmers University of Technology
Abstract From the time of its invention in the 1970s, liquid crystal displays (LCD) have slowly become one of the main types of displays in televisions, computers, and cell phones. With its continuously growing rate of consumption, need and incentive to recycle the valuable components also grew larger, as the displays will inevitably enter the waste stream. Recently, one of the materials in LCDs that has become of interest for recycling is indium. It is a soft, silvery metal that occurs mainly as impurities in e.g. lead (galena) and zinc (sphalerite) ores. Today more than 70% of the indium is consumed in areas such as photovoltaic cells and displays. In this work, the potential to recycle indium has been investigated through hydrometallurgical means. As the first step, material characterization was made by leaching fragmented LCD glass with aqua regia. Results showed that five other metal species had similar or higher concentration than indium (0.25 mg/g glass) in the leach liquor. Studies on leaching kinetics were done for nitric acid, hydrochloric acid and sulfuric acid at different concentrations between 0.1 M and 6 M. After leaching, different choices of aqueous and organic phases were tested in a solvent extraction screening test. This was done by mixing and agitating equal volumes of each phase for 5 minutes. Studies on extraction kinetics of several combinations of organic and aqueous phases were performed as well. The results showed that extraction from H2SO4 using DEHPA in kerosene followed by back-extraction with HCl was a promising alternative for the recovery of indium. In addition, according to the results for extraction kinetics, short (5-10 minutes) contact time is favorable in terms of indium separation from impurities such as iron and tin. The correlation between the distribution ratios of the metals and other factors such as pH and temperature was investigated with H2SO4 or HCl as the aqueous phase and DEHPA in kerosene as the organic phase. The pH study also showed that good indium separation could also be achieved by extraction at lower acid concentrations. From the temperature dependency study it was concluded that the optimal condition for indium extraction was below 20 oC. Keyword: Recycling, LCD, Indium, Leaching, Solvent Extraction, DEHPA

List of Publications: The thesis is based on the following papers:
Paper I Jiaxu Yang, Teodora Retegan, Christian Ekberg, Indium Recovery from Discarded LCD Panel Glass by Solvent Extraction, submitted to Hydrometallurgy. Contribution: main author, all experimental work
Paper II Jiaxu Yang, Christian Ekberg, Johan Felix, Teodora Retegan, Potential Path of Treating the Polymeric Films from Discarded LCDs, submitted to Journal of Cleaner Production Contribution: main author, all experimental work

Contents 1 Introduction ........................................................................................................................................................... 1
2 Background ........................................................................................................................................................... 3
2.1 Indium and ITO ............................................................................................................................................ 3
2.2 Liquid Crystal Displays ................................................................................................................................ 3
2.3 Recycling of LCDs ....................................................................................................................................... 7
3 Theory ................................................................................................................................................................... 9
3.1 Leaching ....................................................................................................................................................... 9
3.2 Solvent Extraction ...................................................................................................................................... 10
3.2.1 Classification of organic diluents ....................................................................................................... 12
3.2.2 Extractants ......................................................................................................................................... 12
4 Experimental ....................................................................................................................................................... 15
4.1 Removal of plastic material before leaching .............................................................................................. 15
4.2 Leaching test ............................................................................................................................................... 16
4.3 Solvent extraction, batch experiments ........................................................................................................ 16
4.4 Solvent extraction, AKUFVE experiments ................................................................................................ 17
5 Results and Discussion ........................................................................................................................................ 19
5.1 Removal of plastic material before leaching .............................................................................................. 19
5.2 Leaching experiments ................................................................................................................................. 21
5.2.1 Materials characterization .................................................................................................................. 21
5.2.2 Acid leaching kinetics ........................................................................................................................ 22
5.3 Solvent extraction of indium ...................................................................................................................... 27
5.3.1 Screening test, extraction stage .......................................................................................................... 27
5.3.2 Screening test, strip stage ................................................................................................................... 32
5.3.3 Preliminary Process calculation ......................................................................................................... 33
5.4 Optimizations of indium extraction ............................................................................................................ 34
5.4.1 Kinetics of indium extraction ............................................................................................................. 34
5.4.2 Effect of pH on metal extraction ........................................................................................................ 36
5.4.3 Effect of temperature on metal extraction .......................................................................................... 37
6 Conclusion ........................................................................................................................................................... 41
7 Future Work ........................................................................................................................................................ 43
8 Acknowledgement ............................................................................................................................................... 45
9 Reference ............................................................................................................................................................. 47
10 List of Abbrieviations ..................................................................................................................................... 49
11 Appendices ...................................................................................................................................................... 51
Appendix A .............................................................................................................................................................. 51
Appendix B .............................................................................................................................................................. 52


1
1 Introduction The global shipment of Flat Panel Displays (FPD) surpassed traditional Cathode Ray Tube displays (CRT) in 2007 [1]. Compared to CRTs, there are several advantages with FPDs, such as less volume, lighter weight and lower power consumption. FPDs can be further classified into several sub-categories based on its technology, including Plasma Display Panels (PDP), Organic Light-Emitting Diode (OLED), and Thin Film Transistor Liquid Crystal Displays (TFT-LCD), with TFT-LCD being the largest part. For 2010, it was estimated that almost 150 million units of LCD were shipped globally, and the figure was forecasted to be over 200 million in 2012 [1].Taking into consideration the life-time of an LCD and the increasing rate at which old technology is being replaced, newly sold LCD today will likely to be found in the waste stream in less than five years. It has been acknowledged that LCD is the fastest-growing waste electronic and electrical equipment (WEEE) stream [2]. By 2015, it is expected that 25 million m2 LCDs will enter the European waste stream [3]. To summarize, LCD waste and its recycling is a growing problem, and it is important with respect to economy, environment and sustainability to develop recycling processes to recover the valuable and harmful components from the waste. The TFT material is a layer of indium-tin oxide (ITO) with a thickness of approximately 150 nm, where the ratio between indium oxide and tin oxide is approximately 9 to 1 by weight. In 2010 indium was listed by the European Commission in a report as one of 14 critical raw materials, based on assessments of its supply and economic importance [4]. Currently, in anticipation of this potential increase of LCD in WEEE, a number of research projects have already been conducted on the topic of indium recycling from LCD waste. Most of such projects have been focused on the recycling of ITO and separation of indium from tin. However, when indium is to be recycled from discarded LCD units, other contaminants, both metallic and non-metallic will likely be present. This is a potential problem in the recycling process, depending on whether or not these compounds will interfere with indium extraction. However, due to that indium is primarily produced as a by-product from zinc and lead smelting, results from previous studies in that area may also be applicable. The main goal of this project was to investigate and bring forth a feasible process for the recycling of indium from waste LCD glass. This process is intended to use crushed glass from discarded LCD devices as starting material, and should be able to separate indium into a pure material stream. In order to achieve this, hydrometallurgical methods were used. This involves first leaching the glass to dissolve ITO, followed by solvent extraction to separate indium from contaminants, such as iron, tin and zinc. Several factors are adjusted to maximize the efficiency of both leaching and extraction.

2

3
2 Background
2.1 Indium and ITO The element indium (Z=49) is a soft, silvery white metal that was discovered in 1863 by Ferdinand Reich and Theodor Ritcher and named after the indigo color of its spectrum [5]. While it is considered nonhazardous in commercial use, the metal and the metalloid is known to be severely toxic and carcinogenic to humans and animals. [6] The major sources of primary indium production are found in South America, Canada, China, South Korea and Japan. While Canada has the potential to be the largest source of indium, China is currently the biggest indium producer, accounting for 50-60% of the world’s indium production [5]. On the consumption side, Japan is by far the largest indium consumer, taking 60% of the world’s supply of indium [7]. The most important application of indium at the moment is in the form of indium-tin-oxide (ITO), consisting of 90% wt indium oxide and 10% wt tin oxide. ITO accounts for 70% of the global indium consumption [8]. In FPDs, more specifically in LCDs, ITO is used coated onto LCD glass as thin conductive films of approximately 150 nm in thickness (can vary between different manufacturers). Other uses include photovoltaic cells, metal lubricants, alloys and jewelry etc. [9].
2.2 Liquid Crystal Displays
TFT-LCDs can be further divided into two subcategories, depending on whether cold cathode fluorescent lamps or light-emitting diodes are used as the backlight unit. The categories are conventionally named LCD and LED respectively. The typical components of a typical LCD and their respective weight are presented in Table 1 [10]. The general structure of an LCD is presented in Figure 1. Other than components common to all electronics, e.g. printed circuit boards, the central component in an LCD is referred to as the LCD module. Within the module, the LCD glass (panel), various optical films, and backlight are arranged in a laminar structure. There is a difference in the construction of the module between an LCD TV and a computer monitor. In TV, especially a large LCD TV (more than 40 inches diagonal), the lamps are arranged in a row in the back of the module, with an optical diffuser between the lamps and the panel to make the lighting more homogenous. In monitors, one lamp is placed at each of the long edges of the module behind the panel, and a “light-guide” is used to redirect the lighting towards the panel.

4
Table 1: Typical components of an LCD and their respective weight in grams weight [10] Density
(g/cm2) Portables PC Flat Screen TV Flat Screen
Minimum Maximum Minimum Maximum Minimum MaximumDiagonal (inches) 12.1’’ 20.1’’ 15’’ 40’’ 15’’ 40’’
Area (cm2) 4.32E+02 1.17E+03 6.97E+02 4.96E+03 6.97E+02 4.96E+03 LC Assembly Glass 1.91E-01 8.27E+01 2.24E+02 1.33E+02 9.49E+02 1.33E+02 9.49E+03 Electrode 7.00E-05 3.02E-02 8.20E-02 4.88E-02 3.47E-01 4.88E-02 3.47E-01 Alignment layer 1.00E-05 4.32E-03 1.17E-02 6.97E-03 4.96E-02 6.97E-03 4.96E-02 Liquid crystals 6.00E-04 2.59E-01 7.03E-01 4.18E-01 2.97E+00 4.18E-01 2.97E+00 Spacers 5.00E-07 2.16E-04 5.86E-04 3.49E-04 2.48E-03 3.49E-04 2.48E-03 LC Assembly total 8.29E+01 2.25E+02 1.34E+02 9.52E+02 1.34E+02 9.52E+02 Film Set Brightness enhancement film
6.83E-02 3.22E+01 8.89E+01 4.95E+01 3.52E+02 4.95E+02 3.52E+02
Diffuser 6.83E-02 3.22E+01 8.89E+01 4.95E+01 3.52E+02 4.95E+02 3.52E+02 Prism foil 6.83E-02 3.22E+01 8.89E+01 4.95E+01 3.52E+02 4.95E+02 3.52E+02 Light guide 4.76E-01
to 9.52E-
01
2.25E+02 1.24E+03 3.45E+02 4.91E+03 3.45E+02 4.91E+03
Reflection foil 6.83E+02 3.22E+01 8.89E+01 4.95E+01 3.52E+02 4.95E+02 3.52E+02 Film Set total 3.54E+02 1.60E+03 5.44E+02 6.32E+03 5.44E+02 6.32E+03 Backlight Assembly Mercury 0.00E+00 2.46E-03 6.67E-03 3.97E-03 2.82E-02 3.97E-03 2.82E-02

5
Figure 1: The main components within a LCD, and its general structure. ITO is located in the LCD panel. Figure 2 illustrates the layered structure of the key components in a panel. It can be seen that the liquid crystal layer is situated between two glass panels. Other than the front panel having color filters they have identical structures. The majority of the weight is made up by the glass substrate layer, usually in the range of 1mm thickness, while the thickness of the liquid crystal, electrode (ITO) and color filter layers are 5 µm, 150 nm and 2 µm respectively [3].

6
Figure 2: the internal structure and component of an LCD panel.
It can be seen that on the outside of the glass substrates there are polymeric films called polarizing filters, or polarizer. The function of the polarizing filter is to only allow light waves of a certain orientation to pass through while absorbing or reflecting the rest. In the most common design of LCD, the orientation of the front and back polarizer is set to be perpendicular to each other. The general working principle of an LCD is shown in Figure 3. This is known as twisted nematic liquid crystal and was first presented in 1971 [11], allowing liquid crystals to be applied in the field of displays.

7
Figure 3: illustration of how black/white images are formed in an LCD. In the absence of an electric field (above), incident polarized light is rotated as it propagates through the liquid crystal and passes through the other polarizer, as the result the LCD is transparent. After an electric field is applied (below), the liquid crystal no longer re-orients the incident light, as the result it is blocked by the other polarizer and the LCD appears black.
2.3 Recycling of LCDs Currently the research on indium recycling from LCDs is mostly focused on the ITO layer. Below are examples of the methods and studies for the recycling, or separation of indium and other valuable components from LCDs. A method for indium recovery through chloride volatilization, where HCl was produced by pyrolysis of Poly-vinyl Chloride (PVC) was presented in an earlier work [12]. At first a pure In2O3 sample was treated with HCl and studied in order to discern the effect of temperature and heating time on the volatilization of indium chloride (InCl3). Afterwards, discarded cell phones were dismantled to collect the LCDs, which were then crushed and incinerated at 973 K to

8
remove the plastic films and other organic materials. It was concluded that 84% of indium from LCD scrap could be vaporized with this method at 673K. The main advantage of this method was that it uses one type of waste to recycle another type of waste. In Li J. et al [13], a set of treatment methods for the purpose of LCD recycling were investigated. The methods studied were: removal of polarizing filters by thermal shock in a furnace, removal of liquid crystal in an ultrasonic bath and acid leaching of indium. It was found that at 160 oC the films became discolored and a temperature of 220 oC was enough to allow the films to be easily separated by hand. For removing liquid crystals by ultrasonic cleaning, 40 kW power and a frequency of 40 kHz was found to be suitable. The acid dissolution of ITO was investigated by dissolving 1000 g of crushed glass in 500 ml solutions of various acid mixtures, at four different temperatures. The amount of indium dissolved over 60 minutes was then determined. The result graphs showed a positive proportionality between temperatures and amount of indium dissolved, up to 240 mg/l of indium could be obtained from the glass. In a more recent publication [14], the viability of an extraction system consisting of H2SO4 or HCl as the aqueous phase and Tributyl Phosphate (TBP) or DEHPA dissolved in kerosene as the solvent was investigated. The result for the extraction of indium from dissolved ITO showed that in sulfuric medium, DEHPA was found to be able to extract both indium and tin, and indium could then be selectively stripped (or back-extracted) by HCl. Between 2007 and 2009, a research project (Recovery of Flat LCDs using Advance Technological Processes, REFLATED) at the University of York investigated the recycling of liquid crystal from used LCD panels. Very high fractional extraction (>95%) of liquid crystal could be achieved by supercritical CO2 extraction. However, as the liquid crystals layer is a mixture of various organic compounds, the separation of these components proved to be much more difficult. A spin-off study was also done to explore the possibility of recycling PVA in LCD polarizing films to produce materials with high specific surface area.

9
3 Theory
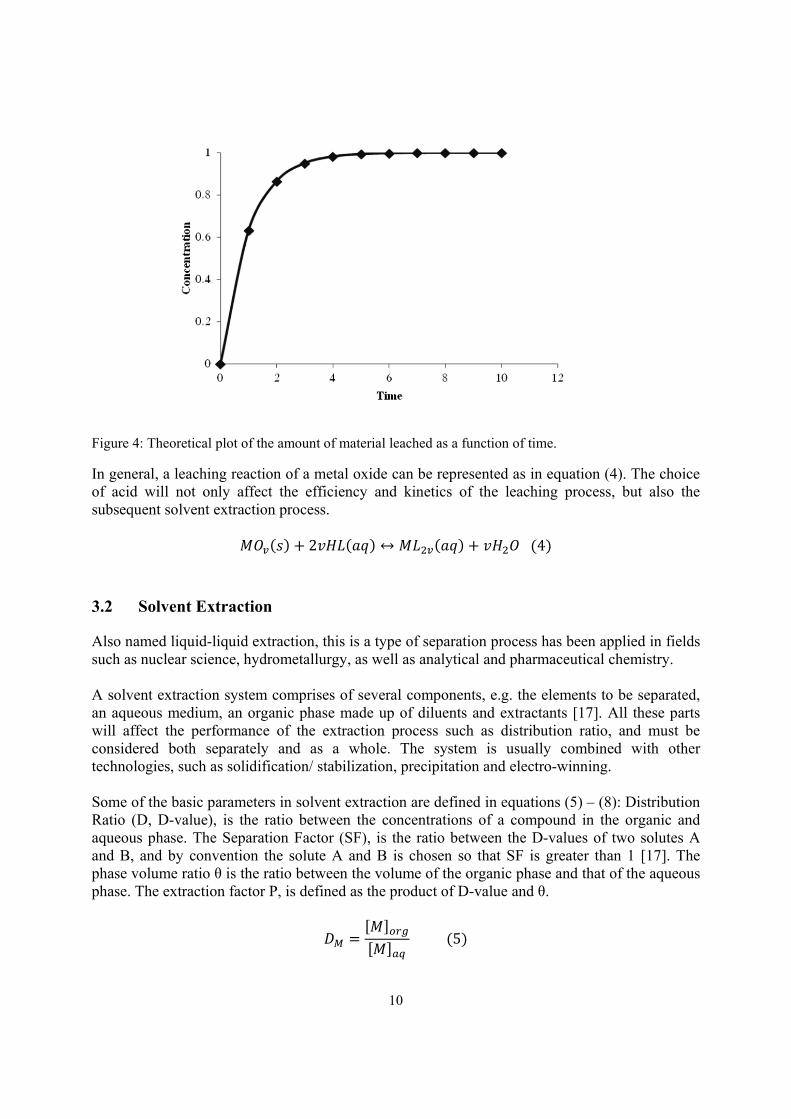
3.1 Leaching Leaching is the removal of a soluble fraction, in the form of a solution, from an insoluble, usually permeable, solid phase with which it is associated. Leaching agents can include water, acid, bases and salt solutions. Oxidation-reduction reactions may also be involved [15]. In metal processing industries leaching has been extensively used to remove metals as soluble salts and is also referred to as a hydrometallurgical process [16]. Pre-treatment processes such as crushing and grinding are often used on the solid feed material prior to leaching, depending on the proportion of the soluble constituents, and its distribution in the bulk solid. This is often done in order to increase the rate of leaching. When a material is being dissolved from the bulk solid to liquid, the rate of mass transfer from solid surface to the liquid is often the controlling factor. A simplified mass balance for the transport of solute from solid surface to liquid can be written as equation (1): = ∙ ( − )(1)
is the rate of mass transfer, is the mass transfer coefficient, is the saturation concentration of the solute a and is the concentration of solute a. A refers to the surface area of the solid. can be further expressed as: = (2) V is the volume of the liquid. Substitute (2) into (1), and integrate with respect to time, with the boundary condition = , = 0 and = , = , the analytical solution to the kinetics of leaching can be obtained: −− = (3) When ca is plotted against t, this results in the shape of a typical leaching kinetics curve, as shown in Figure 4.
10
Figure 4: Theoretical plot of the amount of material leached as a function of time.
In general, a leaching reaction of a metal oxide can be represented as in equation (4). The choice of acid will not only affect the efficiency and kinetics of the leaching process, but also the subsequent solvent extraction process. ( ) + 2 ( ) ↔ ( ) + (4)
3.2 Solvent Extraction Also named liquid-liquid extraction, this is a type of separation process has been applied in fields such as nuclear science, hydrometallurgy, as well as analytical and pharmaceutical chemistry.
A solvent extraction system comprises of several components, e.g. the elements to be separated, an aqueous medium, an organic phase made up of diluents and extractants [17]. All these parts will affect the performance of the extraction process such as distribution ratio, and must be considered both separately and as a whole. The system is usually combined with other technologies, such as solidification/ stabilization, precipitation and electro-winning. Some of the basic parameters in solvent extraction are defined in equations (5) – (8): Distribution Ratio (D, D-value), is the ratio between the concentrations of a compound in the organic and aqueous phase. The Separation Factor (SF), is the ratio between the D-values of two solutes A and B, and by convention the solute A and B is chosen so that SF is greater than 1 [17]. The phase volume ratio θ is the ratio between the volume of the organic phase and that of the aqueous phase. The extraction factor P, is defined as the product of D-value and θ. = [ ][ ] (5)

11
/ = , ≥ 1(6) = (7) = (8)
The distribution ratio can be converted to extraction percentage (E) by: = 1 + × 100%(9)
For a coupled extraction and strip cascade, as illustrated in Figure 5, the metals concentrations in various streams can be calculated by equations (10) – (13).
Figure 5: Simplified sketch of a counter-current extraction-strip cascade.
As can be seen in Figure 5, XF is the metal concentration in the aqueous feed of the extraction stages, XR is the metal concentration in the aqueous raffinate of the extraction stages. ZF is the metal concentration in the aqueous feed and ZP is the metal concentration in the aqueous raffinate of the strip stages. YF and YE is the metal concentrations in the organic feed and extract in the extraction stages, respectively. The number of stages in each part of the extraction system is expressed as n and m. The equations are based upon the assumptions that Zf = 0, as well as D-value being constant in each of the extraction stage, and each of the strip stage. Therefore this is a calculation of an ideal extraction system.
= ∙ ( − 1)(1 − ) + ( − 1)(1 − )(1 − )( − 1) + ( − 1)(1 − )(10)
extraction strip
PE, θE,
XF
YF YE
ZF ZP XR
PS, θS, m
X: metal concentrations in aqueous phase of extraction stage Y: metal concentrations in organic phase Z: metal concentrations in aqueous phase of strip stage
Leaching

12
= ∙ ( − 1)(1 − )(1 − )( − 1) + ( − 1)(1 − )(11) = ∙ 1 −(1 − )(12) = ( − )(13)
3.2.1 Classification of organic diluents One of the methods to classify diluents divides them into five classes based on their abilities to form hydrogen bonds [18]. The classes can be summarized as, Class 1: liquids capable of forming a three-dimensional hydrogen bond network. Class 2: liquids having hydrogen bond donor atoms and active hydrogen atoms, but do not form a three-dimensional network themselves. Class 3: liquids consisting of molecules with hydrogen bond donor atoms, but no active hydrogen atoms Class 4: liquids containing molecules with active hydrogen atoms, but no donor atom, Class 5: liquids with no hydrogen bond forming capabilities and no donor atoms Since water belongs to class 1 according to this definition, organic solvents of the same class are likely to be miscible with water, and are thus a poor choice for the purpose of solvent extraction. However, it might be that the diluents can show mutual solubility with water. Here it is of interest to note that solvents of class 3 can bind and extract metal ions in aqueous phase directly (e.g. cyclohexanone). Another important property of a solvent in solvent extraction is its mutual solubility with water. For a few common organic diluents, their water solubility (wt %) are: toluene (0.03) [18]; cyclohexanone (8.0) [18]; octanol (0.06) [19]; kerosene (traces) [19]. Ideally, the organic solvent to be used in a solvent extraction process should be as water-immiscibility as possible.
3.2.2 Extractants In general, charged or hydrated compounds such as dissolved metal ions are not soluble in most organic solutions. In order to extract metals to the organic phase, organic molecules referred to as extractants are used to form neutral complexes with the metal ions or aqueous metal compound. Depending on the reaction mechanism, the extractants can be classified as [20]:
1) acidic: the organic acid dissociates, and its conjugated base reacts with metal cation to form a neutral complex.
2) basic/ion pair: forms an ion pair with a negatively charged metal complex in the aqueous phase
3) solvating: replaces hydrated water molecules in the inner coordination sphere of the metal ion.

13
For industrial applications, the following criteria are used to assess the extractants [20]:
1) the ability to transfer the desired metals across the aqueous-organic interface 2) the ability of the extractant-diluent mixture to function efficiently with the proposed feed and
strip solutions in terms of rates of operation and stability towards degradations 3) the ability of the extractant to perform with maximum safety to plant, personnel and
environment at minimum cost 4) the ability of the process to interface with other unit operations both upstream (leaching) and
downstream (winning) in the overall extraction flow sheet.
In the past, different types of organic molecules have been studied as extractant for indium separation in aqueous media. Many of these extractants are organophosphate compounds. A few of them will be briefly described here: 3.2.2.1 Solvating Extractants: Tributyl Phosphate (TBP): The chemical structure of TBP is shown in Figure 6. This molecule has been used in nuclear chemistry since 1940s in the Plutonium-URanium EXtraction (PUREX) process [21]. It is one of the best-understood nuclear fuel reprocessing method today. In this process TBP is able to selectively extract Pu(IV) and U(VI) ions from nitric acid. This selectivity was also shown in Virolainen et al. [14], where Sn(IV) was extracted by TBP in kerosene from H2SO4, while In(III) remained in the aqueous phase until acid concentration exceeded 2M.
Figure 6: chemical structure of Tributyl Phosphate.
Cyanex 923 This is a mixture of four different types of trialkyl phosphine oxides, with the general chemical formulae: R3P=O, R2R’P=O, R(R’)2P=O, (R’)3P=O, where R is an octyl- group and R’ is a hexyl- group. Compared to a similar extractant tri-octyl-phosphine oxide (TOPO), the advantages with Cyanex 923 are that it is completely miscible with most common organic solvent at low ambient temperature, and its low aqueous solubility [22]. In Gupta et al [23], an extensive study has been done on indium extraction with Cyanex 923 as extractant in toluene. Different aqueous phases consisting of indium and another metal dissolved in HNO3, HCl or H2SO4 were tested. Results

14
showed that with a few exceptions such as Fe(III), indium could be quantitatively extracted (D≈10) with good separation (SF≈100) from the impurity that was present. 3.2.2.2 Acidic Extractants: Bis(2,4,4-trimethylpentyl)phosphinic acid (Cyanex 272) Figure 7 shows the general chemical structure of Cyanex 272. From the extraction mechanism it can be deduced that the distribution ratio is dependent on the pH of the extraction for acidic extractant. If the difference between the pH values at which two metals are extracted is large enough, they can be separated with acidic extractants by controlling the equilibrium pH of the extraction process. An example of this can be seen in B. Gupta et al [24], where indium was extracted from H2SO4 at pH≈1 and gallium at pH>2.
Figure 7: chemical structure of Bis(2,4,4-trimethylpentyl)phosphinic acid.
Bis(2-ethylhexyl)phosphoric acid (DEHPA) This molecule was first synthesized in the 1960s for nuclear technology-based applications, e.g. extraction of actinide ions in acidic solutions [25]. In an early study [26] regarding the extraction of indium from aqueous acidic media. The distribution ratio and extraction mechanism of indium from nitric, sulfuric and hydrochloric acid to DEHPA diluted in kerosene was investigated. The results showed that quantitative extraction of indium could be achieved at pH between 0 and 1 with H2SO4, HNO3 or HCl being the aqueous phase. A sketch of the structure of DEHPA is shown in Figure 8.
Figure 8: chemical structure of Bis(2-ethylhexyl)phosphoric acid.

15
4 Experimental The process proposed in this work is focused on the recycling of indium from waste LCD glass. It is a part of a larger LCD recycling process, as shown in Figure 9. The input material to the indium recycling process is in the form of fragmented LCD glass, with the final aim of separating indium into a pure product stream, where it can be further processed.
Figure 9: flow sheet of the overall LCD recycling process and the indium recycling process from LCD.
4.1 Removal of plastic material before leaching
Since one of the main constituents of the polarizer films, tri-acetate cellulose, is soluble in acetone, it was tested as a pre-treatment before leaching to remove the residual plastic films from the glass. LCD glass sample was immersed in washing-grade acetone for 30 minutes at S/L = 0.1 g/ml. Acetone solution after washing was decanted or filtered, and the plastic films which were not dissolved were physically separated from the glass by flotation using 25% wt calcium chloride (CaCl2 dihydrate, MERCK) solution. The amount of indium leached from the glass after acetone washing was measured and compared to the leaching results of LCD glass that was not immersed in acetone. The amount of organic material present in the leachate after washing by acetone was also measured in terms of Total Organic Carbon (Shimadzu Total Organic Carbon Analyzer TOC5000A), according to EU standard protocol [27].
Discarded LCD
Manual/ automated dismantling
Other waste (metal, plastic, PCB etc.)
Crushed LCD glass
Acid leaching
Solvent extraction
Glass waste
Other metals (aq)
Indium (aq)
Further processing
Further processing
Indium Recycling

16
4.2 Leaching test Leaching of crushed LCD glass by aqua regia over 2 days was done to characterize the types and approximate quantities of metals present in waste LCD glass. The extend of the ITO leaching by aqua regia was observed in SEM images of glass sample before and after leaching. Leaching kinetics for HNO3 (65%, Sigma Aldrich), H2SO4 (>95%, Fisher Scientific) and HCl (>37% Sigma Aldrich) was studied at initial concentrations of 0.1 M, 1 M and 6 M. The Solid-Liquid (S/L) ratio of crushed glass and acid was 0.1g/ml. The mixture of acid and sample was mechanically agitated at 350 rpm for up to 4 days. Aliquots of 1 ml leachate have been collected after 20 minutes and 4 days respectively. Some of the glass samples were leached again in 6M HCl to verify how much indium remained on the glass after leaching once. The effect of chloride concentration on leaching was investigated by preparing HCl solutions with different chloride concentrations. This was done by the addition of NaCl into 0.01 M HCl solutions. Metal concentrations in the leach liquor were determined using Inductively Coupled Plasma with Optical Emission Spectrometer (ICP-OES, Thermo iCAP-6000). The detection limit of the instrument for the metals of interest is in the range of parts per billion (<0.1µM), which is low enough for the quantification to be reliable. The samples were diluted by a volumetric factor of 10 in 0.1 M HNO3. The metal contents were quantified with standard solutions of known concentrations. Scanning Electron Microscope (SEM, FEI Quanta 200 ESEM FEG) images and Energy Dispersive X-Ray analysis (EDX, Oxford Inca 300) were taken of the glass before and after leaching with aqua regia to verify the amount of ITO that was dissolved.
4.3 Solvent extraction, batch experiments In batch experiments, equal volumes of organic and aqueous phase were shaken by machine (IKA VIBRAX VXR basic) at 1500 rpm for 10 minutes, at room temperature (20±2 oC). Screening tests were conducted on different commercially available diluents and extractants. All of the extractants chosen had been previously investigated in the context of In(III) separation from other metal ions such as Ga(III), Fe(III), Zn(II) etc. The aqueous phase was prepared by dissolving salts of the most abundant metals found in total material analysis in sulfuric or hydrochloric acid. Metal concentrations in the aqueous phase were based on the results from the dissolution experiments. The diluents chosen were kerosene (Solvent 70, Statoil), toluene (99.5%, Sigma Aldrich), n-octanol (96%, Acrōs Organics) and cyclohexanone (99.8% Lab-Scan Analytical Science), and the reagents were TBP (97%, Sigma Aldrich), Cyanex 272 (85%, Cytec) and 923 (93%, Cytec), and DEHPA (97%, Sigma Aldrich). All extractants were diluted to 0.1 M concentration, except TBP, which was diluted to 50% vol. In the extraction kinetics investigations, the shaking time varied between 5 minutes and 150 minutes. Samples of the aqueous phase before and after extraction were taken and analyzed by ICP-OES in the same way as described in the acid leaching experiments. The distribution ratios and separation factors were calculated by taking the mass balance in aqueous phase before and after the extraction.
17
4.4 Solvent extraction, AKUFVE experiments For more information about the AKUFVE system, see Appendix B. The aqueous phase used in the experiments was similar to that of the screening test. Based on the results in the screening test, two extraction systems were chosen for further study, namely H2SO4/0.1 M DEHPA in kerosene, and HCl/0.1 M DEHPA in kerosene. The effects of temperature and pH on distribution ratios of the metals were investigated. In the temperature dependency measurements the temperature varied between 10 oC and 50 oC. In the pH dependency measurements, the experiments were performed at 20±2 oC. pH value was raised from 0.8 by addition of 3M NaOH solution, the experiment was stopped at pH 3.5 due to Cu(OH)2 precipitate forming. In each AKUFVE run, 100 ml aqueous and organic phase was used. At each sampling, 1 ml of both phases was taken for analysis. Organic phase was contacted with 2 M HCl solution and shaken by machine for 20 minutes at 1500 rpm and 20±2 oC. Results of batch extraction experiment between 2 M HCl and 0.1M DEHPA in kerosene showed that metals other than iron and tin could be quantitatively stripped into 2 M HCl. Therefore the D-values of those metals were calculated from metal concentrations in the aqueous phases from extraction and stripping step. DSn and DFe
were calculated by mass balance in the aqueous phase of extraction step. Metal concentrations were quantified with ICP-OES.

18

19
5 Results and Discussion In this section, the results of various leaching and solvent extraction experiments and their related calculations are presented and discussed.
5.1 Removal of plastic material before leaching It was noticed that during acid leaching that some acids could partially decompose the plastic film that remained on the LCD glass. Since the organic material could later accumulate in the organic phase during the solvent extraction stage, it is of interest to study how much plastic material is dissolved in the acid, as well as possibilities to remove the plastic film by solvents. The data in Table 2 shows the amount of indium leached from LCD glass with various acids and conditions. Indium content in 1 M HCl and aqua regia after 1 day of leaching is also listed as reference. Table 2: comparison of amount of indium leached via different methods after 1 day.
Indium content (mg In/g glass)
1 M HCl 0.24±0.01
Acetone washing 0.08±0.01
Acetone washing with filtration
0.22±0.03
Acetone washing with filtration and CaCl2
0.21±0.03
The result shows that if the acetone is decanted instead of filtered after washing, the amount of indium that could be recovered in the subsequent acid leaching was reduced by up to 66%. Evaporating the decanted acetone in open air and analyzing the residue with SEM-EDX showed that the decanted acetone contained some of the LCD glass. The presence of indium was only detected on the glass particles (marked spots in Figure 15). This indicates that the ITO layer might be physically removed, since its adherence to the glass layer seemed to decrease with the addition of acetone. Filtration of the acetone solution resulted in a significant reduction of the amount of ITO lost in the acetone solution.

20
Figure 15: SEM image of the material deposited from the acetone used to wash LCD glass, where the marked spots are glass particles with ITO.
The amount of organic carbon dissolved in the 1 M HCl is shown in Table 3, with the values of dissolved organic material in 1 M HCl and 1 M H2SO4 after 1 day of leaching presented for comparison. The glass samples were rinsed by water before leaching. It can be seen that the amount of organic carbon present after 1 day of leaching with 1 M HCl is much higher in the case where the glass sample was not washed by CaCl2 after acetone was filtered. This could be due to majority of remaining polymeric film after acetone were separated and removed with 25 wt% CaCl2 solution. Furthermore, it can be seen that the amount of organic materials dissolved in 1 M H2SO4 is comparatively low, hence this type of pretreatment may not be necessary if H2SO4
is chosen as the type of acid for leaching. Table 3 Content of total organic carbon in 1 M HCl and H2SO4 after leaching of LCD glass for 1 day
Leaching Acid Additional Treatment TOC
mg organic carbon / g glass
1 M HCl None 7±0.7
1 M H2SO4 None 2.8±0.3
1 M HCl Acetone washing
with filtration 48±9
1 M HCl
Acetone washing with filtration and CaCl2
3±0.5

21
5.2 Leaching experiments The amount of indium in LCD varies between different manufacturers. It is known from earlier literatures [3], [10] that indium content in an LCD panel is in the range of 0.2 – 0.3 g In/kg glass, or 0.65 – 0.95 g In/m2 glass, with tin being 10% of indium in mass. It is also likely that other metals can be found on e.g. the edges of the LCD panel. Therefore leaching in aqua regia was done to determine the types and amount of metals present on the LCD samples. The samples were then leached by more dilute mineral acids to study the leaching kinetics for indium, tin and the most abundant metal impurities.
5.2.1 Materials characterization The results of metal dissolution by aqua regia are given in Table 1. It shows that other than In and Sn from ITO, Fe, Cu, Al and Zn are also present as metal impurities. As can be seen, the content of metals other than indium and tin can vary greatly, especially Al, Cu, Fe and Zn. This is mainly due to factors such as the method used to dissemble the LCD, and how well was the glass separated from other parts of an LCD before the leaching stage. The leaching process reached equilibrium after 2 hours. Table 1: Metal content of shredded LCD panel glass determined by leaching in aqua regia. The uncertainties are a calculated standard deviation from triplet samples.
Element µg metal/g glass
Ag 4±3
Al 65~825
Co 4±0.4
Cr 4±0.4
Cu 10~250
Fe 70~500
In 200±50
Mg 6±1
Mn 2±0.5
Ni 17±4
Sn 20±3
Zn 20~270

22
SEM image and EDX analysis on the LCD glass before and after leaching was performed in order to determine if there is any indium remaining, as shown in Figure 10. The patterned ITO coating is clearly visible in Figure 10a. On the other hand, after leaching with aqua regia (Figure 10b), the ITO layer was no longer observed. Instead the rectangular-shaped color filter blocks positioned below the ITO coating have been exposed. In addition, EDX analysis on the surfaces shown in Figure 10 was performed. The EDX results indicate that more than 95% of the ITO has been dissolved by aqua regia. Therefore 200±50 µg In/g glass can be taken as the average indium content in the LCD glass studied.
Figure 10: SEM image of crushed LCD glass: a) before leaching by aqua regia, where the ITO layer is
visible, b) after the ITO has been dissolved by leaching with aqua regia
5.2.2 Acid leaching kinetics The results of the leaching test are presented in Figures 11-13. For all of the acid concentrations investigated, the maximum amounts of indium leached are around 0.2 g In/g glass. This is in good agreement with results from leaching in aqua regia is presented in Table 1, and SEM image of LCD glass surface before and after leaching in aqua regia is shown in Figure 10. Some of the glass samples were leached for a second time with 6 M HCl, comparison of the results showed that roughly 90% of ITO was removed by leaching with acid once.

23
Figure 11: (a) Indium (b) tin (c) aluminum (d) iron leaching kinetics in HNO3 between 1 hour and 4 days.
Crushed glass of an LCD monitor was immersed in HNO3 of different concentrations under mechanical stirring, all samples were measured with ICP-OES, the indium concentration was measured as ppm, and later converted to g In per g crushed glassed leached.

24
Figure 12: (a) Indium (b) tin (c) aluminum (d) iron leaching kinetics in HCl between 1 hour and 4 days.
Crushed glass of an LCD monitor was immersed in HCl of different concentrations under mechanical stirring, all samples were measured with ICP-OES, the indium concentration was measured as ppm, and later converted to g In per g crushed glassed leached.

25
Figure 13: (a) Indium (b) tin (c) aluminum (d) iron leaching kinetics in H2SO4 between 1 hour and 4 days.
Crushed glass of an LCD monitor was immersed in H2SO4 of different concentrations under mechanical stirring, all samples were measured with ICP-OES, the indium concentration was measured as ppm, and later converted to g In per g crushed glassed leached.
It can be seen by comparison that the dissolution kinetics of indium oxide is the fastest in chloride media at acid concentrations of 1 M or greater. At concentrations of 6 M, the amount of indium dissolved into HCl was nearly at equilibrium values in less than 2 hours, whereas at least 4 hours are required for H2SO4 and HNO3 to reach the same level. In addition, it was visually observed that, for HNO3 and HCl at 6 M, white flakes of partially dissolved plastic film appeared in the solution after a period of 1 to 2 days. However, this is a minor problem for 6 M HCl since the kinetics of indium leaching is much less than 1 day. A similar phenomenon was not observed for H2SO4 at any of the three concentrations. The dissolution of organic material is an undesirable effect since it can make the filtering of leach liquor more difficult, and may have a negative impact on the subsequent solvent extraction process. The kinetics of leaching for indium and tin are similar according to e.g. Figure 11a and 11d, this could be due to both metals exists as oxides initially. The leaching kinetics of Al and Fe are shown in Figure 11c-d, 12c-d and 13c-d. For

26
these two metals, which are most likely present in their metallic forms, the rate of leaching is much slower than for In and Sn. In most cases the leaching of Al and Fe did not reach equilibrium after 4 days. Therefore it is possible that In and Sn can be partially separated from other metals during leaching stage. By comparing with the leaching data for aqua regia, and the amount of indium in the solution after leaching the glass for a second time with 6 M HCl, it was seen that at 80-95% of indium on the glass can be dissolved into all of the acids tested by leaching once. In order to investigate the effect of ligand ion concentration on leaching kinetics, the amount of indium leached by HCl solutions with various chloride concentrations was presented in Figure 14. It can be seen that the increasing the chloride concentration did have a positive effect on the amount of indium leached. However the increase in the amount of indium leached is small compared to the data obtained in Figure 11 with varying [H+], this indicates that [H+] has a larger impact on the leaching kinetics than the ligand concentration.
Figure 14: The effect of ligand concentration on indium leaching. Crushed glass of an LCD monitor was immersed in HCl, with initial [H+]=0.01 M and [Cl-] varying between 0.01 M and 3 M under mechanical stirring, all sample were measured with ICP-OES, indium concentration was measured as ppm, and later converted to g In per g crushed glassed leached.
With respect to experimental results and observations, HNO3 is a poor choice for leaching indium from the panel glass. In terms of efficiency and tendency to dissolve plastic substance, 1 M HCl is the best choice of the ones investigated. The concentration of HCl used for the process should be kept below 3 M to avoid dissolving plastic.
0
20
40
60
80
100
120
0,01 0,1 1 10
mg
In /
kg p
anel
total [Cl-] / M
4h
1 day

27
5.3 Solvent extraction of indium 5.3.1 Screening test, extraction stage HNO3 was excluded as a choice of aqueous phase due to slower leaching kinetics, and the likelihood of dissolved plastic materials. 0.1 M and 1 M HCl or H2SO4 was used as the aqueous phase for Cyanex 272, Cyanex 923 and DEHPA, while 6 M HCl or H2SO4 was used for TBP. The initial acid concentrations of the aqueous phase were chosen based on results of previously published works on indium extraction with the extractants listed ( [23] - [28] ). The initial metal concentrations in the aqueous phase are given in Table 4. In order to facilitate measurement of data and to simulate a more realistic process condition, the concentrations were set to be approximately 10-20 times as much as in the leach liquor.
Table 4: Metal composition of the simulated aqueous phase
Name Concentration / mM
Al 5.6
Cu 2.4
Fe 2.7
In 1.7
Sn 0.17
Zn 2.3
The distribution ratios calculated from the measured results of various extraction systems investigated are presented in Figure 16-19, lines are drawn to aid the viewing of the results only. From the results, the effect of different organic extractants and diluents on metal extraction, and the extent of metal separation for each organic/aqueous system can be observed and analyzed.

28
Figure 16: Distribution ratio between (a) 0.1 M H2SO4 (b) 1 M H2SO4 (c) 0.1 M HCl (d) 1 M HCl
containing indium and five other metals and an organic phase of 0.1 M Cyanex 272 in kerosene (K), toluene (T), cyclohexanone (C) and n-octanol(O), respectively.

29
Figure 17: Distribution ratio between (a) 0.1 M H2SO4 (b) 1 M H2SO4 (c) 0.1 M HCl (d) 1 M HCl
containing indium and five other metals and an organic phase of 0.1 M Cyanex 923 in kerosene (K), toluene (T), cyclohexanone (C) and n-octanol(O), respectively.

30
Figure 18: Distribution ratio between (a) 0.1 M H2SO4 (b) 1 M H2SO4 (c) 0.1 M HCl (d) 1 M HCl
containing indium and five other metals and an organic phase of 0.1 M DEHPA in kerosene (K), toluene (T), cyclohexanone (C) and n-octanol(O), respectively.

31
Figure 19: Distribution ratio between (a) 6 M HCl (b) 6 M H2SO4 containing indium and five other metals
and an organic phase of 1.75 M TBP in kerosene (K), toluene (T), cyclohexanone (C) and n-octanol(O), respectively.
. The effect of diluents on metal extraction can be seen in e.g. Figure 17d). The distribution ratio of indium between 1M HCl and Cyanex 923 in different diluents is summarized in Table 5, together with the dielectric constants (ε) of the diluents. In the table, an inverse proportionality between the dielectric constant and distribution ratio can be seen. However, it can also been seen that when n-octanol was used as diluents, the distribution ratio of indium is more than one order of magnitude lower than with other diluents. A similar reduction of distribution ratio in octanol was observed in an earlier study [29], where a positive correlation between D-value and solubility of extractant in the diluent used was seen. Table 5: Distribution ratio of indium between 1 M HCl and Cyanex 923 diluted in different organic solvent
Diluents DIn ε
kerosene 36±3 1.9
toluene 20±2 2.4
cyclohexanone 13±2 15.8
n-octanol 0.3±0.02 10.5
Furthermore, regardless of the organic extractant used, the overall metal extraction tends to be higher in cyclohexanone than toluene or n-octanol. This could be partially due to relatively high mutual miscibility of cyclohexanone and water. However, cyclohexanone is classified as a solvent with donor atoms for hydrogen bonding but no active hydrogen atoms. This causes such

32
solvents to directly react with inorganic compounds [18]. Metal extraction by cyclohexanone as the organic extractant has been studied in previous papers, such as in the separation of titanium and niobium [30], 99Tc [31] and light actinides (Th, Np, U) [32]. The results in e.g. Figure 15d also showed that the use of cyclohexanone diluents results in higher iron and tin extraction compared to other metals. The feasibilities of different extraction systems in a separation process to recover indium can also be assessed by screening of different extraction systems. From Figure 16, it can be seen that with Cyanex 272, tin can be readily separated from the other metals, but the separation of indium from other metals such as iron or zinc was poor. In Figure 17, the results show that In can be separated from Zn, Fe, Cu and Al by extracting with 0.1 M Cyanex 923 in kerosene from 1 M H2SO4. The main drawback with this extractant is the co-extraction of Sn, as the difference in the DSn and DIn
is small in all the combinations involving Cyanex 923 as extractant. The distribution ratio in different extraction systems containing DEHPA is shown in Figure 18. This was considered to be the optimal extractant with respect to indium recovery. The separation of indium can be achieved by e.g. first extracting from 0.1 M HCl by 0.1 M DEHPA, followed by stripping of the loaded organic phase with 1 M HCl. The separation factor between In and Al or Cu in the extraction stage was calculated to be over 1000. In the strip stage, SFSn/In=36±9 and SFFe/In=35±8, respectively. In Figure 19, it was shown that TBP can selectively extract In and Sn from 6 M HCl, with SFSn/In=6±0.3. While it could be possible to selectively strip indium from the organic phase with dilute acid, it is still a less economical alternative compared to DEHPA, due to higher concentration of acid and extractant needed. Within the conditions tested, extraction from 0.1 M or 1 M H2SO4 to 0.1 M DEHPA in kerosene, and strip by HCl is the best alternative for the separation and recovery of indium. 5.3.2 Screening test, strip stage Two extraction systems, namely 1 M H2SO4 – 0.1 M DEHPA in kerosene, and 0.1 M H2SO4 – 0.1 M DEHPA in kerosene were chosen for the study of different strip conditions. This was mainly due to the large difference in Din, DFe and DSn between DEHPA and different aqueous phases (Figure 18). The results are shown in Table 6. The metal composition in the aqueous phase before extraction was similar to what was used in the previous screening test. Table 6: Metal stripping efficiencies of different aqueous media, expressed as percentage of metal content in the initial feed. The organic phase was 0.1M DEHPA in kerosene
Aqueous phase (extraction stage)
Aqueous phase
(strip stage) In Al Cu Fe Sn Zn
1 M H2SO4 2 M H2SO4 10±4% 1.2±1% 2.6±2% 10±2% 0.2±0.1% 0.5±0.1% 2 M HNO3 1.0±0.1% 1.3±1% 4.0±3% 1.0±0.4% 0.8±0.5% 0.7±0.1% 2 M HCl 86±9% 2.2±0.4% 10±8% 8.4±0.4% 0.7±0.4% 1.3±0.5% 1 M HNO3 0.3±0.1% 2.0±1% 1.8±0.2% 0.3±0.2% 0.9±0.5% 0.4±0.3% 1 M HCl 72±22% 2.0±1% 1.2±1% 1.3±1% 0.8±0.5% 0.9±0.4%
0.1 M H2SO4 2 M H2SO4 21±0.3% 18±2% 0.9±0.3% 24±5% <0.1% 5.8±1% 2 M HNO3 2.8±0.1% 19±2% 0.7±0.3% 3.7±0.8% 0.9±0.1% 5.3±2% 2 M HCl 99.5±0.3% 19±2% 2.8±1.1% 25±5% 3.0±0.2% 5.2±2% 1 M H2SO4 2.4±0.1% 20±2% 2.5±0.9% 4.6±1% 1.6±0.1% 4.8±2% 1 M HNO3 0.5±0.1% 15±1% 0.3±0.1% <0.1% 2.8±0.2% 8.4±3% 1 M HCl 96±2% 18±2% 2.2±0.8% 2.5±0.5% 2.1±0.2% 5.2±2%

33
It can be seen from the result that HCl is much more efficient at stripping indium than the other acids tested. It was suggested in an earlier work [14] that for an extraction system containing indium and tin, indium could be selectively stripped from 1 M DEHPA in kerosene with HCl at concentration of 2 M or greater. However, in the case of LCD recycling, additional metal impurities are present. Increased aqueous acidity will also reduce DFe, to the extent that both iron and indium will be stripped to the aqueous phase. Therefore even though the recovery of indium is higher when 2 M HCl is used for stripping, from the perspective of metal separation, it is more advantageous to use lower (1 M) acid concentration. The effect of H2SO4 concentration on the recovery of metal can be noticed from the results as well. With 0.1 M H2SO4 as aqueous phase in the extraction stage instead of 1 M, both the recovery of indium and aluminum are increased. θ in both the extraction and strip stage can be adjusted to suppress the extraction of aluminum. Due to indium having a large D-value in the 0.1 M H2SO4 – 0.1 M DEHPA in kerosene system, percentage recovery of indium will not be greatly affected. 5.3.3 Preliminary Process calculation Based on the process settings presented in Figure 5, and experimental results, calculations on metal concentrations in the outflow of a process consisting of an extraction and strip stage was performed. D-values of 0.1 M H2SO4 – 0.1 M DEHPA in kerosene and 1 M H2SO4 – 0.1 M DEHPA in kerosene were used to calculate PE. D-values of 1 M HCl - 0.1 M DEHPA in kerosene were used to calculate PS. The D-values used in the calculations are shown in Table 7. Different parameter values of θE, θS, n and m, and the calculated ZP are included in Table 8. Table 7: Distribution ratios used in the calculation of counter-current extraction-strip cascade
Aqueous phase Organic phase DIn DAl DCu DFe DSn DZn
Extraction 0.1 M H2SO4 0.1 M DEHPA kerosene 500 0.1 0.02 3 3 0.02 Extraction 1 M H2SO4 0.1 M DEHPA kerosene 3 0.02 0.05 0.3 0.3 0.02
Strip 1 M HCl 0.1 M DEHPA kerosene 0.1 0.02 0.05 10 10 0.02 Table 8: Simulated results of % metal recovery in a coupled extraction-strip system under various conditions.
Extraction stage aqueous phase
n m θE θS In Al Cu Fe Sn Zn In wt%
Initial feed 0.2g/l 0.15g/l 0.15g/l 0.15g/l 0.02g/l 0.15g/l 24.4 1 M
H2SO4 1 1 1 1 73.2% 1.9% 4.5% 2.7% 2.7% 1.9% 90%
5 5 1 1 99.7% 2.0% 5.0% 3.0% 3.0% 2.0% 91% 10 10 1 1 >99.9% 2.0% 5.0% 3.0% 3.0% 2.0% 91% 1 1 0.5 2 55.6% 1.0% 2.2% 0.7% 0.7% 1.0% 94% 5 5 0.5 2 95.2% 1.0% 2.5% 0.7% 0.7% 1.0% 96% 10 10 0.5 2 99.4% 1.0% 2.5% 0.7% 0.7% 1.0% 96%
0.1 M H2SO4
1 1 1 1 99.8% 8.9% 1.9% 21.4% 21.4% 1.9% 78.2%
5 5 1 1 >99.9% 10.0% 2.0% 25.0% 25.0% 2.0% 75.9% 10 10 1 1 >99.9% 10.0% 2.0% 25.0% 25.0% 2.0% 75.9% 1 1 0.5 2 99.5% 4.6% 0.9% 6.7% 6.7% 1.0% 90.5% 5 5 0.5 2 >99.9% 5.0% 1.0% 7.3% 7.3% 1.0% 89.7% 10 10 0.5 2 >99.9% 5.0% 1.0% 7.3% 7.3% 1.0% 89.7%

34
The results showed that by increasing the number of stages, a larger fraction of metals in the initial feed was transferred to the raffinate of strip stage. However, this resulted in reduced separation of indium from other metals for the 0.1 M H2SO4 system. On the other hand, the effect of lowering θE to below 1 and raising θS to above 1 was the opposite. Indium separation is improved at the cost of the amount of metal extracted and stripped. This effect is more apparent for 1 M H2SO4 since its DIn is relatively low for the purpose of extraction. Another result of decreasing θE and increasing θS was reduced volume of both the organic phase and strip acid, as well as raising the metal concentration in the raffinate of the strip stage by a factor of θS/ θE. Although the advantage of 1 M H2SO4 over 0.1 M H2SO4 is better indium separation, it could still be better to use 0.1 M H2SO4 due to requiring fewer stages to reach nearly complete indium recovery.
5.4 Optimizations of indium extraction
5.4.1 Kinetics of indium extraction The extraction kinetics was investigated for systems where clear separation of indium from another metal was observed (see Figure 16-19). The changes in the D for indium and other metals are presented in Figure 20-22.
Figure 20: Kinetics of indium extraction between 1 M HCl and 0.1 M DEHPA in kerosene, A/O=1. The shaking time of the mixtures was between 5 minutes and 2.5 hour at 1500 rpm and 20±1 oC. The distribution ratios and separation factors were calculated from the metal concentrations in the aqueous phase measured by ICP-OES before and after shaking.

35
Figure 21: Kinetics of indium extraction between 1 M H2SO4 and 0.1 M DEHPA in kerosene, A/O=1. The shaking time of the mixtures was between 5 minutes and 2.5 hour at 1500 rpm and 20±1 oC. the distribution ratios and separation factors were calculated from the metal concentrations in the aqueous phase measured by ICP-OES before and after shaking.
Figure 22: Kinetics of indium extraction between 0.1 M H2SO4 and 0.1 M DEHPA in kerosene, A/O=1. The shaking time of the mixtures was between 5 minutes and 2.5 hour at 1500 rpm and 20±1 oC. the distribution ratios and separation factors were calculated from the metal concentrations in the aqueous phase measured by ICP-OES before and after shaking.
The three systems with 0.1 M DEHPA as extractant were chosen due to their abilities to separate In from Zn, Fe and Sn. The time required for the distribution ratio of indium to reach equilibrium is less than 5 minutes in the 0.1 M H2SO4 system, while approximately 20 minutes is needed in the other systems. It can also be seen that the time required for Fe and Sn to reach equilibrium is slightly longer than indium in all three cases. Therefore, 1 M and 0.1 M H2SO4, extending the extraction time beyond 30 minutes will not have a positive impact on indium extraction, but will

36
lower the separation factors between indium and the metals co-extracted (Fe and Sn). This is especially true for the 0.1 M H2SO4 system , where short contact times (<10 minutes) is extremely advantageous for the separation of indium (Figure 22). In the strip stages, Figure 20 showed that a contact time of longer than 20 minutes is preferred.
5.4.2 Effect of pH on metal extraction Measured D-values between 2 M HCl and 0.1 M DEHPA in kerosene are presented in Table 9. It can be seen that the D-values for Al, Cu, In and Zn are low, i.e. quantitative stripping can be achieved. For Fe and Sn, their D-values and E were calculated in the same way as in the batch extraction experiments. Table 9: calculated D-values between 2 M HCl and 0.1 M DEHPA/kerosene, θ=1. Uncertainties are calculated standard deviation of triplet samples
Metal Al Cu Fe In Sn Zn D 0.022±0.02 0.026±0.02 0.56±0.24 0.030±0.02 0.65±17 0.029±0.02
Since DEHPA is an acidic extractant, a decrease in pH will increase the distribution ratio, and thus the extraction percentage of the metals in the aqueous phase. The effect of pH on D-value is already seen in Figure 18, with AKUFVE the effect of pH on the extraction of metals can be studied in details. Extraction percentage was plotted against pH for the six main metal species present in the leach liquor of the LCD glass studied. Figure 23 shows the extraction between H2SO4 aqueous phase and 0.1 M DEHPA in kerosene, Figure 24 shows the extraction between HCl aqueous phase and 0.1 M DEHPA in kerosene.
Figure 23: the percentage extraction of Al(III), Cu(II), Fe(III), In(III), Sn(IV) and Zn(II) plotted as function of pH. The organic phase was 0.1 M DEHPA diluted in kerosene, and aqueous phase was H2SO4. Both phases were sampled and organic phase sample was stripped by 2 M HCl at θ=1.
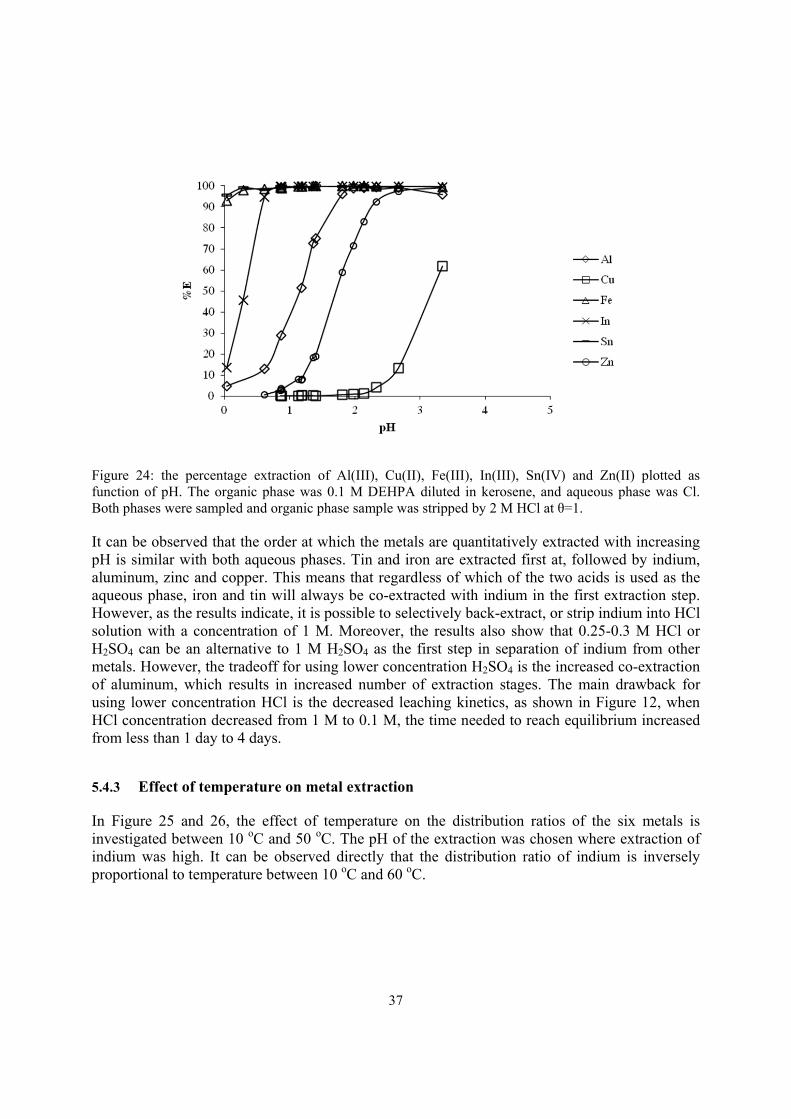
37
Figure 24: the percentage extraction of Al(III), Cu(II), Fe(III), In(III), Sn(IV) and Zn(II) plotted as function of pH. The organic phase was 0.1 M DEHPA diluted in kerosene, and aqueous phase was Cl. Both phases were sampled and organic phase sample was stripped by 2 M HCl at θ=1. It can be observed that the order at which the metals are quantitatively extracted with increasing pH is similar with both aqueous phases. Tin and iron are extracted first at, followed by indium, aluminum, zinc and copper. This means that regardless of which of the two acids is used as the aqueous phase, iron and tin will always be co-extracted with indium in the first extraction step. However, as the results indicate, it is possible to selectively back-extract, or strip indium into HCl solution with a concentration of 1 M. Moreover, the results also show that 0.25-0.3 M HCl or H2SO4 can be an alternative to 1 M H2SO4 as the first step in separation of indium from other metals. However, the tradeoff for using lower concentration H2SO4 is the increased co-extraction of aluminum, which results in increased number of extraction stages. The main drawback for using lower concentration HCl is the decreased leaching kinetics, as shown in Figure 12, when HCl concentration decreased from 1 M to 0.1 M, the time needed to reach equilibrium increased from less than 1 day to 4 days.
5.4.3 Effect of temperature on metal extraction In Figure 25 and 26, the effect of temperature on the distribution ratios of the six metals is investigated between 10 oC and 50 oC. The pH of the extraction was chosen where extraction of indium was high. It can be observed directly that the distribution ratio of indium is inversely proportional to temperature between 10 oC and 60 oC.

38
Figure 25: the distribution ratio of Al(III), Cu(II), Fe(III), In(III), Sn(IV) and Zn(II) plotted as function of temperature, the aqueous phase was 1 M H2SO4. Both phases were sampled and organic phase sample was stripped by 2 M HCl at θ=1.
Figure 26: the distribution ratio of Al(III), Cu(II), Fe(III), In(III), Sn(IV) and Zn(II) plotted as function of temperature, the aqueous phase was 0.1 M HCl. Both phases were sampled and organic phase sample was stripped by 2 M HCl at θ=1.

39
For acidic extractants, under the assumption that Mν+ is the dominant metal species in an acidic environment, their general extraction reaction can be seen in equation (15). + ( ) ↔( ) + (15)
Since pH only changes slightly between 283K and 333K, and extractant concentration [ ] is much higher than metal concentration, [ ] and [ ] can be considered as relatively constant. The distribution ratio (DM) and extraction constant (Kex) can be related by equation (17): = [ ][ ] (16)
= [ ][ ][ ][ ] ≈ ∙ [ ][ ] (17)
Thus within the temperature range studied, Kex is also inversely proportional to temperature. According to Van’t Hoff’s equation: ( ) = Δ (14)
Since D-value and Kex of indium decreases with increasing temperature, ( ) < 0, this
indicates that Δ of the extraction reaction is negative, thus the extraction of indium is an exothermic process. The results in Figure 25 showed that low temperatures favor the extraction of indium from sulfate media. In addition, data in Figure 26 showed that D-values for Fe and Al are proportional to temperature. This indicates that performing stripping in HCl at higher than room temperature will both increase the amount of indium recovered, and its separation from Fe and Al. However, considering other factors such as the need to install cooling and heating systems, performing the extraction at room temperature (20±2 oC) is still likely to be the optimal alternative.

40

41
6 Conclusion The current work investigated a potential hydrometallurgical method to recycle indium from the panel glass of used LCD monitors and TVs. This method involves leaching of indium-tin oxide from the surface of crushed LCD glass, followed by separation of indium from other metals in the leaching acid through solvent extraction. HNO3, HCl, and H2SO4 of different concentrations have been tested for the leaching of indium from crushed LCD glass. 1 M H2SO4 and 1 M HCl were deemed as the most feasible alternatives, based on kinetics studies. HNO3 had both slower leaching kinetics and a more noticeable effect of partially digesting the polymeric material adhered on the LCD glass during leaching. Since the dissolution of plastic material occurs at a similar time as equilibrium in indium leaching is reached, this makes the filtration of leach liquor more difficult. It could also negatively impact the subsequent solvent extraction process In the solvent extraction screening experiments, different extraction systems were prepared from different aqueous and organic phases. The results showed that out of the systems studied, extraction from 1 M H2SO4 to 0.1 M DEHPA in kerosene followed by stripping with 1 M HCl was a promising alternative for the recovery of indium. Further studies on extraction kinetics were performed. It was concluded that the extraction in the aforementioned system reached equilibrium with respect to indium in 5-10 minutes, also that longer extraction time had a negative impact on the separation of indium. The pH and temperature dependence of metal extraction was investigated for the two extraction systems chosen in the screening test. The results reinforced the conclusion from the screening test, that indium could be separated into a relatively pure fraction with DEHPA. Furthermore, the pH study also showed that good indium separation could also be achieved by extraction at lower acid concentrations. It was concluded from the temperature dependency that the optimal condition for indium extraction was 20 oC or lower. The results of the experiments have shown that up to 90% of indium can be recovered from LCD glass into acid solutions by leaching once. It is also possible through solvent extraction to separate indium from other impurities to a purity of 95%. Higher purity could be achieved by optimization of the solvent extraction, or by additional processes such as electrolysis.

42
43
7 Future Work Due to the low content of ITO in the LCD glass, a pre-concentration process will likely be needed after leaching. This could be done by e.g. an ion-exchange column or an additional solvent extraction step after leaching. In the next step, the extraction and strip isotherm needs to be constructed. This is done by measuring the distribution ratio DEHPA/kerosene organic phase and HCl or H2SO4 as the aqueous phase at different metal concentrations. The isotherm data will be used to calculate the number of ideal stages needed at higher (>1 g/L) metal concentrations in the aqueous feed. As a bench-scale simulation of the process, the metal extraction, and indium separation will be tested in a multistage mixer-settler contactor. The type and concentration of solvents in aqueous and organic phases will be selected according to results from previous experiments and calculations. Finally a method to recover indium back into metallic form should be investigated; electrolysis is one of the more common methods when high purity is required.

44
45
8 Acknowledgement I would like to thank:
o My supervisors, Christian Ekberg and Teodora Retegan, for helping me with the project, and more
o My examiner, Gunnar Skarnemark, for all the help you provided
o Arvid Ødergaard-Jensen, for helping me to start the project
o Johan Felix, Bill Letcher and Sverker Sjölin, for always taking time to answer
questions about the project and LCD in general
o Vinnova, for funding the project
o My colleagues (present and former) at Nuclear Chemistry and Industrial Materials Recycling. In particular, Kristian Larsson, Emma Aneheim, Stellan Holgersson, Lars-Erik Ohlsson, Britt-Mari Steenari and Mark Foreman
o Sravya Kosaraju and Henrik Åsheim, for simply being the best and most awesome office roommates. And that, unlike cake, is not lies.
o My family, I would not have come this far without you.

46

47
9 Reference [1] DisplaySearch, "Quarterly Global TV Shipment and Forecast Report," Q2 2012. [Online]. Available:
http://www.displaysearch.com/cps/rde/xchg/displaysearch/ hs.xsl/quarterly_global_tv_shipment_and_forecast_report.asp. [Accessed 16 7 2012].
[2] F. J., L. B., T. H., R. K. and R. T., "P-61: Recycling and Re-Use of LCD Components and Materials," in SID Symposium Digest of Technical Papers, Seattle, Washington, USA, 2010.
[3] B. Kopacek, "ReLCD - Recycle and Reuse of LCD Panels," in 19th Waste Management Conference of IWMSA (Wastecon 2008), Durban, 2009.
[4] European Commission, "Critical raw materials for the EU," European Commission, , 2010.
[5] M. J. Chagnon, Indium and indium compounds, Kirk-Othmer Encyclopedia of Chemical Technology, 2010, p. 1–12.
[6] B. Fowler, H. Y. E. Conner and M. Akkerman, "Cancer risks for humans from exposure to semiconductor metals.," Scand. J. Work Environ. Health, vol. 19, no. 1, pp. 101-103, 1993.
[7] H. Kawamoto, "Japan’s Policies to be adopted on Rare Metal Resources," Science and Technology Trends, no. quarterly review No.27, pp. 57-76, 2008.
[8] I. Kapilevich and A. Skumanich, "Indium shortage implications for the PV and LCD market: Technology and market considerations for maintaining growth," in Photovoltaic Specialists Conference (PVSC), 34th IEEE, Philadelphia, 2009.
[9] A. J. Downs, Ed., Chemistry of aluminium, gallium, indium and thallium, London: Blackie Academic & Professional, 1993.
[10] C. J. Lee S.J., "Estimating Regional Material Flows for LCDs," in Proceedings of the IEEE International Symposium on Electronics and the Environment ISEE, San Francisco, 2008.
[11] H. W. Schadt M., "Voltagedependent Optical Activity of a twisted Nematic Liquid Crystal," Applied Physics Letters, vol. 18, pp. 127-128, 1971.
[12] T. Kunihiko, S. Atsushi, G. Dodbiba, J. Sadaki, N. Sato and T. Fujita, "Recovering Indium from the Liquid Crystal Display of Discarded Cellular Phones by Means of Chloride-Induced Vaporization at Relatively Low Temperature," Metallurgical and Materials Transactions A: Physical Metallurgy and Materials Science, vol. 40, no. 4, pp. 891-900, 2009.
[13] L. J., G. S., D. H. and L. L., "Recovery of valuable materials from waste liquid crystal display panel," Waste Management, vol. 29, no. 7, pp. 2033-2039, 2009.
[14] S. Virolainen, D. Ibana and E. Paatero, "Recovery of Indium from Indium-Tin-Oxide by Solvent Extraction," Hydrometallurgy, vol. 107, no. 1-2, pp. 56-61, 2011.
[15] H. M. B. Petrucci, General Chemistry- Principles and Modern Applications – Principles of extractive Metallurgy, 9th edition ed., Upper Saddle River, N.J: Pearson, Prentice Hall, 2007.
[16] C. J. Geankoplis, Transport processes and separation process principles: includes unit operations, 4th edition ed., Upper Saddle River, N.J: Prentice Hall PTR, 2003.
[17] R. N. M., I. H. M. N. H. and L. M. A., "Nomenclature for Liquid-Liquid Distribution (Solvent Extraction)," vol. 65, no. 11, 1993.
[18] Y. Marcus, "Principles of Solubility and Solutions," in Solvent Extraction Principles and Practise, 2nd edition ed., New York, USA, Marcel Dekker, 2004, p. 28.
[19] W. G., Knovel Solvents - A Properties Database, ChemTec Publishing, 2008.
[20] M. Cox, "Solvent Extraction in Hydrometallurgy," in Solvent Extraction Principles and Practise, 2nd edition ed., New York, USA, Marcel Dekker, 2004, pp. 455-458.
[21] H. H. Anderson and L. B. Asprey, "Solvent Extraction Process for Plutonium". USA Patent 2924506,

48
9 2 1960.
[22] Cytec, "Cyanex 923 extractant," Cytec Industries Inc., 2008. [Online]. Available: https://www.cytec.com/specialty-chemicals/PDFs/TransformationalSynthetic/CYANEX%20923.pdf. [Accessed 14 2 2011].
[23] B. Gupta, A. Deep and P. Malik, "Liquid-liquid extraction and recovery of indium using Cyanex 923," Analytica Chimica Acta, vol. 513, no. 2, pp. 463-471, 2004.
[24] B. Gupta, N. Mudhar and I. Singh, "Separations and recovery of indium and gallium using bis(2,4,4-trimethylpentyl)phosphinic acid (Cyanex 272)," Separation and Purification Technology , vol. 57, p. 294–303, 2007.
[25] C. Musikas and W. W. Schulz, "Solvent Extraction in Nuclear Science and Technology," in Solvent Extraction Principles and Practise, 2. edition, Ed., New York, USA, Marcel Dekker, 2004, p. 509.
[26] T. Sato and K. Sato, "Liquid-liquid extraction of indium (III) from aqueous acid solutions by acid organophosphorus compounds," Hydrometallurgy, vol. 30, no. 1-3, pp. 367-383, 1992.
[27] European Standard EN 1484:1997, Water analysis – Guidelines for the determination of total organic carbon (TOC) and dissolved organic carbon (DOC), 1997.
[28] K. Anil and K. Asit, "Solvent extraction and separation of gallium(III), indium(III), and thallium(III) with tributylphosphate," Talanta, vol. 14, no. 6, pp. 629-635, 1967.
[29] E. Aneheim, C. Ekberg, A. Fermvik, M. Foreman, E. Löfström-Engdahl, T. Retegan and I. Spendlikova, "Thermodynamics of Dissolution for Bis(triazine)-Bipyridine-Class Ligands in Different Diluents and Its Reflection on Extraction," J. Chem. Eng. Data, vol. 55, p. 5133–5137, 2010.
[30] J. Bonsack, "Extraction of Trace Niobium from Titanium Sulfate Solutions," Ind. Eng. Chem. Prod. Res. Dev., vol. 10, no. 4, p. 396–401, 1971.
[31] J. Liang, D. Yang and X. Liu, "Determination of 99Tc activity with efficiency tracing-liquid scintillation counting method," Atomic Energy Science and Technology , vol. 31, no. 5, pp. 446-451, 1997.
[32] T. Retegan, C. Ekberg, I. Dubois, A. Fermvik, T. J. Wass and G. Skarnemark, "Extraction of Actinides with different 6,6'-bis(5,6-dialkyl-[1,2,4]-triazin-3-yl)-bipyridines (BTBPs)," Solvent Extraction and Ion Exchange, vol. 25 , no. 4, pp. 631-636, 2007.
[33] X. Hou and B. T. Jones, "Inductively Coupled Plasma/Optical Emission Spectrometry," in Encyclopedia of Analytical Chemistry, Chichester, John Wiley & Sons Ltd, 2000.
[34] P. J. Goodhew, F. J. Humphreys and R. Beanland, Electron Microscopy and Analysis, 3rd edition ed., London, UK: Taylor & Francis, 2000.
[35] J. Rydberg, "Solvent Extraction Studies by the AKUFVE Method," Acta Chemica Scandinavica , vol. 23, pp. 647-659, 1969.
[36] Y. Albinsson, L. Ohlsson, H. Persson and J. Rydberg, "LISOL, a technique for LIquid Scintillation On-Line measurements," International Journal of Radiation Applications and Instrumentation. Part A. Applied Radiation and Isotopes, vol. 39, no. 2, pp. 113-120, 1988.
[37] C. Ekberg, H. Persson, A. Odegaard-Jensen, Y. Albinsson and S. Andersson, "Redox Control in Solvent Extraction Studies Using a PEEK AKUFVE Unit," Solvent Extraction and Ion Exchange, vol. 24, pp. 1-7, 2006.

49
10 List of Abbreviations θ Phase volume ratio AKUFVE Apparatus for Continuous Measurement of Partition Factor in Solvent Extraction
(“Anordning för Kontinuerlig Undersökning av Fördelningsjämvikter vid Vätske-vätske Extraktion”)
Cyanex 272 Bis(2,4,4-trimethylpentyl) phosphinic acid Cyanex 923 A mixture of four different trihexyl/octyl phosphine oxides DEHPA Bis(2-ethylhexyl) phosphoric acid DM Distribution Ratio (D-value) of metal M FPD Flat Panel Displays ICP-OES Inductively-Coupled Plasma with Optical Emission Spectrometer ITO Indium Tin Oxide LCD Liquid Crystal Display S/L Solid-Liquid ratio SEM-EDX Scanning Electron Microscope and Energy Dispersive X-ray SFA/B Separation Factor of metal A and B defined to be >=1 TBP Tributyl Phosphate TOC Total Organic Carbon

50
51
11 Appendices
Appendix A ICP-OES This was the method used for all the metal concentration measurements. The instrument is a Thermo iCAP-6000 Inductively Coupled Plasma Optimal Emission Spectrometer. This technique is used to measure liquid or gas sample, which is introduced into the instrument along with a carrying gas (argon) as an aerosol mist. The sample is then ionized and excited by heating with the plasma to a temperature of 6000-7000K. The wavelength of the photon release upon de-excitation is used to identify the type of elements present in the sample. Most elements with exceptions such as hydrogen, fluorine and inert gas can be detected by this method, at a concentration level of 1mg/L. For more information on ICP-OES, see [33] TOC The instrument used for measurement of organic carbon content was a Shimadzu Total Organic Carbon Analyzer TOC5000A. It measures the amount of organic carbon through combustion oxidation at approximately 680 oC. High-purity air or oxygen is used as carrier gas and sparging gas for purging of inorganic carbon. Before measurements the pH of the samples must be adjusted to approximately 2, this can be done by e.g. diluting with 0.01M HCl. According to European Standard EN 1484:1997 [27], an aqueous solution of potassium biphthalate (C8H5KO4) is used as measurement standard. SEM-EDX In Scanning Electron Microscopy, focused beams of high energy electrons are utilized to scan across the surface of a sample. When the incident electrons are decelerated by the sample, different types of emissions are generated, such as secondary electrons, backscattered electrons, and X-rays. Secondary electrons are used to produce images of the external morphology on a sample. With Energy Dispersive X-ray (EDX) technique, the X-ray emitted can be used to identify the elements present on the surface of the sample. The images shown in this work were taken by a FEI Quanta 200 ESEM FEG. It is equipped with a Everhardt Thornley Secondary Electron Detector and a Solid State Detector for backscattered electrons. The images were taken between operating voltages of 12 and 20 kV and pressure of 1 Torr. More information on SEM-EDX can be found in e.g. [34]

52
Appendix B AKUFVE The acronym AKUFVE means Apparatus for Continuous Measurement of Partition Factor in Solvent Extraction (“Anordning för Kontinuerlig Undersökning av Fördelningsjämvikter vid Vätske-vätske Extraktion”). A simple sketch of its construction is shown in Figure 27.
Figure 27: basic construction of a lab-scale AKUFVE unit: (1) flow meter (2) sampling and mixing pumps (3) heat exchanger (4) pH electrode (5) thermo-element (6) mixing chamber (7) centrifuge This apparatus was developed in the 1960s [35], and later improved by adding the pumps (2) [36]as well as including a redox control [37]. The mixture is introduced into the centrifuge through the middle tube, where the two phases are quickly separated at rotational speed of 5000-50000 rpm. The main advantage of the technique is that the pure phases (less than 0.01% entrainment from the other phase) can be achieved by the centrifuge. This allows determination

53
of distribution ratios of over 103 or under 10-3. With AKUFVE, it is also possible to determine a large number of data points (50-100) over one day of experiments. However, as a centrifugal separator, the construction of AKUFVE is mechanically complicated, meaning that it has a large need for maintenance and is sensitive to solid contaminants.