RECOVERY ACT: MULTIMODAL IMAGING FOR SOLAR CELL …
33
DE-EE0000582 RECOVERY ACT: MULTIMODAL IMAGING FOR SOLAR CELL MICROCRACK DETECTION Alenas Imaging, Inc. Page 1 of 33 Final Report - For Public Release Project Title: RECOVERY ACT: MULTIMODAL IMAGING FOR SOLAR CELL MICROCRACK DETECTION Covering Period: July 1, 2010 to Sept 30, 2010 Date of Report: Jan. 20, 2011 Recipient: Alenas Imaging Inc. Award Number: DE-EE0000582 Working Partners: Mt. Holyoke College Cost-Sharing Partners: Mt. Holyoke College Contacts: Dr. Janice Hudgings (PI) Phone: 413 538 2206 Email: [email protected] Dr. Lawrence Domash (Business Contact) Phone: 413 369 4497 Email: [email protected] DOE Project Officer: DOE Field Project Officer Leslie Payne Project Objective: The objective of this effort is to demonstrate new techniques for location and identification of microcracks in polysilicon solar cells using advanced imaging methods adapted from the optoelectronics device industry and never before applied to solar cells. The result will be a dramatic increase in the speed, precision and spatial resolution for microcrack detection. Background: Undetected microcracks in solar cells are a principal cause of failure in service due to subsequent weather exposure, mechanical flexing or diurnal temperature cycles. Existing methods have not been able to detect cracks early enough in the production cycle to prevent inadvertent shipment to customers. This program, sponsored under the DOE Photovoltaic Supply Chain and Cross-Cutting Technologies program, will study the feasibility of quantifying surface micro-discontinuities by use of a novel technique, thermoreflectance imaging, to detect surface temperature gradients with very high spatial resolution, in combination with a suite of conventional imaging methods such as electroluminescence. The project will carry out laboratory tests together with computational image analyses using sample solar cells with known defects supplied by industry sources or DOE National Labs. Quantitative comparisons between the effectiveness of the new technique and conventional methods will be reported in terms of the smallest detectable crack. Also the robustness of the new technique for reliable microcrack detection will be determined at various stages of processing such as before and after antireflectance treatments. The project will permit an overall assessment of the new technique compared with existing methods such as lock-in thermography or ultrasonics.
Transcript of RECOVERY ACT: MULTIMODAL IMAGING FOR SOLAR CELL …

DE-EE0000582 RECOVERY ACT: MULTIMODAL IMAGING FOR SOLAR CELL MICROCRACK DETECTION
Alenas Imaging, Inc.
Page 1 of 33
Final Report - For Public Release Project Title: RECOVERY ACT: MULTIMODAL IMAGING FOR SOLAR CELL MICROCRACK DETECTION Covering Period: July 1, 2010 to Sept 30, 2010 Date of Report: Jan. 20, 2011 Recipient: Alenas Imaging Inc. Award Number: DE-EE0000582 Working Partners: Mt. Holyoke College Cost-Sharing Partners: Mt. Holyoke College Contacts: Dr. Janice Hudgings (PI) Phone: 413 538 2206 Email: [email protected] Dr. Lawrence Domash (Business Contact) Phone: 413 369 4497 Email: [email protected] DOE Project Officer: DOE Field Project Officer Leslie Payne Project Objective: The objective of this effort is to demonstrate new techniques for location and identification of microcracks in polysilicon solar cells using advanced imaging methods adapted from the optoelectronics device industry and never before applied to solar cells. The result will be a dramatic increase in the speed, precision and spatial resolution for microcrack detection. Background: Undetected microcracks in solar cells are a principal cause of failure in service due to subsequent weather exposure, mechanical flexing or diurnal temperature cycles. Existing methods have not been able to detect cracks early enough in the production cycle to prevent inadvertent shipment to customers. This program, sponsored under the DOE Photovoltaic Supply Chain and Cross-Cutting Technologies program, will study the feasibility of quantifying surface micro-discontinuities by use of a novel technique, thermoreflectance imaging, to detect surface temperature gradients with very high spatial resolution, in combination with a suite of conventional imaging methods such as electroluminescence. The project will carry out laboratory tests together with computational image analyses using sample solar cells with known defects supplied by industry sources or DOE National Labs. Quantitative comparisons between the effectiveness of the new technique and conventional methods will be reported in terms of the smallest detectable crack. Also the robustness of the new technique for reliable microcrack detection will be determined at various stages of processing such as before and after antireflectance treatments. The project will permit an overall assessment of the new technique compared with existing methods such as lock-in thermography or ultrasonics.

DE-EE0000582 RECOVERY ACT: MULTIMODAL IMAGING FOR SOLAR CELL MICROCRACK DETECTION
Alenas Imaging, Inc.
Page 2 of 33
Status: Summary of project status by Tasks and Milestones is shown in the Table below. Tasks and Milestones Status Task 1: Demonstrate multimodal crack detection. 100%
Completed Milestone 1: Combination of thermoreflectance and electroluminescence shown to positively identify microcracks whereas neither by itself was definitive.
Complete.
Task 2. The resolution, sensitivity and precision of microcrack detection by thermoreflectance will be quantified. Different methods of periodic heating of cells tested for effectiveness in thermoreflectance imaging.
100% Completed
Milestone 2a: Quantify sensitivity for microcrack detection according to measurements which allow direct comparison with literature reports for IR thermographic approach.
Complete.
Milestone 2b: Identify one best method of induced heating in solar cells for the purposes of crack detection. (Laser beam spot heating.)
Complete.
Task 3: 2D Efficiency mapping for crack detection. An alternative to LBIC (Light Beam Induced Current) efficiency mapping will be developed using a non-raster scanned approach.
100% Completed
Milestone 3: Quantify Alenas approach in comparision to LBIC with regard to measured sensitivity and spatial resolution for solar cell efficiency mapping.
Complete.
Task 4: Algorithms to minimize false positives. Cross-correlation between modalities will be used to reduce the false-positive rate for crack detection compared to conventional methods.
100% Completed
Milestone 4: Quantify the false positive rate for confusing mechanical cracks with carrier lifetime gradients..
Complete.
Task 5: 5a. Analyze methods of crack detection prior to applying electrical contacts. 5b. Quantify additional data obtained in this program.
100% Completed
Milestone 5: Identify at least one effective method of stimulating cells for microcrack imaging of cells before electrical contacts have been applied. Prepare additional data for publication.
Complete.
Patents: None this program. Publications/Presentations/Travel: Presentation at SPIE Conference on "Reliability of Photovoltaic Cells, Modules, Components, and Systems III," title, "Thermoreflectance and multimodal imaging for defect location in silicon solar cells," on 05 Aug 2010. To be published in Proc SPIE Vol. 7773, "Reliability of Photovoltaic Cells, Modules, Components, and Systems III. Further publications submitted.

DE-EE0000582 RECOVERY ACT: MULTIMODAL IMAGING FOR SOLAR CELL MICROCRACK DETECTION
Alenas Imaging, Inc.
Page 3 of 33
Resources Participants in the laboratory and analytical work included Dr. Janice Hudgings (PI), Dr. Lawrence Domash (Senior Scientist), Dr. Kadhair Al-Hemyari (Senior Scientist), Joyce Zhou (Intern and PhD candidate at UC Santa Cruz – Ms Zhou is spending a year at Alenas under a university/industry internship program and visa). All the research was carried out in the labs of MHC. Experts at NREL (Dr. Steve Johnston) assisted us with advice and technical data. Introduction Microcracks are problematic for polycrystalline silicon solar cells because they cause mechanical weak points that can lead to cell breakage during manufacturing processing and packaging, reducing yield; they create inhomogenities that decrease PV operating efficiency; and they reduce installed service life by causing cells to fail or be degraded by environmental temperature cycling or wind related flexure. The objective of this program is to demonstrate a new multimodal crack detection tool, suitable for whole cell NDE of solar cells at varying points in the manufacturing process, capable of detecting small cracks, with a false positive rate of less than 5%, thereby achieving a measurable benefit in LCOE. Solar cell manufacturers typically use manual visual inspection to find cracked cells before they are laminated into module8; this technique is labor intensive and insensitive, particularly on textured cells. Beside visual inspection (reflectance or transmission), electroluminescence (EL) or photoluminescence (PL) imaging, efficiency mapping via laser scanning (LBIC, etc), scanning acoustic microscopy (SAM), thermography, millimeter wave techniques, and resonant ultrasonic vibrations (RUV) have all been applied. Commercial versions of these include SAM (Sonix), RUV (Ultrasonic Technology), IR thermography (Siemens, Spire, Indigo Systems, Thermosensorik GmbH, etc), and mechanical flexing (Spire). To date no system has significantly penetrated the supply chain. Furthermore, many of the most successful crack detection techniques (optical, thermography, and ultrasonics) are sensitive to not only cracks but also other forms of defects, leading to a high rate of false positives, which raises the LCOE. In this program, Alenas Imaging addresses the issue of false positives in crack detection by combining multiple NDE imaging modalities in a single, visible-light-based hardware system and then cross-correlating data from these independent physical measurements to differentiate cracks from other defects. Our primary new method of crack detection is stochastic resonance enhanced thermoreflectance imaging, a new form of thermography which is better suited to solar cell inspection than existing infrared cameras for two primary reasons. First, thermoreflectance offers an order of magnitude improvement in spatial resolution, which is essential for detection of microcracks, relative to IR thermography. Second, because thermoreflectance uses visible, rather than infrared, light, thermoreflectance can be easily combined with alternative imaging modalities in a single hardware setup; this feature is unavailable using long wavelength IR cameras and is central to our enhanced crack detection system. Our system combines this novel enhanced thermography technique with a spatially resolved form of efficiency mapping for crack detection, as well as forward and reverse electroluminescence imaging and visible imaging, all of which are performed using the same basic hardware setup. The results of these independent

DE-EE0000582 RECOVERY ACT: MULTIMODAL IMAGING FOR SOLAR CELL MICROCRACK DETECTION
Alenas Imaging, Inc.
Page 4 of 33
imaging modalities are combined using computational image processing to achieve very high sensitivity detection of microcracks while eliminating false positives, achieved in one easy to use and low cost tool. Task 1: Multimodal imaging We have developed multiple independent imaging modes for crack detection in multicrystalline-silicon solar cells, including thermoreflectance (TR) with varying forms of thermal modulation, forward and reverse biased electroluminescence (EL), mechanical-acoustic reflectance, and efficiency mapping. Thermoreflectance and efficiency mapping are discussed in detail in Tasks 2 and 3, respectively. We concentrate the discussion here on the remaining imaging modalities. 1a: Multimodal imaging tool We built two laboratory prototype solar cell crack detection systems, one for widefield, whole cell imagine and the second for optically magnified testing of specific defects. Each system uses a single apparatus to perform five physical measurements: stochastic resonance enhanced thermoreflectance (SRETR) imaging; high speed efficiency mapping; forward and reverse biased electroluminescence imaging (EL); and visible imaging. Figure 1 below shows schematics of the two cell testers, both of which use an inexpensive Si-CCD camera for imaging. A filter wheel in front of the CCD camera enables the user to switch rapidly among the measurement modes. A high pass (>1000nm) optical filter enables forward biased EL imaging (a standard Si-CCD camera overlaps the band-to-band EL). A bandpass filter at the probe wavelength (470nm) enables thermal imaging using SRETR. In the widefield setup, diffuse angle illumination replaces our standard in-line illumination technique in order to minimize problems due to specular reflection and surface texturing.
Fig 1. Multimodal microcrack detection apparatus: a) whole cell imaging; b) microscopic imaging Three different types of silicon solar cells are used in this work: both textured and untextured cells from Evergreen Solar and textured cells from the National Renewable Energy Laboratory (NREL). The multicrystalline, ribbon-pulled, antireflection coated, silicon solar cells from Evergreen have crystal grain sizes on the order of several cm. The NREL cells are antireflection coated, textured, block-cut, polycrystalline silicon solar cells with typical crystal grain sizes from several mm to 1cm. The solar cells under test are electrically contacted in the conventional manner by soldering tabbing wire to the front and back contacts.

DE-EE0000582 RECOVERY ACT: MULTIMODAL IMAGING FOR SOLAR CELL MICROCRACK DETECTION
Alenas Imaging, Inc.
Page 5 of 33
1b: Electroluminescence Imaging Forward biased electroluminescence (EL) imaging is a relatively well established means of detecting regions of high recombination density, which show as dark features in the EL image. Figure 2 shows both a standard visual image of a test cell and a forward bias EL image of the same cell. While the EL image clearly shows a large diagonal crack in the test cell that is not visible in the standard visual image, there are a large number of other features present in the EL image as well: grain boundaries, surface texturing, the backside contact pad, etc. The prevalence of false positive features is the primary disadvantage of EL for crack detection.
Fig. 2 a) Standard brightfield visual image of a test cell; b) forward biased EL image of same cell While forward biased EL is a commonly used NDE technique for solar cells, negatively biased EL imaging is less well developed. In Figure 3 below, we show electroluminescence images of the same solar cell under varying bias conditions. Several grain boundaries are clearly seen in the visible image (Figure 3a). The forward biased EL image shows the same features, plus additional signatures that are strongly suggestive of cracks that cannot be seen in the visible image. Under strong reverse bias, the EL images (Figures 3d-f) show light emission from the cracks and other defects; these “starry night” images have interesting potential both for locating defects in cells and for identifying the type of defect, based on the biases at which light is emitted. Comparing the images resulting from the three imaging modes shown in Figure 3 (visible (Fig 3a), forward biased EL (Fig 3b) and reverse biased EL (Fig 3d)) is clearly useful both in identifying invisible cracks and in distinguishing between, for example, cracks and grain boundaries. We will address the utility of multimodal imaging for reducing false positives in detail in Task 4 below.
0
20
40
60
80
100
120
140
160
180
200
100 200 300 400 500 600
50
100
150
200
250
300
350
400
450
a) 0
20
40
60
80
100
120
140
160
180
200
100 200 300 400 500 600
50
100
150
200
250
300
350
400
450
b)

DE-EE0000582 RECOVERY ACT: MULTIMODAL IMAGING FOR SOLAR CELL MICROCRACK DETECTION
Alenas Imaging, Inc.
Page 6 of 33
0
20
40
60
80
100
120
140
160
180
200
100 200 300 400 500 600
50
100
150
200
250
300
350
400
450
c) 0
20
40
60
80
100
120
140
160
180
200
100 200 300 400 500 600
50
100
150
200
250
300
350
400
450
d)
0
20
40
60
80
100
120
140
160
180
200
100 200 300 400 500 600
50
100
150
200
250
300
350
400
450
e) 0
20
40
60
80
100
120
140
160
180
200
100 200 300 400 500 600
50
100
150
200
250
300
350
400
450
f) Fig 3. a) Ordinary white light image; b) 1V forward biased EL image; c)-f) reverse biased EL images with biases of c)-4V; d)-12V; e)-15V; f) -20V The emissive points in the reverse bias EL measurements of a test cell can be used to determine the underlying physical origin of these signatures as well. Figure 4(a) is a reverse biased (-12V) EL image (also called a “starry night” image) superimposed on a normal visual image. Figure 4(b) shows a thermal map obtained with Alenas’ enhanced thermoreflectance mapping technique, under the same -12V bias condition as in Figure 4(a). Each of the hot spots in Figure 4(b) corresponds to a point of EL emission in Figure 4(a). Figure 4(c) shows the relationship between the EL emission intensity and the reverse bias voltage. Two different breakdown mechanisms at the observed shunts can be identified based on the relative slopes of the curves in 4(c). The shunts labeled 1 and 2 emit EL due to internal field emission, while shunt 3 is a site of avalanche breakdown. The internal field emission shunts lead to localized heating, while the avalanche breakdown site does not.

DE-EE0000582 RECOVERY ACT: MULTIMODAL IMAGING FOR SOLAR CELL MICROCRACK DETECTION
Alenas Imaging, Inc.
Page 7 of 33
a)
b)
c)
Fig 4. a) EL image at -12V, b) Thermoreflectance amplitude image modulated by square wave -12V/0V at 6Hz. c) EL intensity versus voltage of spots 1, 2 and 3 as indicated in image a). 1c: Acoustic / mechanical stimulation The Alenas thermoreflectance camera is designed to pick up small changes in surface temperature by virtue of the small temperature coefficient of surface optical reflectance at a given wavelength – in our case 467 nm light supplied by an LED. In previous work, we noticed that our camera sometimes seemed to respond to small variations in reflectance which were not due to temperature but rather microscopic mechanical deformations of the cell surface. We call this “mechano-reflectance.” To follow up on this observation as a possible additional imaging mode for microcrack detection, we stimulated a mechanical vibration by periodically ‘pinging’ the cell with a sound wave, and then watching for discontinuities in reflectance which would indicate small cracks. We hypothesized this might offer an additional modality along with thermal mechanisms. In the experiment, a loudspeaker (8Ω, 200mW, 2” diameter) was bonded to the backside of the test cell by removable glue. The speaker was driven by a 5Hz square wave from an audio signal generator, which resulted in a 10Hz sequence of mechanical pulses delivered to the cell surface. The surface wave was confirmed by a Phono Cartridge (Audio Technica AT92ECD Phono Cartridge). The response in terms of reflectance map of the cell surface was then synched with the camera trigger signal which was set to 40 Hz (forty digital images per second). Figure 5a shows the cell with loudspeaker attached. Fig 5b shows a regular white light image of the cell under a 40x magnification, showing the crack running vertically from x-axis pixel number 340. Fig 5c and Fig 5d show images of the computed amplitude and phase, respectively, of the reflectance signal, with the speaker driven at 200mW. The color scale in Fig 5d represents phase delay between the audio pulse and the captured reflectance signal. The crack is clearly visible in both the amplitude and phase images. Fig 5e plots the mean of the reflectance signal at the crack versus the power at which the speaker is driven. As expected, the signal at the crack becomes stronger when the speaker power increases. This set of experiments suggests that mechano-reflectance is a promising means of detecting surface cracks. However, because the crack signature is localized to the crack itself in these measurements (versus a more dispersed signal in the thermal or EL measurements, for example), the minimum crack width that can be detected is limited by the spatial resolution of the

DE-EE0000582 RECOVERY ACT: MULTIMODAL IMAGING FOR SOLAR CELL MICROCRACK DETECTION
Alenas Imaging, Inc.
Page 8 of 33
measurement. If the cell is examined under a microscope, the resolution is sub-micron, equal to the diffraction limit of the probe light. However, for widefield whole-cell imaging, which is desirable for NDE, the spatial resolution drops dramatically, limited by the number of camera pixels, and detection of microcracks becomes difficult. For this reason, we conclude that mechano-reflectance imaging, while a successful means of crack detection, has limited practical utility for NDE of whole cells.
a)
b)
c) d)
e)

DE-EE0000582 RECOVERY ACT: MULTIMODAL IMAGING FOR SOLAR CELL MICROCRACK DETECTION
Alenas Imaging, Inc.
Page 9 of 33
Figure 5. Test of acoustic-mechanical reflectance imaging: a) loudspeaker coupled to back side of test cell; b) white light image with visible crack running vertically from x=340, c) computed amplitude image of the reflectance signal, d) computed phase image of the reflectance signal. e) average of reflectance signal amplitude versus the power at which the speaker is driven. 1d: Summary: multimodal images of a test cell Sample results on an Evergreen solar test cell, using the different imaging methods, are shown in Figure 6a to 6l. In each image, the position of the known crack is indicated by arrows. Figure 6a is the visual image of the sample; the microcrack that we are interested in is invisible in this image. Figures 6b and 6c are the forward-biased EL image and a 2D efficiency map (see Task 3 below for details); the images obtained by these two methods usually are very similar. In both the forward biased EL image and the 2D efficiency map, the crack is visible as a black line; however, there are a large number of false positives in that not all of the black lines are cracks. Figure 6d is a reverse biased EL image; pinpoints of light emission along the crack are visible, but other features are stronger. The remaining images in Figure 6 are thermoreflectance images; the varying forms of thermoreflectance imaging are discussed in detail in Task 2 below. The shunts apparent in the reverse bias EL image are localized current leakage paths, so they appear as hot spots in the reverse-biased thermoreflectance amplitude and phase images shown in Figure 6i and 6j, respectively. Due to heating at the shunts along the crack, the crack appears as a line of increased temperature in the amplitude image, and as a dark line (localized phase change) in the phase image. However, for some of the other sample solar cells from NREL, there are so many shunts in addition to those at the cracks that reverse-bias thermoreflectance imaging fails to differentiate the cracks. Figures 6e and 6f are thermoreflectance amplitude and phase images resulting from using a rear-mounted thermoelectric cooler to modulate the temperature of the unbiased cell. Figures 6k and 6l are the thermoreflectance images in which the temperature was instead modulated by laser heating from backside of the sample. The underlying physical principle is the same in both of these cases, but laser heating is promising because it can be modulated faster and more easily than can the thermoelectric heater. Those two sets of images show all of the features that can be seen in the visual image, as well as the crack. Figures 6g and 6h are the amplitude and phase images obtained from thermoreflectance imaging of the test cell using forward biased electrical heating by supplying a 0-3V square wave to the solar cell. The amplitude image shows a lower temperature at the location of the crack; however, this is true of a number of other features in the image as well. In this case, the crack is more easily distinguished in the phase image (Figure 6h), where it appears as a dark line, or sudden phase change.

DE-EE0000582 RECOVERY ACT: MULTIMODAL IMAGING FOR SOLAR CELL MICROCRACK DETECTION
Alenas Imaging, Inc.
Page 10 of 33

DE-EE0000582 RECOVERY ACT: MULTIMODAL IMAGING FOR SOLAR CELL MICROCRACK DETECTION
Alenas Imaging, Inc.
Page 11 of 33
Fig 6. Multiple independent images of the same Evergreen test cell, using our multimodal imaging techniques. The test cell contains a horizontal crack at the location of the arrows. a) Standard wide-field visual image; b) forward biased (1V DC) electroluminescence (EL) image; c) Efficiency mapping of the area indicated by the red dashed frame in b); d) reverse biased (-20V DC) EL image; e) and f) are thermoreflectance amplitude and phase images respectively using a rear mounted thermoelectric cooler to modulate the cell temperature (0.4Hz for 30,000 iterations); g) and h) are thermoreflectance amplitude and phase images respectively obtained by forward electrical bias modulation of the cell (0-3V square wave at 5Hz for 200,000 iterations); i) and j) are thermoreflectance amplitude and phase images respectively obtained by reverse electrical bias modulation of the cell (-19V-0V square wave at 10Hz for 200,000 iterations); k) and l) are thermoreflectance amplitude and phase images respectively obtained by optical heating of the cell from the back side using a 200mW laser beam (1Hz for 56,000 iterations). While none of the above imaging modes is a definitive means of crack detection on its own, primarily because the most sensitive techniques (EL and efficiency mapping) result in many false positives, taken in combination the multiple imaging modes can work together efficiently. The use of multimodal imaging to reduce the false positive rate is quantified in Task 4 below. Task 2: Optimization of thermoreflectance for poly-Si solar cells Having verified the usefulness of thermoreflectance (TR) imaging for positive identification of microcracks when used in coincidence with other modalities in Task 1, the purpose of Task 2 is to optimize the methodology for use of TR with poly-Si solar cells. The items of optimization are: illumination wavelength, illumination delivery, periodic heating method, camera type (including pixel count and sensitivity, cooled / uncooled, etc.) and signal processing architecture. Upgrading the latter two items (camera and signal processing) are beyond the scope of the current program, but the first elements have been optimized through several variations. We first discuss in Section 2a below the experimental technique for thermoreflectance imaging, then discuss methods of optimizing the probe illumination in Section 2b, and finally present crack detection results for varying heating methods in Section 2c. 2a: Thermoreflectance technique Non-contact thermoreflectance imaging measures the change in reflectivity (DR) of a material in response to a temperature modulation (DT):
1 R dR T TR R dT
κΔ
= Δ = Δ, (1)
where the calibration constant k depends on the choice of material and probe wavelength. The widefield thermoreflectance imaging setup used in this work is shown in Figure 7a. The cell is uniformly illuminated using a diffuse dome light (Metaphase Technologies MB-DL406-B), in which 455nm LEDs are mounted at the rim of the dome, and the illuminating light is

DE-EE0000582 RECOVERY ACT: MULTIMODAL IMAGING FOR SOLAR CELL MICROCRACK DETECTION
Alenas Imaging, Inc.
Page 12 of 33
a)
backscattered from the diffusive coating on the internal surface of the dome before illuminating the solar cell under test. The light backreflected from the solar cell is imaged by a CCD camera placed behind an aperture at the top of the dome light. Higher magnification thermal imaging of shunts, such as shown in Figure 6c and 6d is performed using a similar thermoreflectance microscopy setup, with the exception that the cell is imaged via a standard light microscope and is illuminated at nearly normal incidence using a 467nm LED, as shown in Figure 6b; see References for details of the thermoreflectance microscopy apparatus.1 Both the widefield and microscopic thermoreflectance techniques utilize a four-bucket, digital, pixel-by-pixel lock-in technique and stochastic resonance enhancement to obtain a maximum temperature resolution of 10mK.2
In both the widefield and microscopy setups, the thermal signal must be carefully distinguished from the electroluminescence (EL) emitted by the solar cell. A narrow bandpass optical filter centered at the probe wavelength is placed in front of the camera lens to block the forward-biased EL emission (> 1150 nm)3 or reverse bias optical emission (peaked at around 700-720nm).4 Throughout this work, successful elimination of EL is confirmed by repeating the measurements with the probe light off, which should result in no signal at the camera.
1M. Farzaneh, K. Maize, D. Luerssen, J. A. Summers, P. M. Mayer, P. E. Raad, K. P. Pipe, A. Shakouri, R. J. Ram, J. A. Hudgings, J. of Phys. D-Appl. Phys. 42, 143001 (2009) 2 P. M. Mayer, D. Luerben, R.J. Ram, J. A. Hudgings, J. Opt. Soc. Am. A, 24, p1156. (2007) 3K. Bothe, K. Ramspeck, D. Hinken and R. Brendel, ECS Transactions, 16 (6) 63-78 (2008) 4 W. Kwapil, M. Kasemann, P. Gundel, M. C. Schubert, W. Warta, P. Bronsveld, G. Coletti, J. Appl. Phys. 106, 063530 (2009)
2
4
6
8
10
12
14
x 10-4
300 350 400 450 500 550
100
150
200
250
300
350
c)

DE-EE0000582 RECOVERY ACT: MULTIMODAL IMAGING FOR SOLAR CELL MICROCRACK DETECTION
Alenas Imaging, Inc.
Page 13 of 33
Fig 7. a) Experimental setup for a) widefield and b) microscopic thermoreflectance imaging of the solar cell c) and d) are amplitude and phase image of a shunt in an Evergreen cell, taken with 5x optical magnification with -13V/0V 10 HZ square wave modulation, averaged over 100K iterations. 2b: Optimizing probe illumination Solar cells present obvious challenges to any use of optical reflectance measurements because they are anti-reflection coated in order to absorb the solar spectrum 400-1200 nm. We addressed this challenge by taking all our measurements at 467 nm (using LED illumination) because the anti-reflection treatment loses its effectiveness at the blue end of the spectrum. In addition, the illumination used to capture a good thermoreflectance image must be uniform, diffuse and Lambertian. Figure 8 shows the integrating half-sphere we use to obtain these conditions; twelve blue LEDs are bonded in a circular pattern around the camera lens fixture as a ring-light and mounted in a commercial half-sphere, diffuse illuminator. The cell under test is not visible in this photo; the cell is mounted horizontally on a heat-sink together with any apparatus for periodically heating it.
-150
-100
-50
0
50
100
150
300 350 400 450 500 550
100
150
200
250
300
350
b)
d)

DE-EE0000582 RECOVERY ACT: MULTIMODAL IMAGING FOR SOLAR CELL MICROCRACK DETECTION
Alenas Imaging, Inc.
Page 14 of 33
Figure 8. Illumination setup: A diffuse dome light from Metaphase Technologies Inc. is placed over the solar cell under test. Blue LEDs are mounted in a ring around the base of the dome; the coated dome interior acts as a diffuse reflector of the blue LED light, which is directed downwards to the test cell below. Light backreflected off the test cell is imaged by a camera mounted at the top of the dome. The widefield and microscopic thermoreflectance techniques are independently calibrated for each of the test cells using the standard method of modulating the temperature of the back side of the sample and measuring the resulting surface temperature modulation DT with a microthermocouple.5 Results are summarized in Table 1. Textured? magnification Illumination
wavelength Illumination source
Thermoreflectance coefficient k (K-1)
Yes None: whole cell imaging
450 nm Diffuse dome illumination
(1.15 ± 0.02)*10-4
No 5x magnification 467 nm LED at normal incidence
(5.20 ± 0.05)*10-4
No None: whole cell imaging
450 nm Diffuse dome illumination
(1.34 ± 0.03)*10-4
Table 1: Thermoreflectance calibration values for various cell types and illumination methods. All of the cells tabulated here are SiN-coated, ribbon-pulled, mc-Si solar cells from Evergreen Solar. 2c. Heating method
5 M. Farzaneh, K. Maize, D. Luerssen, J. A. Summers, P. M. Mayer, P. E. Raad, K. P. Pipe, A. Shakouri, R. J. Ram, J. A. Hudgings, J. of Phys. D-Appl. Phys. 42, 143001 (2009)

DE-EE0000582 RECOVERY ACT: MULTIMODAL IMAGING FOR SOLAR CELL MICROCRACK DETECTION
Alenas Imaging, Inc.
Page 15 of 33
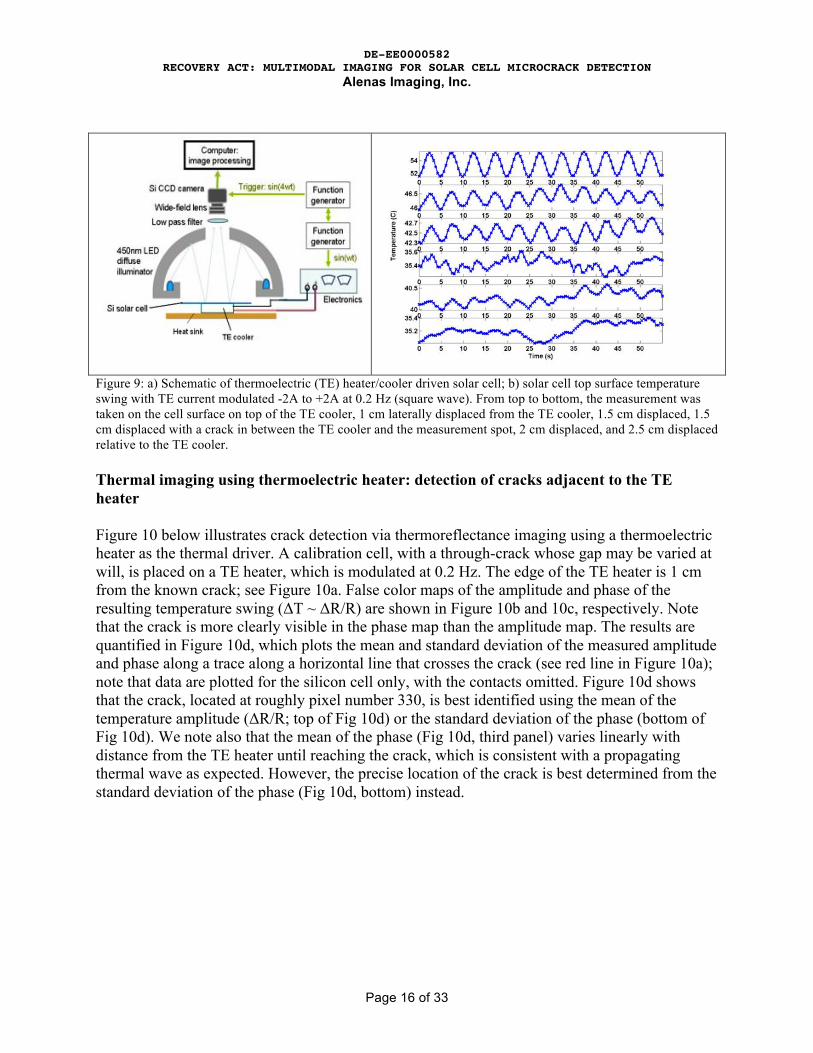
The method by which the test cell is heated is critically important. To recap, thermoreflectance imaging relies on delivering a periodic pulse of heat to the solar cell under test. As this heat flows in the device, the surface temperature will vary in certain areas depending on device architecture or local defects. These variations are very small, about one part in 105, so a large number of image captures must be averaged (lock-in imaging). Thus the heat pulse is applied periodically (typically no faster than 10 Hz to allow time for heat diffusion) and the camera, synched to this timing pulse, records a series of digital image captures. Typically, the camera is triggered at 4x the heating pulse frequency (40 frames / second), enabling us to perform a signal processing based form of pixel-by-pixel lockin averaging, resulting in both a phase image, which shows the time behavior, and the amplitude of the temperature map. An ideal heating method will be high speed, controllable, and cause a significant temperature change with respect to the local feature of interest. Thus an ideal heating method for bringing out electrical shunts might not be the same as one for localizing microcracks. The usual method used in our lab for periodic heating is to modulate the electrical bias applied to the device. This technique is ideal for detection of hot spots formed by electrical shunts (regions of low electrical resistivity). However, under reverse bias, the current through a solar cell is very small and so the temperature change at physical discontinuities is also small, so that crack detection is challenging using this technique. Hence, while we have examined electrical bias modulation for crack detection in detail, we have also explored a number of other promising methods of thermal modulation for crack detection, including optical and thermoelectric heating by various means. The experimental setup and results using each technique are discussed below. 2.c.1 Thermoelectric heater/cooler The use of a thermoelectric (TE) heater to modulate the temperature of a test cell is explored here as a proof of principle of our basic thesis that cracks too small to be visible directly can be detected thermally. However, the thermoelectric technique for thermal modulation is largely unsuitable outside of a research environment because it is quite slow; it is difficult to modulate these devices effectively above 100mHz. We successfully establish proof of principle with this technique and then develop higher speed optical and electrical heating techniques in sections 2.c.2 and 2.c.3 below. Figure 9 shows a schematic of the thermoelectric (TE) heater method and the resulting temperature swing at f=0.2 Hz. A K-type, mm-scale thermocouple probe and a TC-1000 thermocouple meter from Sable Systems were used to track the temperature on the cell surface. The temperatures measured on the cell surface as a function of time are shown in Fig. 9b. Note that this method produces temperature swings of about 2-3 K, which is quite a bit larger than is produced by the bias current method. Thermal waves propagate outward from the TE device, diminishing in size with distance, and are blocked dramatically at a crack. The thermal diffusivity of the polysilicon is D=0.165 cm2s-1, which results in the thermal diffusion length L=2√D/f=1.8 cm; for this reason, the thermal wave decays noticeably by the time it has propagated ~2 cm from the thermoelectric heat source, as seen in the bottom three traces in Fig. 9b. With this limitation in mind, we have experimented two variations on this technique: identifying cracks that are positioned directly above the thermal wave source (TE device) and identifying cracks that are 1-2 cm distant from the TE device, such that the thermal wave propagates across the crack.
DE-EE0000582 RECOVERY ACT: MULTIMODAL IMAGING FOR SOLAR CELL MICROCRACK DETECTION
Alenas Imaging, Inc.
Page 16 of 33
Figure 9: a) Schematic of thermoelectric (TE) heater/cooler driven solar cell; b) solar cell top surface temperature swing with TE current modulated -2A to +2A at 0.2 Hz (square wave). From top to bottom, the measurement was taken on the cell surface on top of the TE cooler, 1 cm laterally displaced from the TE cooler, 1.5 cm displaced, 1.5 cm displaced with a crack in between the TE cooler and the measurement spot, 2 cm displaced, and 2.5 cm displaced relative to the TE cooler. Thermal imaging using thermoelectric heater: detection of cracks adjacent to the TE heater Figure 10 below illustrates crack detection via thermoreflectance imaging using a thermoelectric heater as the thermal driver. A calibration cell, with a through-crack whose gap may be varied at will, is placed on a TE heater, which is modulated at 0.2 Hz. The edge of the TE heater is 1 cm from the known crack; see Figure 10a. False color maps of the amplitude and phase of the resulting temperature swing (ΔT ~ ΔR/R) are shown in Figure 10b and 10c, respectively. Note that the crack is more clearly visible in the phase map than the amplitude map. The results are quantified in Figure 10d, which plots the mean and standard deviation of the measured amplitude and phase along a trace along a horizontal line that crosses the crack (see red line in Figure 10a); note that data are plotted for the silicon cell only, with the contacts omitted. Figure 10d shows that the crack, located at roughly pixel number 330, is best identified using the mean of the temperature amplitude (ΔR/R; top of Fig 10d) or the standard deviation of the phase (bottom of Fig 10d). We note also that the mean of the phase (Fig 10d, third panel) varies linearly with distance from the TE heater until reaching the crack, which is consistent with a propagating thermal wave as expected. However, the precise location of the crack is best determined from the standard deviation of the phase (Fig 10d, bottom) instead.

DE-EE0000582 RECOVERY ACT: MULTIMODAL IMAGING FOR SOLAR CELL MICROCRACK DETECTION
Alenas Imaging, Inc.
Page 17 of 33
b)
c)
d)

DE-EE0000582 RECOVERY ACT: MULTIMODAL IMAGING FOR SOLAR CELL MICROCRACK DETECTION
Alenas Imaging, Inc.
Page 18 of 33
e)
Fig 10. a) Visual image of cracked cell; dashed white line shows location of underlying TE heater; dashed horizontal and vertical red lines show location of the cross section traces used for panels d and e respectively; b) amplitude of the thermal distribution across the cell; c) phase of the thermal distribution across the cell; d) amplitude (ΔR/R) and phase of the measured thermal distribution along the dashed red horizontal trace line shown in a); e) amplitude (ΔR/R) and phase of the measured thermal distribution along the dashed red vertical trace line shown in a). In both d) and e), the vertical line shows the location of the crack. Note that the crack investigated in d) is approximately 2cm away from the TE heat source, while the crack investigated in e) is directly on top of the TE heat source. Thermal imaging using thermoelectric heater: detection of cracks directly over the heat source In Figure 10a), the vertical red dashed line crosses a crack that is directly above the TE heater. The crack was invisible under visual imaging and was not created deliberately. In the Figure 10 images, the crack does not extend through the cell, but with repeated handling, the cell eventually chipped along the line of the crack; see Figure 11 below. In Figure 10b) and 10c), we can clearly see the crack, as shown by the yellow arrows on the left. Figure 10e) shows the amplitude and phase of the thermal distribution across the cell with crack position indicated by the vertical line. Again, the mean of the standard deviation of the phase appears to be the best indicator of the crack. Figure 11 below illustrates successful crack detection using the same technique, with a more subtle, shallow crack positioned directly on top of the TE heater. In Figure 11, the lower left of the sample cell shown in Figure 10a has been broken completely off the main cell. A small crack propagates horizontally from the fragment, indicated with a yellow arrow. This crack is relatively shallow and is invisible using standard imaging from a typical viewing distance, or by visual inspection. As in the case above, both the fragment and the subtle crack propagating horizontally from same become visible in the thermoreflectance amplitude image and even more so in the phase image.

DE-EE0000582 RECOVERY ACT: MULTIMODAL IMAGING FOR SOLAR CELL MICROCRACK DETECTION
Alenas Imaging, Inc.
Page 19 of 33
a) Ordinary white light image
b) Thermoreflectance amplitude image
c) Phase image
d) Line trace of amplitude and phase
Figure 11 a) simple white light image of cracked cell; the portion of the cell shown here is directly on top of the TE heater; dashed black line shows the position of the broken portion, which is rejoined to the main cell in this image; dashed red line shows location of the line trace shown in panel d; b) amplitude of the thermoreflectance map across the cell; c) phase of the thermoreflectance map across the cell; d) amplitude (ΔR/R) and phase of thermal distribution along a horizontal line trace. Note that the phase jumps sharply at the crack locus. The above data on crack detection via thermoreflectance imaging, using the TE heater as a pulsed heat driver, demonstrates our main thesis; cracks that are too subtle to be detected via standard machine vision techniques can now be identified. In particular, the standard deviation of the thermoreflectance phase gives an extremely sensitive measure for automated crack location. 2.c.2 Optical heating In this technique, the back side of the solar cell under test is heated by illuminating it with a 200mW 532 nm green laser, which is modulated by a TTL signal at frequency f, phase-locked to the camera trigger signal at 4f. The back side of the sample was coated with black paint in order to maximize the optical absorption.

DE-EE0000582 RECOVERY ACT: MULTIMODAL IMAGING FOR SOLAR CELL MICROCRACK DETECTION
Alenas Imaging, Inc.
Page 20 of 33
Figure 12 shows the thermoreflectance amplitude results for various modulation frequencies f. During the experiment, the average cell temperature will stabilize at few degrees higher than ambient temperature; the time to reach this quasi-steady state is the “thermal relaxation time.” The thermal relaxation time constant is given by:
t=mCpRh (1) where t is the thermal relaxation time constant, m is the sample mass, Cp sample heat capacity and Rh thermal resistance to the surrounding. For “quasi adiabatic” measurement conditions, the thermal relaxation time constant should be much larger than the modulation period. Under quasi adiabatic conditions, the temperature modulation amplitude depends solely on the introduced power distribution and on the thermal properties of the cell, but not on the thermal coupling to its surroundings. For a detailed discussion, see Chapter 4.1 of Lock-in Thermography by O.Breitsenstein et al.6 In our case, the heat sink is air and the sample is held by a ring with small contact area. We calculate the relaxation time constant to be on the order of 0.1 s, so the modulation period should be at least one order of magnitude larger than this constant. In theory, there is no upper-limit to the modulation frequency, but if the frequency is too high, the cell will not absorb enough heat in a given modulation period. In this case, it will take longer time to reach “quasi-steady-state” and more iterations to get accurate results. We find that a reasonable balance between these two extremes is to set the modulation frequency at roughly 1-5 Hz. Figure 12 shows that back side optical heating is an effective means of crack detection, due to the dramatic change in lateral thermal conductivity at a crack, in combination with the strong thermal gradient created by the spatially inhomogeneous laser spot. If the point heat source is applied asymmetrically relative to the crack, the thermal signature shows a step change at the crack; this is consistent with the above results using a thermoelectric cooler as the heat source. If the heat source is applied directly under the crack, the crack shows up as a bright hot line relative to the surrounding material; see for example the upper right image in Figure 12. As observed above for thermoelectric heating, back side optical heating is an effective means of crack detection, provided that the heat source is either directly under the crack or within 1cm (roughly the thermal diffusion length for these cells) of the crack. Using TE coolers as the heat source has the advantage of being large area, but is impractically slow. The laser heating technique shown here is 100x faster but is highly localized. To address this problem, a diffractive hologram could be used to divide the laser beam into a regular grid of hot spots. However, the tradeoff between spot size and separation (relative to the 1cm thermal diffusion length) and the optical power available in each spot must be explored.
6 O. Breitenstein, M. Langenkamp, Lock-in Thermography—Basics and Use for Functional Diagnostics of Electronic Components, Springer Series Advanced Microelectronics, Volume 10. Springer: Heidelberg, Berlin, 2003, ISBN 3-540-43439-9

DE-EE0000582 RECOVERY ACT: MULTIMODAL IMAGING FOR SOLAR CELL MICROCRACK DETECTION
Alenas Imaging, Inc.
Page 21 of 33
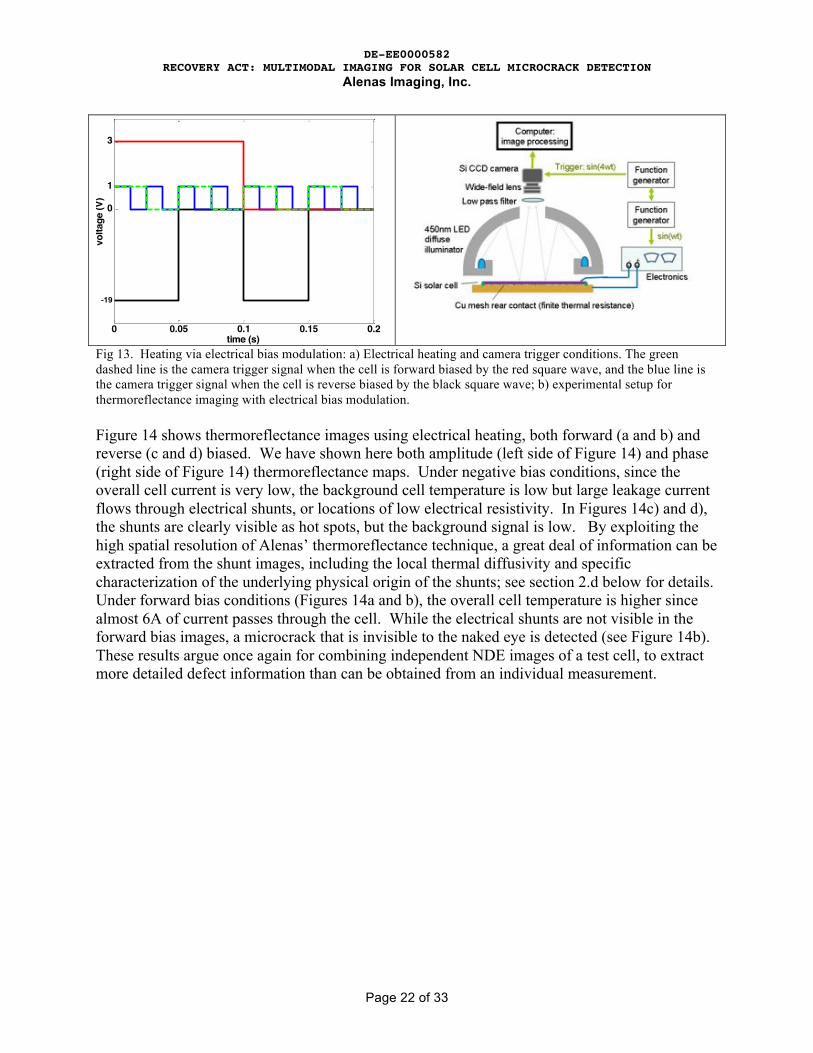
Figure 12. Thermoreflectance amplitude images of a test cell with optical heating via a laser, with varying laser modulation frequencies. For 5Hz, more iteration is needed to see the crack. The inset is the visual image of the sample. The yellow arrows indicate the crack position. 2.c.3 Heating via electrical bias modulation In this technique, the test cell is electrically heated by a square wave modulation of the applied bias current or voltage at frequency f. Thermoreflectance imaging is locked to the modulation frequency by triggering the camera at frequency 4f, phase locked to the electrical modulation signal; the data is collected over 200,000 iterations. See Figure 13.
DE-EE0000582 RECOVERY ACT: MULTIMODAL IMAGING FOR SOLAR CELL MICROCRACK DETECTION
Alenas Imaging, Inc.
Page 22 of 33
0 0.05 0.1 0.15 0.2
0
1
3
time (s)
volta
ge (V
)
-19
Fig 13. Heating via electrical bias modulation: a) Electrical heating and camera trigger conditions. The green dashed line is the camera trigger signal when the cell is forward biased by the red square wave, and the blue line is the camera trigger signal when the cell is reverse biased by the black square wave; b) experimental setup for thermoreflectance imaging with electrical bias modulation. Figure 14 shows thermoreflectance images using electrical heating, both forward (a and b) and reverse (c and d) biased. We have shown here both amplitude (left side of Figure 14) and phase (right side of Figure 14) thermoreflectance maps. Under negative bias conditions, since the overall cell current is very low, the background cell temperature is low but large leakage current flows through electrical shunts, or locations of low electrical resistivity. In Figures 14c) and d), the shunts are clearly visible as hot spots, but the background signal is low. By exploiting the high spatial resolution of Alenas’ thermoreflectance technique, a great deal of information can be extracted from the shunt images, including the local thermal diffusivity and specific characterization of the underlying physical origin of the shunts; see section 2.d below for details. Under forward bias conditions (Figures 14a and b), the overall cell temperature is higher since almost 6A of current passes through the cell. While the electrical shunts are not visible in the forward bias images, a microcrack that is invisible to the naked eye is detected (see Figure 14b). These results argue once again for combining independent NDE images of a test cell, to extract more detailed defect information than can be obtained from an individual measurement.

DE-EE0000582 RECOVERY ACT: MULTIMODAL IMAGING FOR SOLAR CELL MICROCRACK DETECTION
Alenas Imaging, Inc.
Page 23 of 33
Figure 14. Thermoreflectance images of test cell under electrical bias modulation. Top row shows amplitude maps of the thermal distribution, while bottom row shows maps of the relative phase of the thermal signal. Figures a) and b) are obtained with positive electrical bias (see also red trace in Figure 13), whereas Figures c) and d) are obtained under reverse bias (see also black trace in Figure 13). To further test this configuration, a second test cell was used. The test sample is placed on an aluminum block and positioned under an optical microscope adapted for Alenas’ thermoreflectance imaging technique. Temperature modulation of the test cell is provided by square wave modulating the electrical bias to the cell from 0 - 2.4V at a frequency of 10 Hz. Typical data is shown in Figure 15, where a 5x microscope objective has been used. As seen in Figure 15b, the crack is visible as a line of lower temperature (cooler) than at nearly locations. As in the optical heating experiments, the phase of the thermal distribution changes abruptly at the crack. This method also enables one to distinguish between scratches and a crack; the two surface scratches seen in the white light image are not found in the thermoreflectance images.
-150
-100
-50
0
50
100
150
50 100 150 200 250 300 350 400 450 500 550
50
100
150
200
250
300
-150
-100
-50
0
50
100
150
50 100 150 200 250 300 350 400 450 500 550
50
100
150
200
250
300

DE-EE0000582 RECOVERY ACT: MULTIMODAL IMAGING FOR SOLAR CELL MICROCRACK DETECTION
Alenas Imaging, Inc.
Page 24 of 33
Figure 15. Thermoreflectance crack detection using bias current modulation to drive the cell heating; a) ordinary white light image shows crack; b) ΔR/R amplitude image under 5x microscope; c) Phase map of the thermal distribution. 2.d. Additional quantitative analysis via thermoreflectance imaging We have presented above a method of crack detection in which the test cell is electrically heated by modulating the applied electrical bias; the resulting thermal distribution is mapped using Alenas’ enhanced thermoreflectance imaging. These maps contain a great deal of quantitative, highly spatially resolved information about the localized device performance, enabling extraction of a number of key performance parameters, including the bias-dependent leakage current through localized shunts, local IV curves, local diode ideality factors, and key material parameters such as thermal diffusivity and conductivity. See Appendix 1 for a detailed discussion of this topic; the main results are summarized here. Spatially resolved thermoreflectance images of the amplitude and phase of the thermal distribution across a modulated solar cell can be used to extract the bias-dependent leakage current through localized shunts, along with local IV curves and the local diode ideality factor. Figure 16a illustrates this analysis for a sample hot spot, which is clearly visible with a forward

DE-EE0000582 RECOVERY ACT: MULTIMODAL IMAGING FOR SOLAR CELL MICROCRACK DETECTION
Alenas Imaging, Inc.
Page 25 of 33
bias modulation of 1V; however, this shunt does not cause significant localized heating under a reverse bias modulation of -1V, indicating a nonlinear local leakage current. The local IV curve of the sample shunt is obtained using the analysis of the cited reference at varying modulation bias voltages, from which we extract a local diode ideality factor for this shunt of n=6.0, in contrast to the bulk cell ideality factor of n=4.5.7
Fig. 16. a) Local IV curve measured at the position of a shunt, contrasted with whole cell IV curve. Measured data are fit with the Shockley diode equation. b) Inset shows thermoreflectance phase image of a shunt in a reverse biased (-12V, 1Hz) Evergreen solar cell. Open circles show measured phase lag versus distance from the heat source; solid line shows best fit of the heat equation, using a as a fitting parameter. High resolution thermoreflectance imaging can also be used to extract the thermal diffusivity and conductivity of working devices; these are key performance markers for solar cells because shading of operating modules can lead to very high local temperatures at shunts, causing irreversible damage. Figure 16b shows a thermoreflectance phase image of a shunt; as expected, the radius of the measured hot spot scales inversely with frequency. The solution of the heat equation for a thermally thin film with adiabatic boundary conditions and a periodic point source is fit to the measured phase shift data for the 1Hz case. Using thermal diffusivity (a) as a fitting parameter yields a value of a = 0.79 cm2/s, which is consistent with the literature value for silicon of 0.86 cm2/s.8 By similar means, using the thermoreflectance amplitude images, we extract a thermal conductivity of 1.11±0.14 Wcm-1K-1. Task 3: Efficiency mapping
In this task, we obtain spatially resolved maps of the solar cell operating efficiency, both as a means of crack detection and also to examine the effect of the defects identified above on current generation in the cell. Figure 17 shows the efficiency mapping setup, which is a modified version of the classic light beam induced current (LBIC) technique. The light source is a 660 nm 22.5 mW, fiber-pigtailed laser diode (Thorlabs LPM-660-AFS105/125Y-FC-SP). The pigtail is coupled to an angle-polished single mode fiber to minimize back reflection that can cause the output intensity to fluctuate; the fiber core diameter at the output is 9 mm. The output optical power is adjustable by controlling the current to the laser diode; in the work shown here, the
7O. Breitenstein, P. Altermatt, K. Ramspeck, A. Schenk, Proc. 21st European Photovoltaic Solar Energy Conference (PVSEC, 2006), Dresden 8 R. Hull, Properties of Crystalline Silicon (The Institution of Electrical Engineers, 1999), pp. 165-169.
0.5 1 1.5 215
20
25
30
35
r(mm)
Phas
e sh
ift (d
egre
e)
f=1Hz f=3Hz
f=6Hz f=10Hz
f=12Hz f=13Hz
-100
0
100

DE-EE0000582 RECOVERY ACT: MULTIMODAL IMAGING FOR SOLAR CELL MICROCRACK DETECTION
Alenas Imaging, Inc.
Page 26 of 33
optical output is 19 mW. The fiber output (indicated as (6) in Figure 17b) is mounted on a motor-driven Newport translation stage (1). In the initial tests shown below, a linear motor (2) is used to translate the x-axis of a the Newport stage, while the y-axis was translated manually after each x-axis sweep, with a step size of 100um or 200um; see Figure 17a. After promising initial results, the experiment was upgraded to include dual-axis motorized control; see Figure 17b where a stepping motor (3) is used.
In both setups, the test cell (7) is placed underneath the illuminating fiber output from the diode laser, and a Keithley 2400 multimeter is used to measure the short-circuit current from the cell under test. The light output from the fiber is scanned across the cell at a uniform speed of ~0.11 mm/s, while the short-circuit current induced by the absorbed laser light is read simultaneously. The light spot size at the test cell is roughly 20 um. Given the 0.11 mm/s scan speed and a speed of 0.1 s per readout, the measurements shown here have a spatial resolution of roughly 10um, which can easily be improved if needed by focussing the laser spot, slowing the scan speed and/or increasing the readout speed.
Figure 17. Light induced short circuit current measurement setup: a) the setup used in the preliminary results; b) fully automated setup. Two limit switches are used to detect the x-axis limit. When it reaches the limit, the switches will send the signal to (5), which is the control box for the stepping motor (3), to step forward in y-direction and (4), which is the control box for the linear motor (2), to reverse the x scan direction.
The results in Figure 18 illustrate the basic technique of efficiency mapping. A light-induced short-circuit current will be generated by the solar cell in proportion to the efficiency with which the point source of applied light is absorbed by the cell and converted to current. Figure 18 shows the measured short circuit current generated by the cell as the point illumination source is scanned between two electrical contacts on the cell. The measured current is minimum when the

DE-EE0000582 RECOVERY ACT: MULTIMODAL IMAGING FOR SOLAR CELL MICROCRACK DETECTION
Alenas Imaging, Inc.
Page 27 of 33
light is on the contact finger because no light reaches the active surface of device; these regularly spaced minima in the measurement provide a simple means of locating the measurement position on the cell. The measured light-induced current also drops at defects and cracks due to lower optoelectric conversion efficiency resulting from reduced optical absorption and/or increased numbers of recombination sites.
Figure 18. 1-D efficiency mapping. The measured light-induced short-circuit current varies as the illumination spot is linearly translated between two electrical contacts.
Figure 19 shows efficiency mapping of another test cell, using both the 1D photocurrent scan technique and the 2D scan; the crack is clearly visible in both efficiency maps.
Fig 19. a) Photocurrent 1D scan along the red line in b) photocurrent 2D image.
We have also demonstrated 2D efficiency mapping of a sample with a microcrack that is so small that it can only be seen under 150x magnification; see Figures 20 and 21. Figure 21 shows multimodal imaging of this subtly microcracked cell. In Figure 21a, a wider area view of the same cell as in Figure 20 is seen; as expected, the crack cannot be seen in the unmagnified

DE-EE0000582 RECOVERY ACT: MULTIMODAL IMAGING FOR SOLAR CELL MICROCRACK DETECTION
Alenas Imaging, Inc.
Page 28 of 33
visible image here. The microcrack is clearly visible in the forward biased electroluminescence image in Figure 21b. Finally, Figure 21c shows a 2D efficiency map of the same region of the cell; the microcrack is also clearly visible in this image.
Fig 20. Microscopic imaging at the place where there is crack under objective lens with magnification of a) 40x b) 150x. Note that the crack cannot be seen under 40x magnification. The yellow arrows indicate the crack.
Figure 21 shows the comparison between visual image, EL image and the efficiency map.

DE-EE0000582 RECOVERY ACT: MULTIMODAL IMAGING FOR SOLAR CELL MICROCRACK DETECTION
Alenas Imaging, Inc.
Page 29 of 33
Fig 21. a) Visual image of the sample; b) Positive biased EL image of the sample, where the red dashed frame is scanned area for efficiency mapping image. The region indicated by yellow arrow is the crack in Figure 19b. c) Efficiency mapping image. Three contacts and the crack are seen in the efficiency map.
Task 4: Algorithms to minimize false positives We have demonstrated a wide variety of imaging modes for crack detection in mc-silicon solar cells, and some of these techniques (for example, forward biased electroluminescence and efficiency mapping) have proven to be quite sensitive, even to microcracks. However, none of the techniques is of itself definitive, largely because the most sensitive techniques for crack detection are also sensitive to a wide variety of other defects (grain boundaries, shunts, etch flaws, etc); see for example Figures 2b and 19a above. Multimodal imaging, in which the same cell is imaged using a subset of the techniques above, is an effective means of reducing this false positive rate. Figure 22 below illustrates this idea; the figure shows four independent images of the same test cell. As expected, the most visible features (marked in red) in the standard widefield visible image of the cell are the grain boundaries. The large diagonal crack running from the upper left of the cell to the lower right is only very faintly suggested in this image. The diagonal crack is clearly visible in the other three images; however, many additional linear features are visible in these three images as well and it

DE-EE0000582 RECOVERY ACT: MULTIMODAL IMAGING FOR SOLAR CELL MICROCRACK DETECTION
Alenas Imaging, Inc.
Page 30 of 33
is impossible to distinguish these extra features from the crack in any one of Figures 22 b)-d). The false positive rate in the electroluminescence and two thermoreflectance images is roughly 4:1. The three images (Figures 22 b-d) taken in combination, however, enable the user to pick out the crack independently of the other features, as the crack is the only feature that is repeated across all three images. Hence, in the example shown below, multimodal imaging across only three independent images (EL and thermoreflectance amplitude and phase) eliminates the false positives.
a)
b)
c)
d)
Fig 22. Multiple independent images of the same test cell: a) standard visible image; b) forward biased (0.8V) EL image; c) thermoreflectance amplitude image; d) thermoreflectance phase image. Red or blue lines show major linear features visible in each image. We have repeated this analysis across multiple test cells and using all of the various forms of imaging discussed in the tasks above. In general, cross-correlating the results across multiple images, particularly the efficiency maps, thermoreflectance images, and EL images, dramatically reduces, or even eliminates, the false positive rate. The analysis discussed above has been performed by identifying features manually. In a more developed version of our system, the analysis of multimodal images of test cells will be automated, using powerful imaging tools such as Igor. Full automation of cross-correlating features across multiple images is beyond the scope of this project, but simple, proof-of-principle demonstrations are presented below. Figure 23 shows the use of the commercial software package Igor to perform edge detection using the Frei method on various of the images from Figure 22 above. A first order result for

DE-EE0000582 RECOVERY ACT: MULTIMODAL IMAGING FOR SOLAR CELL MICROCRACK DETECTION
Alenas Imaging, Inc.
Page 31 of 33
combining the three images is shown in Figure 24. Figure 24a shows a Boolean addition of the three images in the right column of Figure 23; regions with no features in any of the three images are red, while regions with features in all three of the images are blue. Figure 24b contains the same combined image as 24a, with the addition of a Boolean mask to eliminate any feature that appears in only one of the three images. The crack is clearly visible, while extraneous false positive features are eliminated, in Figure 24b, which combines three independent multimodal images of the test cell.
a) b)
c) d)
e) f)
Figure 23. Use of Igor’s Edge Detection Algorithm to extract features in multimodal images of a test solar cell. a) and b) are thermoreflectance amplitude maps with electrical heating; c) and d) are the corresponding thermal phase maps; e) and f) are electroluminescence images.

DE-EE0000582 RECOVERY ACT: MULTIMODAL IMAGING FOR SOLAR CELL MICROCRACK DETECTION
Alenas Imaging, Inc.
Page 32 of 33
Figure 24: Combined results for the three images in the right column of Figure 22. a) Boolean addition of the three images; b) Boolean addition with a mask to eliminate any features that occur in only one of the three images. The above results show the power of multimodal imaging for crack detection. By cross-correlating detected features between multiple independent images of the same test cell, one can pick out microcracks while eliminating many of the false-positive (e.g. non-crack) features. Furthermore, by combining thermal imaging with the other imaging techniques, all using the same camera and without requiring that the cell be moved between test stations, cross-correlation of the images can be easily automated. Even the very simple demonstration shown above successfully identifies the crack while eliminating most of the extraneous features. Task 5: Methods of crack detection prior to applying electrical contacts, and other developments We have demonstrated several methods of crack detection that can be used early in the solar cell processing sequence, prior to application of electrical contacts. Thermoeflectance with back side thermal modulation using optical heating or thermoelectric coolers is performed without the use of the electrical contacts; see Sections 2.c.1 and 2.c.2 for an extensive discussion of these techniques, results, and a discussion of the relative merits. Likewise, mechanical and acoustical deflection mapping, which is discussed in Section 1c, can be performed prior to the application of electrical contacts. This technique is shown in Section 1c to be an effective means of crack detection, but the spatial resolution is limited in wide area, whole cell imaging NDE applications. For this reason, the thermoreflectance imaging modalities are recommended for microcrack detection in cells prior to the application of electrical contacts. Our work on crack detection has also led to the realization that thermoreflectance imaging is a remarkably powerful, high resolution, non contact technique for more general characterization of device performance and identifying electrical shunts in conventional multicrystalline silicon solar cells. We have demonstrated that our thermoreflectance measurements are in quantitative agreement with a commercial lock-in infrared thermography system, but offer an order of magnitude improvement in spatial resolution. Thermoreflectance imaging enables extraction of quantitative, spatially resolved device performance characteristics, including local IV curves, local diode ideality factors, which cannot be obtained from conventional bulk cell testing. Finally, thermoreflectance maps of heat spreading from a point defect provide a simple means of quantifying thermal parameters such as thermal diffusivity and conductivity, which are key field performance indicators. This discovery grew out of our crack detection work, but has

DE-EE0000582 RECOVERY ACT: MULTIMODAL IMAGING FOR SOLAR CELL MICROCRACK DETECTION
Alenas Imaging, Inc.
Page 33 of 33
independent significance. This work is detailed in a manuscript published in the Journal of Applied Physics9 Conclusions Alenas Imaging has successfully developed a low cost crack detection tool that combines multiple sensitive NDE imaging modalities in a single, visible-light-based hardware system. The results of these independent images are cross-correlated in order to differentiate cracks from the signatures of other features (grain boundaries, scratches, material defects, broken contacts, etc), reducing the false positive rate that has plagued crack detection systems to date. In this work, we have explored a wide range of NDE imaging modalities, including thermo-reflectance with three methods of heating, forward and reversed biased electroluminescence imaging, mechano-acoustic imaging, and efficiency mapping. While mechano-acoustic imaging and thermoreflectance with a thermoelectric heater are shown to be effective means of crack detection, both of these modalities are somewhat impractical, with limited speed (TR with TE heater) or field of view (mechano-acoustic imaging). The remaining five techniques, however, are highly effective means of NDE of solar cells, although each technique is sensitive to at least one other type of defect in addition to cracks so suffers from a high false positive rate on its own. The false positive rate is minimized using Alenas’ multimodal imaging apparatus, in which a single cell is independently tested in a single hardware setup using each of the above NDE imaging techniques. The resulting images are imaged processed using a combination of edge detection algorithms and then cross-correlated to identify features common across independent imaging modalities. This enables our system to identify microcracks while eliminating many of the false-positive (e.g. non-crack) features. Furthermore, by combining thermal imaging with the other imaging techniques, all using the same camera and without requiring that the cell be moved between test stations, cross-correlation of the images can be easily automated. We note that this ability to combine thermography with the other NDE techniques is unique to our thermoreflectance technique and cannot be achieved using conventional long-wavelength IR thermography.
9 Zhou, Hu, Al_Hemyari, McCarthy, Domash and Hudgings, J. Appl. Phys. 110, 053108 (2011).