Recovering Plastics via the Hydraulic Separator Multidune ...
18
Int. J. Environ. Res., 7(1):113-130, Winter 2013 ISSN: 1735-6865 Received 19 May 2012; Revised 17 July 2012; Accepted 7 Aug. 2012 *Corresponding author E-mail: [email protected] 113 Recovering Plastics via the Hydraulic Separator Multidune: flow analysis and Efficiency Tests Moroni, M. 1* , La Marca F. 2 , Cherubini L. 2 and Cenedese A. 1 1 Department of Civil and Environmental Engineering, Sapienza University of Rome, via Eudossiana, 18 – 00184, Rome, Italy 2 Department of Chemical Engineering Materials & Environment, Sapienza University of Rome, via Eudossiana, 18 – 00184, Rome, Italy ABSTRACT: Plastic recycling is the process of recovering scrap or waste plastics and reprocessing the material into useful products that sometimes differ completely in form from their original state. An important issue in plastic recovery and recycling is that plastic waste usually contains a variety of plastics that differ in their physical and chemical properties. Separation of recovered plastics into distinct classes is a fundamental prerequisite for their use as secondary raw materials. The Multidune separator is a hydraulic channel that permits solid particle sorting on the basis of differential transport mechanisms. Steady flow conditions are established within the apparatus. An image analysis technique was employed to reconstruct the trajectories of tracer particles within the fluid and to determine the evolution of the velocity field with time. Pollen and plastic particles were used as tracers. Unlike plastic particles, pollen is expected to passively follow the fluid flow field. Tests on monomaterial and composite samples were conducted while varying the operative conditions, and comparisons were made. The presence of three different recirculation areas occurred regardless of the hydraulic head at the Multidune inlet except for the first and last chambers. The lower recirculation zone is larger than the upper recirculation zone because of geometrical constraints. With variation in the hydraulic head, the geometry of the inner structures does not change appreciably. If a plastic particle within the principal transport path interacts with the lower recirculation area and its physical characteristics (density and dimensions) are such that it remains trapped, the separation process is successful. Because of its smaller dimensions and the reduced value of its velocity field, the upper recirculation area is relatively ineffective in the separation process. Key words: Plastic recovery, laboratory experiments, image analysis techniques, hydraulic separation, fluid dynamics INTRODUCTION Plastic recycling is essential to reduce the accumulation of material in landfills and to decrease the production of raw materials. In fact, in industrialized countries, plastics represent one of the largest categories of municipal solid waste (Shent et al., 1999). The global consumption of plastics was reported to be 230 million tons in 2009 (PlasticsEurope, 2010), of which 55 million tons were produced in Europe. Of the current European demand for plastics, 75% is represented by five high-volume types of plastics; these are polyethylene, including low density (PE-LD), linear low density (PE-LLD) and high density (PE-HD), polypropylene (PP), polyvinyl chloride (PVC), polystyrene (solid PS and expandable PS) and polyethylene terephthalate (PET). The most commonly used types of resins are polyolefins (PE-LD, PE-HD, PE-LLD and PP); together, these four resins account for approximately 50% of plastic demand. PVC is the third largest resin type at 11%. Of the plastics produced in Europe, 24.3 million tons were reported as having been collected as waste. Of this collected waste, 5.5 million tons were recycled as manufacturing feedstock (22.5%) and 7.6 million tons went into energy recovery (31.5%), with the balance (11.2 million tons) probably being disposed of primarily in landfills (PlasticsEurope, 2010). Global consumption is increasing (PlasticsEurope 2007a) while material amount disposed in landfills is slightly lower (PlasticsEurope 2007b). Plastic materials are currently recycled using two different methods: chemical recycling and mechanical recycling. Chemical recycling is driven by thermal (e.g.,
Transcript of Recovering Plastics via the Hydraulic Separator Multidune ...
Int. J. Environ. Res., 7(1):113-130, Winter 2013ISSN: 1735-6865
Received 19 May 2012; Revised 17 July 2012; Accepted 7 Aug. 2012
*Corresponding author E-mail: [email protected]
113
Recovering Plastics via the Hydraulic Separator Multidune: flow analysisand Efficiency Tests
Moroni, M.1*, La Marca F.2, Cherubini L.2 and Cenedese A.1
1Department of Civil and Environmental Engineering, Sapienza University of Rome, viaEudossiana, 18 – 00184, Rome, Italy
2Department of Chemical Engineering Materials & Environment, Sapienza University of Rome, viaEudossiana, 18 – 00184, Rome, Italy
ABSTRACT: Plastic recycling is the process of recovering scrap or waste plastics and reprocessing thematerial into useful products that sometimes differ completely in form from their original state. An importantissue in plastic recovery and recycling is that plastic waste usually contains a variety of plastics that differ intheir physical and chemical properties. Separation of recovered plastics into distinct classes is a fundamentalprerequisite for their use as secondary raw materials. The Multidune separator is a hydraulic channel thatpermits solid particle sorting on the basis of differential transport mechanisms. Steady flow conditions areestablished within the apparatus. An image analysis technique was employed to reconstruct the trajectories oftracer particles within the fluid and to determine the evolution of the velocity field with time. Pollen andplastic particles were used as tracers. Unlike plastic particles, pollen is expected to passively follow the fluidflow field. Tests on monomaterial and composite samples were conducted while varying the operative conditions,and comparisons were made. The presence of three different recirculation areas occurred regardless of thehydraulic head at the Multidune inlet except for the first and last chambers. The lower recirculation zone islarger than the upper recirculation zone because of geometrical constraints. With variation in the hydraulichead, the geometry of the inner structures does not change appreciably. If a plastic particle within the principaltransport path interacts with the lower recirculation area and its physical characteristics (density and dimensions)are such that it remains trapped, the separation process is successful. Because of its smaller dimensions andthe reduced value of its velocity field, the upper recirculation area is relatively ineffective in the separationprocess.
Key words: Plastic recovery, laboratory experiments, image analysis techniques, hydraulic separation, fluid dynamics
INTRODUCTIONPlastic recycling is essential to reduce the
accumulation of material in landfills and to decreasethe production of raw materials. In fact, in industrializedcountries, plastics represent one of the largestcategories of municipal solid waste (Shent et al., 1999).The global consumption of plastics was reported to be230 million tons in 2009 (PlasticsEurope, 2010), of which55 million tons were produced in Europe. Of the currentEuropean demand for plastics, 75% is represented byfive high-volume types of plastics; these arepolyethylene, including low density (PE-LD), linear lowdensity (PE-LLD) and high density (PE-HD),polypropylene (PP), polyvinyl chloride (PVC),polystyrene (solid PS and expandable PS) andpolyethylene terephthalate (PET). The most commonly
used types of resins are polyolefins (PE-LD, PE-HD,PE-LLD and PP); together, these four resins accountfor approximately 50% of plastic demand. PVC is thethird largest resin type at 11%. Of the plastics producedin Europe, 24.3 million tons were reported as havingbeen collected as waste. Of this collected waste, 5.5million tons were recycled as manufacturing feedstock(22.5%) and 7.6 million tons went into energy recovery(31.5%), with the balance (11.2 million tons) probablybeing disposed of primarily in landfills (PlasticsEurope,2010). Global consumption is increasing(PlasticsEurope 2007a) while material amount disposedin landfills is slightly lower (PlasticsEurope 2007b).
Plastic materials are currently recycled using twodifferent methods: chemical recycling and mechanicalrecycling. Chemical recycling is driven by thermal (e.g.,
114
Moroni, M. et al.
pyrolysis) or chemical (selective solvents) processesthat essentially break down the original polymer chainsand molecules within the original material (Jody andDaniels, 2010). Conversely, mechanical recyclinggenerally consists of shredding old products into smallpieces followed by the use of separation units to extractspecific sizes or materials from the main material flow(e.g., magnetic drums to separate ferrous metals andsophisticated sorting techniques such as infra-redscanning); mills and extruders are then used to convertthe separated plastics into new machine-readygranules. Mechanical recycling is now the primarymethod used to recycle thermoplastic polymers.However, mechanical recycling of thermosettingpolymers is not feasible because heat can result intheir carbonization.
The success of the mechanical recycling ofthermoplastic polymers and the quality of the productsthat can be manufactured from the recycled materiallargely depend on the efficiency of the manual orautomatic separation stage (Gent et al., 2009).Depending on the type of plastic waste involved,secondary raw materials of various kinds that aresuitable for a variety of uses can be obtained. To thisend, mechanical recycling can be carried out as eitherheterogeneous or homogeneous recycling based onthe desired quality of the secondary raw material to beobtained. In heterogeneous recycling, the goal is toobtain a low-quality mixed material composed of PE,PP, PS, PET and traces of PVC. In this case, theseparation phase is aimed only at eliminating non-plastic materials that may be present in the waste stream.Homogeneous recycling, on the other hand, is theprocessing of a single type of thermoplastic polymerso that it is obtained free of contamination from otherpolymers, inert fillers or additives that may affect thequality and workability of the end product. Inhomogeneous recycling, the efficacy of the separationprocess plays a major role. The main problem inhomogeneous recycling is related to the narrow rangeof variation of the specific mass of plastic materials(0.9-1.5 g/cm3) (Plastics International, 2007). Particularlyrelevant is separating PVC from PET. PVC is consideredan extremely dangerous contaminant because, ifwarmed to high temperatures in unsuitable facilities, itfrees chlorine-based carcinogenic compounds such asdioxins and furans. Although the separation of PVCfrom PET (the latter is more abundant in urban wastesthan the former being the most favourable packagingmaterial world-wide for beverages (Welle, 2011)) isoften conducted using automatic sorting (Dinger, 1992;Ahmad, 2004), gravity separation, electrostaticseparation and froth flotation (Buchan and Yarar, 1995;Hearn and Ballard, 2005; Wei and Realff, 2005;
Kinoshita et al., 2006; Menèndez et al., 2007; Tilmatineet al., 2009; Sadat-Shojai and Bakhshandeh, 2010) allhave limitations in terms of operating costs andproduction capacity. The Multidune separator,hereinafter referred to as ‘Multidune’, allows one toovercome the above-mentioned inconveniences.Multidune consists of a hydraulic channel that allowssolid particles to be sorted on the basis of differentialtransport mechanisms. The name Multidune waschosen due to the undulating profile of the channel,which reproduces the typical shape of desert dunes(De Sena et al., 2008 hereinafter DS2008). TheMultidune, which has been developed at the laboratoryscale, fits into the context of plastics recycling as aninexpensive alternative to traditional methods due toits capability of effectively separating plastic particleshaving a density slightly higher than water.
Controlled laboratory experiments have beenconducted in the past to characterize the fluid dynamicsfield within the Multidune apparatus employingParticle Tracking Velocimetry (PTV) (DS2008). The mainresults presented in DS2008 consist in the descriptionof the two velocity components and of the threecharacteristic regions developing within chamber C3of the Multidune. The experimental technique employedhere (Feature Tracking - FT) represents an importantstep forward respect to PTV for the possibility toanalyze images with high density of tracer particlesand to compute robust statistics. For details andcomparisons between the two image analysistechniques refer to Moroni and Cenedese (2005).Through the use of a more powerful experimentalequipment, the velocity field in the entire apparatuswas reconstructed allowing the full characterization ofthe fluid behavior within the eight chambers to beachieved. To facilitate the comparison of the velocityfields, color maps and vertical profiles are presentedfor the eight chambers and five hydraulic heads. Itwas next verified if the three characteristic regionsdevelop in all chambers and if differences arise. Theaccurate reconstruction of the fluid dynamics of waterflowing through the apparatus allows the behavior ofplastic particles to be rationally correlated to thevelocity field features. As far as it concerns theseparation tests, most of the plastic particles employedin DS2008 have been used for the separation testspresented here. Plastic specific mass has beenrecomputed with a more accurate procedure than before.
This work consists of three parts. In the first part,we investigated the fluid dynamic behavior of theMultidune apparatus using high spatial and temporalresolution image analysis systems and passive tracerparticles, i.e., particles of sizes on the order of onehundred microns with a density equal to that of water
Int. J. Environ. Res., 7(1):113-130, Winter 2013
115
(Section 3.1). In the second part, we investigated thebehavior of two types of plastic particles (PS and PVC,hereinafter referred to as active tracers); the sameparticles were used afterwards in separation tests underthe same experimental conditions (Section 3.2). Thethird part describes tests on composite plastics(Section 4).
MATERIALS & METHODSThe Multidune apparatus is constructed from a
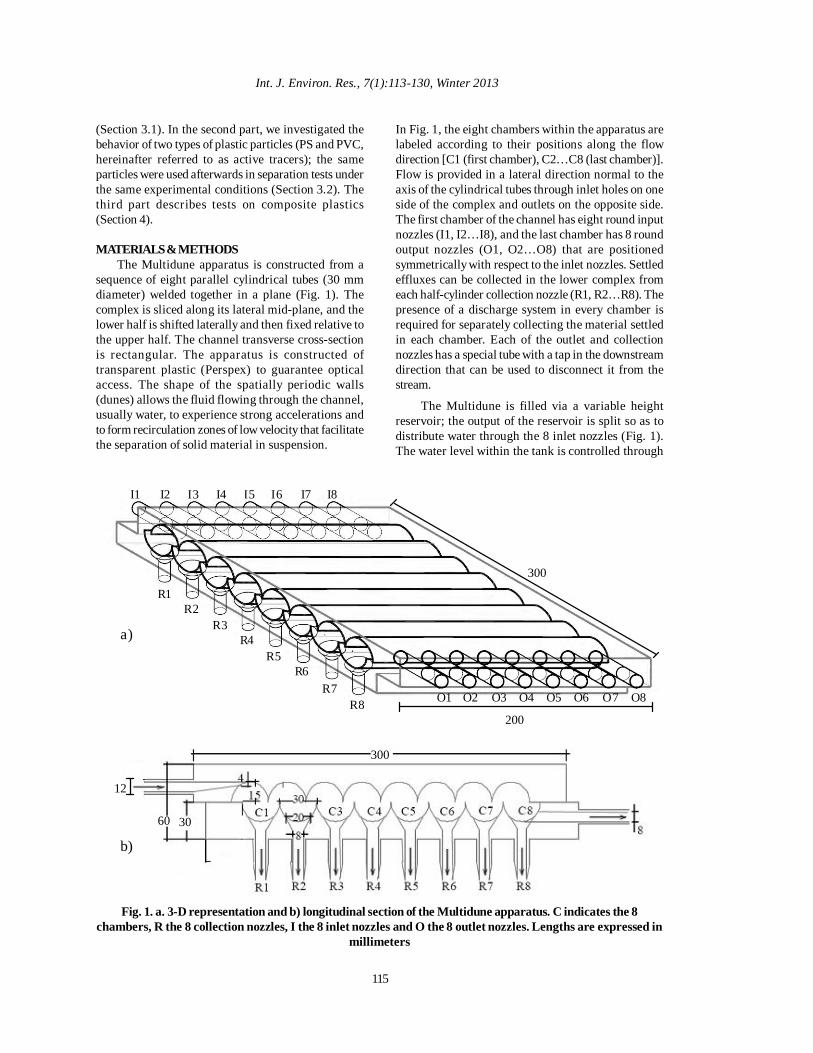
sequence of eight parallel cylindrical tubes (30 mmdiameter) welded together in a plane (Fig. 1). Thecomplex is sliced along its lateral mid-plane, and thelower half is shifted laterally and then fixed relative tothe upper half. The channel transverse cross-sectionis rectangular. The apparatus is constructed oftransparent plastic (Perspex) to guarantee opticalaccess. The shape of the spatially periodic walls(dunes) allows the fluid flowing through the channel,usually water, to experience strong accelerations andto form recirculation zones of low velocity that facilitatethe separation of solid material in suspension.
R1 R2
R3 R4
300
R6
30 60
12
300
200
R7R8
R5
I1 I2 I3 I4 I5 I6 I7 I8
O1 O2 O3 O4 O5 O6 O7 O8
a)
b)
Fig. 1. a. 3-D representation and b) longitudinal section of the Multidune apparatus. C indicates the 8chambers, R the 8 collection nozzles, I the 8 inlet nozzles and O the 8 outlet nozzles. Lengths are expressed in
millimeters
In Fig. 1, the eight chambers within the apparatus arelabeled according to their positions along the flowdirection [C1 (first chamber), C2…C8 (last chamber)].Flow is provided in a lateral direction normal to theaxis of the cylindrical tubes through inlet holes on oneside of the complex and outlets on the opposite side.The first chamber of the channel has eight round inputnozzles (I1, I2…I8), and the last chamber has 8 roundoutput nozzles (O1, O2…O8) that are positionedsymmetrically with respect to the inlet nozzles. Settledeffluxes can be collected in the lower complex fromeach half-cylinder collection nozzle (R1, R2…R8). Thepresence of a discharge system in every chamber isrequired for separately collecting the material settledin each chamber. Each of the outlet and collectionnozzles has a special tube with a tap in the downstreamdirection that can be used to disconnect it from thestream.
The Multidune is filled via a variable heightreservoir; the output of the reservoir is split so as todistribute water through the 8 inlet nozzles (Fig. 1).The water level within the tank is controlled through
116
Recovering plastics
an overflow exit. The plastic samples and the tracer forimage analysis are introduced through nozzles I3 andI4. The average flow rate depends on the hydraulichead at the inlet nozzles and the number of open outletnozzles.
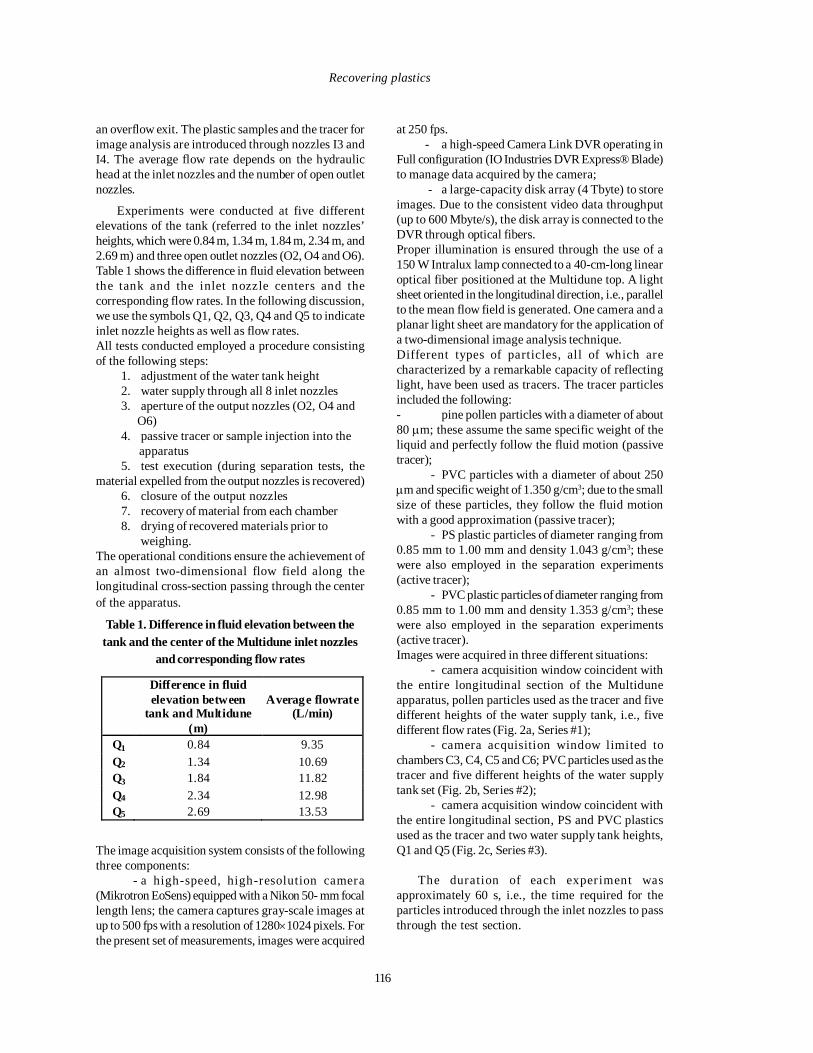
Experiments were conducted at five differentelevations of the tank (referred to the inlet nozzles’heights, which were 0.84 m, 1.34 m, 1.84 m, 2.34 m, and2.69 m) and three open outlet nozzles (O2, O4 and O6).Table 1 shows the difference in fluid elevation betweenthe tank and the inlet nozzle centers and thecorresponding flow rates. In the following discussion,we use the symbols Q1, Q2, Q3, Q4 and Q5 to indicateinlet nozzle heights as well as flow rates.All tests conducted employed a procedure consistingof the following steps: 1. adjustment of the water tank height 2. water supply through all 8 inlet nozzles 3. aperture of the output nozzles (O2, O4 and O6) 4. passive tracer or sample injection into the apparatus 5. test execution (during separation tests, thematerial expelled from the output nozzles is recovered) 6. closure of the output nozzles 7. recovery of material from each chamber 8. drying of recovered materials prior to weighing.The operational conditions ensure the achievement ofan almost two-dimensional flow field along thelongitudinal cross-section passing through the centerof the apparatus.
Difference in fluid elevation between
tank and Multidune (m)
Average flowrate (L/min)
Q1 0.84 9.35 Q2 1.34 10.69 Q3 1.84 11.82 Q4 2.34 12.98 Q5 2.69 13.53
Table 1. Difference in fluid elevation between thetank and the center of the Multidune inlet nozzles
and corresponding flow rates
The image acquisition system consists of the followingthree components: - a high-speed, high-resolution camera(Mikrotron EoSens) equipped with a Nikon 50- mm focallength lens; the camera captures gray-scale images atup to 500 fps with a resolution of 1280×1024 pixels. Forthe present set of measurements, images were acquired
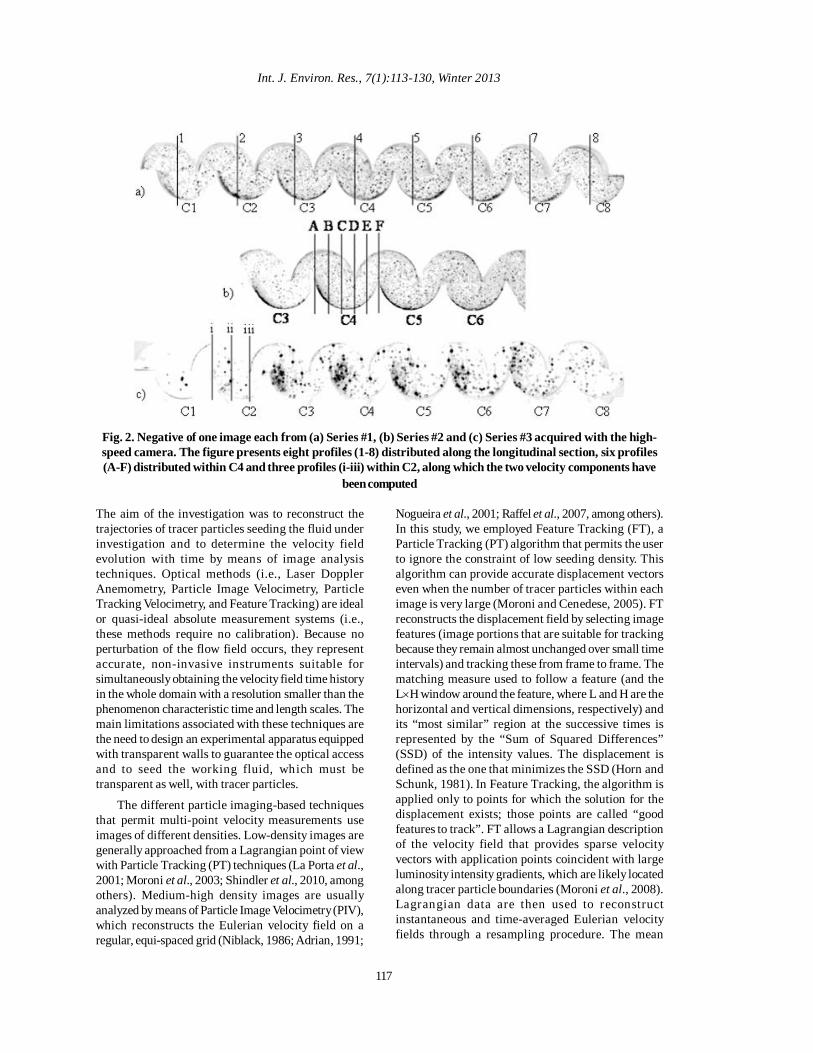
at 250 fps. - a high-speed Camera Link DVR operating inFull configuration (IO Industries DVR Express® Blade)to manage data acquired by the camera; - a large-capacity disk array (4 Tbyte) to storeimages. Due to the consistent video data throughput(up to 600 Mbyte/s), the disk array is connected to theDVR through optical fibers.Proper illumination is ensured through the use of a150 W Intralux lamp connected to a 40-cm-long linearoptical fiber positioned at the Multidune top. A lightsheet oriented in the longitudinal direction, i.e., parallelto the mean flow field is generated. One camera and aplanar light sheet are mandatory for the application ofa two-dimensional image analysis technique.Different types of particles, all of which arecharacterized by a remarkable capacity of reflectinglight, have been used as tracers. The tracer particlesincluded the following:- pine pollen particles with a diameter of about80 µm; these assume the same specific weight of theliquid and perfectly follow the fluid motion (passivetracer); - PVC particles with a diameter of about 250µm and specific weight of 1.350 g/cm3; due to the smallsize of these particles, they follow the fluid motionwith a good approximation (passive tracer); - PS plastic particles of diameter ranging from0.85 mm to 1.00 mm and density 1.043 g/cm3; thesewere also employed in the separation experiments(active tracer); - PVC plastic particles of diameter ranging from0.85 mm to 1.00 mm and density 1.353 g/cm3; thesewere also employed in the separation experiments(active tracer).Images were acquired in three different situations: - camera acquisition window coincident withthe entire longitudinal section of the Multiduneapparatus, pollen particles used as the tracer and fivedifferent heights of the water supply tank, i.e., fivedifferent flow rates (Fig. 2a, Series #1); - camera acquisition window limited tochambers C3, C4, C5 and C6; PVC particles used as thetracer and five different heights of the water supplytank set (Fig. 2b, Series #2); - camera acquisition window coincident withthe entire longitudinal section, PS and PVC plasticsused as the tracer and two water supply tank heights,Q1 and Q5 (Fig. 2c, Series #3).
The duration of each experiment wasapproximately 60 s, i.e., the time required for theparticles introduced through the inlet nozzles to passthrough the test section.
117
Int. J. Environ. Res., 7(1):113-130, Winter 2013
Fig. 2. Negative of one image each from (a) Series #1, (b) Series #2 and (c) Series #3 acquired with the high-speed camera. The figure presents eight profiles (1-8) distributed along the longitudinal section, six profiles(A-F) distributed within C4 and three profiles (i-iii) within C2, along which the two velocity components have
been computed
The aim of the investigation was to reconstruct thetrajectories of tracer particles seeding the fluid underinvestigation and to determine the velocity fieldevolution with time by means of image analysistechniques. Optical methods (i.e., Laser DopplerAnemometry, Particle Image Velocimetry, ParticleTracking Velocimetry, and Feature Tracking) are idealor quasi-ideal absolute measurement systems (i.e.,these methods require no calibration). Because noperturbation of the flow field occurs, they representaccurate, non-invasive instruments suitable forsimultaneously obtaining the velocity field time historyin the whole domain with a resolution smaller than thephenomenon characteristic time and length scales. Themain limitations associated with these techniques arethe need to design an experimental apparatus equippedwith transparent walls to guarantee the optical accessand to seed the working fluid, which must betransparent as well, with tracer particles.
The different particle imaging-based techniquesthat permit multi-point velocity measurements useimages of different densities. Low-density images aregenerally approached from a Lagrangian point of viewwith Particle Tracking (PT) techniques (La Porta et al.,2001; Moroni et al., 2003; Shindler et al., 2010, amongothers). Medium-high density images are usuallyanalyzed by means of Particle Image Velocimetry (PIV),which reconstructs the Eulerian velocity field on aregular, equi-spaced grid (Niblack, 1986; Adrian, 1991;
Nogueira et al., 2001; Raffel et al., 2007, among others).In this study, we employed Feature Tracking (FT), aParticle Tracking (PT) algorithm that permits the userto ignore the constraint of low seeding density. Thisalgorithm can provide accurate displacement vectorseven when the number of tracer particles within eachimage is very large (Moroni and Cenedese, 2005). FTreconstructs the displacement field by selecting imagefeatures (image portions that are suitable for trackingbecause they remain almost unchanged over small timeintervals) and tracking these from frame to frame. Thematching measure used to follow a feature (and theL×H window around the feature, where L and H are thehorizontal and vertical dimensions, respectively) andits “most similar” region at the successive times isrepresented by the “Sum of Squared Differences”(SSD) of the intensity values. The displacement isdefined as the one that minimizes the SSD (Horn andSchunk, 1981). In Feature Tracking, the algorithm isapplied only to points for which the solution for thedisplacement exists; those points are called “goodfeatures to track”. FT allows a Lagrangian descriptionof the velocity field that provides sparse velocityvectors with application points coincident with largeluminosity intensity gradients, which are likely locatedalong tracer particle boundaries (Moroni et al., 2008).Lagrangian data are then used to reconstructinstantaneous and time-averaged Eulerian velocityfields through a resampling procedure. The mean
118
Moroni, M. et al.
velocity components along axes x and z, u and w, andtheir variances, 2u′ and 2w′ , are evaluated in theknots of a regular grid of 34 rows and 256 columns.Assuming the phenomenon is stationary as well asergodic, the ensemble averages are evaluated astemporal averages over a time interval equal to theentire recording time of about 15000 frames. Thevelocity variances along the axes x and z can berepresented by a single image that containsinformation on both the axes; this image representsthe two-dimensional turbulent kinetic energy.
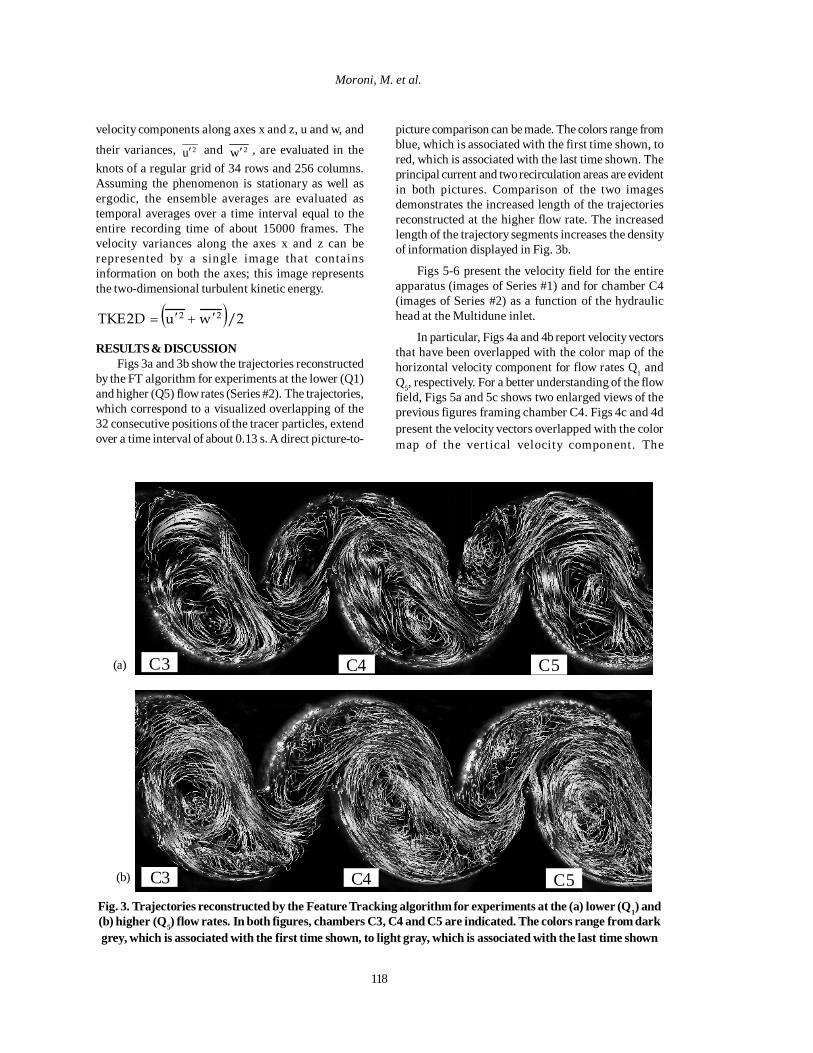
RESULTS & DISCUSSIONFigs 3a and 3b show the trajectories reconstructed
by the FT algorithm for experiments at the lower (Q1)and higher (Q5) flow rates (Series #2). The trajectories,which correspond to a visualized overlapping of the32 consecutive positions of the tracer particles, extendover a time interval of about 0.13 s. A direct picture-to-
( ) 2/wuD2TKE 22 ′+′=
C3 C4 C5
C3 C4 C5
(a)
(b)
Fig. 3. Trajectories reconstructed by the Feature Tracking algorithm for experiments at the (a) lower (Q1) and(b) higher (Q5) flow rates. In both figures, chambers C3, C4 and C5 are indicated. The colors range from darkgrey, which is associated with the first time shown, to light gray, which is associated with the last time shown
picture comparison can be made. The colors range fromblue, which is associated with the first time shown, tored, which is associated with the last time shown. Theprincipal current and two recirculation areas are evidentin both pictures. Comparison of the two imagesdemonstrates the increased length of the trajectoriesreconstructed at the higher flow rate. The increasedlength of the trajectory segments increases the densityof information displayed in Fig. 3b.
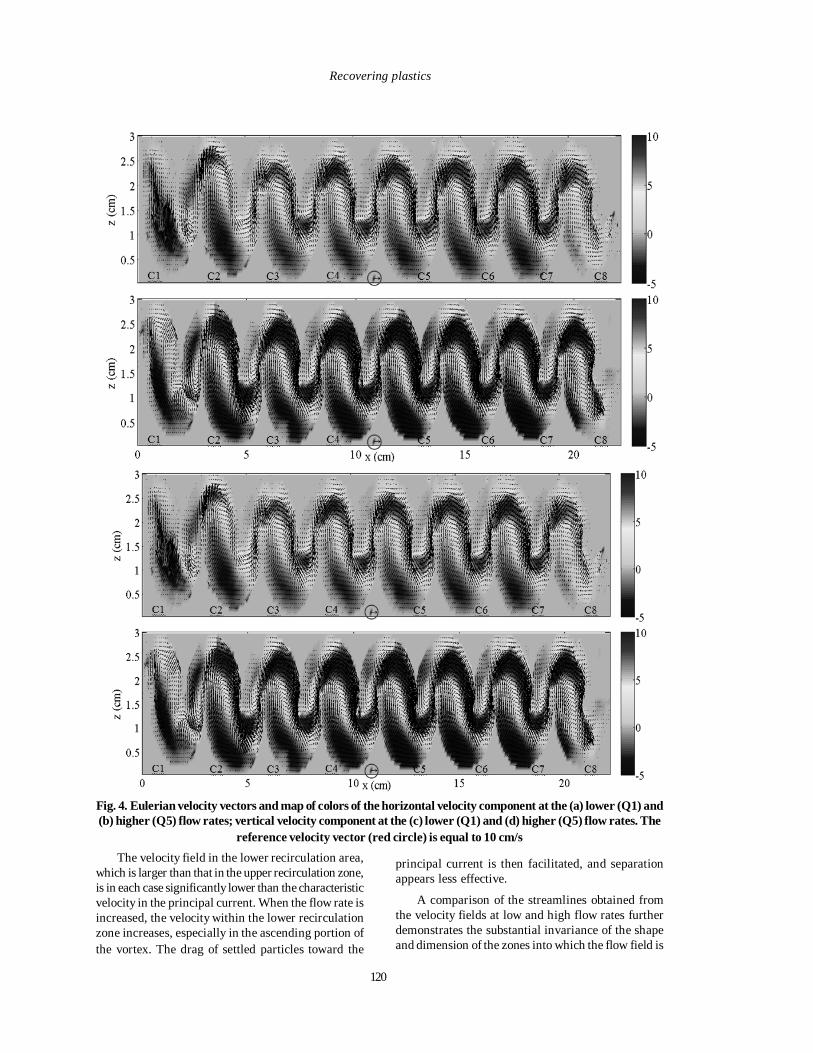
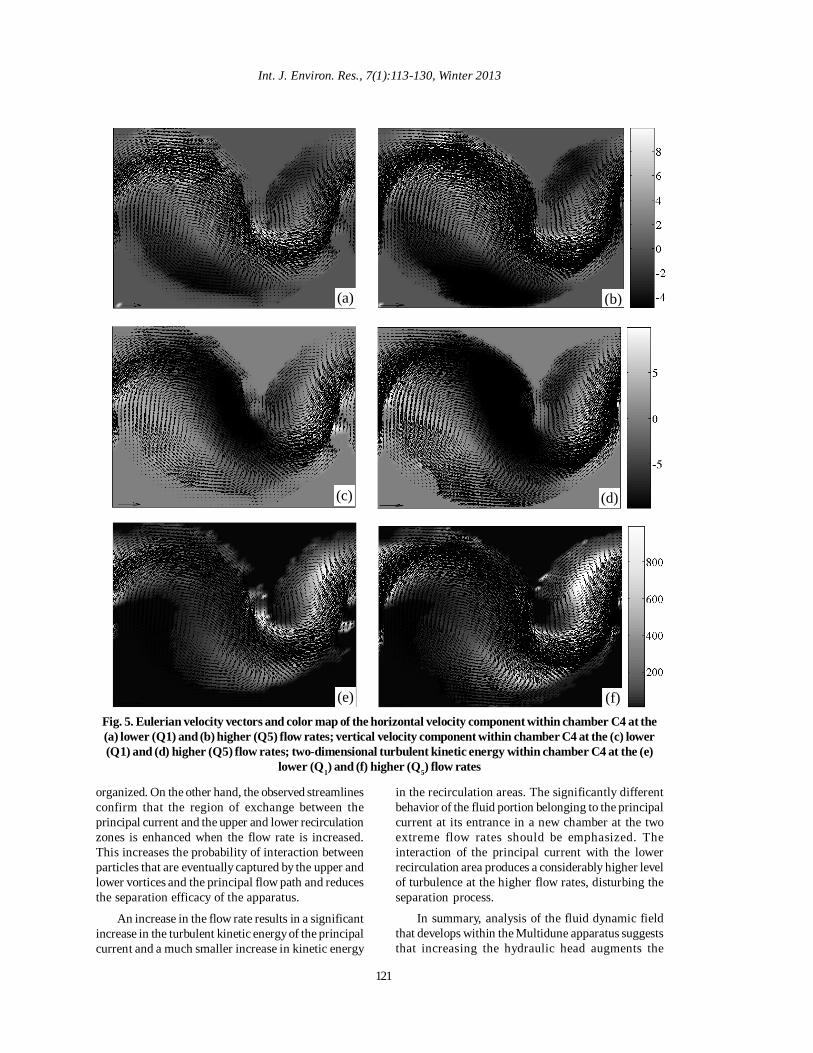
Figs 5-6 present the velocity field for the entireapparatus (images of Series #1) and for chamber C4(images of Series #2) as a function of the hydraulichead at the Multidune inlet.
In particular, Figs 4a and 4b report velocity vectorsthat have been overlapped with the color map of thehorizontal velocity component for flow rates Q1 andQ5, respectively. For a better understanding of the flowfield, Figs 5a and 5c shows two enlarged views of theprevious figures framing chamber C4. Figs 4c and 4dpresent the velocity vectors overlapped with the colormap of the vertical velocity component. The
119
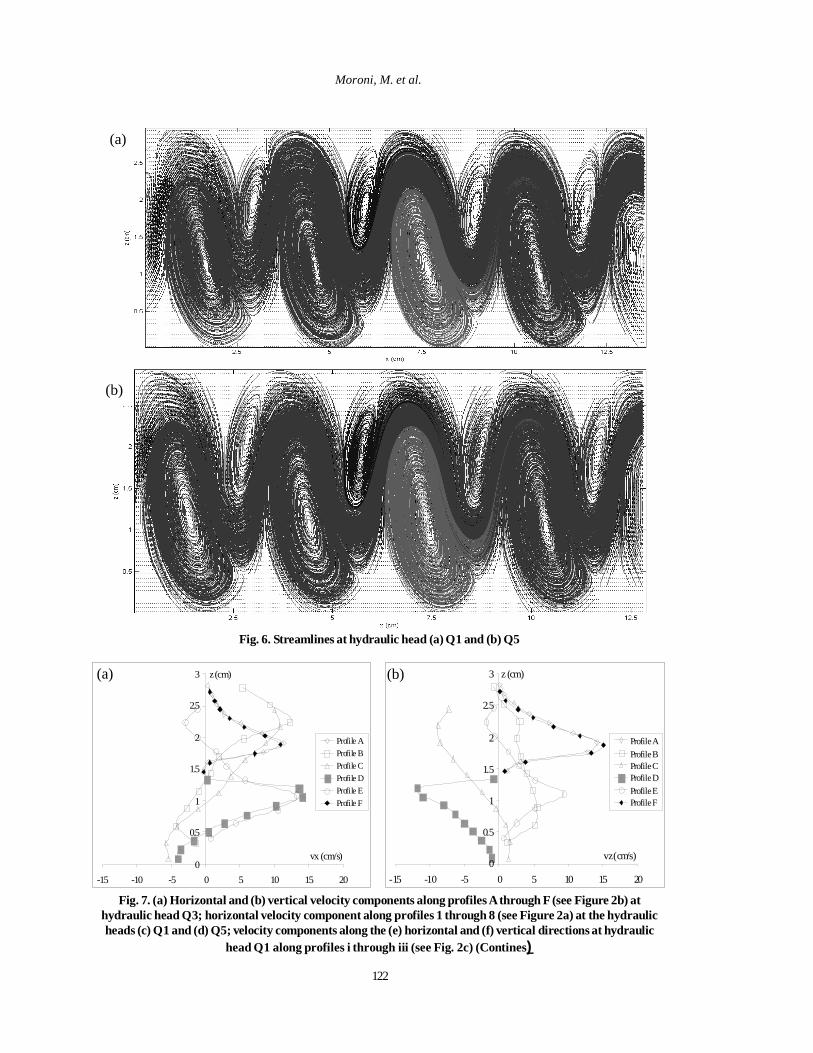
Int. J. Environ. Res., 7(1):113-130, Winter 2013
corresponding enlarged views are shown in Figs 5band 5d. Figs 5e and 5f shows the turbulent kineticenergy for chamber C4 at the same flow rates.The velocity fields in C4 (Fig. 5) present a betterdefinition due to the higher spatial resolution of theacquired images (these images were obtained at thesame camera resolution using a smaller acquisitionwindow). The streamlines for the lower and higher flowrates show the characteristic behavior of the fluidflowing through the separator (Fig. 6).The analysis of the velocity fields and the streamlinessuggests that the fluid dynamic behavior of theMultidune apparatus is characterized by the followingthree predominant areas: -the principal transport flow, where the fluid ischaracterized by a positive value of the velocitycomponent along the x axis in the entire longitudinalsection. The principal transport flow is responsible forthe transport of particles from one chamber to the next;it eventually drives material to the outlet nozzleswithout separation. It is indicated by red streamlines inFig. 6. -the lower recirculation zone, visible below theprincipal current in each of the height chambers. Itsclockwise rotating motion is suitable for capturingparticles from the principal current. It is expected thatplastic particles captured in this way will behave inone of the following ways: osettle within the chamber if sufficiently heavy; ofollow the upward portion of the rotating motionwithout again reaching the principal current, due tothe fact that they are too heavy to perform a completerotation; oexecute a complete rotation and be recapturedby the principal transport flow to settle in the nextchamber or be expelled.The particle behavior within the recirculation zone isinfluenced by its density and dimension as well as bythe presence of a vortex. This behavior is indicatedwith green streamlines in Fig. 6. -the upper recirculation zone, visible above theprincipal transport current. The purpose of the upperrecirculation zone is to subtract particles from theprincipal current and to transfer them to the precedingchamber. To undergo such transfer, particles must moveacross the principal current and settle in the lowerrecirculation area of the previous chamber. The particlephysical attributes and the characteristic velocity ofthe principal current will influence the efficacy of thisprocess. This process is indicated by blue streamlinesin Fig. 6.
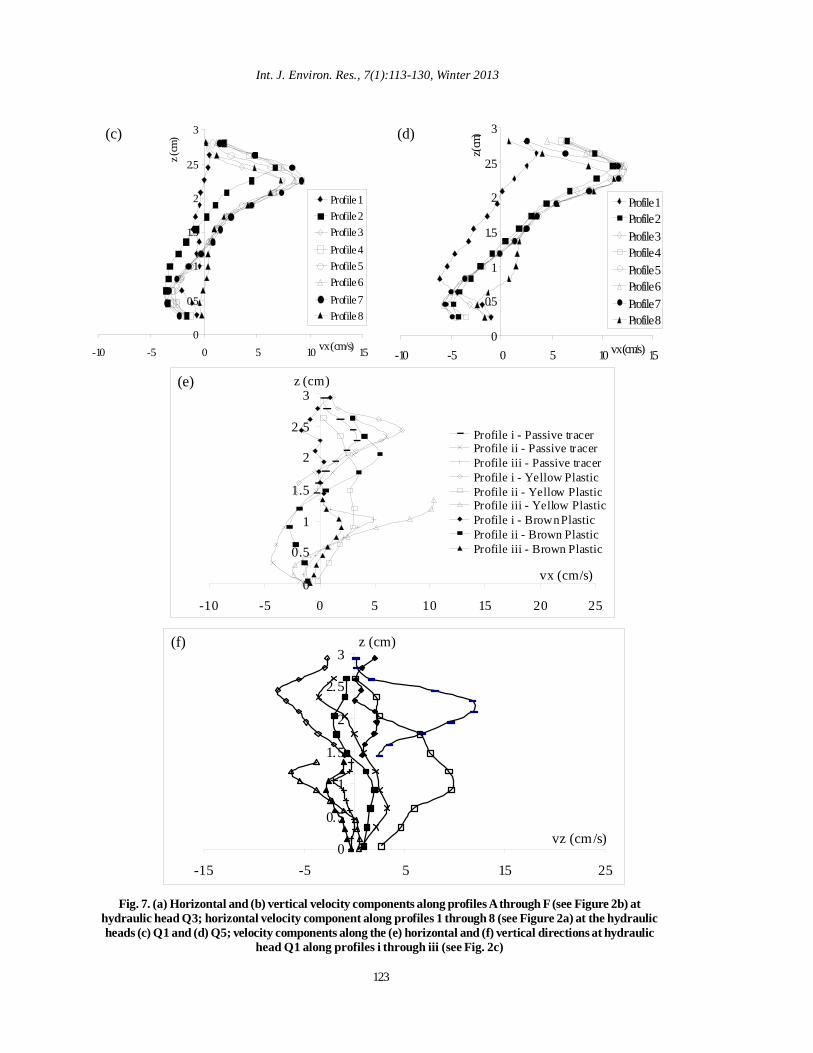
Figs 7a and 7b show the horizontal and verticalvelocity components along profiles A to F when Q3 isthe flow rate within the Multidune apparatus. Profile A
describes the velocity field that is established incorrespondence with the lower cusp at the entranceto C4. The velocity components are both positive, andthe vertical component is slightly larger than thehorizontal one. This is due to the upward movementof the main transport current entering chamber C4. Itcan be seen that the velocity behavior along profile Fsubstantially collapses with that along Profile A. ProfileB accounts for the main transport current velocitydistribution (upper part of the curve) and for the lowerrecirculation area (central and lower parts of the curve).In Profile B, the horizontal velocity component changessign while the vertical component remains positive.The same comments hold for Profile C except for thealtered sign of the vertical velocity component due tothe downward direction of the principal transportcurrent. Profile D corresponds to the upper cusp withinC4. Here, the main transport current direction isdownward, and the velocity field magnitude iscomparable to that in other sections of C4. Profile Eintersects the upper recirculation area, which justifiesthe change of sign of both velocity components.
Observation of the velocity field within theMultidune apparatus (Fig. 4) suggests that the lowerrecirculation area is not completely developed inchambers C1 and C8. This is especially true in C1,where the fluid enters the apparatus; in this region,the current is less well organized than in the regionahead. It can be seen that, in terms of dimensions andvelocity values, chambers C3, C4, C5 and C6 presentanalogous recirculation areas at each referencehydraulic head. This is further confirmed by thehorizontal velocity component profiles presented inFigs 7c and 7d. At both the lower and higher flowrates, the profiles in C3, C4, C5 and C6 nearly collapse.The profiles that deviate the most are those in C1 andC8.
The fluid vein characterizing the principal currentpresents an inner part with velocity and kinetic energyincreasing with the hydraulic head. Nevertheless, thecharacteristic dimension of the principal currentremains practically constant for all the flow ratesemployed. At each flow rate, the upper recirculationzone presents values of the velocity field, i.e., thevorticity field, that are significantly lower than thecharacteristic velocity in the principal current. For thisreason, this zone is ineffective in capturing particlesfrom the mail transport path and thus is ineffective inthe separation process. It is expected that upon furtherreducing the flow rate or modifying the inner geometryof the apparatus the upper recirculation zone will playa role in the separation process. The results obtainedby modifying the geometry of the apparatus arepresented in La Marca et al. (2011).
120
Recovering plastics
Fig. 4. Eulerian velocity vectors and map of colors of the horizontal velocity component at the (a) lower (Q1) and(b) higher (Q5) flow rates; vertical velocity component at the (c) lower (Q1) and (d) higher (Q5) flow rates. The
reference velocity vector (red circle) is equal to 10 cm/sThe velocity field in the lower recirculation area,
which is larger than that in the upper recirculation zone,is in each case significantly lower than the characteristicvelocity in the principal current. When the flow rate isincreased, the velocity within the lower recirculationzone increases, especially in the ascending portion ofthe vortex. The drag of settled particles toward the
principal current is then facilitated, and separationappears less effective.
A comparison of the streamlines obtained fromthe velocity fields at low and high flow rates furtherdemonstrates the substantial invariance of the shapeand dimension of the zones into which the flow field is
121
Int. J. Environ. Res., 7(1):113-130, Winter 2013
(a) (b)
(c) (d)
(e) (f) Fig. 5. Eulerian velocity vectors and color map of the horizontal velocity component within chamber C4 at the(a) lower (Q1) and (b) higher (Q5) flow rates; vertical velocity component within chamber C4 at the (c) lower(Q1) and (d) higher (Q5) flow rates; two-dimensional turbulent kinetic energy within chamber C4 at the (e)
lower (Q1) and (f) higher (Q5) flow rates
organized. On the other hand, the observed streamlinesconfirm that the region of exchange between theprincipal current and the upper and lower recirculationzones is enhanced when the flow rate is increased.This increases the probability of interaction betweenparticles that are eventually captured by the upper andlower vortices and the principal flow path and reducesthe separation efficacy of the apparatus.
An increase in the flow rate results in a significantincrease in the turbulent kinetic energy of the principalcurrent and a much smaller increase in kinetic energy
in the recirculation areas. The significantly differentbehavior of the fluid portion belonging to the principalcurrent at its entrance in a new chamber at the twoextreme flow rates should be emphasized. Theinteraction of the principal current with the lowerrecirculation area produces a considerably higher levelof turbulence at the higher flow rates, disturbing theseparation process.
In summary, analysis of the fluid dynamic fieldthat develops within the Multidune apparatus suggeststhat increasing the hydraulic head augments the
122
Moroni, M. et al.
(a)
(b)
Fig. 6. Streamlines at hydraulic head (a) Q1 and (b) Q5
0
0.5
1
1.5
2
2.5
3
-15 -10 -5 0 5 10 15 20
vx (cm/s)
z (cm)
Profile AProfile BProfile CProfile DProfile EProfile F
0
0.5
1
1.5
2
2.5
3
-15 -10 -5 0 5 10 15 20
vz (cm/s)
z (cm)
Profile AProfile BProfile CProfile DProfile EProfile F
Fig. 7. (a) Horizontal and (b) vertical velocity components along profiles A through F (see Figure 2b) athydraulic head Q3; horizontal velocity component along profiles 1 through 8 (see Figure 2a) at the hydraulicheads (c) Q1 and (d) Q5; velocity components along the (e) horizontal and (f) vertical directions at hydraulic
head Q1 along profiles i through iii (see Fig. 2c) (Contines)
(a) (b)
123
Int. J. Environ. Res., 7(1):113-130, Winter 2013
0
0.5
1
1.5
2
2.5
3
-10 -5 0 5 10 15vx (cm/s)
z (cm
)
Profile 1Profile 2Profile 3Profile 4Profile 5Profile 6Profile 7Profile 8
0
0.5
1
1.5
2
2.5
3
-10 -5 0 5 10 15vx (cm/s)
z (cm
)
Profile 1Profile 2Profile 3Profile 4Profile 5Profile 6Profile 7Profile 8
0
0.5
1
1.5
2
2.5
3
-10 -5 0 5 10 15 20 25
vx (cm/s)
z (cm)
Profile i - Passive tracerProfile ii - Passive tracerProfile iii - Passive tracerProfile i - Yellow PlasticProfile ii - Yellow PlasticProfile iii - Yellow PlasticProfile i - Brown PlasticProfile ii - Brown PlasticProfile iii - Brown Plastic
0
0.5
1
1.5
2
2.5
3
-15 -5 5 15 25
vz (cm/s)
z (cm)
Fig. 7. (a) Horizontal and (b) vertical velocity components along profiles A through F (see Figure 2b) athydraulic head Q3; horizontal velocity component along profiles 1 through 8 (see Figure 2a) at the hydraulicheads (c) Q1 and (d) Q5; velocity components along the (e) horizontal and (f) vertical directions at hydraulic
head Q1 along profiles i through iii (see Fig. 2c)
(c) (d)
(e)
(f)
124
transport effectiveness of the main current withoutimproving the capture feasibility of the upper and lowerrecirculation zones. Thus, when the hydraulic headand the transiting flow rate are both increased, theapparatus will lose its effectiveness in separatingplastic particles. The eight-chamber design assuresplastic particle separation even when C3 is filled withsettled material; in that case, the remaining chambersbecome effective in the separation process.
Feature Tracking was applied to images of Series#3 so that results could be compared with thoseobtained with the passive tracer. The active tracerconsisted of PS and PVC particles of dimensions 0.85-1.00 mm and density 1.043 g/cm3 and 1.353 g/cm3,respectively. One reason for the choice of these tworesins is the significant difference in their densities. Inaddition, separation tests using mono-material samples(La Marca et al., 2011) have demonstrated that the
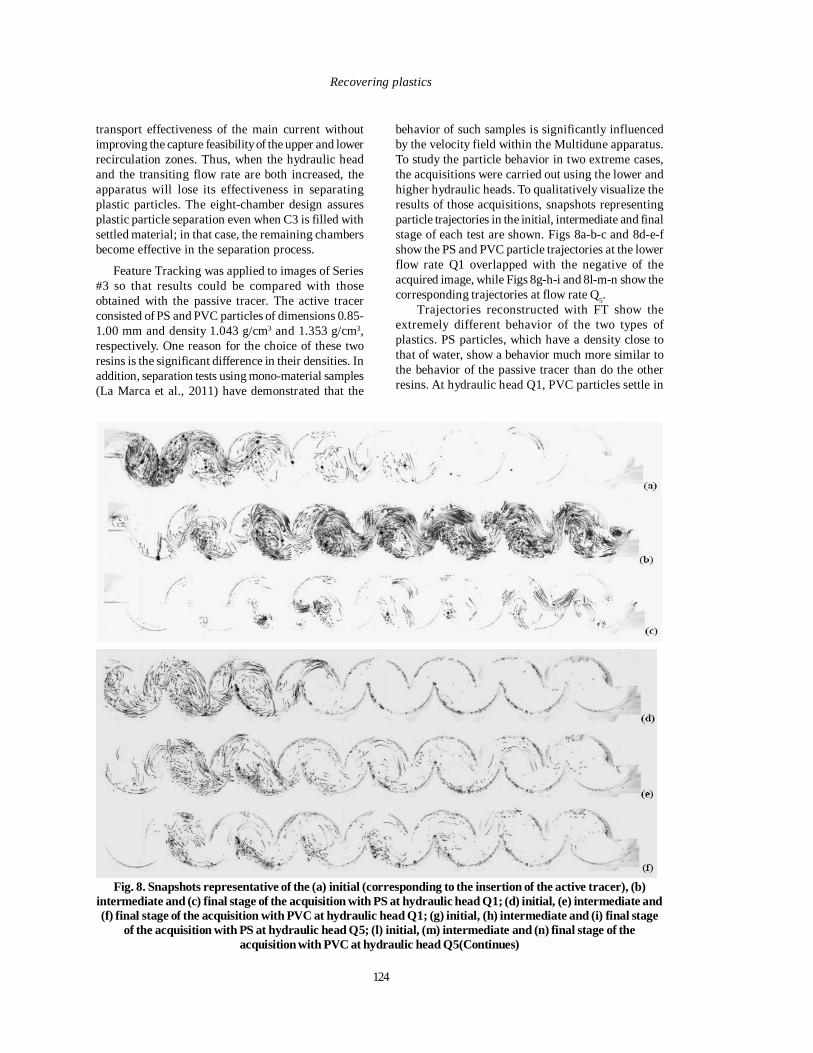
behavior of such samples is significantly influencedby the velocity field within the Multidune apparatus.To study the particle behavior in two extreme cases,the acquisitions were carried out using the lower andhigher hydraulic heads. To qualitatively visualize theresults of those acquisitions, snapshots representingparticle trajectories in the initial, intermediate and finalstage of each test are shown. Figs 8a-b-c and 8d-e-fshow the PS and PVC particle trajectories at the lowerflow rate Q1 overlapped with the negative of theacquired image, while Figs 8g-h-i and 8l-m-n show thecorresponding trajectories at flow rate Q5.
Trajectories reconstructed with FT show theextremely different behavior of the two types ofplastics. PS particles, which have a density close tothat of water, show a behavior much more similar tothe behavior of the passive tracer than do the otherresins. At hydraulic head Q1, PVC particles settle in
Fig. 8. Snapshots representative of the (a) initial (corresponding to the insertion of the active tracer), (b)intermediate and (c) final stage of the acquisition with PS at hydraulic head Q1; (d) initial, (e) intermediate and(f) final stage of the acquisition with PVC at hydraulic head Q1; (g) initial, (h) intermediate and (i) final stage
of the acquisition with PS at hydraulic head Q5; (l) initial, (m) intermediate and (n) final stage of theacquisition with PVC at hydraulic head Q5(Continues)
Recovering plastics
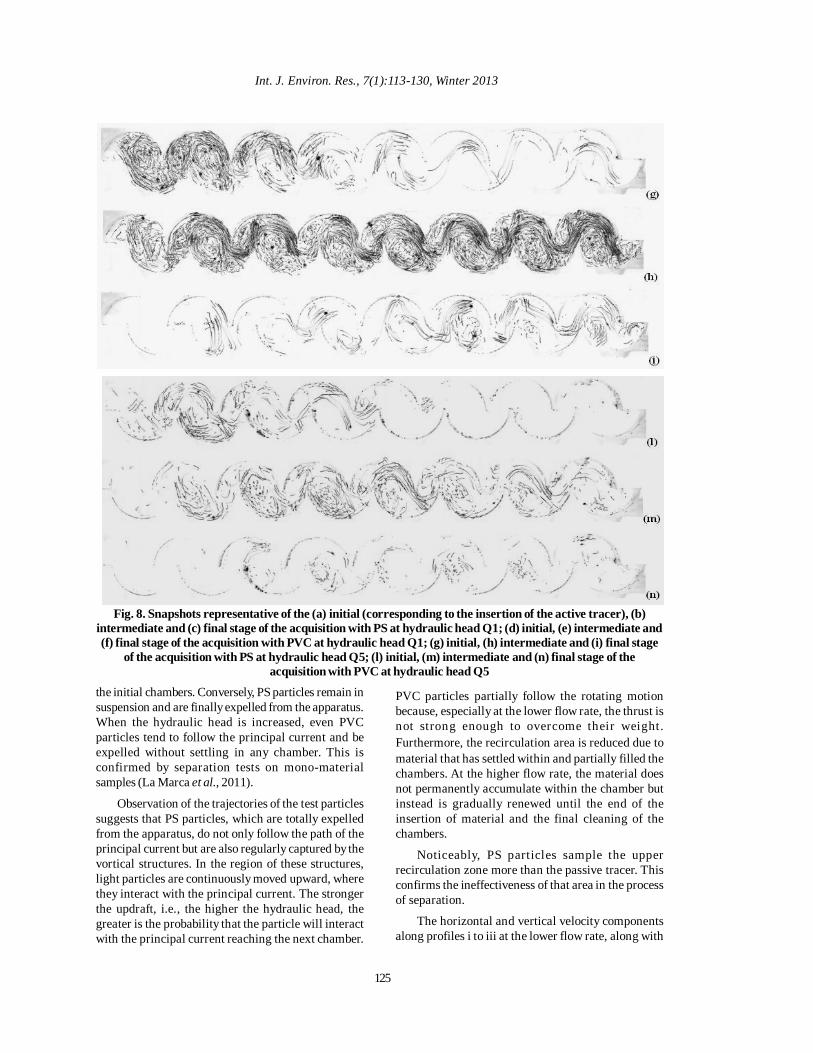
Fig. 8. Snapshots representative of the (a) initial (corresponding to the insertion of the active tracer), (b)intermediate and (c) final stage of the acquisition with PS at hydraulic head Q1; (d) initial, (e) intermediate and(f) final stage of the acquisition with PVC at hydraulic head Q1; (g) initial, (h) intermediate and (i) final stage
of the acquisition with PS at hydraulic head Q5; (l) initial, (m) intermediate and (n) final stage of theacquisition with PVC at hydraulic head Q5
the initial chambers. Conversely, PS particles remain insuspension and are finally expelled from the apparatus.When the hydraulic head is increased, even PVCparticles tend to follow the principal current and beexpelled without settling in any chamber. This isconfirmed by separation tests on mono-materialsamples (La Marca et al., 2011).
Observation of the trajectories of the test particlessuggests that PS particles, which are totally expelledfrom the apparatus, do not only follow the path of theprincipal current but are also regularly captured by thevortical structures. In the region of these structures,light particles are continuously moved upward, wherethey interact with the principal current. The strongerthe updraft, i.e., the higher the hydraulic head, thegreater is the probability that the particle will interactwith the principal current reaching the next chamber.
PVC particles partially follow the rotating motionbecause, especially at the lower flow rate, the thrust isnot strong enough to overcome their weight.Furthermore, the recirculation area is reduced due tomaterial that has settled within and partially filled thechambers. At the higher flow rate, the material doesnot permanently accumulate within the chamber butinstead is gradually renewed until the end of theinsertion of material and the final cleaning of thechambers.
Noticeably, PS particles sample the upperrecirculation zone more than the passive tracer. Thisconfirms the ineffectiveness of that area in the processof separation.
The horizontal and vertical velocity componentsalong profiles i to iii at the lower flow rate, along with
Int. J. Environ. Res., 7(1):113-130, Winter 2013
125
the behavior of both the passive tracer and the plasticparticles, are depicted in Figs 7e and 7f. At both Q1and Q5, PS particles are totally expelled from theapparatus; in contrast, PVC particles separate only atthe lower flow rate. For this reason, we further examinedthe fluid dynamic behavior of the particles at the lowerflow rate. Along profile i, the horizontal velocitycomponent of PVC particles is negative or close tozero, while both the tracer particles and PS plasticparticles present a mainly positive profile describing awell-established principal current. A negative velocityis representative of particles unable to proceeddownstream, i.e., potentially separating. On the otherhand, the vertical velocity component of PVC particlesis slightly positive. PVC particles are characterized bya recirculation motion that is more developed than thatof the fluid. The behavior of the PS particles is moresimilar to that of the fluid except for the vertical velocitycomponent along profile i, where the velocity isnegative. Along this profile, the particles are alreadymoving toward chamber C2, whereas the fluid stillpresents an upward motion before the interaction withthe upper boundary forces it to enter the next chamber.Along Profile ii, PS plastic particles do not sample thelower recirculation area because both velocitycomponents are positive; this is significantly differentfrom the fluid behavior. Here, PVC plastic particlesbehave more similarly to the fluid, showing reducedvelocity and a different geometry of the recirculationarea. In Profile iii, the horizontal and vertical directionsfor both types of plastic particles and the fluid aremore similar, with only slight changes in the magnitudeof their velocities.
Tests on mono-material samples (La Marca et al.,
2011), while providing useful information on theefficacy of an apparatus, must always be associatedwith tests on composite samples. Tests of the lattertype are needed to understand whether the system iscapable of separating different types of plastics in amixture.
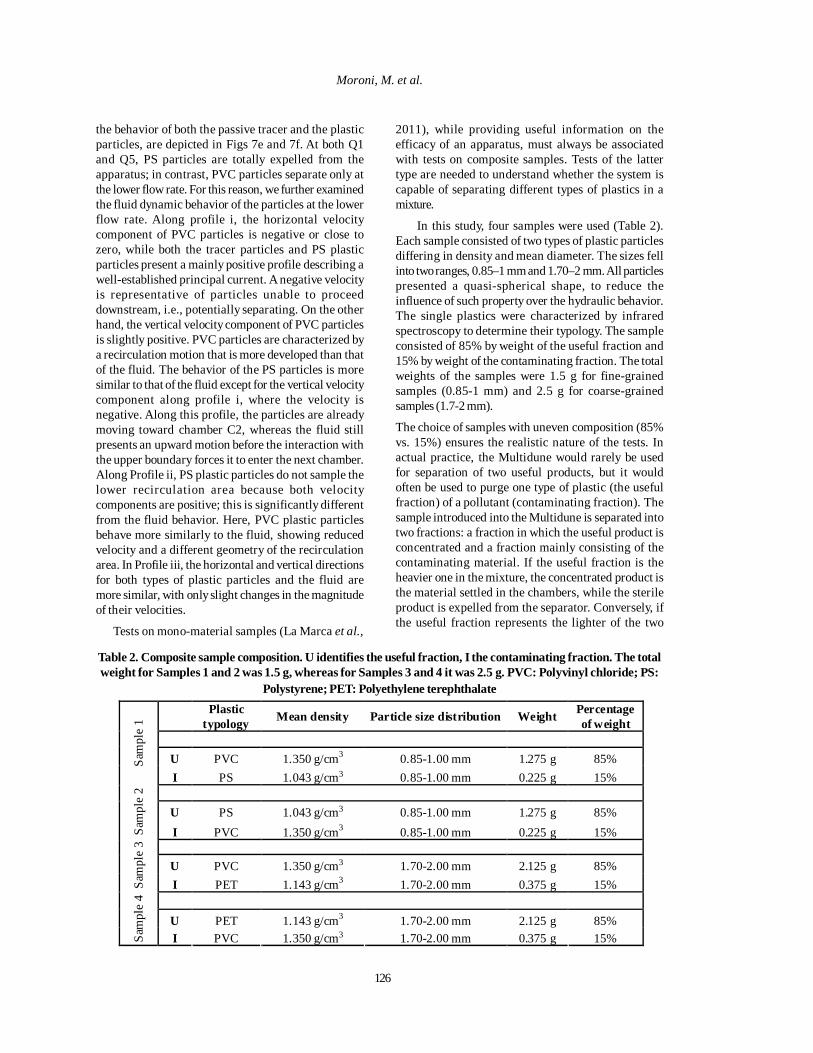
In this study, four samples were used (Table 2).Each sample consisted of two types of plastic particlesdiffering in density and mean diameter. The sizes fellinto two ranges, 0.85–1 mm and 1.70–2 mm. All particlespresented a quasi-spherical shape, to reduce theinfluence of such property over the hydraulic behavior.The single plastics were characterized by infraredspectroscopy to determine their typology. The sampleconsisted of 85% by weight of the useful fraction and15% by weight of the contaminating fraction. The totalweights of the samples were 1.5 g for fine-grainedsamples (0.85-1 mm) and 2.5 g for coarse-grainedsamples (1.7-2 mm).
The choice of samples with uneven composition (85%vs. 15%) ensures the realistic nature of the tests. Inactual practice, the Multidune would rarely be usedfor separation of two useful products, but it wouldoften be used to purge one type of plastic (the usefulfraction) of a pollutant (contaminating fraction). Thesample introduced into the Multidune is separated intotwo fractions: a fraction in which the useful product isconcentrated and a fraction mainly consisting of thecontaminating material. If the useful fraction is theheavier one in the mixture, the concentrated product isthe material settled in the chambers, while the sterileproduct is expelled from the separator. Conversely, ifthe useful fraction represents the lighter of the two
Plastic
typology Mean density Particle size distribution Weight Percentage of weight
U PVC 1.350 g/cm3 0.85-1.00 mm 1.275 g 85% Sa
mpl
e 1
I PS 1.043 g/cm3 0.85-1.00 mm 0.225 g 15%
U PS 1.043 g/cm3 0.85-1.00 mm 1.275 g 85%
Sam
ple
2
I PVC 1.350 g/cm3 0.85-1.00 mm 0.225 g 15%
U PVC 1.350 g/cm3 1.70-2.00 mm 2.125 g 85%
Sam
ple
3
I PET 1.143 g/cm3 1.70-2.00 mm 0.375 g 15%
U PET 1.143 g/cm3 1.70-2.00 mm 2.125 g 85%
Sam
ple
4
I PVC 1.350 g/cm3 1.70-2.00 mm 0.375 g 15%
Table 2. Composite sample composition. U identifies the useful fraction, I the contaminating fraction. The totalweight for Samples 1 and 2 was 1.5 g, whereas for Samples 3 and 4 it was 2.5 g. PVC: Polyvinyl chloride; PS:
Polystyrene; PET: Polyethylene terephthalate
Moroni, M. et al.
126
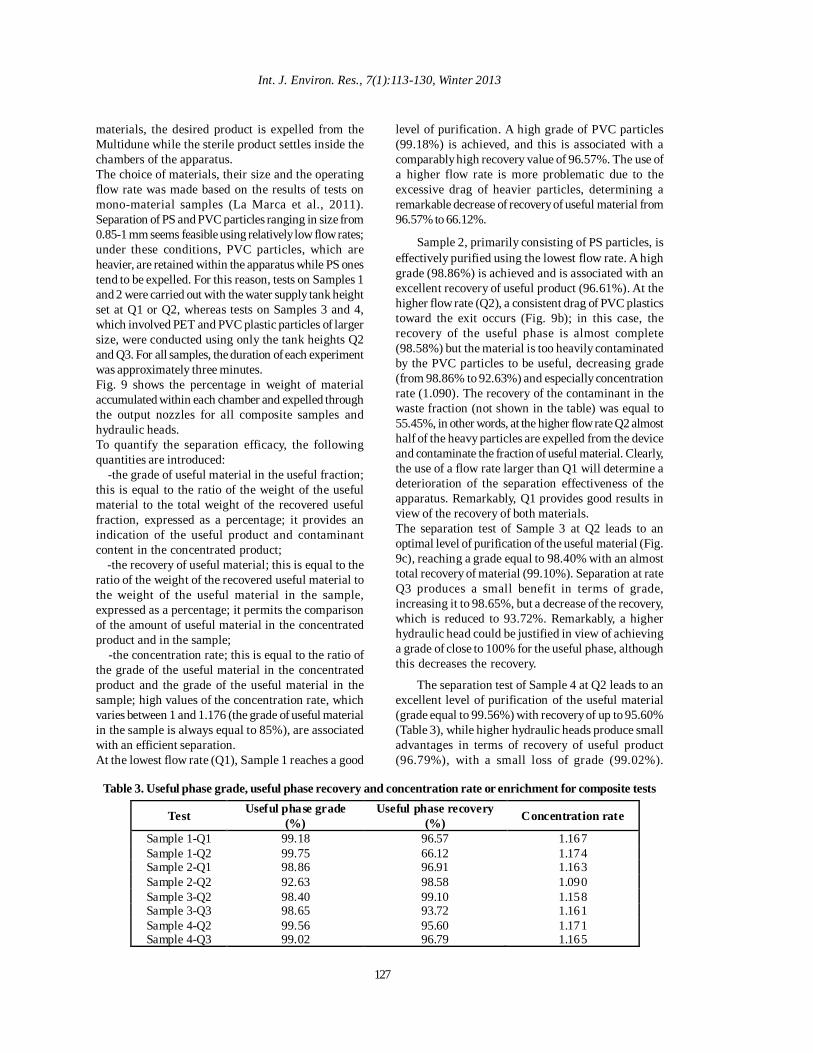
materials, the desired product is expelled from theMultidune while the sterile product settles inside thechambers of the apparatus.The choice of materials, their size and the operatingflow rate was made based on the results of tests onmono-material samples (La Marca et al., 2011).Separation of PS and PVC particles ranging in size from0.85-1 mm seems feasible using relatively low flow rates;under these conditions, PVC particles, which areheavier, are retained within the apparatus while PS onestend to be expelled. For this reason, tests on Samples 1and 2 were carried out with the water supply tank heightset at Q1 or Q2, whereas tests on Samples 3 and 4,which involved PET and PVC plastic particles of largersize, were conducted using only the tank heights Q2and Q3. For all samples, the duration of each experimentwas approximately three minutes.Fig. 9 shows the percentage in weight of materialaccumulated within each chamber and expelled throughthe output nozzles for all composite samples andhydraulic heads.To quantify the separation efficacy, the followingquantities are introduced: -the grade of useful material in the useful fraction;this is equal to the ratio of the weight of the usefulmaterial to the total weight of the recovered usefulfraction, expressed as a percentage; it provides anindication of the useful product and contaminantcontent in the concentrated product; -the recovery of useful material; this is equal to theratio of the weight of the recovered useful material tothe weight of the useful material in the sample,expressed as a percentage; it permits the comparisonof the amount of useful material in the concentratedproduct and in the sample; -the concentration rate; this is equal to the ratio ofthe grade of the useful material in the concentratedproduct and the grade of the useful material in thesample; high values of the concentration rate, whichvaries between 1 and 1.176 (the grade of useful materialin the sample is always equal to 85%), are associatedwith an efficient separation.At the lowest flow rate (Q1), Sample 1 reaches a good
level of purification. A high grade of PVC particles(99.18%) is achieved, and this is associated with acomparably high recovery value of 96.57%. The use ofa higher flow rate is more problematic due to theexcessive drag of heavier particles, determining aremarkable decrease of recovery of useful material from96.57% to 66.12%.
Sample 2, primarily consisting of PS particles, iseffectively purified using the lowest flow rate. A highgrade (98.86%) is achieved and is associated with anexcellent recovery of useful product (96.61%). At thehigher flow rate (Q2), a consistent drag of PVC plasticstoward the exit occurs (Fig. 9b); in this case, therecovery of the useful phase is almost complete(98.58%) but the material is too heavily contaminatedby the PVC particles to be useful, decreasing grade(from 98.86% to 92.63%) and especially concentrationrate (1.090). The recovery of the contaminant in thewaste fraction (not shown in the table) was equal to55.45%, in other words, at the higher flow rate Q2 almosthalf of the heavy particles are expelled from the deviceand contaminate the fraction of useful material. Clearly,the use of a flow rate larger than Q1 will determine adeterioration of the separation effectiveness of theapparatus. Remarkably, Q1 provides good results inview of the recovery of both materials.The separation test of Sample 3 at Q2 leads to anoptimal level of purification of the useful material (Fig.9c), reaching a grade equal to 98.40% with an almosttotal recovery of material (99.10%). Separation at rateQ3 produces a small benefit in terms of grade,increasing it to 98.65%, but a decrease of the recovery,which is reduced to 93.72%. Remarkably, a higherhydraulic head could be justified in view of achievinga grade of close to 100% for the useful phase, althoughthis decreases the recovery.
The separation test of Sample 4 at Q2 leads to anexcellent level of purification of the useful material(grade equal to 99.56%) with recovery of up to 95.60%(Table 3), while higher hydraulic heads produce smalladvantages in terms of recovery of useful product(96.79%), with a small loss of grade (99.02%).
Table 3. Useful phase grade, useful phase recovery and concentration rate or enrichment for composite tests
Test Useful phase grade (%)
Useful phase recovery (%) Concentration rate
Sample 1-Q1 99.18 96.57 1.167 Sample 1-Q2 99.75 66.12 1.174 Sample 2-Q1 98.86 96.91 1.163 Sample 2-Q2 92.63 98.58 1.090 Sample 3-Q2 98.40 99.10 1.158 Sample 3-Q3 98.65 93.72 1.161 Sample 4-Q2 99.56 95.60 1.171 Sample 4-Q3 99.02 96.79 1.165
Int. J. Environ. Res., 7(1):113-130, Winter 2013
127
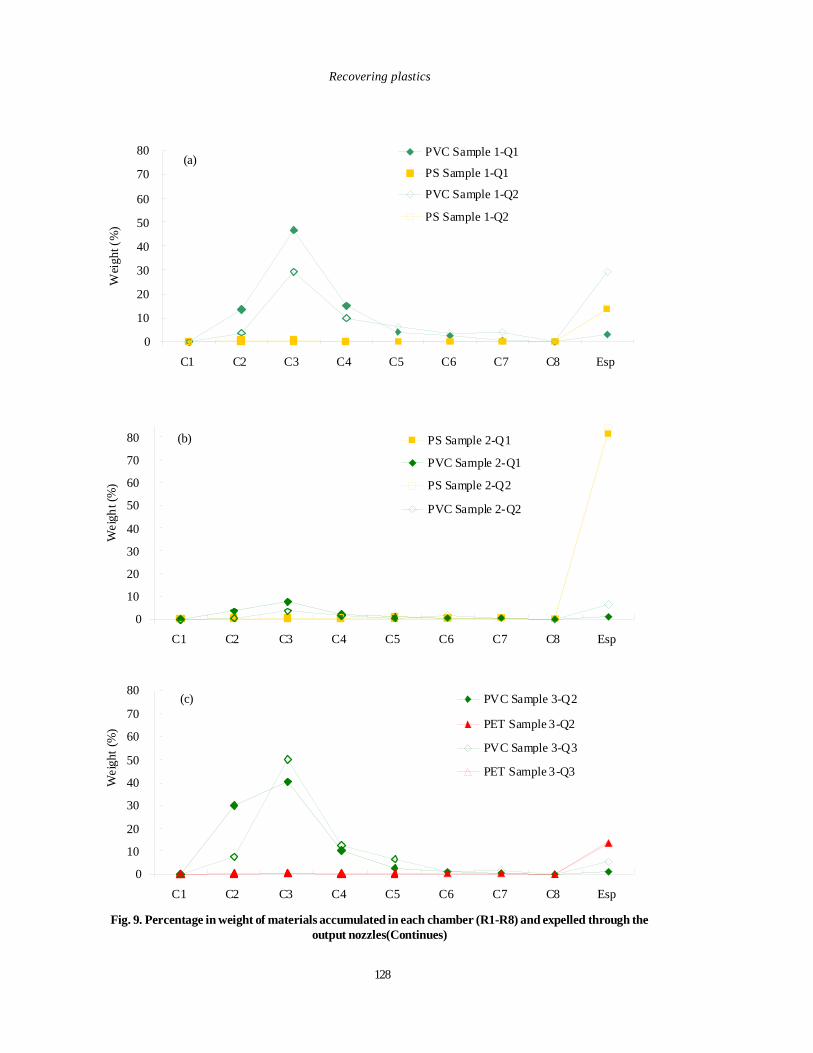
0
10
20
30
40
50
60
70
80
C1 C2 C3 C4 C5 C6 C7 C8 Esp
Wei
ght (
%)
PVC Sample 1-Q1
PS Sample 1-Q1
PVC Sample 1-Q2
PS Sample 1-Q2
0
10
20
30
40
50
60
70
80
C1 C2 C3 C4 C5 C6 C7 C8 Esp
Wei
ght (
%)
PS Sample 2-Q1
PVC Sample 2-Q1
PS Sample 2-Q2
PVC Sample 2-Q2
0
10
20
30
40
50
60
70
80
C1 C2 C3 C4 C5 C6 C7 C8 Esp
Wei
ght (
%)
PVC Sample 3-Q2
PET Sample 3-Q2
PVC Sample 3-Q3
PET Sample 3-Q3
Fig. 9. Percentage in weight of materials accumulated in each chamber (R1-R8) and expelled through theoutput nozzles(Continues)
(a)
(b)
(c)
Recovering plastics
128
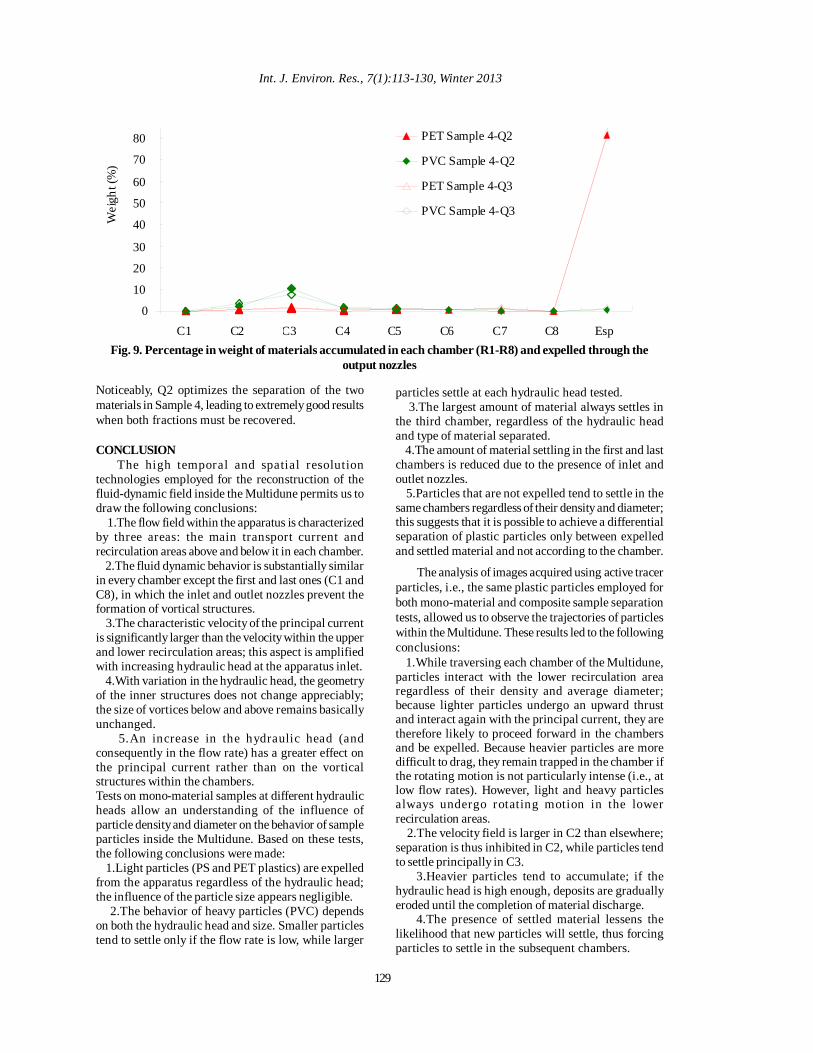
Noticeably, Q2 optimizes the separation of the twomaterials in Sample 4, leading to extremely good resultswhen both fractions must be recovered.
CONCLUSIONThe high temporal and spatial resolution
technologies employed for the reconstruction of thefluid-dynamic field inside the Multidune permits us todraw the following conclusions: 1.The flow field within the apparatus is characterizedby three areas: the main transport current andrecirculation areas above and below it in each chamber. 2.The fluid dynamic behavior is substantially similarin every chamber except the first and last ones (C1 andC8), in which the inlet and outlet nozzles prevent theformation of vortical structures. 3.The characteristic velocity of the principal currentis significantly larger than the velocity within the upperand lower recirculation areas; this aspect is amplifiedwith increasing hydraulic head at the apparatus inlet. 4.With variation in the hydraulic head, the geometryof the inner structures does not change appreciably;the size of vortices below and above remains basicallyunchanged. 5.An increase in the hydraulic head (andconsequently in the flow rate) has a greater effect onthe principal current rather than on the vorticalstructures within the chambers.Tests on mono-material samples at different hydraulicheads allow an understanding of the influence ofparticle density and diameter on the behavior of sampleparticles inside the Multidune. Based on these tests,the following conclusions were made: 1.Light particles (PS and PET plastics) are expelledfrom the apparatus regardless of the hydraulic head;the influence of the particle size appears negligible. 2.The behavior of heavy particles (PVC) dependson both the hydraulic head and size. Smaller particlestend to settle only if the flow rate is low, while larger
0
10
20
30
40
50
60
70
80
C1 C2 C3 C4 C5 C6 C7 C8 Esp
Wei
ght (
%)
PET Sample 4-Q2
PVC Sample 4-Q2
PET Sample 4-Q3
PVC Sample 4-Q3
Fig. 9. Percentage in weight of materials accumulated in each chamber (R1-R8) and expelled through theoutput nozzles
particles settle at each hydraulic head tested. 3.The largest amount of material always settles inthe third chamber, regardless of the hydraulic headand type of material separated. 4.The amount of material settling in the first and lastchambers is reduced due to the presence of inlet andoutlet nozzles. 5.Particles that are not expelled tend to settle in thesame chambers regardless of their density and diameter;this suggests that it is possible to achieve a differentialseparation of plastic particles only between expelledand settled material and not according to the chamber.
The analysis of images acquired using active tracerparticles, i.e., the same plastic particles employed forboth mono-material and composite sample separationtests, allowed us to observe the trajectories of particleswithin the Multidune. These results led to the followingconclusions: 1.While traversing each chamber of the Multidune,particles interact with the lower recirculation arearegardless of their density and average diameter;because lighter particles undergo an upward thrustand interact again with the principal current, they aretherefore likely to proceed forward in the chambersand be expelled. Because heavier particles are moredifficult to drag, they remain trapped in the chamber ifthe rotating motion is not particularly intense (i.e., atlow flow rates). However, light and heavy particlesalways undergo rotating motion in the lowerrecirculation areas. 2.The velocity field is larger in C2 than elsewhere;separation is thus inhibited in C2, while particles tendto settle principally in C3. 3.Heavier particles tend to accumulate; if thehydraulic head is high enough, deposits are graduallyeroded until the completion of material discharge. 4.The presence of settled material lessens thelikelihood that new particles will settle, thus forcingparticles to settle in the subsequent chambers.
Int. J. Environ. Res., 7(1):113-130, Winter 2013
129
Decontamination tests of composite samples confirmedthe results of tests on mono-material samples. Plasticparticles of different densities can be effectivelyseparated if the flow rate is set to the appropriate value.Notably, reciprocal competition between particles ofdifferent specific mass is negligible, i.e., resultsobtained with composite samples are analogous toresults obtained with mono-material samples.
REFERENCESAdrian, R. J. (1991). Particle imaging techniques forexperimental fluid mechanics. Annual Review of FluidMechanics, 23, 261–304.
Ahmad, S. R. (2004). A new technology for automaticidentification and sorting of plastics for recycling.Environmental Technology, 25 (10), 143–149.
Buchan, R. and Yarar, B. (1995). Recovering plastics forrecycling by mineral processing techniques. The Journal ofthe Minerals, Metals & Materials Society, 47, 52–55.
De Sena, G., Nardi, C., Cenedese, A., La Marca, F., Massacci,P. and Moroni, M. (2008). The Hydraulic SeparatorMultidune: Preliminary Tests On Fluid-Dynamic FeaturesAnd Plastic Separation Feasibility. Waste Management, 28(9), 1560-1571.
Dinger, P. (1992). Automatic sorting for mixed plastics.BioCycle, 33 (3), 80–2.
Gent, M. R., Menendez, M., Toraño, J. and Diego, I. (2009).Recycling of plastic waste by density separation: prospects foroptimization. Waste Management and Research, 27, 175-187.
Hearn, G. L. and Ballard, J. R. (2005). The use of electrostatictechniques for the identification and sorting of wastepackaging materials. Resources, Conservation and Recycling,44, 91–98.
Horn, B. K. P. and Schunk, B. G. (1981). Determining opticalflow. Artif. Intell., 17, 185-203.
Jody, B. J. and Daniels, E. J. (2010). End-of-life VehicleRecycling: The State of the Art of resource Recovery fromShredder Residue. ANL/ESD/07-8, 130 p. National TechnicalInformation Service, US Department of Commerce,Springfield, VA 22161, USA. http://www.es.anl.gov/Energy_systems/publications/fact
Kinoshita, T., Okamoto, K., Yamaguchi, K. and Akita, S.(2006). Separation of plastic mixtures using liquid-fluidizedbed technology. Chemosphere, 63, 893–902.
La Porta, A., Voth, G. A., Crawford, A. M., Alexander, J.and Bodenschatz, E. (2001). Fluid particle accelerations infully developed turbulence. Nature, 409, 1017-1019.
Menéndez, M., Gent, M., Toraño, J. and Diego, I. (2007).Optimization of multigravity separation for recovery of ultrafinecoal. Minerals & Metallurgical Processing, 24, 253–263.
Moroni, M. and Cenedese, A. (2005). Comparison amongfeature tracking and more consolidated velocimetry imageanalysis techniques in a fully developed turbulent channelflow. Measurement Science and Technology, 16, 2307-2322.
Moroni, M., Cushman, J. H. and Cenedese, A. (2003). A3D-PTV Two-projection Study of Pre-asymptoticDispersion in Porous Media which are Heterogeneous onthe Bench Scale. International Journal of Engineering Science,41 (3-5), 337-370.
Moroni, M., Kleinfelter, N. and Cushman, J. H. (2008).Alternative Measures of Dispersion Applied to Flow in aConvoluted Channel. Advances in Water Resources, 32 (5),737-749.
Niblack, W. (1986). An introduction to digital imageprocessing. (Prentice-Hall International).
Nogueira, J., Lecuona, A. and Rodríguez, P. A. (2001). Localûeld correction PIV, implemented by means of simplealgorithms, and multigrid versions. Measurement Scienceand Technology, 12, 1911–1921.
Plastics International, (2007). Mechanical properties.Plastics International, Material properties, http://w w w . p l a s t i c s i n t l . c o m /sortable_materials.php?display=electrical (accessed 16October 2008).
Plastics Europe, (2007a). An analysis of plastics production,demand and recovery for 2005 in Europe. PlasticsEurope,21 pp.
Plastics Europe, (2007b). Press Release 9 May 2007, 1 p.Association of Plastics Manufacturers in Europe (AISBL),Brussels, Belgium.
Plastics Europe, (2010). Plastics - the Facts 2010, Ananalysis of European plastics production, demand andrecovery for 2009. Association of Plastics Manufacturersin Europe (AISBL), Brussels, Belgium.
Raffel, M., Willert, C., Werely, S. and Kompenhans, J.(2007). Particle Image Velocimetry, A Practical Guide.(Heidelberg: Springer).
Sadat-Shojai, M. and Bakhshandeh, G. R. (2011). Recycling ofPVC wastes. Polymer Degradation and Stability, 96, 404-415.
Shent, H., Pugh, R. J. and Forssberg, E. (1999). A review ofplastics waste recycling and the flotation of plastics. Resour.Conserv. Recy., 25, 85–109.
Shindler, L., Moroni, M. and Cenedese, A. (2010). Spatial–temporal improvements of a two-frame particle-trackingalgorithm. Measurement Science and Technology, 21,115401.
Tilmatine, A., Medles, K., Bendimerad, S. E., Boukholda, F.and Dascalescu, L. (2009). Electrostatic separators ofparticles: Application to plastic/metal, metal/metal andplastic/plastic mixtures. Waste Management, 29, 228–232.
Wei, J. and Realff, M. J. (2005). Design and optimization ofdrum-type electrostatic separators for plastics recycling.Industrial and Engineering Chemistry Research, 44 (10),3503–3509.
Welle, F. (2011). Twenty years of PET bottle to bottlerecycling—An overview. Resources, Conservation andRecycling, 55 (11), 865-875.
Moroni, M. et al.
130