Recorded live births - Statistics South · PDF file · 2013-11-18Recorded live...
41
Statistical release P0305 Recorded live births 2011 Embargoed until: 16 August 2012 14:30 Enquiries: Forthcoming issue: Expected release date User Information Services 2012 August 2013 Tel.: (012) 310 8600
Transcript of Recorded live births - Statistics South · PDF file · 2013-11-18Recorded live...

Statistical release P0305
Recorded live births
2011
Embargoed until: 16 August 2012
14:30 Enquiries: Forthcoming issue: Expected release date
User Information Services 2012 August 2013 Tel.: (012) 310 8600

Statistics South Africa P0305
Recorded live births, 2011
i
Published by Statistics South Africa, Private Bag X44, Pretoria 0001 © Statistics South Africa, 2012 Users may apply or process these data, provided Statistics South Africa (Stats SA) is acknowledged as the original source of the data; that it is specified that the application and/or analysis is the result of the users independent processing of the data; and that neither the basic data nor any processed version or application thereof may be sold or offered for sale in any form whatsoever without the prior permission of Stats SA. A complete set of Stats SA publications is available at the Stats SA Library and the following libraries: • National Library of South Africa, Pretoria Division • National Library of South Africa, Cape Town Division • Natal Society Library, Pietermaritzburg • Library of Parliament, Cape Town • Bloemfontein Public Library • Johannesburg Public Library • Eastern Cape Library Services, King William’s Town • Central Regional Library, Polokwane • Central Reference Library, Nelspruit • Central Reference Collection, Kimberley • Central Reference Library, Mmabatho This publication is also available in hard copy and on the Stats SA website www.statssa.gov.za Stats SA also provides a subscription service. Enquiries: Printing and distribution User information services Tel: (012) 310 8358 (012) 310 8600 Fax: (012) 321 7381 (012) 310 8500 / 8495 Email: [email protected] [email protected]

Statistics South Africa P0305
Recorded live births, 2011
ii
Preface This statistical release presents information on recorded live births in South Africa, based on data from the national birth registration system at the Department of Home Affairs. The release provides estimates of the completeness of birth registration in the country for 2002–2011 and reports on birth registrations and birth occurrences for 2011. It also provides information on trends and patterns of recorded live births from 1991, highlighting provincial differences in the registration and occurrence of births. PJ Lehohla Statistician-General

Statistics South Africa P0305
Recorded live births, 2011
iii
Contents Preface ...................................................................................................................................................... ii Key findings ...................................................................................................................................................... 1 1. Introduction ...................................................................................................................................................... 1 2. Birth registrations .............................................................................................................................................. 1 2.1 Completeness of birth registration .......................................................................................................... 1 2.2 Trends in birth registration ...................................................................................................................... 3 2.3 Birth registrations by selected variables .................................................................................................. 5 3. Birth occurrences ............................................................................................................................................ 10 3.1 Birth occurrences as at 29 February 2012 ............................................................................................ 11 3.2 Birth occurrences as at 30 June 2012 ................................................................................................... 15 4. Concluding remarks ........................................................................................................................................ 17 References .................................................................................................................................................... 18 Appendices .................................................................................................................................................... 19 Appendix A: Notice of birth form (DHA-24) .......................................................................................................... 19 Appendix B: Total birth registrations for 2011 by year of birth occurrence, province and district
municipality ...................................................................................................................................... 21 Appendix C: Birth registrations by registration status, sex, province and district municipality, 2011 ..................... 23 Appendix D: Birth occurrences by year of birth and age of mother, 2007–2011 ................................................... 25 Appendix E: Birth occurrences by province of birth occurrence and age of mother, 2011 .................................... 25 Appendix F: Birth occurrences by year of birth and province and district municipality of birth occurrence,
2007–2011 ....................................................................................................................................... 26 Appendix G: Total birth occurrences by sex, month and citizenship, 1991–1993 ................................................. 28 Appendix G.1: Total birth occurrences by sex, month and citizenship, 1994–1996 ................................................. 29 Appendix G.2: Total birth occurrences by sex, month and citizenship, 1997–1999 ................................................. 30 Appendix G.3: Total birth occurrences by sex, month and citizenship, 2000–2002 ................................................. 31 Appendix G.4: Total birth occurrences by sex, month and citizenship, 2003–2005 ................................................. 32 Appendix G.5: Total birth occurrences by sex, month and citizenship, 2006–2008 ................................................. 33 Appendix G.6: Total birth occurrences by sex, month and citizenship, 2009–2011 ................................................. 34 Explanatory Notes .................................................................................................................................................. 35

Statistics South Africa P0305
Recorded live births, 2011
iv
List of tables Table 1: Birth registrations by status of registration, South Africa: 1991–2011 ......................................................... 3
Table 2: Birth registrations by age of mother and status of registration, South Africa: 2011 ..................................... 6
Table 3: Birth occurrences by year of birth and reference period, South Africa: 1991–2011 ................................... 10
Table 4: Birth occurrences (as at end of February 2012) by year of birth occurrence and year of birth registration, South Africa: 1992–2011 ....................................................................................................... 12
Table 5: Number and percentage of births by age of the mother, South Africa: 2011 ............................................. 13
Table 6: Birth occurrences (as at 30 June 2012) by sex, year of birth and citizenship, South Africa: 1991–2011 ................................................................................................................................................ 16
List of figures Figure 1: Estimated completeness levels of birth registrations, South Africa: 2002–2011 .......................................... 2
Figure 2: Birth registrations by status of registration, South Africa: 1991–2011 ......................................................... 4
Figure 3: Late birth registrations by year of birth, South Africa: 1980–2010 ............................................................... 5
Figure 4: Birth registrations by age of mother and status of registration, South Africa: 2011 ..................................... 6
Figure 5: Birth registrations by province and status of registration, South Africa: 2011 .............................................. 8
Figure 6: Percentage of late birth registrations by province, South Africa: 2009–2011 .............................................. 9
Figure 7: Median age of the mothers by year of birth, South Africa: 1998–2011 ...................................................... 14
Figure 8: Birth occurrences by province of registration, South Africa: 2011 ............................................................. 15
Figure 9: Percentage distribution of birth occurrences by year and month of birth, South Africa: 2007–2011 .......... 17

Statistics South Africa P0305
Recorded live births, 2011
1
Key findings
1. Introduction
“Birth registration is the official recording of the birth of a child coordinated by a particular branch of government. It is a permanent and official record of a child’s existence” (UNICEF, 2002:2). Subsequent to birth registration, birth certificates, which serve as legal records of birth and identification, are issued. The data from birth registration can be used to monitor fertility trends, population growth and population composition. Such information is essential for the planning and monitoring of governments’ economic and social development programmes. Furthermore, in South Africa, for example, having a birth certificate is necessary as it is required for children to access government’s social security, poverty alleviation benefits and schooling.
The registration of births in South Africa is governed by the Births and Deaths Registration Act, 1992 (Act No. 51 of 1992) and is administered by the Department of Home Affairs (Republic of South Africa, 1992). The Act was subsequently amended in 1997 (Act No. 67 of 1997); 1998 (Act No. 43 of 1998); and in 2010 (Act No. 18 of 2010). The Act states that a child must be registered within 30 days of birth. All births registered from 31 days and older, must comply with the prescribed requirements for late registration of births. The requirements include submission of a clinic card; letter from the hospital where the child was born; a letter from the first school attended by the child; and an affidavit prescribed for late registration of a birth.
The Department of Home Affairs uses DHA-24 form to register births for persons aged 30 days and below, and DHA-24/LRB form for persons aged 31 days and older. A copy of the DHA-24 form is provided in Appendix A. The DHA-24 form replaced the BI-24 form that was previously used by the department. After a birth is registered, the department captures relevant information on the South African Population Register (NPR) for those eligible for entry in the register (see page 35 for further details) and then issue an electronic birth certificate. For those who are not eligible for entry in the NPR, a hand-written birth certificate is issued and the details are not captured in the NPR.
The main purpose of this release is to present data on live births recorded in the South African birth registration system at the Department of Home Affairs in 2011, as well as updated records from the NPR as at 30 June 2012. Data for 1991 to 2010 are also presented to provide information on trends and patterns in the occurrence and registration of live births. The reporting of live births is divided into registration year (the year in which a birth was registered, regardless of when it occurred) and occurrence year (the year in which a birth actually occurred). This release also provides estimates of the completeness of birth registration in the country.
2. Birth registrations
2.1 Completeness of birth registration
The estimation of completeness of the South African civil registration system for recording vital events and other characteristics is an important undertaking that provides an indication of the efficiency of the Department of Home Affairs. Furthermore, the number of births and deaths adjusted for incompleteness of registration can be used in the analysis of birth and death statistics and for estimating the overall population size of the country.
This release provides estimates of the level of completeness of birth registration in South Africa from 2002 to 2011. The estimation of the completeness of birth registration is based on the comparison of recorded live births from the birth registration system to expected number of births estimated with the mid-year population estimates (Stats SA, 2011). Cohort-component methodology was used to estimate the 2011 mid-year population of South Africa, from which the number of births at mid-year for the period 2002 to 2011 were also estimated.

Statistics South Africa P0305
Recorded live births, 2011
2
2002 2003 2004 2005 2006 2007 2008 2009 2010 2011
Current births 47, 9 53, 7 63, 4 69, 8 76, 5 77, 4 83, 5 81, 2 83, 3 85, 9
Updated births * 82, 6 82, 6 88, 1 92, 5 95, 8 95, 3 98, 1 94, 2 91, 9 90, 2
40,0
50,0
60,0
70,0
80,0
90,0
100,0
Perc
enta
ge
The number of births reported in this release is based on a calendar year, that is, from January to December. As such, proportions of 50,4% for the first half of the year of interest and 49,6% for the second half of the following year were used to adjust the number of births at mid-year to estimate the number of births occurring to the calendar years of interest. It should be noted that since the estimates of completeness are dependent on population projections that are continuously revised when new information about the population dynamics becomes available, the completeness of birth registration will also be revised accordingly on an annual basis. As we move further away from the enumeration point, the estimated population indicators become unstable.
Figure 1 provides estimates of completeness of the number of births covered by the South African birth registration system from 2002 to 2011. These are provided for current births (births registered within the year of birth in the birth registration system) and for updated births (recorded births as at 30 June 2012 in the NPR). The results show that the level of completeness of birth registration for births registered within the year of birth increased consistently in the past 10 years – from 47,9% in 2002 to 85,9% in 2011.
As expected, completeness of birth registration is higher when late registrations are taken into consideration. The completeness of birth registrations for updated births increased from 82,6% in 2002 and reached a high of 98,1% in 2008. The completeness levels of birth registration for the updated births in 2010 and 2011 are lower since the 2010 and 2011 births are still to be updated with relatively more late registrations compared to the other years. In recent years, the differences in the completeness of birth registration for current and late registrations are not wide, which indicates that there has been an improvement in timely birth registrations in the country.
Figure 1: Estimated completeness levels of birth registrations, South Africa: 2002–2011*
*Updated births as at 30 June 2012.

Statistics South Africa P0305
Recorded live births, 2011
3
2.2 Trends in birth registration
Total birth registrations are all births registered at the Department of Home Affairs during a specific year, regardless of when they occurred. In other words, for any given year, the total number of registrations consists of both current registrations (live births registered in the year in which they occurred) and late registrations (live births registered later than the year of birth).
Table 1 and Figure 2 provide information on birth registrations for two decades (1991 to 2011), classified by status of registration (current or late). In 2011, a total of 1 202 377 births were registered. This is a decrease of 7,1% from the 1 294 694 births registered in 2010. Over time, total birth registrations have varied. There was a consistent increase between 1992 and 2003, when births increased consistently from 501 461 to 1 677 415. Between 2004 and 2007 there was a decline from 1 475 809 to 1 199 712; and since 2008, the number of births has fluctuated. From 1991 to 2004, the number of late birth registrations was higher than the number of current registrations. Since 2005, current registrations have been higher than late registrations, indicating that most births were registered during the year of birth occurrence rather than later.
Further analysis of the two decades shows that the number of births registered within the year of occurrence showed some gains between 1999 and 2006, after which there were some fluctuations between 2007 and 2011. A total of 911 353 births that occurred in 2011 were registered within the same year. Late birth registrations rose steadily between 1992 and 1999, changed slightly between 1999 and 2003 after which they decreased markedly up to 2007. There was an increase in late birth registration again between 2008 and 2010. In 2011, a decrease in late registration was noted again, showing a decline of 28,1% from 2010.
Table 1: Birth registrations by status of registration, South Africa: 1991–2011
Year of registration
Number of birth registrations Percentages Total Current Late Total Current Late
1991 537 999 238 053 299 946 100,0 44,2 55,8 1992 501 461 228 445 273 016 100,0 45,6 54,4 1993 557 995 199 460 358 535 100,0 35,7 64,3 1994 667 107 246 345 420 762 100,0 36,9 63,1 1995 809 439 260 880 548 559 100,0 32,2 67,8 1996 998 798 295 719 703 079 100,0 29,6 70,4 1997 1 046 095 309 723 736 372 100,0 29,6 70,4 1998 1 216 337 273 180 943 157 100,0 22,5 77,5 1999 1 363 800 344 700 1 019 100 100,0 25,3 74,7 2000 1 407 833 409 707 998 126 100,0 29,1 70,9 2001 1 433 432 477 489 955 943 100,0 33,3 66,7 2002 1 517 671 557 573 960 098 100,0 36,7 63,3 2003 1 677 415 621 887 1 055 528 100,0 37,1 62,9 2004 1 475 809 728 283 747 526 100,0 49,3 50,7 2005 1 380 496 793 788 586 708 100,0 57,5 42,5 2006 1 346 119 860 263 485 856 100,0 63,9 36,1 2007 1 199 712 858 866 340 846 100,0 71,6 28,4 2008 1 277 763 915 674 362 089 100,0 71,7 28,3 2009 1 254 707 879 707 375 000 100,0 70,1 29,9 2010 1 294 694 889 691 405 003 100,0 68,7 31,3 2011 1 202 377 911 353 291 024 100,0 75,8 24,2

Statistics South Africa P0305
Recorded live births, 2011
4
Figure 2: Birth registrations by status of registration, South Africa: 1991–2011
Additional information on late registrations for births that were registered in 2010 and 2011 but had occurred in the previous years is provided in Figure 3. As indicated in the last figure, there were more late registrations in 2010 as compared to 2011. This trend is observed for all the years of birth occurrence, although the differences between the 2010 and 2011 years of birth registration were more marked for some years than for others. For example, there are no marked differences in the number of births registered in 2010 and 2011 for births that occurred between 1980 and 1984 and between 1994 and 2003. However, there were noticeable differences for the other years.
Focusing on the 2011 birth registrations, it is observed that most late birth registrations were for births that occurred in 2010, which comprised 29,0% of the 2011 late registrations; followed by those born in 2009 and then 2008. Other late registrations are noted for births that occurred between 1988 and 1992 (aged between 19 and 23 years at the time of registration). From the age of 16 years, all South African citizens and permanent residents can register to acquire identity documents, and the uptake of this is notable between 19 and 23 years, particularly at age 21 years.
200 000
400 000
600 000
800 000
1 000 000
1 200 000
1 400 000
1 600 000
1 800 000
1991
1992
1993
1994
1995
1996
1997
1998
1999
2000
2001
2002
2003
2004
2005
2006
2007
2008
2009
2010
2011
Num
ber o
f birt
hs
Year of birth registration
Total Current Late

Statistics South Africa P0305
Recorded live births, 2011
5
Figure 3: Late birth registrations by year of birth, South Africa: 1980–2010
10 000
20 000
30 000
40 000
50 000
60 000
70 000
80 000
90 000
100 000
1980
1981
1982
1983
1984
1985
1986
1987
1988
1989
1990
1991
1992
1993
1994
1995
1996
1997
1998
1999
2000
2001
2002
2003
2004
2005
2006
2007
2008
2009
2010
Num
ber
of b
irth
s
Year of birth occurrenceLate 2010 birth registrations Late 2011 birth registrations
2.3 Birth registrations by selected variables
Age of the mother
The Notice of Birth form (DHA–24) makes provision for the inclusion of the details of the natural father and natural mother of a child. However, more than two-thirds (67,5%) of the births registered in 2011 did not have the details of the father. This finding is similar to the previous years. As such, only information pertaining to the mothers will be reported on in this section.
Table 2 and Figure 4 show the distribution of births registered in 2011 by the age of the mother and status of registration. Overall, higher percentages of late registrations were observed among mothers aged 45 and above, where over half of births in these ages were registered later than the year in which they occurred. Much older women (aged 50–54) had particularly higher proportions of late registrations (85,5%). Conversely, younger mothers mostly registered their births within the year of birth. Percentages of births registered within the year of birth were particularly higher for women aged between 25 and 39 years, where around 80% or more of births occurring in this age group were registered within the year of birth. Among the younger women, those aged 15–19 had the lowest proportions of births registered within the year of birth (62,3%).

Statistics South Africa P0305
Recorded live births, 2011
6
Table 2: Birth registrations by age of mother and status of registration, South Africa: 2011
Age of mother Number of birth registrations Percentages
Total Current Late Total Current Late
15–19 181 717 113 240 68 477 100,0 62,3 37,7
20–24 323 313 251 202 72 111 100,0 77,7 22,3
25–29 297 034 244 062 52 972 100,0 82,2 17,8
30–34 208 196 169 427 38 769 100,0 81,4 18,6
35–39 125 368 99 725 25 643 100,0 79,5 20,5
40–44 40 892 29 453 11 439 100,0 72,0 28,0
45–49 6 422 2 896 3 526 100,0 45,1 54,9
50–54 1 784 258 1 526 100,0 14,5 85,5Unspecified / outside the 15–54 age range 17 651 1 090 16 561 100,0 6,2 93,8
Total 1 202 377 911 353 291 024 100,0 75,8 24,2
Figure 4: Birth registrations by age of mother and status of registration, South Africa: 2011*
0,0
10,0
20,0
30,0
40,0
50,0
60,0
70,0
80,0
90,0
15‐19 20‐24 25‐29 30‐34 35‐39 40‐44 45‐49 50‐54
Per
cent
age
of b
irth
s
Age group of mother
Current Late
*Excluding 17 651 births whose mothers’ ages were not stated or were outside the age range of 15–54 years.

Statistics South Africa P0305
Recorded live births, 2011
7
Province of birth
The Department of Home Affairs captures data on registered births by magisterial districts, from which Statistics South Africa (Stats SA) derives the distribution of births by district councils (DCs), metropolitan areas (Metros) as well as provinces. For this release, DCs, Metros and provinces are classified based on the 2011 municipal boundaries. It should, however, be noted that the distribution of births by DCs, Metros and provinces are approximate figures as there was no perfect match of magisterial districts to all DCs, Metros and provinces since some magisterial districts are situated in more than one DC, Metro or province (see page 36 for further details).
Before the 2010 statistical release was published, magisterial districts captured were interpreted to be the districts of birth registration. However, engagements with the Department of Home Affairs in 2011 indicated that the district code variable in the data set refers to the district of birth occurrence for births registered before 15 years of age. For those that occur from 15 years of age, district refers to the district of birth registration, which is usually Pretoria, where late registrations of birth are centralised for processing.
Analysis of information on late registrations by province will take into consideration births registered before 15 years of age and births registered from 15 years of age. Figure 5 presents the distribution of all births registered in 2011 by province of occurrence/registration and status of registration using three categories:
i. Current – registered within the year of birth;
ii. Late – registered after the year of birth but before age 15; and
iii. Late – registered from 15 years of age.
Of the 1 202 377 births registered in 2011, the highest number occurred in Gauteng (313 574 – 26,1%); followed by KwaZulu-Natal (227 046 – 18,9%); Limpopo (133 381 – 11,1%); and Eastern Cape (132 655 – 11,0%). Northern Cape had the lowest number (25 613), accounting for only 2,1% of the total registrations. There were more current registrations than total late registrations in all provinces, although Gauteng had the lowest percentage of current registrations compared to the other provinces. For example, 58,2% of all registrations in Gauteng were registered within the year of birth, while a comparative figure for Northern Cape was 89,1%.
In 2011, a total of 9 595 births that occurred outside the country were registered. These represent cases where at least one of the parents was a South African citizen at the time of the child’s birth. The birth may be notified at the South African Embassy or Mission in the country concerned or at the Department of Home Affairs in South Africa. The majority of foreign births were registered late (after age 15).
The changes in capturing late birth registrations from age 15 at the Department of Home Affairs in Pretoria is reflective in the disproportionate number of late birth registrations for Gauteng. Out of a total of 116 933 late birth registrations, from age 15, 101 335 (86,7%) births were registered in Gauteng.

Statistics South Africa P0305
Recorded live births, 2011
8
Western Cape
Eastern Cape
Northern Cape
Free State
KwaZulu-Natal
North West Gauteng Mpuma-
langa Limpopo Foreign Un-specified
Total 109 389 132 655 25 613 58 230 241 164 83 900 313 574 93 841 133 381 9 595 1 035Current 97 467 110 361 22 820 50 571 185 207 70 510 182 638 75 291 115 734 247 507Late - before age 15 11 643 22 054 2 777 7 601 51 289 13 326 29 601 18 097 17 408 196 99Late - from age 15 279 240 16 58 4 668 64 101 335 453 239 9 152 429
50 000
100 000
150 000
200 000
250 000
300 000
350 000
Num
ber o
f birt
hs
Province of birth
Figure 5: Birth registrations by province and status of registration, South Africa: 2011
The results of further analysis of late registrations are shown in Figure 6, covering the years 2009 to 2011. Data for all years are based on revised 2011 geographic boundaries. Over the three years, the trends in late registrations before age 15 remained largely unchanged, with the highest proportions observed in KwaZulu-Natal, Eastern Cape and Mpumalanga. During the same period, Gauteng and the Western Cape had relatively low proportions of late registrations before age 15.
The proportions of late registrations from age 15 for each of the years under study, show drastic declines in late registrations from 2009 to 2010 for all provinces, with the exception of Gauteng. Proportions of late registrations in Gauteng increased from 20,1% in 2009 to 46,6% in 2010, but declined to 32,2% in 2011. It is possible that the decline observed in 2011 is indicative of the decline in overall registrations as observed in Table 1.
Detailed information on 2011 total registrations by year of birth occurrence and status of registration, province and district municipality is provided in Appendix B.

Statistics South Africa P0305
Recorded live births, 2011
9
Figure 6: Percentage of late birth registrations by province, South Africa: 2009–2011*
0,0
5,0
10,0
15,0
20,0
25,0
30,0
35,0
40,0
45,0
50,0
2009 2010 2011 2009 2010 2011
Late - before age 15 Late - after age 15
Per
cent
age
Late registrations by year of registration
Western Cape Eastern Cape Northern Cape Free State KwaZulu-Natal North West Gauteng Mpumalanga Limpopo
*Excluding foreign births and births with unspecified province.
Sex of the child
Proportionally more male births were registered than female births (605 170 and 597 207 respectively). The sex ratio in 2011 was therefore 101 male births per 100 female births registered. With the exception of Free State, all provinces had sex ratios of between 100 and 104 males per 100 females. Free State had a sex ratio of 99,9 males per 100 females, indicating slightly more female than male births. Northern Cape had the highest sex ratio of 104 male per 100 female birth registrations, compared to the other provinces.
Detailed information on total registrations by sex, status of registration, province and district municipality is provided in Appendix C.

Statistics South Africa P0305
Recorded live births, 2011
10
3. Birth occurrences
Birth occurrences are all births that occur within a specific year and are registered at the Department of Home Affairs (DHA). They pertain to the year in which the birth actually occurred (year of birth). Each time a birth for any particular year is registered; birth occurrences for that specific year are updated to include those registered late. Therefore, information on birth occurrences varies each time data are extracted from the population register since they get updated continuously.
This section reports on birth occurrence based on registration-based data captured in the birth registration system up to 29 February 2012 (this being the cut-off date for processing by Stats SA). It also reports on birth occurrences as extracted from the National Population Register on 30 June 2012. The end of February information is received electronically from DHA and that of the end of June is provided as a print-out from the same department.
Total birth occurrences for the period 1991 to 2011 for the two time-periods are provided in Table 3. It is observed that by 29 February 2012, 911 353 births that occurred in 2011 were registered, increasing to 957 280 births by 30 June 2012. This indicates that between 29 February 2012 and 30 June 2012, the birth register was updated by 45 927 births that occurred in 2011 (5,0% increase).
As expected, birth occurrences increased for each year between these two periods, showing the continuous update of the birth register. The highest number of birth occurrences was recorded for the 2006 birth year for both periods and the lowest in 1998. The number of birth occurrences decreased by 8,6% between 2010 and 2011 as at 29 February 2012; and by 2,4% as at 30 June 2012.
Table 3: Birth occurrences by year of birth and reference period, South Africa: 1991–2011
Year of birth occurrence
Birth occurrences Updated birth occurrences (as at 29 Feb. 2012) (as at 30 Jun. 2012)
1991 933 991 981 258 1992 961 994 979 567 1993 939 883 961 763 1994 923 753 970 768 1995 920 714 944 378 1996 964 480 971 990 1997 957 856 958 417 1998 898 543 941 955 1999 928 456 957 372 2000 926 466 968 920 2001 921 546 952 796 2002 909 538 962 905 2003 916 279 956 413 2004 1 002 587 1 011 819 2005 1 046 492 1 051 395 2006 1 070 532 1 077 415 2007 1 051 038 1 058 336 2008 1 063 672 1 076 543 2009 994 436 1 019 758 2010 969 770 981 062 2011 911 353 957 280

Statistics South Africa P0305
Recorded live births, 2011
11
3.1 Birth occurrences as at 29 February 2012
Birth occurrences for different years are composed of births registered within the year in which they occurred and those registered late. Table 4 shows the number of births that occurred during the period 1992 to 2011 by year of birth and year of registration. The figures in bold indicate all births that were registered within the year in which they occurred while those not in bold are late registrations, showing when the births for a particular year were eventually registered.
The overall number of birth occurrences in the 10-year period has been fluctuating, with an average of about 962 000 births occurring per year. This average increases each year due to the updating of the birth register with late registrations, as well as registrations for the current year. For example, the average annual number of births in 2010 was about 954 000, which was an increase from an average of about 944 000 births recorded in 2009.
The number of births that got registered during the year of birth (numbers is bold) increased consistently between 1999 and 2006. However, after 2006 there have been variations. Decreases were observed between 2006 and 2007, 2008 and 2009 and 2009 and 2010, whereas increases were observed between 2007 and 2008 and 2010 and 2011. There were 911 353 births that occurred in 2011 and were registered within the same year. This represents a 2,4% increase from the 889 691 births that were registered within the year of birth in 2010.
Table 4 also shows that from 1994 occurrence year, the highest number of late birth registrations were registered the following year. In addition, there was a consistent pattern observed from 1997 occurrence year where late birth registrations by year of birth registration decreased consistently year by year. For example in 1997 occurrence year, late birth registrations decreased from 105 766 in 1998 to 104 453 in 1999 and then decreased consistently up to 2011 when 2 879 births that occurred in 1997 were registered.

Statistics South Africa P0305
Recorded live births, 2011
12
Table 4: Birth occurrences (as at end of February 2012) by year of birth occurrence and year of birth registration, South Africa: 1992–2011
Year of birth
registration Year of birth occurrence
1992 1993 1994 1995 1996 1997 1998 1999 2000 2001 2002 2003 2004 2005 2006 2007 2008 2009 2010 2011
1992 228 445
1993 54 584 199 460
1994 36 373 63 813 246 345
1995 40 965 43 097 73 336 260 880
1996 48 415 48 338 51 748 89 566 295 719
1997 62 404 50 708 50 627 54 198 93 807 309 723
1998 82 381 77 021 61 919 59 942 70 261 105 766 273 180
1999 59 898 84 143 84 563 80 362 92 276 104 453 146 055 344 700
2000 60 000 85 000 58 170 78 122 92 269 102 179 114 781 178 516 409 707
2001 36 564 36 441 43 932 65 682 79 095 87 285 96 809 116 374 192 410 477 489
2002 36 841 34 709 34 679 36 685 58 125 73 665 86 859 98 553 118 600 218 256 557 573
2003 53 258 53 491 63 494 73 845 69 465 68 289 69 795 72 533 77 256 94 588 194 204 621 887
2004 35 034 49 237 58 549 44 477 41 014 38 700 41 372 42 511 43 503 48 197 63 234 165 662 728 283
2005 57 158 48 398 36 883 28 386 25 341 23 240 23 162 24 996 24 807 23 798 27 701 43 404 150 546 793 788
2006 19 544 20 039 20 002 18 034 18 217 17 623 19 518 21 911 26 516 24 057 26 042 34 601 54 941 154 331 860 263
2007 7 880 11 421 10 178 9 472 9 309 9 227 9 897 10 969 14 158 15 200 16 766 20 009 26 769 42 569 126 358 858 866
2008 2 507 10 740 11 767 7 955 7 105 6 548 6 691 6 927 8 327 8 722 11 378 14 085 17 869 23 732 40 554 128 336 915 674
2009 9 928 4 555 6 024 6 204 5 406 4 489 4 317 4 609 5 128 5 072 6 053 8 322 11 793 14 208 19 510 31 885 101 743 879 707
2010 18 488 11 094 6 389 3 913 4 495 3 790 3 483 3 340 3 450 3 535 3 844 4 852 7 623 10 566 13 736 19 323 30 164 91 064 889 691
2011 11 327 8 178 5 148 2 991 2 576 2 879 2 624 2 517 2 604 2 632 2 743 3 457 4 763 7 298 10 111 12 628 16 091 23 665 80 079 911 353
TOTAL 961 994 939 883 923 753 920 714 964 480 957 856 898 543 928 456 926 466 921 546 909 538 916 279 1 002 587 1 046 492 1 070 532 1 051 038 1 063 672 994 436 969 770 911 353
Statistics South Africa P0305
Recorded live births, 2011
13
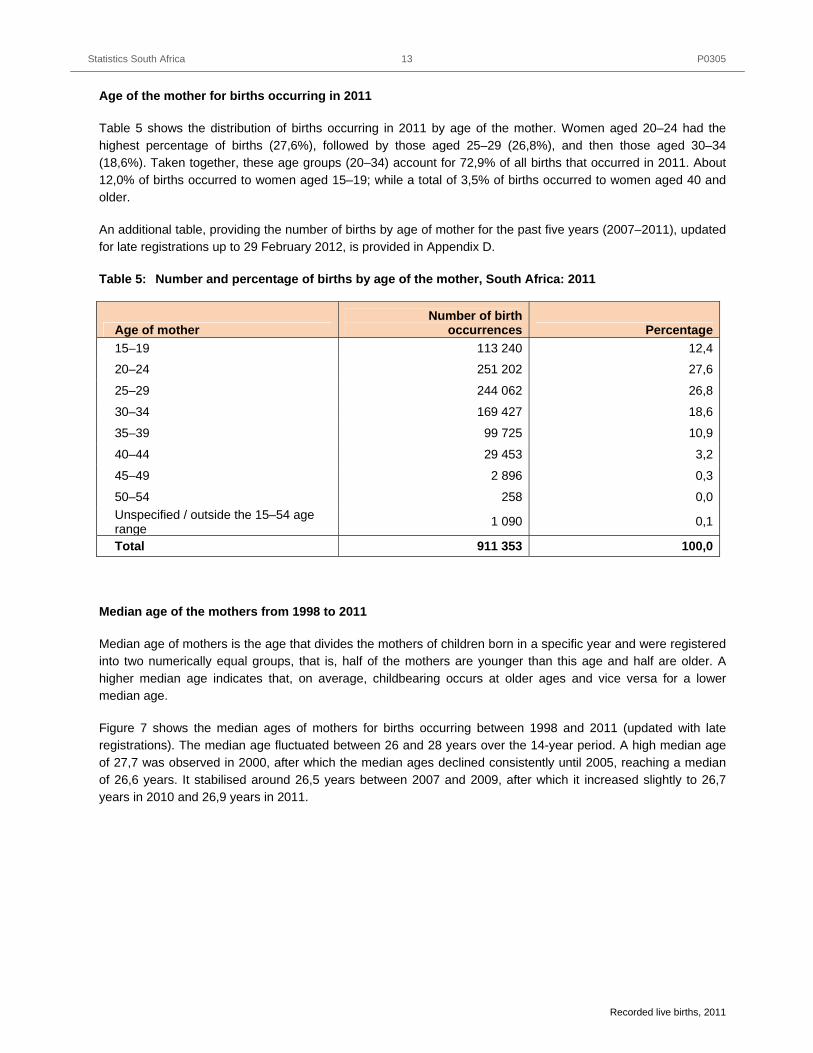
Age of the mother for births occurring in 2011
Table 5 shows the distribution of births occurring in 2011 by age of the mother. Women aged 20–24 had the highest percentage of births (27,6%), followed by those aged 25–29 (26,8%), and then those aged 30–34 (18,6%). Taken together, these age groups (20–34) account for 72,9% of all births that occurred in 2011. About 12,0% of births occurred to women aged 15–19; while a total of 3,5% of births occurred to women aged 40 and older.
An additional table, providing the number of births by age of mother for the past five years (2007–2011), updated for late registrations up to 29 February 2012, is provided in Appendix D.
Table 5: Number and percentage of births by age of the mother, South Africa: 2011
Age of mother Number of birth
occurrences Percentage15–19 113 240 12,4
20–24 251 202 27,6
25–29 244 062 26,8
30–34 169 427 18,6
35–39 99 725 10,9
40–44 29 453 3,2
45–49 2 896 0,3
50–54 258 0,0Unspecified / outside the 15–54 age range 1 090 0,1
Total 911 353 100,0
Median age of the mothers from 1998 to 2011
Median age of mothers is the age that divides the mothers of children born in a specific year and were registered into two numerically equal groups, that is, half of the mothers are younger than this age and half are older. A higher median age indicates that, on average, childbearing occurs at older ages and vice versa for a lower median age.
Figure 7 shows the median ages of mothers for births occurring between 1998 and 2011 (updated with late registrations). The median age fluctuated between 26 and 28 years over the 14-year period. A high median age of 27,7 was observed in 2000, after which the median ages declined consistently until 2005, reaching a median of 26,6 years. It stabilised around 26,5 years between 2007 and 2009, after which it increased slightly to 26,7 years in 2010 and 26,9 years in 2011.

Statistics South Africa P0305
Recorded live births, 2011
14
1998 1999 2000 2001 2002 2003 2004 2005 2006 2007 2008 2009 2010 2011
Median age 27,4 27,6 27,7 27,6 27,5 27,0 26,8 26,6 26,5 26,6 26,5 26,5 26,7 26,9
26,0
26,5
27,0
27,5
28,0
Age
(yea
rs)
Figure 7: Median age of the mothers by year of birth, South Africa: 1998–2011
Provincial distribution of births in 2011
The distribution of births that occurred in 2011, classified by province of birth occurrence, is given in Figure 8. The highest proportion of 2011 births occurred in Gauteng and KwaZulu-Natal; where about 19,0% of births occurred in each of these provinces (20,3% in Gauteng and 19,4% in KwaZulu-Natal). The lowest proportions of births occurred in Northern Cape (2,5%) and Free State (5,6%).
Birth occurrences by province and age of mother for 2011 are provided in Appendix E. The distribution of birth occurrences by province and district municipality of birth occurrences, based on revised municipal boundaries for 2006–2011, is provided in Appendix F.

Statistics South Africa P0305
Recorded live births, 2011
15
Figure 8: Birth occurrences by province of registration, South Africa: 2011*
Western Cape (97 467)10,7%
Eastern Cape (110 361)12,1%
Northern Cape (22 820)2,5%
Free State (50 571)5,6%
KwaZulu-Natal (185 207)20,3%North West (70 510)
7,7%
Gauteng (182 638)20,1%
Mpumalanga (75 291)8,3%
Limpopo (115 734)12,7%
Foreign (247)0,0%
*Excluding 507 births with unspecified province
3.2 Birth occurrences as at 30 June 2012
This sub-section provides birth occurrences by sex, citizenship, and month of birth as reflected in the population register on 30 June 2012. It should be noted that the figures from the population register vary each time data are extracted. Therefore, the magnitude of change in the number of births between any two periods of extraction will depend on the number of late birth registrations for each year.
The total number of birth occurrences per year, as shown in Table 6, indicates that a total of about 20,7 million births occurred in South Africa between 1991 and 2011, with an average of about 987 720 births per year over the 21-year period. The number of birth occurrences fluctuated between 941 000 and around one million (per year) over the period 1991–2011, with the highest number occurring in 2006 and the lowest in 1998.
Sex of the child
The overall number of birth occurrences by year of birth provided in Table 6 shows that in general, there were slightly more male births than female births between 1993 and 2011. Sex ratios were between 100 and 102 males per 100 female births. There were a little more female than male births in 1992 only.
Total number of births (N) = 910 846

Statistics South Africa P0305
Recorded live births, 2011
16
Citizenship
The majority of birth occurrences for all the years under study were for South African citizens, comprising over 99% of all births in all years. The total number of births to non-South African citizens (non-citizens with permanent residence permits) and those classified as ‘other’ appear to decrease over time.
Table 6: Birth occurrences (as at 30 June 2012) by sex, year of birth and citizenship, South Africa: 1991–2011
Year
Grand total South African citizens Non-South African citizens Other*
Total Male Female Total Male Female Total Male Female Total Male Female
1991 981 258 490 788 490 470 979 035 489 603 489 432 1 437 732 705 786 453 333
1992 979 567 489 138 490 429 977 553 488 127 489 426 1 286 633 653 728 378 350
1993 961 763 482 114 479 649 960 023 481 226 478 797 1 132 578 554 608 310 298
1994 970 768 486 824 483 944 969 177 485 988 483 189 976 512 464 615 324 291
1995 944 378 473 423 470 955 942 756 472 641 470 115 782 388 394 840 394 446
1996 971 990 487 511 484 479 970 738 486 887 483 851 566 279 287 686 345 341
1997 958 417 479 899 478 518 957 545 479 439 478 106 336 187 149 536 273 263
1998 941 955 471 152 470 803 941 141 470 713 470 428 329 179 150 485 260 225
1999 957 372 479 024 478 348 956 584 478 630 477 954 325 160 165 463 234 229
2000 968 920 485 387 483 533 968 485 485 184 483 301 247 119 128 188 84 104
2001 952 796 477 267 475 529 952 471 477 086 475 385 225 127 98 100 54 46
2002 962 905 482 062 480 843 962 598 481 908 480 690 205 104 101 102 50 52
2003 956 413 480 256 476 157 956 149 480 111 476 038 184 100 84 80 45 35
2004 1 011 819 508 555 503 264 1 011 545 508 402 503 143 180 103 77 94 50 44
2005 1 051 395 528 810 522 585 1 051 133 528 671 522 462 159 85 74 103 54 49
2006 1 077 415 541 036 536 379 1 077 160 540 895 536 265 124 65 59 131 76 55
2007 1 058 336 532 591 525 745 1 058 116 532 479 525 637 117 70 47 103 42 61
2008 1 076 543 541 229 535 314 1 076 411 541 170 535 241 60 28 32 72 31 41
2009 1 019 758 513 355 506 403 1 019 669 513 298 506 371 39 29 10 50 28 22
2010 981 062 494 941 486 121 981 022 494 921 486 101 6 4 2 34 16 18
2011 957 280 482 590 474 690 957 257 482 575 474 682 23 15 8
Total 20 742 110 10 407 952 10 334 158 20 726 568 10 399 954 10 326 614 8 715 4 482 4 233 6 827 3 516 3 311* Other refers to those people whose citizenship was under investigation and had not yet been resolved on 30 June 2012.
Month of birth
Figure 9 shows the percentage distribution of birth occurrences from 2007 to 2011 classified by month of birth. It is observed that the pattern of birth occurrences by month and year of birth was largely the same over the 5-year period. For most years, the highest proportion of births occurred during the month of September, although some years show the highest proportions in January and others in March. These three months were the first three most common months for birth occurrences as compared to other months for all years. November had the lowest proportions of birth occurrences for most years, followed by February and October. In 2011, there were more births in March and lowest in November.
Detailed information of birth occurrences from 1991 to 2011 by month of birth, sex and citizenship is given in Appendix G.

Statistics South Africa P0305
Recorded live births, 2011
17
7,00
7,50
8,00
8,50
9,00
9,50
10,00
Janu
ary
Febr
uary
Mar
ch
April
May
June July
Augu
st
Sept
embe
r
Oct
ober
Nov
embe
r
Dec
embe
r
Perc
enta
ge
Month of birth2007 2008 2009 2010 2011
Figure 9: Percentage distribution of birth occurrences by year and month of birth, South Africa: 2007–2011
4. Concluding remarks
This statistical release provided information on birth registrations and occurrences in South Africa during the period 1991 to 2011, with specific focus on 2011. The completeness of birth registration in the country has improved over time, particularly for births registered within the year of birth. In the past four years (2008–2011), over 80% of births were registered within the year of birth. As of 30 June 2012, over 90% of births that occurred from 2005 and beyond were registered. About 90,2% of those occurring in 2011 were registered by this time.
Overall, total birth registrations decreased by 7,1% between 2010 and 2011, with current registrations increasing by 2,4 % and late registrations decreasing by 28,1% respectively between these two years. The late registrations are composed of those registering after one year of birth but less than 15 years of age and those registering from age 15. While late birth registrations before age 15 decreased (by 11,1%), late birth registrations from age 15 increased considerably (by 37,9%).
On average, around 987 966 births occurred each year between 1991 and 2011, based on registered births as at end of June 2012, with the highest number of birth occurring in 2006 and the lowest in 2011. It is expected that more births for 2011 will be registered in 2012 and others in subsequent years. The results further showed that most births occurred to women aged 20–29 years and that births mostly occurred in Gauteng and KwaZulu-Natal. Overall, most births occurred during the months of March, May and September and there were slightly more male than female children for a great majority of years.
Although the completeness of birth registration has increased, coupled with more births being registered within the year of birth, there is still a need to increase efforts aimed at increasing birth registration in the country. It is important to continue to advocate for registration of births within 30 days of occurrence as stipulated in the Births and Death Registration Act (Republic of South Africa, 1992). Furthermore, details of fathers were missing in the majority of cases, a problem that has persisted over a long time. It is, therefore, important that officials at the Department of Home Affairs ensure that all the information required on the birth notification form is completed fully and accurately at the time of birth registration.

Statistics South Africa P0305
Recorded live births, 2011
18
References
Central Statistics Services. 1995. Standard Code List of Areas, 12th Edition, 09.90.03, Pretoria, Statistics South Africa
Republic of South Africa. 1992. Births and Death Registration Act, Act No. 51 of 1992.
Statistics South Africa (Stats SA). 2011. Mid-year population estimates, 2011. Statistical Release P0302, Pretoria.
United Nations Children’s Fund (UNICEF). 2002. “Birth Registration”, Innocent Digest, No. 9: Innocenti Research Centre, Florence, Italy.
World Health Organization (WHO). 1992. International Statistical Classification of Diseases and Related Health Problems, 10th Revision. WHO, Geneva.

Statistics South Africa P0305
Recorded live births, 2011
19
Appendices Appendix A: Notice of birth form (DHA-24) – page 1

Statistics South Africa P0305
Recorded live births, 2011
20
Appendix A: Notice of birth form (DHA-24) – page 2

Statistics South Africa P0305
Recorded live births, 2011
21
Appendix B: Total birth registrations for 2011 by year of birth occurrence, province and district municipality
Province and district municipality
Grand total
2011 (current)
Late registrations
Total 2010 2009 2008 2007 2006
and below
Total - South Africa 1 202 377 911 353 291 024 80 079 23 665 16 091 12 628 158 561
Western Cape
Cape Winelands 13 805 12 603 1 202 609 160 100 77 256
Central Karoo 1 139 1 065 74 47 11 7 0 9
City of Cape Town 75 223 66 936 8 287 3 847 1 275 850 578 1 737
Eden 10 029 8 972 1 057 516 139 87 76 239
Overberg 3 051 2 568 483 229 74 34 36 110
West Coast 6 142 5 323 819 470 96 58 41 154
Total 109 389 97 467 11 922 5 718 1 755 1 136 808 2 505
Eastern Cape
Alfred Nzo 15 483 12 138 3 345 1 409 432 276 278 950
Amatole 14 764 11 793 2 971 1 244 417 271 175 864
Buffalo city 16 234 14 766 1 468 742 218 125 95 288
Cacadu 7 132 6 044 1 088 538 133 96 72 249
Chris Hani 14 926 12 472 2 454 1 223 374 227 157 473
Joe Gqabi 6 313 4 967 1 346 547 155 128 97 419
Nelson Mandela Bay Metro 20 572 18 326 2 246 1 204 313 169 137 423
O.R. Tambo 37 231 29 855 7 376 3 444 966 645 491 1 830
Total 132 655 110 361 22 294 10 351 3 008 1 937 1 502 5 496
Northern Cape
Frances Baard 9 291 8 423 868 332 116 72 85 263
John Taolo Gaetsewe 5 848 5 363 485 208 70 33 31 143
Namakwa 1 467 1 369 98 31 15 11 7 34
Pixley ka Seme 4 124 3 386 738 341 83 60 50 204
Siyanda 4 883 4 279 604 283 75 36 32 178
Total 25 613 22 820 2 793 1 195 359 212 205 822
Free State
Fezile Dabi 9 141 7 569 1 572 498 209 164 165 536
Lejweleputswa 12 761 10 839 1 922 637 247 164 158 716
Mangaung 18 528 16 688 1 840 657 215 155 166 647
Thabo Mofutsanyane 16 198 14 227 1 971 706 228 198 160 679
Xhariep 1 602 1 248 354 93 52 24 24 161
Total 58 230 50 571 7 659 2 591 951 705 673 2 739

Statistics South Africa P0305
Recorded live births, 2011
22
Appendix B: Total birth registrations for 2011 by year of birth occurrence, province and district municipality (concluded)
Province and district municipality Grand total
2011 (current)
Late registrations
Total 2010 2009 2008 2007 2006
and below
Total - South Africa 1 202 377 911 353 291 024 80 079 23 665 16 091 12 628 158 561
KwaZulu-Natal Amajuba 12 819 10 164 2 655 1 290 350 219 191 605 eThekwini 77 262 59 873 17 389 5 582 1 847 1 348 1 112 7 500 iLembe 10 195 7 658 2 537 1 160 324 241 200 612 Sisonke 14 118 10 852 3 266 1 134 440 340 242 1 110 Ugu 15 483 12 949 2 534 1 053 312 225 204 740 UMgungundlovu 20 655 15 984 4 671 1 458 589 467 394 1 763 Umkhanyakude 15 659 11 107 4 552 2 081 575 432 323 1 141 Umzinyathi 13 200 9 606 3 594 1 370 461 361 280 1 122 Uthukela 15 720 12 184 3 536 1 468 481 324 298 965 Uthungulu 24 712 18 611 6 101 2 800 794 595 454 1 458 Zululand 21 341 16 219 5 122 2 253 725 515 425 1 204 Total 241 164 185 207 55 957 21 649 6 898 5 067 4 123 18 220 North West Bojanala 38 323 32 909 5 414 2 585 757 478 392 1 202 Dr Kenneth Kaunda 15 060 12 759 2 301 1 045 333 206 154 563 Dr Ruth Segomotsi Mompati 19 242 15 822 3 420 1 875 431 271 194 649 Ngaka Modiri Molema 11 275 9 020 2 255 984 283 200 144 644 Total 83 900 70 510 13 390 6 489 1 804 1 155 884 3 058 Gauteng City of Johannesburg 69 320 59 642 9 678 3 929 1 477 991 775 2 506 City of Tshwane 147 935 39 659 108 276 3 222 961 635 520 102 938 Ekurhuleni 61 693 53 207 8 486 3 453 1 215 861 670 2 287 Sedibeng 18 241 16 001 2 240 929 316 212 167 616 West Rand 16 385 14 129 2 256 851 331 228 204 642 Total 313 574 182 638 130 936 12 384 4 300 2 927 2 336 108 989 Mpumalanga Ehlanzeni 49 134 39 862 9 272 4 759 1 102 730 545 2 136 Gert Sibande 21 026 15 980 5 046 2 490 680 444 334 1 098 Nkangala 23 681 19 449 4 232 2 128 626 379 251 848 Total 93 841 75 291 18 550 9 377 2 408 1 553 1 130 4 082 Limpopo Capricorn 35 152 30 858 4 294 2 488 484 347 256 719 Greater Sekhukhune 20 682 17 426 3 256 1 916 399 268 154 519 Mopani 28 802 25 387 3 415 1 781 415 256 195 768 Vhembe 31 269 26 879 4 390 2 751 551 316 202 570 Waterberg 17 476 15 184 2 292 1 288 298 185 131 390 Total 133 381 115 734 17 647 10 224 2 147 1 372 938 2 966 Foreign 9 595 247 9 348 60 30 18 21 9 219 Unspecified 1035 507 528 41 5 9 8 465

Statistics South Africa P0305
Recorded live births, 2011
23
Appendix C: Birth registrations by registration status, sex, province and district municipality, 2011
Province and district municipality
Total registrations Current registrations Late registrations
Total Male Female Total Male Female Before age 15 From age 15
Total Male Female Total Male Female
Total - South Africa 1 202 377 605 170 597 207 911 353 459 194 452 159 174 091 87 338 86 753 116 933 58 638 58 295
Western Cape
Cape Winelands 13 805 6 945 6 860 12 603 6 329 6 274 1 194 614 580 8 2 6
Central Karoo 1 139 619 520 1 065 578 487 74 41 33 0 0 0 City of Cape Town
75 223 38 059 37 164 66 936 33 871 33 065 8 021 4 047 3 974 266 141 125
Eden 10 029 5 040 4 989 8 972 4 498 4 474 1 055 542 513 2 0 2
Overberg 3 051 1 546 1 505 2 568 1 292 1 276 481 252 229 2 2 0
West Coast 6 142 3 077 3 065 5 323 2 667 2 656 818 410 408 1 0 1
Total 109 389 55 286 54 103 97 467 49 235 48 232 11 643 5 906 5 737 279 145 134
Eastern Cape
Alfred Nzo 15 483 7 653 7 830 12 138 5 995 6 143 3 306 1 639 1 667 39 19 20
Amatole 14 764 7 355 7 409 11 793 5 854 5 939 2 928 1 478 1 450 43 23 20
Buffalo city 16 234 8 220 8 014 14 766 7 478 7 288 1 459 739 720 9 3 6
Cacadu 7 132 3 692 3 440 6 044 3 168 2 876 1 086 523 563 2 1 1
Chris Hani 14 926 7 481 7 445 12 472 6 261 6 211 2 424 1 201 1 223 30 19 11
Joe Gqabi 6 313 3 125 3 188 4 967 2 474 2 493 1 328 641 687 18 10 8
Nelson Mandela Bay Metro 20 572 10 417 10 155 18 326 9 291 9 035 2 237 1 120 1 117 9 6 3
O.R. Tambo 37 231 18 758 18 473 29 855 15 046 14 809 7 286 3 670 3 616 90 42 48
Total 132 655 66 701 65 954 110 361 55 567 54 794 22 054 11 011 11 043 240 123 117
Northern Cape
Frances Baard 9 291 4 730 4 561 8 423 4 312 4 111 863 416 447 5 2 3
John Taolo Gaetsewe 5 848 3 063 2 785 5 363 2 803 2 560 481 259 222 4 1 3
Namakwa 1 467 732 735 1 369 683 686 98 49 49 0 0 0
Pixley ka Seme 4 124 2 044 2 080 3 386 1 689 1 697 735 353 382 3 2 1
Siyanda 4 883 2 470 2 413 4 279 2 184 2 095 600 283 317 4 3 1
Total 25 613 13 039 12 574 22 820 11 671 11 149 2 777 1 360 1 417 16 8 8
Free State
Fezile Dabi 9 141 4 534 4 607 7 569 3 754 3 815 1 566 777 789 6 3 3
Lejweleputswa 12 761 6 425 6 336 10 839 5 459 5 380 1 915 960 955 7 6 1
Mangaung 18 528 9 249 9 279 16 688 8 356 8 332 1 812 878 934 18 15 13
Thabo Mofutsanyane 16 198 8 112 8 086 14 227 7 130 7 097 1 956 974 982 15 8 7
Xhariep 1 602 793 809 1 248 616 632 352 177 175 2 0 2
Total 58 230 29 113 29 117 50 571 25 315 25 256 7 601 3 766 3 835 58 32 26

Statistics South Africa P0305
Recorded live births, 2011
24
Appendix C: Birth registrations by registration status, sex, province and district municipality, 2011 (concluded)
Province and district municipality
Total registrations Current registrations Late registrations
Total Male Female Total Male Female Before age 15 From age 15
Total Male Female Total Male Female
Total- South Africa 1 202 377 605 170 597 207 911 353 459 194 452 159 174 091 87 338 86 753 116 933 58 638 58 295
KwaZulu-Natal
Amajuba 12 819 6 466 6 353 10 164 5 128 5 036 2 622 1 317 1 305 33 21 12 eThekwini 77 262 38 998 38 264 59 873 30 234 29 639 13 107 6 570 6 537 4 282 2 194 2 088 iLembe 10 195 5 155 5 040 7 658 3 884 3 774 2 524 1 265 1 259 13 6 7 Sisonke 14 118 7 133 6 985 10 852 5 497 5 355 3 229 1 620 1 609 37 16 21 Ugu 15 483 7 756 7 727 12 949 6 470 6 479 2 484 1 262 1 222 50 24 26 UMgungundlovu 20 655 10 390 10 265 15 984 8 031 7 953 4 627 2 339 2 288 44 20 24
Umkhanyakude 15 659 7 879 7 780 11 107 5 634 5 473 4 487 2 208 2 279 65 37 28
Umzinyathi 13 200 6 611 6 589 9 606 4 823 4 783 3 556 1 766 1 790 38 22 16 Uthukela 15 720 7 889 7 831 12 184 6 115 6 069 3 507 1 759 1 748 29 15 14 Uthungulu 24 712 12 235 12 477 18 611 9 173 9 438 6 057 3 037 3 020 44 25 19 Zululand 21 341 10 355 10 986 16 219 7 773 8 446 5 089 2 561 2 528 33 21 12 Total 241 164 120 867 120 297 185 207 92 762 92 445 51 289 25 704 25 585 4 668 2 401 2 267 North West Bojanala 38 323 19 383 18 940 32 909 16 718 16 191 5 385 2 651 2 734 29 14 15 Dr Kenneth Kaunda 15 060 7 518 7 542 12 759 6 389 6 370 2 295 1 127 1 168 6 2 4
Dr Ruth Segomotsi 19 242 9 706 9 536 15 822 7 963 7 859 3 405 1 735 1 670 15 8 7
Ngaka Modiri Molema 11 275 5 648 5 627 9 020 4 543 4 477 2 241 1 098 1 143 14 7 7
Total 83 900 42 255 41 645 70 510 35 613 34 897 13 326 6 611 6 715 64 31 33 Gauteng City of Johannesburg 69 320 35 040 34 280 59 642 30 236 29 406 9 650 4 788 4 862 28 16 12
City of Tshwane 147 935 74 315 73 620 39 659 20 076 19 583 7 041 3 581 3 460 101 235 50 658 50 577 Ekurhuleni 61 693 31 046 30 647 53 207 26 728 26 479 8 434 4 287 4 147 52 31 21 Sedibeng 18 241 9 271 8 970 16 001 8 116 7 885 2 225 1 145 1 080 15 10 5 West Rand 16 385 8 295 8 090 14 129 7 151 6 978 2 251 1 141 1 110 5 3 2 Total 313 574 157 967 155 607 182 638 92 307 90 331 29 601 14 942 14 659 101 335 50 718 50 617 Mpumalanga Ehlanzeni 49 134 24 777 24 357 39 862 20 104 19 758 8 913 4 462 4 451 359 211 148 Gert Sibande 21 026 10 538 10 488 15 980 7 983 7 997 4 994 2 527 2 467 52 28 24 Nkangala 23 681 11 887 11 794 19 449 9 724 9 725 4 190 2 146 2 044 42 17 25 Total 93 841 47 202 46 639 75 291 37 811 37 480 18 097 9 135 8 962 453 256 197 Limpopo Capricorn 35 152 17 761 17 391 30 858 15 642 15 216 4 268 2 104 2 164 26 15 11 Greater Sekhukhune 20 682 10 625 10 057 17 426 8 940 8 486 3 226 1 669 1 557 30 16 14
Mopani 28 802 14 467 14 335 25 387 12 748 12 639 3 262 1 638 1 624 153 81 72 Vhembe 31 269 15 749 15 520 26 879 13 557 13 322 4 367 2 180 2 187 23 12 11 Waterberg 17 476 8 815 8 661 15 184 7 656 7 528 2 285 1 155 1 130 7 4 3 Total 133 381 67 417 65 964 115 734 58 543 57 191 17 408 8 746 8 662 239 128 111 Foreign 9 595 4 782 4 813 247 117 130 196 99 97 9 152 4 566 4 586 Unspecified 1 035 541 494 507 253 254 99 58 41 429 230 199

Statistics South Africa P0305
Recorded live births, 2011
25
Appendix D: Birth occurrences by year of birth and age of mother, 2007–2011*
Age of mother Year of birth occurrence
2007 2008 2009 2010 2011
15-19 147 962 151 002 142 125 133 067 113 240
20-24 296 148 297 256 278 118 267 025 251 202
25-29 255 289 266 139 251 777 251 818 244 062
30-34 190 360 190 671 177 834 176 666 169 427
35-39 113 914 112 295 103 593 102 731 99 725
40-44 35 824 35 917 33 214 32 997 29 453
45-49 6 536 5 925 4 708 3 416 2 896
50-54 851 656 436 321 258
Unspecified / outside the 15-54 age range 4 154 3 811 2 631 1 729 1 090
Total 1 051 038 1 063 672 994 436 969 770 911 353 *Figures include updated birth occurrences as at 29 February 2012.
Appendix E: Birth occurrences by province of birth occurrence and age of mother, 2011
Province of birth occurrence
Age of mother
Total 15-19 20-24 25-29 30-34 35-39 40-44 45-49 50-54 Unsp.*
Western Cape 11 435 23 924 26 945 20 239 11 339 3 063 208 5 294 97 452
Eastern Cape 20 170 31 250 25 665 17 161 11 134 3 798 523 18 616 110 335
Northern Cape 3 727 6 353 5 447 4 046 2 357 724 54 4 76 22 788
Free State 7 337 14 939 12 857 8 736 4 883 1 520 112 2 179 50 565
KwaZulu-Natal 32 954 55 521 45 144 27 732 16 273 5 051 797 47 1 714 185 233
North West 9 529 20 025 17 899 12 296 7 806 2 542 246 8 147 70 498
Gauteng 18 058 43 081 50 772 40 012 22 600 6 330 566 22 1 066 182 507
Mpumalanga 13 243 21 111 18 337 12 044 7 381 2 420 347 24 347 75 254
Limpopo 17 282 32 308 28 895 19 553 12 697 4 260 475 9 289 115 768
Foreign 30 50 53 38 21 11 8 0 16 227
Unspecified 98 163 187 149 77 27 4 2 19 726
Total 133 863 248 725 232 201 162 006 96 568 29 746 3 340 141 4 763 911 353
* Unspecified or outside the 15–54 age range

Statistics South Africa P0305
Recorded live births, 2011
26
Appendix F: Birth occurrences by year of birth and province and district municipality of birth occurrence, 2007–2011
Province and district municipality Year of birth 2007 2008 2009 2010 2011
Total- South Africa 1 051 038 1 063 672 994 436 969 770 911 353 Western Cape Cape Winelands 13 231 13 521 13 297 13 140 12 603 Central Karoo 1 195 1 245 1 180 1 065 1 065 City of Cape Town 74 723 76 318 72 731 70 504 66 936 Eden 10 194 10 477 9 890 9 482 8 972 Overberg 2 827 2 956 2 742 2 789 2 568 West Coast 5 844 6 096 5 945 5 621 5 323 Total 108 014 110 613 105 785 102 601 97 467 Eastern Cape Alfred Nzo 18 315 17 168 14 686 13 278 12 138 Amatole 15 153 14 755 13 722 12 103 11 793 Buffalo city 15 645 15 966 15 405 15 330 14 766 Cacadu 7 265 6 859 6 400 6 265 6 044 Chris Hani 17 684 16 987 14 862 13 595 12 472 Joe Gqabi 6 149 6 211 5 866 5 452 4 967 Nelson Mandela Bay Metro 23 245 23 233 21 078 19 570 18 326 O.R. Tambo 39 754 36 849 31 362 31 189 29 855 Total 143 210 138 028 123 381 116 782 110 361 Northern Cape Frances Baard 8 548 8 939 8 732 8 454 8 423 John Taolo Gaetsewe 5 125 5 498 4 951 5 214 5 363 Namakwa 1 507 1 525 1 552 1 492 1 369 Pixley ka Seme 4 375 4 394 4 147 3 985 3 386 Siyanda 4 717 4 461 4 582 4 588 4 279 Total 24 272 24 817 23 964 23 733 22 820 Free State Fezile Dabi 8 853 9 295 8 610 8 369 7 569 Lejweleputswa 11 940 12 668 11 626 11 329 10 839 Mangaung 17 599 17 508 16 763 17 407 16 688 Thabo Mofutsanyane 16 535 16 528 14 986 14 711 14 227 Xhariep 1 741 1 716 1 421 1 453 1 248
Total 56 668 57 715 53 406 53 269 50 571 * Figures include updated birth occurrences as at 29 February 2012.

Statistics South Africa P0305
Recorded live births, 2011
27
Appendix F: Birth occurrences by year of birth and province and district municipality of birth occurrence, 2007–2011 (concluded)
Province and district municipality Year of birth 2007 2008 2009 2010 2011
Total- South Africa 1 051 038 1 063 672 994 436 969 770 911 353 KwaZulu-Natal Amajuba 10 610 12 036 12 083 11 595 10 164 eThekwini 70 709 73 270 67 288 66 820 59 873 iLembe 11 692 12 505 12 175 9 287 7 658 Sisonke 13 649 11 898 11 294 11 505 10 852 Ugu 16 490 17 016 15 426 14 615 12 949 UMgungundlovu 17 018 17 895 17 330 16 936 15 984 Umkhanyakude 15 399 15 313 13 732 12 673 11 107 Umzinyathi 12 461 10 312 8 038 9 798 9 606 Uthukela 15 310 15 320 14 068 13 587 12 184 Uthungulu 26 284 24 837 22 539 20 620 18 611 Zululand 23 280 22 504 19 411 18 684 16 219 Total 232 902 232 906 213 384 206 120 185 207 North West Bojanala 36 601 38 218 35 752 35 440 32 909 Dr Kenneth Kaunda 14 798 15 115 14 460 13 504 12 759 Dr Ruth Segomotsi Mompati 18 681 18 676 17 868 17 187 15 822 Ngaka Modiri Molema 10 639 10 818 10 302 10 064 9 020 Total 80 719 82 827 78 382 76 195 70 510 Gauteng City of Johannesburg 68 311 68 245 64 844 62 901 59 642 City of Tshwane 38 197 39 890 40 470 42 289 39 659 Ekurhuleni 56 290 59 331 55 876 55 037 53 207 Sedibeng 15 770 16 953 17 117 17 176 16 001 West Rand 15 055 15 764 14 444 14 191 14 129 Total 193 623 200 183 192 751 191 594 182 638 Mpumalanga Ehlanzeni 45 109 45 949 42 812 41 271 39 862 Gert Sibande 19 465 19 292 18 456 18 117 15 980 Nkangala 20 733 21 894 21 634 20 000 19 449 Total 85 307 87 135 82 902 79 388 75 291 Limpopo Capricorn 30 278 31 698 29 995 31 563 30 858 Greater Sekhukhune 19 927 20 810 19 384 19 479 17 426 Mopani 24 534 26 271 25 178 25 121 25 387 Vhembe 30 256 30 510 28 262 28 022 26 879 Waterberg 16 216 15 999 15 362 15 167 15 184 Total 121 211 125 288 118 181 119 352 115 734 Foreign 4 907 4 033 2 175 594 247 Unspecified 205 127 125 142 507 * Figures include updated birth occurrences as at 29 February 2012.

Statistics South Africa P0305
Recorded live births, 2011
28
Appendix G: Total birth occurrences by sex, month and citizenship, 1991–1993
Year Month GRAND TOTAL
SA CITIZENS* NON-CITIZENS* OTHER** TOTAL
Male Female Male Female Male Female Male Female
1991 January 85 602 42 726 42 621 83 72 56 44 42 865 42 737
February 75 943 38 204 37 568 58 50 34 29 38 296 37 647
March 84 492 42 083 42 215 64 62 41 27 42 188 42 304
April 80 257 39 968 40 117 57 50 35 30 40 060 40 197
May 81 643 40 663 40 774 59 59 52 36 40 774 40 869
June 85 347 42 840 42 315 64 57 42 29 42 946 42 401
July 78 538 39 248 39 115 63 55 32 25 39 343 39 195
August 81 966 41 071 40 719 52 54 42 28 41 165 40 801
September 93 953 46 572 47 193 65 71 27 25 46 664 47 289
October 78 148 38 963 39 018 56 64 31 16 39 050 39 098
November 73 276 36 237 36 872 61 50 32 24 36 330 36 946
December 82 093 41 028 40 905 50 61 29 20 41 107 40 986
Total 981 258 489 603 489 432 732 705 453 333 490 788 490 470
1992 January 82 366 41 187 40 974 59 63 42 41 41 288 41 078
February 82 073 41 181 40 705 50 58 39 40 41 270 40 803
March 86 799 43 082 43 569 44 47 30 27 43 156 43 643
April 82 188 40 984 41 030 60 57 29 28 41 073 41 115
May 80 852 40 256 40 424 58 48 32 34 40 346 40 506
June 84 271 42 065 42 059 50 53 25 19 42 140 42 131
July 78 788 39 156 39 452 52 58 38 32 39 246 39 542
August 81 366 40 406 40 815 39 59 21 26 40 466 40 900
September 91 553 45 620 45 750 72 52 34 25 45 726 45 827
October 76 670 38 244 38 250 55 55 41 25 38 340 38 330
November 71 945 35 599 36 197 50 49 24 26 35 673 36 272
December 80 696 40 347 40 201 44 54 23 27 40 414 40 282
Total 979 567 488 127 489 426 633 653 378 350 489 138 490 429
1993 January 80 030 39 980 39 881 58 57 29 25 40 067 39 963
February 71 650 35 959 35 560 41 43 26 21 36 026 35 624
March 82 974 41 406 41 400 50 57 34 27 41 490 41 484
April 77 513 38 815 38 565 49 35 22 27 38 886 38 627
May 78 070 38 983 38 933 45 49 32 28 39 060 39 010
June 82 386 41 311 40 925 54 40 28 28 41 393 40 993
July 77 937 38 982 38 821 52 41 21 20 39 055 38 882
August 81 464 40 889 40 436 47 48 19 25 40 955 40 509
September 91 376 45 651 45 580 50 39 30 26 45 731 45 645
October 78 184 39 016 39 025 40 50 27 26 39 083 39 101
November 75 449 37 631 37 679 54 42 17 26 37 702 37 747
December 84 730 42 603 41 992 38 53 25 19 42 666 42 064
Total 961 763 481 226 478 797 578 554 310 298 482 114 479 649 *Figures include updated birth occurrences as at 30 June 2012. ** Other refers to those people whose citizenship was under investigation and had not yet been resolved on 30 June 2012.

Statistics South Africa P0305
Recorded live births, 2011
29
Appendix G.1: Total birth occurrences by sex, month and citizenship, 1994–1996*
Year Month GRAND TOTAL
SA CITIZENS* NON-CITIZENS* OTHER** TOTAL
Male Female Male Female Male Female Male Female
1994 January 81 714 41 012 40 553 51 40 35 23 41 098 40 616
February 74 017 37 089 36 825 44 23 24 12 37 157 36 860
March 81 405 40 773 40 501 46 35 25 25 40 844 40 561
April 82 634 41 195 41 302 49 36 25 27 41 269 41 365
May 80 235 40 169 39 929 46 41 22 28 40 237 39 998
June 83 506 41 590 41 763 46 47 32 28 41 668 41 838
July 78 103 39 241 38 719 39 47 36 21 39 316 38 787
August 81 832 40 959 40 741 35 41 24 32 41 018 40 814
September 90 015 45 156 44 730 45 44 22 18 45 223 44 792
October 78 669 39 472 39 058 42 44 22 31 39 536 39 133
November 74 378 37 094 37 156 42 34 23 29 37 159 37 219
December 84 260 42 238 41 912 27 32 34 17 42 299 41 961
Total 970 768 485 988 483 189 512 464 324 291 486 824 483 944
1995 January 80 784 40 435 40 211 25 37 35 41 40 271 40 289
February 70 905 35 538 35 242 31 25 31 38 35 304 35 305
March 79 152 39 680 39 319 42 35 42 34 39 403 39 388
April 75 813 37 748 37 924 33 37 37 34 37 994 37 995
May 78 551 39 527 38 882 42 37 22 41 38 946 38 960
June 81 271 40 832 40 314 26 37 31 31 40 371 40 382
July 77 675 38 643 38 900 29 27 32 44 38 961 38 971
August 80 174 40 290 39 752 34 42 23 33 39 809 39 827
September 88 736 44 294 44 274 40 34 42 52 44 356 44 360
October 77 145 38 392 38 620 34 35 30 34 38 684 38 689
November 72 645 36 362 36 174 19 26 30 34 36 223 36 234
December 81 527 40 900 40 503 33 22 39 30 40 575 40 555
Total 944 378 472 641 470 115 388 394 394 446 470 897 470 955
1996 January 84 601 42 228 42 255 22 28 34 34 42 284 42 317
February 74 503 37 368 37 019 30 22 40 24 37 438 37 065
March 82 028 40 805 41 130 21 20 27 25 40 853 41 175
April 78 696 39 655 38 960 21 24 16 20 39 692 39 004
May 80 372 40 164 40 097 30 27 22 32 40 216 40 156
June 84 320 42 350 41 867 25 21 28 29 42 403 41 917
July 79 956 39 940 39 920 26 26 21 23 39 987 39 969
August 82 397 41 320 40 957 17 28 41 34 41 378 41 019
September 91 218 45 624 45 477 25 19 36 37 45 685 45 533
October 77 741 39 182 38 463 20 27 25 24 39 227 38 514
November 72 966 36 424 36 471 12 20 22 17 36 458 36 508
December 83 192 41 827 41 235 30 25 33 42 41 890 41 302
Total 971 990 486 887 483 851 279 287 345 341 487 511 484 479 *Figures include updated birth occurrences as at 30 June 2012. ** Other refers to those people whose citizenship was under investigation and had not yet been resolved on 30 June 2012.

Statistics South Africa P0305
Recorded live births, 2011
30
Appendix G.2: Total birth occurrences by sex, month and citizenship, 1997–1999*
Year Month GRAND TOTAL
SA CITIZENS* NON-CITIZENS* OTHER** TOTAL
Male Female Male Female Male Female Male Female
1997 January 82 883 41 481 41 325 12 14 20 31 41 513 41 370
February 73 872 36 937 36 866 13 13 27 16 36 977 36 895
March 84 445 42 268 42 078 19 15 38 27 42 325 42 120
April 79 181 39 442 39 666 17 19 17 20 39 476 39 705
May 79 029 39 479 39 478 21 16 16 19 39 516 39 513
June 81 389 40 544 40 775 15 14 24 17 40 583 40 806
July 80 252 40 184 40 003 19 10 14 22 40 217 40 035
August 80 784 40 240 40 468 20 6 23 27 40 283 40 501
September 88 797 44 585 44 143 13 10 23 23 44 621 44 176
October 76 110 38 280 37 773 10 9 19 19 38 309 37 801
November 71 080 35 712 35 292 14 10 26 26 35 752 35 328
December 80 595 40 287 40 239 14 13 26 16 40 327 40 268
Total 958 417 479 439 478 106 187 149 273 263 479 899 478 518
1998 January 81 618 40 583 40 945 20 11 30 29 40 633 40 985
February 73 739 36 849 36 824 10 11 33 12 36 892 36 847
March 83 078 41 553 41 454 14 19 24 14 41 591 41 487
April 77 833 38 594 39 173 18 10 13 25 38 625 39 208
May 78 762 39 563 39 127 15 15 27 15 39 605 39 157
June 79 871 39 932 39 882 18 11 21 7 39 971 39 900
July 77 379 38 886 38 425 8 17 21 22 38 915 38 464
August 79 059 39 293 39 695 15 13 21 22 39 329 39 730
September 87 389 43 856 43 464 20 13 19 17 43 895 43 494
October 75 310 37 654 37 580 17 14 21 24 37 692 37 618
November 69 875 35 027 34 781 12 10 19 26 35 058 34 817
December 78 042 38 923 39 078 12 6 11 12 38 946 39 096
Total 941 955 470 713 470 428 179 150 260 225 471 152 470 803
1999 January 79 653 39 742 39 838 10 16 29 18 39 781 39 872
February 70 830 35 557 35 233 8 12 11 9 35 576 35 254
March 82 315 40 984 41 256 13 13 28 21 41 025 41 290
April 81 469 40 542 40 861 14 14 17 21 40 573 40 896
May 82 251 41 012 41 149 18 22 32 18 41 062 41 189
June 82 572 41 266 41 241 6 14 25 20 41 297 41 275
July 79 209 39 647 39 487 23 11 18 23 39 688 39 521
August 80 138 40 111 39 948 14 17 20 28 40 145 39 993
September 88 012 44 146 43 800 13 13 18 22 44 177 43 835
October 76 271 37 940 38 266 14 18 16 17 37 970 38 301
November 72 953 36 844 36 069 10 6 11 13 36 865 36 088
December 81 699 40 839 40 806 17 9 9 19 40 865 40 834
Total 957 372 478 630 477 954 160 165 234 229 479 024 478 348 *Figures include updated birth occurrences as at 30 June 2012. ** Other refers to those people whose citizenship as under investigation and had not yet been resolved on 30 June 2012

Statistics South Africa P0305
Recorded live births, 2011
31
Appendix G.3: Total birth occurrences by sex, month and citizenship, 2000–2002*
Year Month GRAND TOTAL
SA CITIZENS* NON-CITIZENS* OTHER** TOTAL
Male Female Male Female Male Female Male Female
2000 January 84 816 42 480 42 292 7 16 7 14 42 494 42 322
February 78 925 39 625 39 261 13 5 11 10 39 649 39 276
March 85 202 42 616 42 531 14 15 7 19 42 637 42 565
April 80 620 40 268 40 311 9 6 11 15 40 288 40 332
May 82 195 40 971 41 171 9 13 11 20 40 991 41 204
June 82 613 41 396 41 187 6 10 5 6 41 407 41 206
July 79 766 39 886 39 853 8 11 6 3 39 900 39 866
August 80 758 40 612 40 118 6 9 6 5 40 624 40 134
September 86 851 43 521 43 298 12 11 7 4 43 540 43 311
October 76 728 38 532 38 158 15 9 8 4 38 555 38 173
November 72 578 36 263 36 292 8 8 3 3 36 274 36 304
December 77 866 39 014 38 829 12 15 2 1 39 028 38 838
Total 968 920 485 184 483 301 119 128 84 104 485 387 483 531
2001 January 85 892 43 059 42 804 13 8 5 3 43 077 42 815
February 73 482 36 585 36 865 15 9 6 2 36 606 36 876
March 83 929 42 144 41 757 9 11 2 6 42 155 41 774
April 79 974 40 033 39 908 13 7 7 6 40 053 39 921
May 81 147 40 450 40 672 9 6 8 2 40 467 40 680
June 80 212 39 918 40 271 8 8 1 6 39 927 40 285
July 78 113 39 383 38 699 13 9 5 4 39 401 38 712
August 78 841 39 393 39 424 10 6 3 5 39 406 39 435
September 85 378 42 901 42 458 7 8 4 0 42 912 42 466
October 76 019 37 785 38 204 13 10 3 4 37 801 38 218
November 71 827 36 170 35 633 10 6 5 3 36 185 35 642
December 77 982 39 265 38 690 7 10 5 5 39 277 38 705
Total 952 796 477 086 475 385 127 98 54 46 477 267 475 529
2002 January 85 783 43 046 42 705 11 7 6 8 43 063 42 720
February 75 583 37 845 37 721 5 5 4 3 37 854 37 729
March 82 277 40 924 41 323 8 7 7 8 40 939 41 338
April 78 447 39 074 39 345 11 9 3 5 39 088 39 359
May 80 996 40 338 40 637 8 9 1 3 40 347 40 649
June 81 813 41 017 40 768 11 10 2 5 41 030 40 783
July 81 261 40 510 40 732 4 6 7 2 40 521 40 740
August 80 105 40 531 39 548 10 8 4 4 40 545 39 560
September 87 605 44 058 43 520 8 13 3 3 44 069 43 536
October 77 745 38 667 39 047 12 8 7 4 38 686 39 059
November 72 003 36 152 35 830 6 7 4 4 36 162 35 841
December 79 287 39 746 39 514 10 12 2 3 39 758 39 529
Total 962 905 481 908 480 690 104 101 50 52 482 062 480 843 *Figures include updated birth occurrences as at 30 June 2012. ** Other refers to those people whose citizenship was under investigation and had not yet been resolved on 30 June 2012.

Statistics South Africa P0305
Recorded live births, 2011
32
Appendix G.4: Total birth occurrences by sex, month and citizenship, 2003–2005*
Year Month GRAND TOTAL
SA CITIZENS* NON-CITIZENS* OTHER** TOTAL
Male Female Male Female Male Female Male Female
2003 January 84 106 42 272 41 813 10 7 3 1 42 285 41 821
February 74 835 37 504 37 308 11 6 3 3 37 518 37 317
March 85 388 42 769 42 602 4 7 1 5 42 774 42 614
April 80 297 40 301 39 973 7 11 4 1 40 312 39 985
May 81 438 40 911 40 503 12 6 5 1 40 928 40 510
June 80 743 40 513 40 204 4 12 5 5 40 522 40 221
July 78 415 39 364 39 036 7 4 2 2 39 373 39 042
August 79 417 39 794 39 606 5 5 3 4 39 802 39 615
September 87 725 44 189 43 515 11 3 4 3 44 204 43 521
October 75 841 37 912 37 899 13 12 4 1 37 929 37 912
November 70 181 35 234 34 922 7 7 7 4 35 248 34 933
December 78 027 39 348 38 657 9 4 4 5 39 361 38 666
Total 956 413 480 111 476 038 100 84 45 35 480 256 476 157
2004 January 84 058 42 427 41 612 5 7 3 4 42 435 41 623
February 77 021 38 957 38 042 6 10 5 1 38 968 38 053
March 84 718 42 496 42 196 14 6 1 5 42 511 42 207
April 81 438 40 995 40 424 8 4 3 4 41 006 40 432
May 83 724 41 884 41 815 9 6 5 5 41 898 41 826
June 84 943 42 532 42 392 8 5 4 2 42 544 42 399
July 85 032 42 813 42 194 11 6 3 5 42 827 42 205
August 87 742 44 182 43 531 9 7 7 6 44 198 43 544
September 95 306 47 775 47 508 10 4 6 3 47 791 47 515
October 82 186 41 181 40 983 13 7 1 1 41 195 40 991
November 79 692 39 893 39 773 3 9 8 6 39 904 39 788
December 85 959 43 267 42 673 7 6 4 2 43 278 42 681
Total 1 011 819 508 402 503 143 103 77 50 44 508 555 503 264
2005 January 89 251 45 161 44 067 8 4 6 5 45 175 44 076
February 80 831 40 663 40 145 9 7 4 3 40 676 40 155
March 92 182 46 115 46 038 6 14 4 5 46 125 46 057
April 88 518 44 318 44 178 6 10 4 2 44 328 44 190
May 91 734 46 118 45 592 11 4 4 5 46 133 45 601
June 90 033 44 992 45 024 6 6 3 2 45 001 45 032
July 87 479 43 945 43 517 6 4 3 4 43 954 43 525
August 87 449 44 175 43 250 7 4 7 6 44 189 43 260
September 92 359 46 391 45 950 8 4 4 2 46 403 45 956
October 81 542 41 158 40 361 4 6 6 7 41 168 40 374
November 80 578 40 643 39 914 8 3 5 5 40 656 39 922
December 89 439 44 992 44 426 6 8 4 3 45 002 44 437
Total 1 051 395 528 671 522 462 85 74 54 49 528 810 522 585 *Figures include updated birth occurrences as at 30 June 2012. ** Other refers to those people whose citizenship was under investigation and had not yet been resolved on 30 June 2012.

Statistics South Africa P0305
Recorded live births, 2011
33
Appendix G.5: Total birth occurrences by sex, month and citizenship, 2006–2008*
Year Month GRAND TOTAL
SA CITIZENS* NON-CITIZENS* OTHER** TOTAL
Male Female Male Female Male Female Male Female
2006 January 93 423 46 892 46 502 7 5 13 4 46 912 46 511
February 84 560 42 246 42 295 8 6 3 2 42 257 42 303
March 94 144 47 046 47 074 1 4 10 9 47 057 47 087
April 90 074 45 078 44 970 4 7 9 6 45 091 44 983
May 93 265 46 904 46 336 8 5 8 4 46 920 46 345
June 91 489 45 907 45 561 7 5 6 3 45 920 45 569
July 89 937 45 093 44 831 2 5 5 1 45 100 44 837
August 90 169 45 172 44 975 9 5 2 6 45 183 44 986
September 97 677 48 974 48 686 3 4 6 4 48 983 48 694
October 84 974 42 735 42 220 6 4 5 4 42 746 42 228
November 80 528 40 777 39 735 3 6 2 5 40 782 39 746
December 87 175 44 071 43 080 7 3 7 7 44 085 43 090
Total 1 077 415 540 895 536 265 65 59 76 55 541 036 536 379
2007 January 94 809 47 550 47 237 8 4 3 7 47 561 47 248
February 82 136 41 477 40 645 6 3 2 3 41 485 40 651
March 93 400 46 984 46 390 6 4 8 8 46 998 46 402
April 90 553 45 362 45 176 2 4 4 5 45 368 45 185
May 93 309 46 715 46 566 10 6 4 8 46 729 46 580
June 89 420 45 201 44 202 7 7 0 3 45 208 44 212
July 88 833 44 545 44 272 7 2 5 2 44 557 44 276
August 87 413 43 897 43 503 5 1 2 5 43 904 43 509
September 92 637 46 698 45 912 4 7 4 12 46 706 45 931
October 80 902 40 888 39 998 4 4 4 4 40 896 40 006
November 78 519 39 454 39 054 5 1 3 2 39 462 39 057
December 86 405 43 708 42 682 6 4 3 2 43 717 42 688
Total 1 058 336 532 479 525 637 70 47 42 61 532 591 525 745
2008 January 92 865 46 739 46 113 3 1 2 7 46 744 46 121
February 87 015 43 777 43 227 3 3 2 3 43 782 43 233
March 95 135 47 601 47 526 1 1 3 3 47 605 47 530
April 89 947 45 106 44 828 2 3 3 5 45 111 44 836
May 89 692 44 933 44 743 4 1 5 6 44 942 44 750
June 88 653 44 577 44 063 2 5 2 4 44 581 44 072
July 90 981 45 472 45 499 0 5 1 4 45 473 45 508
August 90 552 45 722 44 821 1 2 4 2 45 727 44 825
September 97 163 49 105 48 046 2 5 3 2 49 110 48 053
October 83 934 41 979 41 942 6 2 3 2 41 988 41 946
November 80 964 40 850 40 108 1 1 2 2 40 853 40 111
December 89 642 45 309 44 325 3 3 1 1 45 313 44 329
Total 1 076 543 541 170 535 241 28 32 31 41 541 229 535 314 *Figures include updated birth occurrences as at 30 June 2012. ** Other refers to those people whose citizenship was under investigation and had not yet been resolved on 30 June 2012.

Statistics South Africa P0305
Recorded live births, 2011
34
Appendix G.6: Total birth occurrences by sex, month and citizenship, 2009–2011*
Year Month GRAND TOTAL
SA CITIZENS* NON-CITIZENS* OTHER** TOTAL
Male Female Male Female Male Female Male Female
2009 January 92 302 46 591 45 699 5 1 3 3 46 599 45 703
February 81 689 41 052 40 628 3 2 3 1 41 058 40 631
March 92 456 46 590 45 856 2 2 4 2 46 596 45 860
April 84 601 42 445 42 151 2 0 2 1 42 449 42 152
May 86 374 43 121 43 239 8 1 2 3 43 131 43 243
June 85 977 43 386 42 586 1 1 2 1 43 389 42 588
July 85 319 42 708 42 605 0 0 5 1 42 713 42 606
August 84 650 42 590 42 050 5 0 2 3 42 597 42 053
September 89 397 45 043 44 344 2 1 3 4 45 048 44 349
October 77 906 39 458 38 444 1 2 0 1 39 459 38 447
November 75 877 38 318 37 555 0 0 2 2 38 320 37 557
December 83 210 41 996 41 214 0 0 0 0 41 996 41 214
Total 1 019 758 513 298 506 371 29 10 28 22 513 355 506 403
2010 January 85 888 43 283 42 603 0 0 2 0 43 285 42 603
February 76 810 38 688 38 119 0 0 2 1 38 690 38 120
March 87 235 44 005 43 226 1 1 1 1 44 007 43 228
April 81 858 41 201 40 652 0 0 3 2 41 204 40 654
May 82 486 41 733 40 743 0 1 3 6 41 736 40 750
June 82 842 41 734 41 107 0 0 0 1 41 734 41 108
July 83 490 42 161 41 326 0 0 0 3 42 161 41 329
August 82 595 41 925 40 669 0 0 1 0 41 926 40 669
September 87 984 44 514 43 468 0 0 1 1 44 515 43 469
October 76 010 38 171 37 838 0 0 0 1 38 171 37 839
November 73 131 36 858 36 271 0 0 1 1 36 859 36 272
December 80 733 40 648 40 079 3 0 2 1 40 653 40 080
Total 981 062 494 921 486 101 4 2 16 18 494 941 486 121
2011 January 80 977 40 798 40 177 0 0 2 0 40 800 40 177
February 77 018 39 000 38 017 0 0 1 0 39 001 38 017
March 88 961 45 045 43 911 0 0 3 2 45 048 43 913
April 81 158 40 598 40 560 0 0 0 0 40 598 40 560
May 84 629 42 567 42 060 0 0 1 1 42 568 42 061
June 81 397 41 003 40 393 0 0 0 1 41 003 40 394
July 79 646 40 344 39 297 0 0 3 2 40 347 39 299
August 79 751 40 130 39 620 0 0 1 0 40 131 39 620
September 83 652 42 162 41 488 0 0 0 2 42 162 41 490
October 73 460 36 758 36 700 0 0 2 0 36 760 36 700
November 71 460 36 162 35 297 0 0 1 0 36 163 35 297
December 75 171 38 008 37 162 0 0 1 0 38 009 37 162
Total 957 280 482 575 474 682 0 0 15 8 482 590 474 690 *Figures include updated birth occurrences as at 30 June 2012. ** Other refers to those people whose citizenship was under investigation and had not yet been resolved on 30 June 2012.

Statistics South Africa P0305
Recorded live births, 2011
35
Explanatory Notes Sources of data
The Department of Home Affairs (DHA) provides Statistics South Africa (Stats SA) with information on recorded live births. Two sets of birth statistics are provided: registration-based and occurrence-based data. These data sets both come from the Nucleus Bureau of the DHA. When the officials at the various offices of the Department of Home Affairs capture the information about a birth, they do so directly onto the database at Nucleus Bureau. These transactions are used to update the database of the birth register.
For the purpose of producing vital statistics, the following system is followed: each day, all the civil transactions carried out at all the Department of Home Affairs offices are written onto a cassette. At the end of every month, a combined set of cassettes is created containing all the transactions done for the month. These transactions are downloaded and the birth transactions are extracted for processing at Stats SA. The year in which the births are registered is the registration year. Using this information, Stats SA provides the breakdown of the registered births according to the year in which the births occurred.
While birth information sent to Stats SA is the same as that in the population register, there is a difference of format between the two. On one hand, Stats SA’s data are based on births registered during the year (registration-based), while on the other hand, entries in the population register reflect the date of birth. The date of registration of birth is not stored on the population registration file. For this reason, the population register can only be used to obtain birth data broken down by date of birth (occurrence-based).
By continuously updating the population register for late registration, the occurrence-based data from the population register get closer and closer to the true level of births. In a situation where birth registrations are complete (with very few late registrations), the occurrence-based perspective (with births updated for late registrations) will be very similar to the registration-based perspective (with all birth registrations considered, irrespective of the year of birth). However, if there is a large number of late registrations, the two perspectives will become widely dissimilar. With improvements in birth registration, the recorded data from the two sources will gradually converge.
The South African population register
The South African population register covers births, deaths, identity, marriages, divorces and movements of all South African citizens and permanent residents. The Births and Deaths Registration Act, 1992 (Act No. 51 of 1992) guides the registration of births and deaths throughout South Africa. The Act was subsequently amended in 1997 (Act No. 67 of 1997), in 1998 (Act No. 43 of 1998) and in 2010 (Act No. 18 of 2010). Another Act pertinent to the population register is the Identification Act, 1997 (Act No. 68 of 1997). This Act repealed previous Identification Acts (Act No.72 of 1986, Act No. 21 of 1991, Act No. 4 of 1993, and Act No. 47 of 1995). Thus, each of the Acts dealing with any aspect of civil registration has implications for the information recorded into the Population Register.
From these Acts and amendments, the following persons and particulars are eligible to be included on the population register:
All children born of South African citizens and permanent residents when the notice of the birth is given within one year after the birth of the child.
All children born of South African citizens and permanent residents when the notice of the birth is given one year after the birth of the child together with the prescribed requirement for a late registration of birth.
All South African citizens and permanent residents who, upon attainment of the age of 16, applied for and were granted identification cards (or books).

Statistics South Africa P0305
Recorded live births, 2011
36
All South African citizens and permanent residents who die at any age after birth. All South African citizens and permanent residents who depart permanently from South Africa. Persons whose particulars are not eligible for inclusion on the population register are listed below:
o Non-South African citizens who sojourn temporarily in the country. o All South African citizens and permanent residents who died before notice of their birth had been
given.
Municipal demarcation
The Department of Home Affairs captures information on places based on magisterial districts using the Twelfth Edition of the Standard Code List of Areas (Central Statistics Services, 1995). Stats SA re-classified the magisterial districts into district councils and metropolitan areas based on the 2010 municipal boundaries. Certain magisterial districts are situated in more than one district council, in which case such magisterial districts are allocated to the district council where the majority of the land area falls. The only exception was with Nigel in Gauteng province. The majority of the land area of Nigel magisterial district is in Sedibeng district council (which is mainly farm areas and therefore sparsely populated) while the majority of the population lives in Ekurhuleni metropolitan area. As such, Nigel was classified to Ekurhuleni not Sedibeng. Maps for the old and the new classification are available from Stats SA on request.
Population group
As from 1991, no distinction is made between the different population groups on the data collected by the Department of Home Affairs. The statistics collected, therefore, refer to all population groups combined.
Definitions of concepts used
1.1 Live birth
The complete expulsion or extraction from its mother’s womb of a product of conception, irrespective of the duration of pregnancy, which, after such separation, breathes or shows any other evidence of life, such as beating of the heart, pulsation of the umbilical cord, or definite movement of voluntary muscles, whether or not the umbilical cord has been cut or the placenta is attached. Each product of such a birth is considered live born (WHO, 1992).
1.2 Recorded live births
The number of births recorded (registered) in a specific year, irrespective of when the birth actually occurred. The births recorded in any given year include the births that occurred during that year plus other births that occurred in years prior to the year of registration. It should be noted that not all births are recorded (registered).
1.3 Late registration
Births occurring in a given calendar year but recorded in subsequent calendar years. In this release, late registrations are grouped into two: (i) births registered after one year of birth but less than 15 years after birth; and (ii) births registered from 15 years after birth.
1.4 Current live births
Births occurring in a specific year and registered within that same year.