Whole Genome Analysis Illustrates Global Clonal Population ...

© 2015 Hypoport AG
Record half-year results for Hypoport Financial figures for the first half-year of 2015

Fin
ancia
l figure
s H
1 2
015
Content
1. Market environment
2. Performance of business units
3. Overview of key performance indicators
4. Hypoportʼs shares
5. Outlook

Fin
ancia
l figure
s H
1 2
015
3
Continuous decline in long-term interest rates broken in Q2
Development of important interest rates and mortgage finance volume in Germany
5,0 billion €
10,0 billion €
15,0 billion €
20,0 billion €
25,0 billion €
0,0%
1,0%
2,0%
3,0%
4,0%
5,0%
6,0%
ECB interest rate
Guaranteed interest of insurance
DGZF 10-years
Mortgage volume Bundesbank

Fin
ancia
l figure
s H
1 2
015
4
Profound transformation process in market environment for financial services
Development of market environment for relevant financial service products
Private financing Private Clients, Financial Service Providers
Private insurance Private Clients
Bausparen Financial Service Providers, Private Clients,
Institutional Clients
Commercial financing Institutional Clients
• Low-interest
environment keeps life
insurance / private
health insurance
unappealing
• Ongoing high
regulatory pressure
• Positive impetus from
interest environment
• Growth of overall market
(New business for
mortgage finance Jan. to
May 2015: +21%)
• Residential Credit
Directive occupies product
providers
• Interest environment
provides positive stimuli
for business transactions
• Investments in new
buildings will increase
• Higher demand for
interest rate hedging.
Still low demand as
saving product.
Client demand Providers/products Regulation

Fin
ancia
l figure
s H
1 2
015
Content
1. Market environment
2. Performance of business units
3. Overview of key performance indicators
4. Hypoportʼs shares
5. Outlook

Fin
ancia
l figure
s H
1 2
015
6
Business unit Private Clients
Presentation of segment results

Fin
ancia
l figure
s H
1 2
015
Transaction volume: Financing (billion €)
3.86 4.59
5.42 6.30
2.96 4.53
2011 2012 2013 2014 H1 2014 H1 2015
CAGR: +18%
7
Rapid growth in mortgage finance business
Private Clients: Transaction volume of product segment financing and number of active advisors
• Ongoing rise in market share of mortgage
finance.
• Focus on Bausparen for interest rate hedging
enables slight increase in volume.
• Highly competitive online market for personal
loans. Focus on profitable on-site consulting
by franchise operations.
• Customer access further extended by
expansion of online marketing.
• Growth and productivity increase of active
advisors.
Franchise: Active advisors (number)
397 433
2014 H1 2015
+ 9%
+ 53%
Transaction volumen: Product segments (billion €)
H1 2015
Personal loan:
0.094 / -28%
Bausparen:
0.113 / +5%
Mortgage finance:
4.3 / +59%

Fin
ancia
l figure
s H
1 2
015
Insurance policies under management (million €,
annual premiums)
28.5 43.7
66.7
93.1 110.7 119.8
2010 2011 2012 2013 2014 H1 2015
CAGR: +36%
8
Automation leads to gain in efficiency in insurance sales
Private Clients: Insurance policies under management and number of active advisors
• Growth for insurance policies under
management, particularly in sustainable and
high-margin SHUK segment (e. g. car and
liability insurance).
• New business of health (PKV) and life
insurance (LV) remains under pressure due
to new regulation and low interest rates.
• Focus on advisors with successful
sustainable portfolio management.
• Advancing automation in sales and portfolio
processes in insurance business enables
further economies of scale.
Franchise: Active advisors (number)
266 247
2014 H1 2015
- 7%
+ 8%
Insurance policies u. m.: Product segments (million €)
H1 2015
SHUK:
24.9 / +14%
PKV:
32.7 / +6%
LV:
62.2 / +7%
Fin
ancia
l figure
s H
1 2
015
Revenue (million €)
Gross profit (million €)
EBIT (million €)
9
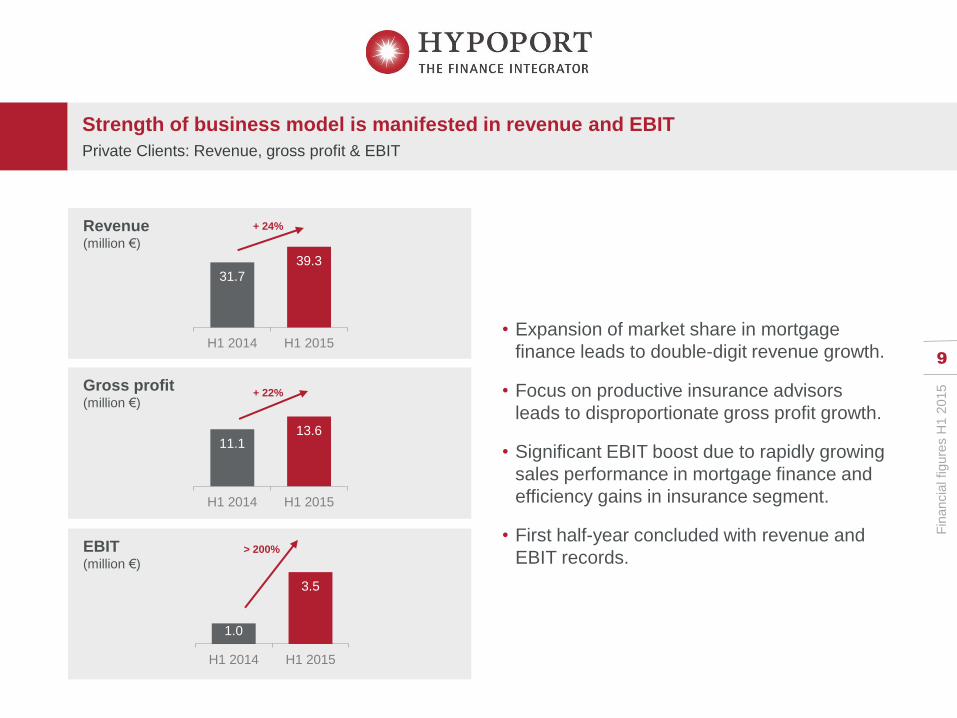
Strength of business model is manifested in revenue and EBIT
Private Clients: Revenue, gross profit & EBIT
• Expansion of market share in mortgage
finance leads to double-digit revenue growth.
• Focus on productive insurance advisors
leads to disproportionate gross profit growth.
• Significant EBIT boost due to rapidly growing
sales performance in mortgage finance and
efficiency gains in insurance segment.
• First half-year concluded with revenue and
EBIT records.
31.7
39.3
H1 2014 H1 2015
11.1 13.6
H1 2014 H1 2015
1.0
3.5
H1 2014 H1 2015
> 200%
+ 24%
+ 22%

Fin
ancia
l figure
s H
1 2
015
10
Business unit Financial Service Providers
Presentation of segment results

Fin
ancia
l figure
s H
1 2
015
11
EUROPACE accomplishes new transaction record of 22,9 billion €
Financial Service Providers: Transaction volume and number of partners
• Mortgage finance on EUROPACE captures
further market share.
• Bauspar volume profits from optimised cross-
selling solution on EUROPACE marketplace.
• New sales front end EUROPACE 2 is well-
received by the market. Entire change of all
partners is planned up to and including 2016.
• Pilot phase for new personal loan frontend
based on EUROPACE 2 has been started.
• Recruiting of additional partners accelerated
in Q2.
Contractual partners (number)
291 323
2014 H1 2015
+ 11%
Transaction volume: Product segments (billion €)
H1 2015
Personal loan:
0.9 / +13%
Bausparen:
3.8 / +13%
Mortgage finance:
18.2 / +37%
Transaction volume (billion €)
21.2 28.9 31.6
36.2
17.4 22.9
2011 2012 2013 2014 H1 2014 H1 2015
CAGR: +20%
+ 31%

Fin
ancia
l figure
s H
1 2
015
GENOPACE contractual partners (number)
12
GENOPACE and FINMAS maintain growth
Financial Service Providers: Number of partners of FINMAS and GENOPACE
116 130
2014 H1 2015
• GENOPACE: 16 of the top 25 cooperative
banks are contractual partners.
• FINMAS: 15 of the top 25 savings banks are
contractual partners.
• Both segments focus more strongly on the
utilisation of multi-channel distribution.
• Investments in long sales cycle for recruiting
new partners and intensification of platform
use.
• Continuously high growth potential with both
existing and new partners continues.
FINMAS contractual partners (number)
92 105
2014 H1 2015
+ 12%
+ 14%

Fin
ancia
l figure
s H
1 2
015
Revenue (million €)
Gross profit (million €)
EBIT (million €)
13
B2B marketplace shows ability to use effects of scale
Financial Service Providers: Revenue, gross profit and EBIT
• Constant expansion of market share
progresses.
• In addition, trend to long fixed-interest
periods strengthens sales.
• Increasingly neutral impact on earnings from
capitalization costs.
• EBIT margin reaches 25 per cent (H1 2014:
20 per cent).
• First half-year concluded with revenue and
EBIT records.
15.0
20.5
H1 2014 H1 2015
10.1
13.5
H1 2014 H1 2015
3.0
5.1
H1 2014 H1 2015
+ 36%
+ 68%
+ 34%

Fin
ancia
l figure
s H
1 2
015
14
Business unit Institutional Clients
Presentation of segment results

Fin
ancia
l figure
s H
1 2
015
Volume of brokered loans (million €)
15
Loan volume increase due to expansion of the customer base
Institutional Clients: Volume of brokered loans and consulting revenue
117 159
592
879
708
1.038
H1 2014 H1 2015
• Expansion of the customer base, conclusion
of a large number of loan brokerage
transactions that had been in the pipeline for
a long period and stimulation by low interest
rates lead to considerable rise in transaction
volume.
• Decline in consulting revenue due to lower
real estate transactions.
Consulting revenue (million €)
2.7
2.3
H1 2014 H1 2015
- 15%
New business
Renewals 1,038
+ 47%
Fin
ancia
l figure
s H
1 2
015
Revenue (million €)
Gross profit (million €)
EBIT (million €)
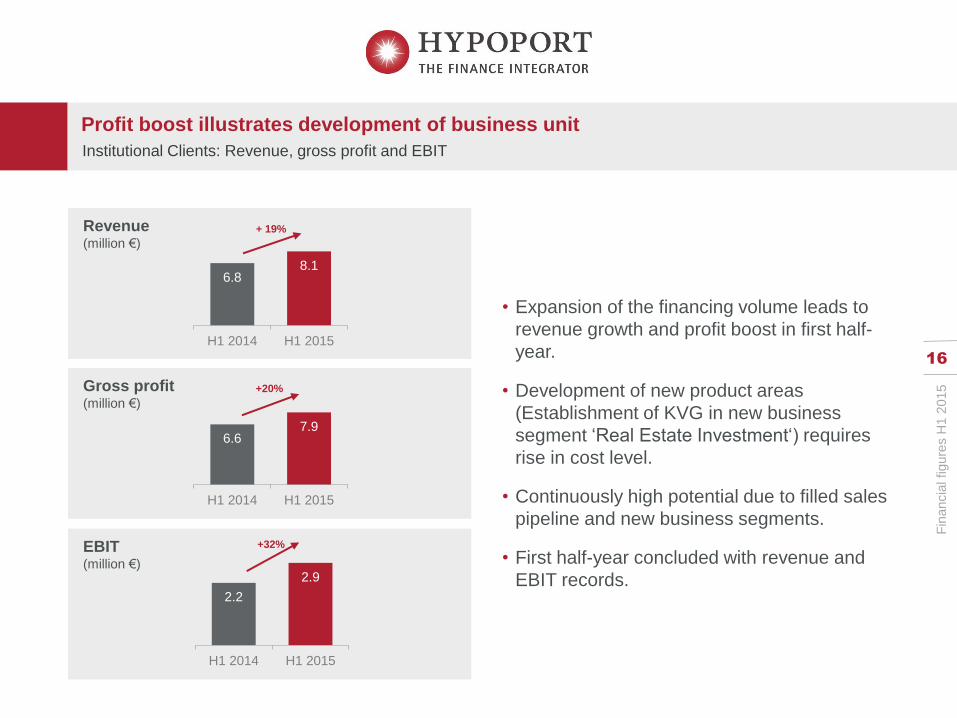
16
Profit boost illustrates development of business unit
Institutional Clients: Revenue, gross profit and EBIT
• Expansion of the financing volume leads to
revenue growth and profit boost in first half-
year.
• Development of new product areas
(Establishment of KVG in new business
segment ‘Real Estate Investment‘) requires
rise in cost level.
• Continuously high potential due to filled sales
pipeline and new business segments.
• First half-year concluded with revenue and
EBIT records.
6.8 8.1
H1 2014 H1 2015
6.6 7.9
H1 2014 H1 2015
2.2
2.9
H1 2014 H1 2015
+32%
+ 19%
+20%

Fin
ancia
l figure
s H
1 2
015
Content
1. Market environment
2. Performance of business units
3. Overview of key performance indicators
4. Hypoportʼs shares
5. Outlook

Fin
ancia
l figure
s H
1 2
015
18
Record half-year results for Hypoport
Summary of Hypoport‘s key figures
Revenue (million €)
53.3
67.5
H1 2014 H1 2015
Gross profit (million. €)
28.0
35.0
H1 2014 H1 2015
Employees (number)
561 569
2014 H1 2015
EBITDA (million €)
6.6
11.8
H1 2014 H1 2015
+ 1% + 27% + 25%
+ 79%
EBIT (million €)
4.3
9.1
H1 2014 H1 2015
>100%
Group profit (million €)
3.3
7.3
H1 2014 H1 2015
>100%

Fin
ancia
l figure
s H
1 2
015
Content
1. Market environment
2. Performance of business units
3. Overview of key performance indicators
4. Hypoportʼs shares
5. Outlook

Fin
ancia
l figure
s H
1 2
015
20
Investor relations activities have been extended
Breakdown of shareholders, share buy-back programmes and investor relations
Breakdown of shareholders as of 30 June 2015
36.9%
9.2%
9.7%
1.7%
42.5%
Investor relations
Date Event Location
05/2015 Roadshow Frankfurt a.M.
05/2015 Q1/15 Conference call Nationwide
03/2015 2014 Conference call Nationwide
11/2014 Roadshow Hamburg
11/2014 Eigenkapitalforum Frankfurt a.M.
11/2014 Q3/14 Conference call Nationwide
Additional one-on-one talks
Share buy-back programmes as of 20 July 2015
Year Purchased shares Max. share price
2015 23,620 pieces 30.00 €
2015 33,655 pieces 19.00 €
2014 26,045 pieces 13.00 €
Kretschmar Familienstiftung
Ronald Slabke (Founder, CEO)
Deutsche Postbank AG
Free float
Non-free float
Company shares

Fin
ancia
l figure
s H
1 2
015
21
Share price follows successful business figures
Share price performance, research and S-Dax ranking
Research
Analyst Recommend. Target pr. Date
Montega Buy 37.00 € 07/23/2015
ODDO Seydler Buy 41.00 € 07/22/2015
Der Aktionär Buy 40.00 € 07/13/2015
8
13
18
23
28
33
38
Jan
Feb
Ma
rch
April
Ma
y
June
July
Performance of Hypoport's shares (Daily closing prices, Xetra, Euro) as of 22 July 2015
S-Dax-Ranking Hypoport
Datum Rank Market Cap Rank Turnover 12M
06/30/2015 120 122
03/31/2015 128 129
01/31/2015 130 138
Source: Deutsche Börse

Fin
ancia
l figure
s Q
1 2
015
Content
1. Market environment
2. Performance of business units
3. Overview of key performance indicators
4. Hypoportʼs shares
5. Outlook

Fin
ancia
l figure
s H
1 2
015
23
Hypoport will continue its profitable growth
Hypoportʼs outlook for the year 2015
We will consistently continue to pursue our strategy of acquiring additional market share in all
business units. We shape markets through product innovation and expand our technological
lead. At the same time, we increasingly use the positions we gained to improve our
profitability.
For 2015, Hypoport expects double-digit growth in revenue. In addition, Hypoport
anticipates a rise of the EBIT margin and, as a result, disproportionate growth in
earnings.
For our business unit Private Clients, we strive for a strong development of the mortgage
finance business, restructuring of the insurance business and methodic improvement of
our margin structure.
Our business unit Financial Service Providers will improve the ongoing increase of the
penetration of market segments with our market place. In addition, the integrational
depth of consumers shall be increased by an expansion of our product and service
portfolio.
Our business unit Institutional Clients will continue its sustainable growth, benefitting
from its innovation leadership in the industry sector and the successful expansion of the
product portfolio.