Reconstruction of ECG signals acquired with Conductive ... · PDF file5.1 ECG signal...
95
Reconstruction of ECG signals acquired with Conductive Textile Electrodes By Bahareh Taji A thesis submitted to the Faculty of Graduate and Postdoctoral Studies In partial fulfillment of the requirements For the degree of Masters of Applied Science School of Electrical Engineering and Computer Science University of Ottawa Thesis copyright © Bahareh Taji, Ottawa, Canada, 2013
Transcript of Reconstruction of ECG signals acquired with Conductive ... · PDF file5.1 ECG signal...

Reconstruction of ECG signals
acquired with Conductive Textile
Electrodes
By
Bahareh Taji
A thesis submitted to the
Faculty of Graduate and Postdoctoral Studies
In partial fulfillment of the requirements
For the degree of
Masters of Applied Science
School of Electrical Engineering and Computer Science
University of Ottawa
Thesis copyright © Bahareh Taji, Ottawa, Canada, 2013

i
Abstract
Physicians’ understanding of bio-signals, measured using medical instruments, becomes the
foundation of their decisions and diagnoses of patients, as they rely strongly on what the
instruments show. Thus, it is critical and very important to ensure that the instruments’
readings exactly reflect what is happening in the patient’s body so that the detected signal is
the real one or at least as close to the real in-body signal as possible and carries all of the
appropriate information. This is such an important issue that sometimes physicians use
invasive measurements in order to obtain the real bio-signal. Generating an in-body signal
from what a measurement device shows is called “signal purification” or “reconstruction,”
and can be done only when we have adequate information about the interface between the
body and the monitoring device. In this research, first, we present a device that we developed
for electrocardiogram (ECG) acquisition and transfer to PC. In order to evaluate the
performance of the device, we use it to measure ECG and apply conductive textile as our
ECG electrode. Then, we evaluate ECG signals captured by different electrodes, specifically
traditional gel Ag/AgCl and dry golden plate electrodes, and compare the results. Next, we
propose a method to reconstruct the ECG signal from the signal we detected with our device
with respect to the interface characteristics and their relation to the detected ECG. The
interface in this study is the skin-electrode interface for conductive textiles. In the last stage
of this work, we explore the effects of pressure on skin-electrode interface impedance and its
parametrical variation.

ii
Acknowledgments
First and foremost, I would like to express my deepest gratitude to my supervisor and co-
supervisor, Professor Shervin Shirmohammadi and Professor Voicu Groza, for assigning me
to this research. Without their support and assistance, the completion of this thesis would not
have been possible.
I would like to thank all of my colleagues in the DISCOVER lab for the friendly
environment they have created; I am grateful for having the opportunity to work in this lab.
Last but not least, I would not have been able to achieve any of my success without the
support of my family. I owe my loving gratitude to them and I especially thank my husband,
Mehdi, for his kind help and patience.

iii
Table of Contents List of Figures ......................................................................................................................... vi
Chapter 1: Introduction ............................................................................................................ 1
1.1 Motivation for the research........................................................................................ 1
1.2 Objective .................................................................................................................... 2
1.3 Contribution of the research ...................................................................................... 3
1.4 Publications resulting from this work ........................................................................ 4
1.5 Thesis outline ............................................................................................................. 4
Chapter 2: Literature Review ................................................................................................... 6
2.1 What is an electrocardiogram (ECG)?....................................................................... 6
2.2 What is blood pressure? ............................................................................................. 8
2.3 Blood pressure measurement (BPM) and ECG-assisted BPM .................................. 8
2.4 ECG monitoring devices ......................................................................................... 10
2.5 ECG electrodes ........................................................................................................ 12
2.5.1 Non-polarizable electrodes ............................................................................... 12
2.5.2 Polarizable electrodes ....................................................................................... 13
2.5.3 Different types of conductive textiles and their comparison............................ 17
2.5.4 ECG electrodes in commercially available ECG devices ................................ 18

iv
2.6 Skin electrode impedance ........................................................................................ 19
2.7 Factors influencing skin-electrode Impedance ........................................................ 20
2.8 An electrical circuit equivalent to skin electrodes ................................................... 21
2.8.1 The single–time constant model ....................................................................... 21
2.8.2 The double–time constant model ..................................................................... 22
2.9 Skin-electrode impedance measurement ................................................................. 23
2.10 ECG signal purification ....................................................................................... 26
Chapter 3: Data Acquisition System (DAS) .......................................................................... 29
3.1 DAS components ..................................................................................................... 30
3.1.1 ECG electrodes ................................................................................................. 30
3.1.2 Master processor unit (MPU) ........................................................................... 31
3.1.3 The ADC and ECG amplifier ........................................................................... 33
3.1.4 Mechanical parts .............................................................................................. 34
3.2 Software layers ........................................................................................................ 36
3.2.1 The hardware abstract layer (HAL) ................................................................. 37
3.2.2 Application layer .............................................................................................. 37
3.2.3 Flash programming tools and debugger ........................................................... 38
Chapter 4: Experimental results ............................................................................................. 41
4.1 ECG Acquisition ..................................................................................................... 41
4.1.1 Results for ECG acquired from the wrists ....................................................... 42

v
4.1.2 Results for ECG acquired from biceps ............................................................. 43
Chapter 5: Impacts of the skin-electrode interface on ECG measured by conductive textile
electrodes ................................................................................................................................ 48
5.1 ECG signal purification: Our method ...................................................................... 48
5.2 Skin-electrode impedance measurement ................................................................. 51
5.2.1 Experimental setup ........................................................................................... 51
5.2.2 Devices and measurement configuration ......................................................... 52
5.2.3 Estimating skin-electrode impedance model components and verification ..... 54
5.2.4 Implementing the algorithm ............................................................................. 56
5.3 ECG morphological changes and interpretation ...................................................... 60
5.4 Applying pressure to the ECG electrodes ............................................................... 62
5.5 Results and discussion ............................................................................................. 64
5.5.1 Discussion ........................................................................................................ 69
Chapter 6: Conclusion and Future work ................................................................................ 72
6.1 Conclusion ............................................................................................................... 72
6.2 Future work ............................................................................................................. 73
6.2.1 Parameters affecting skin-electrode impedance ............................................... 73
6.2.2 Impact of different electrodes on ECG ............................................................ 74
6.2.3 Intra- and extracellular fluid ............................................................................. 74
References .............................................................................................................................. 77

vi
List of Figures
Figure 1 Structure of the Heart [5] ........................................................................................... 7
Figure 2 The ECG Waveform [6] ............................................................................................ 8
Figure 3 General Electrical Model for Active Electrodes [17] .............................................. 16
Figure 4 AgNy Conductive Textile [19] ................................................................................ 17
Figure 5 ECG Acquired with Four Types of Conductive Textile [14] .................................. 18
Figure 6 The Skin’s Layers [4] .............................................................................................. 20
Figure 7 The Single–Time Constant Skin Electrode Interface Model ................................... 22
Figure 8 Double–Time Constant Model [31] ......................................................................... 23
Figure 9 Skin Electrode Impedance Measurement Setup [32] ............................................... 24
Figure 10 Four-Electrode Configuration for Bio-Impedance Measurement [33] .................. 25
Figure 11 Two-Electrode Configuration for Skin-Electrode Impedance Measurement [33] 25
Figure 12 Golden Plates ......................................................................................................... 30
Figure 13 Internal Structure of CC2531F256 [42] ................................................................ 32
Figure 14 The Master Processor Unit .................................................................................... 33
Figure 15 ECG Amplifier and Filter Board ........................................................................... 33
Figure 16 Device Block Diagram........................................................................................... 35
Figure 17 Air Tubes, Air Pump and Motor ............................................................................ 35
Figure 18 Omron Blood Pressure Cuff .................................................................................. 36
Figure 19 Cuff Connected to the Device ................................................................................ 36
Figure 20 IAR Embedded Workbench Editor Area ............................................................... 38

vii
Figure 21 IAR Main Panel ..................................................................................................... 39
Figure 22 Evaluation Board from TI ...................................................................................... 40
Figure 23 Download and Debug Tool .................................................................................... 40
Figure 24 Regular Red Dot Ag/AgCl Electrode .................................................................... 42
Figure 25 ECG Captured from Wrists Using Gel Electrodes ................................................ 42
Figure 26 ECG Captured from Wrists Using Textile Electrodes ........................................... 43
Figure 27 ECG Captured from Wrists Using One Wet and One Textile Electrode............... 43
Figure 28 ECG Captured from Biceps Using Wet Electrodes ............................................... 44
Figure 29 ECG Captured from Biceps Using Textile Electrodes .......................................... 44
Figure 30 ECG Captured from Biceps Using One Wet and One Textile Electrode .............. 45
Figure 31 ECG Captured from Fingertips Using Gold Plate Electrodes ............................... 46
Figure 32 ECG Captured from Fingertips Using One Wet and One Textile Electrode ......... 46
Figure 33 General Circuit for ECG Acquisition .................................................................... 49
Figure 34 Experimental Setup for Skin-Electrode Interface Measurement ........................... 51
Figure 35 Schematic View of Skin-Electrode Impedance Measurement .............................. 52
Figure 36 Frequency Response Analyzer (left), Impedance Interface Device (right) ........... 53
Figure 37 Skin-Electrode Impedance Frequency Response ................................................... 54
Figure 38 Single–Time Constant Model of Skin-Electrode Impedance ................................ 54
Figure 39 Measured Data and the Estimated Model .............................................................. 56
Figure 40 Acquired ECG, Taken by the Device and Two Textile Electrodes on One Bicep 57
Figure 41 Magnitude of (Ri+Z)/Ri Per Frequency ................................................................ 57
Figure 42 Acquired ECG in the Frequency Domain .............................................................. 58
Figure 43 In-Body ECG in the Frequency Domain ............................................................... 59

viii
Figure 44 Acquired and In-Body ECG Waveforms ............................................................... 59
Figure 45 Applying Pressure to Skin-Electrode Impedance Using a Cuff ............................ 63
Figure 46 Skin-Electrode Impedance Variation for Subject 1 ............................................... 65
Figure 47 Skin-Electrode Impedance Variation for Subject 2 ............................................... 66
Figure 48 Skin-Electrode Impedance Variation for Subject 3 ............................................... 66
Figure 49 Component Variation Rate Versus Pressure for Subject 1 .................................... 68
Figure 50 Components Variation Rate Versus Pressure for Subject 2 .................................. 68
Figure 51 Components Variation Rate Versus Pressure for Subject 3 .................................. 69
Figure 52 Electrical Equivalent of the Human Body ............................................................. 75
Figure 53 High- and Low-Frequency Current Distribution in Intra- and Extracellular Water
[56] ......................................................................................................................................... 76

ix
List of Tables
Table 1 Comparison of commercial prototypes of ECG monitoring systems [19] ................ 18
Table 2 Comparison of some ECG prototypes available in the literature [19] ...................... 19
Table 3 Subjects’ characteristics ............................................................................................ 65
Table 4 Rd values under various pressures for all subjects.................................................... 66
Table 5 Cd values under various pressures for all subjects.................................................... 67
Table 6 Rs values under various pressures for all subjects .................................................... 67

x
List of Acronyms and Definitions
ECG Electrocardiograph
SA Sinoatrial
BP Blood Pressure
BPM Blood Pressure Measurement
SBP Systolic Blood Pressure
DBP Diastolic Blood Pressure
Ag/AgCl Silver/Silver Chloride
DAS Data Acquisition System
TI Texas Instruments
PTT Pulse Transient Time
AF Atrial Fibrillation
ADC Analog to Digital Convertor
MPU Master Processor Unit
RF Radio Frequency
FFT Fast Fourier Transform
BMI Body Mass Index
ICW Intra Cellular Water
ECW Extra Cellular Water

1
Chapter 1: Introduction
1.1 Motivation for the research
Since blood pressure (BP) is an important signal, many blood pressure devices are designed
specifically for home health care purposes. Such devices allow people to monitor increases
and decreases in their blood pressure. One of the most popular non-invasive methods of
measuring blood pressure is the oscillometric method [1]. It is not only used for measuring
systolic and diastolic blood pressure, but also for other applications such as measuring heart
rate variability [2]. Although oscillometric method is very popular, it suffers from some in-
accuracy issues [3], and that is the reason why some researchers are trying to find improved
methods for BPM.
Among the approaches geared toward finding an improved blood pressure measurement
algorithm, some have relied on more consistent signals such as electrocardiogram (ECG). In
this study, we refer to two of these, presented in [3] and [1]; they are explained in the second
chapter of the thesis.
It is of interest to develop devices appropriate for both home health care purposes and
clinical applications where all BP measurement methods can be implemented. Devices with
a compact platform that are able to acquire ECG and measure BP, making them suitable for
BP measurement methods relying on ECG signal, can help patients and physicians by
making BP measurement and ECG monitoring a simple process without any time or place
limitations.

2
On the other hand, in developing such systems, there is an important issue which should be
considered, specifically making the device as user friendly as possible. Avoiding extra parts
and equipping it with wireless facilities can result in a device that is not cumbersome and
which can easily be used. Embedding ECG electrodes inside the BP cuff is one way to avoid
extra parts. To do this, a special type of ECG sensor should be used with two basic features:
First, it should be flexible and soft, and second, it must be able to provide good quality ECG
suitable for the main purpose, which is implementing BP methods relying on ECG signals.
Any ECG acquisition requires an ECG electrode. The electrode and its contact interface with
the skin may affect the quality of the ECG signal it senses. How the ECG electrode can
affect the ECG signal is another issue that needs to be addressed.
In this thesis, we will develop and run a device designed as a compact platform that can
potentially be used for any BP measurement method, including those applying ECG as a
leading signal. We also will study a certain type of ECG electrode known as “conductive
textile,” and look at its effects on the ECG signal it senses.
1.2 Objective
The objectives of this thesis are as follows:
To develop and run a device that measures both BP and ECG using a special
type of ECG electrode that is appropriate for such devices;
To explore the effects of the ECG electrode’s interface with the skin and find a
way to obtain the pure ECG, free from interface effects; and
To propose a method to minimize these effects.
To pursue our goals, in the first step, we will develop such a system and all its parts will be
tested practically. In this device, we apply conductive textile as an ECG electrode and use it

3
to acquire the ECG signal. We also compare the obtained ECG signal with that ECG signal
captured by electrodes that are currently in use clinically, known as gel electrodes. Then, we
explore the effects of the interface of this electrode, namely the skin-electrode interface, on
the ECG signal measured with this device. We consider reconstruction of the ECG signal
without effects from the skin-electrode interface and propose a method to do this in order to
obtain a pure ECG signal. Finally, we suggest a way to minimize these effects.
1.3 Contribution of the research
This thesis will make several contributions to the field, as detailed in the following:
The design, development and operation of a new compact platform for BP and ECG
measurement. The device is based on a state-of-the-art microprocessor from Texas
Instruments (TI). The data stream from the device to the PC is sent wirelessly;
ECG measurement with a specific type of electrode that is compatible with our aims
is completed and the results are compared to gold standard electrodes;
Investigation of the effects of ECG electrodes on ECG signal quality;
Reconstruction of the ECG signal with respect to electrode interface features. The
ECG signal reconstruction includes the following steps:
o Measurement of skin electrode impedance: This step has its own issues and
requires a specific measurement setup;
o Modeling the skin electrode interface and extracting model parameters;
o Obtaining the ECG signal with respect to the interface model and ECG
measured with the electrode;
Investigation of the differences between the reconstructed ECG and acquired ECG
from a morphological point of view;

4
Proposal of a way to optimize ECG signals measured with our electrode. This
method involves applying pressure to the skin-electrode interface to generate a better
contact area. These measurements are done for three subjects to track the parameters’
variations under pressure.
1.4 Publications resulting from this work
[1] R. Stevenson, M. Bolic, B. Taji, and S. Ahmad. (2012) Application note: ECG assisted
blood pressure monitoring based on the CMC microsystems compact wireless platform.
CMCMicrosystems[Online].Available:
https://www.cmc.ca/WhatWeOffer/Products/CMC00200-02441.aspx
[2] B. Taji, S. Shirmohammadi, V. Groza, and M. Bolic. (2013) An ECG monitoring system
using conductive fabric. In Medical Measurements and Applications Proceedings (MeMeA),
2013 IEEE International Symposium, pp. 309-314. IEEE
[3] B. Taji, S. Shirmohammadi, V. Groza, and I. Batkin. (2013) Impact of skin electrode
interface on ECG measurements using conductive textile electrodes. Accepted to IEEE
Transactions on Instrumentation and Measurement Journal.
[4] B. Taji, S. Shirmohammadi and V. Groza. (2013) Measuring Skin-electrode Impedance
Variation of Conductive Textile Electrodes under Pressure. To be submitted in IEEE
International instrumentation and Measurement Conference (I2MTC) 2014.
1.5 Thesis outline
The thesis is organized as follows. Chapter 2 gives a review of some ECG monitoring
devices presented in the literature; all of the types of ECG electrodes are also presented in
this chapter. In the same chapter, we explain skin-electrode interface models. The

5
architecture of the ECG measurement system is described in chapter 3. Consequently, we
explore different sites on body, such as the wrists, biceps and fingertips, in addition to
various types of electrodes, including gel electrodes, conductive textile and commercial
golden plates to compare and determine conductive textile’s behaviour in terms of ECG
measurement. Our objective is to examine conductive textile electrodes’ suitability for ECG-
assisted blood pressure measurement algorithms and other applications where skin
preparation is not applicable. The results obtained from this part of research are presented in
chapter 4.
This study is carried out by looking into the effects of the impedance of the electrode and its
contact interface with the skin on the quality of ECG acquired. Such investigation in the first
step is required to establish a measurement platform whereby skin-electrode interface
impedance can be measured. The next step is to determine the influence of such an interface
on the acquired ECG and reconstructing the ECG to obtain this signal before it is affected by
the interface with respect to interface features and the primary acquired signal. This part of
our work is presented in chapter 5.
In another stage of this work, we measure interface impedance under external pressure and
follow its variation rate according to an increase in pressure. Experiments are carried out for
three subjects. This stage and corresponding results are explained in chapter 6. Finally, the
thesis concludes in chapter 7.

6
Chapter 2: Literature Review
Considering the fact that many people are challenging with cardiac problems and hypertonia,
applying home health care monitoring devices for tracking ECG and blood pressure
fluctuations, is becoming more popular.
This research aims to develop and run a device for this purpose which is more convenient
than the available ones and also it is capable of monitoring ECG and blood pressure
simultaneously. Besides in the next step we want to improve the quality of acquired ECG by
removing the impacts of skin electrode interface.
In the following section there are more explanation about ECG signal, BP and BP
measurement methods, ECG monitoring devices, ECG electrodes and their characteristics.
We also will explain more about skin electrode interface and ECG signal reconstruction and
its requirements.
2.1 What is an electrocardiogram (ECG)?
An electrocardiogram (ECG) is the recording of the heart’s electrical activity [4]. The
sinoatrial (SA) node is the pacemaker point in the heart and regulates heart beats. It
generates an electrical signal that travels through the heart muscle. In the first step, it causes
the upper chambers of the heart (atriums) to contract, thereby pumping blood to the lower
chambers of heart (ventricles) [5]. This signal then travels to the ventricles and makes them
contract, thus pumping blood into the body, followed by ventricles relaxation.
The ECG signal is a (quasi-)periodic signal and consists of three main parts, specifically the
P wave, QRS complex and T wave; each of these represents one phase of heart activity in

7
pumping blood into the body. Figure 1 Structuredepicts the heart’s structure and its
chambers. The heart has two upper chambers, the left and right atrium, and two lower
chambers, termed the left and right ventricles.
Blood circulation consists of two circulatory loops: “pulmonary circulation” and “systemic
circulation.” The first is a loop from the heart through the lungs, where blood is oxygenated
and carbon dioxide (CO2) is released; the second is a loop from the heart through the rest of
the body to provide oxygenated blood. Each loop involves one atrium and one ventricle in
the heart. The right side of the heart performs the pulmonary circulation and the left side
performs the systemic circulation.
Figure 2 shows the general shape of an ECG. The P wave demonstrates atrium contraction,
the QRS complex illustrates ventricle contraction, and the T wave shows ventricle
relaxation.
Figure 1 Structure of the Heart [5]
In this study, we focus on ECG, looking at its features, its monitoring devices and supplies,
as well as parameters that may influence its measurement.

8
Figure 2 The ECG Waveform [6]
2.2 What is blood pressure?
Blood pressure is the pressure of blood against the wall of arteries during circulation [7].
Similar to ECG, blood pressure is a vital sign carrying a great deal of information about an
individual’s heart performance and general health. It indicates hypertension, asthma and
even heart attack. The pressure of the blood when it flows from ventricles to the arteries is
called systolic blood pressure (SBP); this is the peak pressure and occurs when the ventricles
are contracting [7]. In contrast, the minimum pressure in the arteries is called diastolic blood
pressure (DBP), and represents the pressure of the blood in arteries when the ventricles are
full of blood [7]. Blood pressure is measured in millimeters of mercury (mmHg).
2.3 Blood pressure measurement (BPM) and ECG-assisted BPM
Since oscillometric blood pressure measurement, as an invasive method, is not able to do an
accurate measurement, some methods are invented to do a more accurate measurement by
applying more consistent signals such as ECG. These methods are known as ECG-assisted

9
BPM. We need to know how these methods work to be able to develop a system appropriate
for this type of invasive BPM.
The oscillometric method requires a blood pressure cuff wrapped around the patient’s bicep.
Steadily inflating the cuff gradually stops blood flow in the arteries underlying it. A pressure
transducer is used to record the pressure and oscillations in the cuff pressure that are created
by arterial pulsation. When the oscillations have their maximum amplitude, the cuff pressure
is equal to the mean arterial pressure. In this method, systolic and diastolic blood pressures
are estimated from the mean blood pressure and oscillation pattern [8]. In this approach,
patients have to ensure that the cuff is at the heart level; otherwise, the measurement will not
be accurate. Moreover, in cases such as obesity, heart arrhythmia or even posture change, the
arterial amplitude that cuff senses is not distinct [3]. The inaccuracies evident in this method
have caused researchers around the globe try to find a more reliable approach for blood
pressure measurement or to extract and remove the effects of other signals such as
respiratory signals on blood pressure, thereby resulting in a higher level of accuracy [9].
The authors in [1] applied ECG in an improved oscillometric blood pressure measurement
algorithm for two purposes. In the first step, they used the pulse transit time (PTT, the time
delay between R-peaks and photoplethysmographic [PPG] pulses) for estimating standard
deviation of both systolic and diastolic blood pressure. In the second step, they used the
signal-to-noise ratio of the ECG signal to ensure that the patient was in rest. They found that
the measured blood pressure was valid if this ratio was below a given threshold [1].
In another approach, Ahmad et al. [3] developed a new method of blood pressure estimation
concerning the R-peaks of ECG in order to improve the oscillometric pulse peak detection,
which leads to better estimation of blood pressure. R-peak information was also applied to
10
determine the maximum amplitude of oscillometric pulses interleaved between two
consecutive R-peaks. Eventually, the maximum amplitude algorithm was used to estimate
systolic and diastolic blood pressure. The authors also developed a prototype to implement
their ECG-assisted blood pressure measurement algorithm [3]. In their prototype, two ECG
electrodes were used to acquire the ECG signal; these were both made of AgNy conductive
textile. One was embedded in the cuff maintain contact with the patient’s bicep when the
cuff was wrapped around the arm. The other electrode was in shape of a wristband and was
applied to the patient’s wrist. Their results show more accurate BP measurements than
regular oscillometric method.
2.4 ECG monitoring devices
Nowadays, cardiac patients have the opportunity for their ECG signal to be monitored
continuously; this great achievement was brought about by researchers’ attempts to develop
devices for this purpose. Portable bio-signal monitoring devices are now commercially
available, and many people have access to them. Moreover, concepts like telemedicine are
also augmenting home health care devices’ capacity to help both patients and physicians.
Instead of being admitted to hospitals, telemedical services provide patients with
comfortable and reliable facilities and give them the benefit of using web services to send
their vital signs and symptoms to their physician to diagnose abnormalities. In addition to the
commercially available devices, including clinically in use and wearable ECG monitoring
devices, many prototypes have been presented in the literature. In this sub-section, we
briefly describe some of these prototypes and their features.
The authors in [10] presented an ECG measuring device which sends patients’ ECG data via
a web service-oriented architecture. They presented a monitoring device that was able to

11
acquire ECG signals and provide patients with a diagnosis by using their clinical history.
Moreover, this device was able to call emergency services if necessary [10]. In this work,
standard Ag/AgCl electrodes were applied.
Another device was presented by the authors in [11]. Their device was an ambulatory ECG
device equipped with a built-in warning system. The main objective in this work was to
diagnosing prevalent types of heart abnormality, such as atrial fibrillation (AF). AF occurs
when electrical signals are not generated solely by the SA node in the heart. Instead, they
come from other parts of the atria. In this system, an alert signal was activated once an
abnormal ECG was detected. Moreover, disposable ECG electrodes were applied.
In [12], a wearable ECG monitoring device was presented. Wireless data transmission to a
host node was carried out by an ANT protocol. There was no web-based service anticipated
for this device. One of the main aims in this work was to delivering the most convenience to
the user during ECG measurement, particularly in long-term applications [12]. Thus, the
authors used dry capacitive electrodes embedded in a cotton T-shirt.
Another approach employed a different perspective on ECG monitoring [13]. The authors
introduced a system that generated an ECG signal, whereas previous ones monitored such
signals. This system allowed researchers and ECG monitoring device developers to assess
and analyze their device performance in an empirical way beyond the numerical and
theoretical methods usually applied for this purpose [13]. This represents a more realistic
approach than performing simulations on a personal computer.
One of our objectives in this work is to explore ECG electrodes and compare them according
to certain applications. Therefore, we continue the literature review by describing various
types of ECG electrodes.

12
2.5 ECG electrodes
Whatever the ECG recording device is, there is an interface between the body as the signal
source and the recording device that monitors and collects the signal from the body. This
interface is indeed the part of the device in direct contact with the body and is called an
“electrode.” ECG electrodes sense a bio-signal, that is, an ECG signal coming from a
biological source. Thus, ECG electrodes represent a type of bio-electrode capable of
capturing an electrical bio-signal. Many different types of ECG electrodes are available, and
each has its own advantages and disadvantages.
ECG electrodes can be categorized into two basic groups depending on the way in which
they perform their main role. The main task of an ECG electrode as a bio-electrode is to
change the voltage from its ionic form in the body to its electron form in the wires carrying
the signal to feed the recording device [4]. Thus, all bio-signal electrodes are polarizable or
non-polarizable, also known as dry and wet electrodes, respectively [4]. Below, we explain
each category.
2.5.1 Non-polarizable electrodes
The ECG electrodes clinically in use are adhesive gel Ag/AgCl electrodes. Such electrodes
have been in use for a long time; therefore, their characteristics and principles, along with
drawbacks, are well understood. In this group of electrodes, an electrochemical process
between the gel and the biological tissue yields a conductive path between the patient’s skin
and electrode [4]. A real electrical current flows along this path.
The advantages and disadvantages of non-polarizable electrodes are as follows:
Advantages include:

13
They are adhesive thus can easily be fixed on the skin, preventing motion
artifacts;
They show very clean and reliable ECG signals;
Disadvantages include:
The adhesive part and the gel inside them cause skin irritation and contact
skin dermatitis if they are in use for long time [4];
They normally require skin preparation in advance, such as shaving, using
alcohol to clean the contact area and even using sand paper to remove the
dead layer of the skin [4];
Technically, the most significant drawback of non-polarizable ECG
electrodes is that the signal they sense will degrade when the gel inside them
dries out. Therefore, they are not appropriate for long-term use and are
considered disposable electrodes. It is inconvenient to replace electrodes,
making them problematic for the user.
2.5.2 Polarizable electrodes
In contrast to non-polarizable electrodes, in polarizable electrodes, no actual electrical
current flows. Instead, a displacement current occurs as a result of a change in ionic
concentration in the electrode-skin interface. These electrodes work based on capacitive
coupling between a conductive material and skin. They do not need any kind of gel; instead
they operate by moisture on the skin, that is, sweat [4]. Dry electrodes vary from simple
stainless steel plates to new flexible textiles capable of conducting electrical potential. Dry
electrodes can be categorized as contact or non-contact.

14
Dry contact electrodes
The simplest polarizable electrode is a metal disc in direct contact to the skin. This can sense
any electrical bio-signal. Although the performance of such electrodes is comparable to that
of gel electrodes, due to sweat and the humidity of the skin, their use is limited after a few
minutes because of stiffness and the fact that they can cause skin irritation. Another
disadvantage is that they are highly sensitive to motion artifacts, since they are not fixed on
the body unless they are embedded in a belt, in which case the belt should be tight maintain
contact between the metal disc and the skin.
One of the newest and most recent electrical bio-signal electrodes is conductive textile. This
is one type of dry contact electrode, and its advantage is that it is just like an ordinary fabric,
soft and flexible and it does not cause skin irritation; moreover, it is appropriate for chronic
applications. Conductive textile can be made of various types of conductive yarn, including
silver-coated nylon (AgNy), stainless steel yarn (SSt) and silver-coated copper (AgCu) [14].
Conductive textiles are increasing in popularity because they are easy to use, and unlike gel
electrodes, do not need to be changed in long-term applications. Moreover, they are not stiff
and can be shaped like an ordinary wristband or embedded inside garments that the user can
wear, as the authors in [15] proposed. Generally we can say conductive textiles are
convenient and user friendly; hence, they are good options for long-term ECG applications
or home healthcare monitoring devices. In terms of home use, such devices should provide
the user with the most convenience; otherwise, people will be reluctant to use them.
Dry non-contact electrodes
This category of electrode is very similar to the previous one; the only difference is that there
is an insulating layer between the skin and the electrode. The electrode itself is like a dry

15
contact electrode, that is, it is basically a conductive disc. Dry non-contact electrodes work
based on capacitive coupling between the skin and the conductive disc. Coupling leads to
polarization of the electrode; as a result, a displacement current flows for a while. To achieve
strong capacitive coupling, we can increase the area of contact, use a thin insulator layer or
include an insulator with a high dielectric constant [12]. Similar to dry contact electrodes,
these devices are also sensitive to motion artifacts; however, they show better behaviour in
terms of decreased skin irritation.
Although capacitive electrodes do not need to be replaced, and therefore have some
advantages over gel electrodes, they also suffer from some drawbacks. First, the signal from
this type of electrode is noisier and has less amplitude in comparison to that from a gel
electrode, as there is large impedance between the body and the metal plate of the electrode.
Second, the high impedance causes the electrode to act like an antenna for the normal noise
of the environment [16]. Third, dry non-contact electrodes exhibit high sensitivity to motion
artifacts because they are not fixed on the body; any displacement of the ECG source
changes the capacitance value. Thus, any undesired body movement changes the distance
between the electrode and body, thereby resulting in a small change in potential that can
dominate the ECG signal, especially given the small signal amplitude of ECG (1 mV). This
is the most significant drawback and seriously needs to be addressed. This makes the
application of such electrodes controversial and questionable.
In recent ECG monitoring prototypes employing dry electrodes, bio-signals have been
amplified by an amplifier embedded in the electrode in order to minimize the noise induced
in the path of the sensed signal to the amplifier’s input. Such electrodes are made of a
standard PCB including an amplifier, and are called “active electrodes.” Active electrodes

16
are sometimes shielded to prevent external interference. All dry non-contact electrodes tend
to be embedded inside a belt or a thin cloth. However, they are still somewhat obtrusive
because the metal plates or PCB-based electrodes are stiff and need to be very close to the
body to generate a good quality ECG signal. Hence, the belt must be worn very tightly,
which is uncomfortable. We should mention that many home monitoring devices use active
electrodes. Figure 3 shows a typical active ECG electrode.
Figure 3 General Electrical Model for Active Electrodes [17]
The newest and most innovative electrode for home health care monitoring devices is
conductive textile. This is a type of dry contact electrode, and its advantage is that it is just
like an ordinary fabric. Conductive textile can be made of various types of conductive yarn,
including silver-coated nylon (AgNy), stainless steel yarn (SSt) and silver-coated copper
(AgCu) [14]. The conductive textile we use in our device is a flexible, thin, soft, lightweight
and stretchy textile made of AgNy filaments. It is appropriate for any application dealing
with electrical potential transmission, for example, ECG, EEG or EMG. It has the potential
to introduce a new generation of wearable bio-potential electrodes which are more
comfortable and easy to use than what is already available [15]. Referring to the features of
the electrodes discussed above, our proposed electrode does not require electrode
replacement, guarantees the delivery of a constant signal quality for a long time, prevents

17
skin irritation, is not stiff and uncomfortable and senses ECG which is comparable to ECG
acquired by gel electrodes. Moreover, unlike gel electrodes, it does not require skin
preparation, and due to its soft and thin texture, it has the potential to be embedded in any
desired shape, including a shirt.
Conductive textile electrodes are indeed a special type of dry-contact electrodes and
therefore, inherit their drawbacks. Hence, they are sensitive to motion artifacts.
In this study, we design and produce for conductive textile made of AgNy yarns as an ECG
electrode. Another positive point about conductive AgNy textile is that it has bactericidal
effects [18]. Figure 4 shows a piece of this fabric. We will demonstrate that conductive
textile is capable of delivering good quality ECG signal. Furthermore, since this type of
electrode does not necessitate skin preparation, it is a good choice for applications where the
user would follow a regular procedure, as in the case in home health care devices. One
ultimate possible application of our device is blood pressure measurement via the ECG-
assisted blood pressure algorithm presented in [3].
Figure 4 AgNy Conductive Textile [19]
2.5.3 Different types of conductive textiles and their comparison
The authors in [14] measured ECG with four types of conductive textiles and compared
them in terms of signal amplitude. Figure 5 illustrates the ECG taken by conductive textiles
and that taken by Ag/AgCl (Red Dot) electrodes.

18
Figure 5 ECG Acquired with Four Types of Conductive Textile [14]
2.5.4 ECG electrodes in commercially available ECG devices
Commercially available ECG monitoring systems mostly apply gel electrodes, especially if
they are designed for clinical use. In contrast, home health care devices mainly employ dry
electrodes embedded in a belt or cloth, and the user needs to strap the belt tightly around the
chest. Table 1 compares some examples of commercially available ECG monitoring systems
according to the type of ECG electrode they apply.
Table 1 Comparison of commercial prototypes of ECG monitoring systems [19]
Device Vendor Electrode type
Heart scan Omron Dry direct contact
Heartcheck CardioComm Solutions Dry direct contact
Easy ECG Favorite Plus Dry direct contact
MAC General Electric Gel
EASI ECG Philips Gel
TruVue Biomedical Systems Gel
19
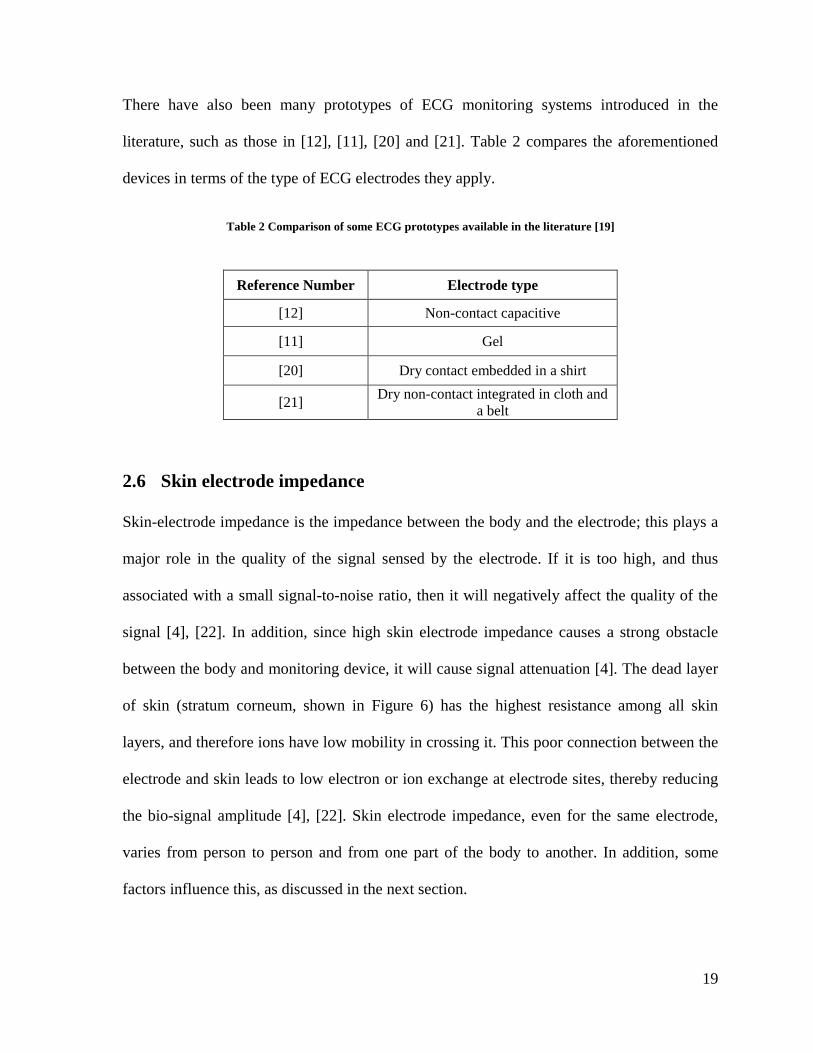
There have also been many prototypes of ECG monitoring systems introduced in the
literature, such as those in [12], [11], [20] and [21]. Table 2 compares the aforementioned
devices in terms of the type of ECG electrodes they apply.
Table 2 Comparison of some ECG prototypes available in the literature [19]
Reference Number Electrode type
[12] Non-contact capacitive
[11] Gel
[20] Dry contact embedded in a shirt
[21] Dry non-contact integrated in cloth and
a belt
2.6 Skin electrode impedance
Skin-electrode impedance is the impedance between the body and the electrode; this plays a
major role in the quality of the signal sensed by the electrode. If it is too high, and thus
associated with a small signal-to-noise ratio, then it will negatively affect the quality of the
signal [4], [22]. In addition, since high skin electrode impedance causes a strong obstacle
between the body and monitoring device, it will cause signal attenuation [4]. The dead layer
of skin (stratum corneum, shown in Figure 6) has the highest resistance among all skin
layers, and therefore ions have low mobility in crossing it. This poor connection between the
electrode and skin leads to low electron or ion exchange at electrode sites, thereby reducing
the bio-signal amplitude [4], [22]. Skin electrode impedance, even for the same electrode,
varies from person to person and from one part of the body to another. In addition, some
factors influence this, as discussed in the next section.

20
Figure 6 The Skin’s Layers [4]
2.7 Factors influencing skin-electrode Impedance
The stratum corneum is the surface layer of the skin and exhibits high resistance because it is
mainly composed of dead skin cells with very little fluid [23]. This is why, before taking a
bio-signal from body, sandpaper is used in some applications to remove this layer and make
the skin-electrode impedance smaller in order to obtain a better signal quality. This
procedure is called skin preparation. Skin preparation also involves other techniques,
including cleaning the contact area with an alcohol swab and shaving to remove hair. In
addition to skin layers, which are one factor affecting the skin electrode interface, there are
some other factors that can influence this impedance, including humidity, the electrode
material, the contact area size and the gel material if a gel electrode is used. Pressure is also
considered an affecting factor on skin electrode impedance, since increased pressure results
in closer contact between the electrode and skin.
21
Typically, non-polarizable electrodes exhibit lower skin-electrode impedance. This occurs
because in such electrodes, the electrolyte gel forms a conductive path for ion exchange. In
addition, gel can increase the skin surface humidity by penetrating into it. A hydrated
stratum corneum is associated with a more conductive environment for ionic exchange [4],
[24].
2.8 An electrical circuit equivalent to skin electrodes
To better understand and analyze the skin electrode impedance behaviour, an equivalent
electrical circuit is helpful. Such a circuit can be extracted by studying the electrical
characteristics of both electrode and the skin. Warburg [25] was the first to propose an
equivalent circuit model for the electrode-electrolyte interface. Moreover, Feate et al. [26]
identified the components of electrode circuit model, analyzing the electrical properties and
conductive nature of biological tissues [26]. Their study helped in estimating the values of
capacitors and resistors in the electrode-skin model. Moreover, more details on the effect of skin
impedance, capacitance and electrolyte gel or sweat on electrode-skin impedance was provided
by their work.
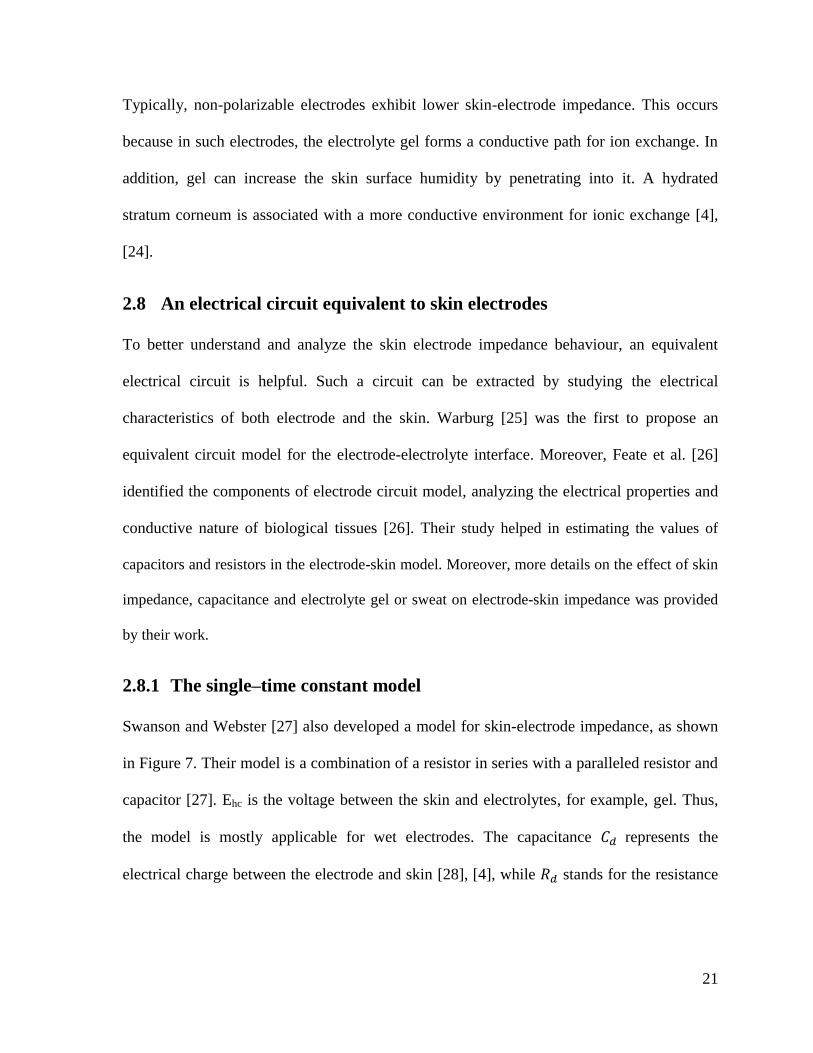
2.8.1 The single–time constant model
Swanson and Webster [27] also developed a model for skin-electrode impedance, as shown
in Figure 7. Their model is a combination of a resistor in series with a paralleled resistor and
capacitor [27]. Ehc is the voltage between the skin and electrolytes, for example, gel. Thus,
the model is mostly applicable for wet electrodes. The capacitance represents the
electrical charge between the electrode and skin [28], [4], while stands for the resistance

22
that occurs between the skin and electrode during charge transfer [27]. represents the
electrolyte gel (if any), sweat and the underlying skin tissue [22], [29].
RsCd
Rd
Ehc
Figure 7 The Single–Time Constant Skin Electrode Interface Model
Equation (1) represents the total impedance of the single–time constant model of the skin-
electrode interface as a function of frequency. Equations (2) and (3) represent the real and
imaginary parts, respectively.
( )
=
=
,
(1)
( ( ))
(2)
( ( ))
(3)
2.8.2 The double–time constant model
Figure 7 proposes a general model for all electrodes, and is known as the single–time
constant model [30]; however, there are some more complicated models for skin-electrode
impedance, such Neuman’s [30] suggestion, which is actually through two stages of the
single–time constant model. The first stage only represents skin, while the second only
represents the electrode. This is called the double–time constant model, and is illustrated in
Figure 8.

23
The authors in [31] studied both models in terms of ECG measurement and frequency
response, and showed that the double–time constant model exhibits more accurate results.
They also show that measuring double–time constant model parameters has some limitations
[31]. In this study, we use the simplified single–time constant model due to restrictions in
our measurement devices.
Electrode
Electrolyte/Sweat
Eelectrode/sweat
Rsubcutaneous
Stratum
Epidermis
Dermis
subcutaneous
Rsweat
RelectrodeCelectrode
Esweat/strat corn
Cstrat cornRstrat corn
Figure 8 Double–Time Constant Model [31]
2.9 Skin-electrode impedance measurement
Skin-electrode impedance measurement has been always of interest because this influences
the reliability of the collected signal. Thus, many papers in the literature have discussed
methods of measuring this accurately. In 1966, the authors in [32] proposed the following
method. Their measurement setup is shown in Figure 9.

24
In this method, three electrodes are applied on the arm and the skin-electrode impedance the
middle one is calculated. The current flowing in A and B can be calculated by measuring the
voltage drop in A buffer unit is used to prevent any significant current flow between B
and C. Furthermore, a known sine wave is applied to electrode B and the voltage between B
and C is measured. Thus, impedance of B can be calculated using the following equation.
(4)
Two other methods are presented in [33]. They use two configurations of electrodes to
measure skin electrode impedance. One is the double electrode configuration, while the other
is the tetra-electrode configuration. The authors’ main objective in [33] was to explore
different methods suitable for at home bio-impedance measurement devices. Figure 10
depicts the tetrapolar configuration for a typical bio-impedance measurement (left) and its
equivalent circuit (right), while Figure 11 shows bipolar electrode configuration (left) and its
equivalent circuit (right) for the measurement of the skin electrode impedance. In their study,
Figure 9 Skin Electrode Impedance Measurement Setup [32]

25
it was possible to use a tetrapolar configuration to measure body impedance, while a bipolar
configuration could be used for skin-electrode interface impedance measurement.
Z Skin-Electrode
ZBody
I(t)V(t)
Z Skin-Electrode
1 2
4 3
Figure 10 Four-Electrode Configuration for Bio-Impedance Measurement [33]
Z Skin-Electrode
ZBody
I(t)
V(t)
Z Skin-Electrode
Figure 11 Two-Electrode Configuration for Skin-Electrode Impedance Measurement [33]
Body impedance measurement has clinical applications because it is function of body water
content. Bio-impedance measurement in a specific frequency range is known as bio-

26
impedance spectroscopy (BIS); this allows the fluid content of the body to be measured,
including intra- and extracellular fluid. We discuss this in more detail in Chapter 6.
The water content of the body can be monitored to avoid health problems resulting from
dehydration. BIS is one method of monitoring body composition under different conditions;
this has several applications, for example, monitoring dialysis and the physiological changes
due to sport activities [34].
In our case, we have another concern, which is exploring signal reliability with respect to
skin-electrode impedance. Therefore, we need to measure skin electrode impedance and
should use a bipolar configuration, as Figure 11 demonstrates. Moreover, we utilize
commercially available state-of-the-art devices that are designed specifically for this purpose
in order to measure skin electrode impedance variation over a particular frequency range. In
chapter 5 of the thesis, we will explain the entire experimental setup we applied.
2.10 ECG signal purification
ECG is such an important and informative signal that many researchers are working to
expand its purification methods. ECG purification can be defined as removing motion
artifacts as a significant source of noise. The authors in [35] and [36] proposed different
approaches to achieving this aim. Many commercially available ECG monitoring devices are
equipped with an accelerometer to remove motion artifacts on the x, y and z axes, and in
[37], an algorithm to separate out the muscular component of ECG signal was proposed in
order to acquire a more accurate representation of cardiac activity.
The main question to answer is the following question: Is there any possibility that we might
miss information from ECG signal in relation to the skin-electrode interface and its
impedance? In practice, when we acquire ECG, there is impedance (skin-electrode
27
impedance) between the body as the signal source and recording device. What are the effects
of this impedance on ECG quality? In other words, we need to know whether existence of
skin-electrode impedance ( ) between the body and monitoring device causes any
distortion or deformation of ECG, and if so, whether this, results in misinterpretation or
missing information related to ECG signal. Moreover, we need to know the extent to which
ECG is affected, and figure out what parts of ECG are more affected and how this influences
physicians’ understanding. In next stage, if there is any chance of missing information, then
we need to determine how to compensate for this to create a pure ECG signal that is free
from all the side effects of using an electrode associated with a certain impedance. In this
section, we will discuss some efforts researchers to obtain a purified ECG signal.
In [38], the authors clearly showed that there is an error ratio in the ECG signal associated
with the skin-electrode impedance. They gave three suggestions to address this problem: (1)
decreasing the skin-electrode impedance; (2) increasing the input resistance of the amplifier;
and (3) compensating for the skin-electrode impedance effects in the acquired ECG. The
authors in [39] also suggested maximizing the input impedance of the amplifier.
Another attempt to mitigate distortion in ECG introduced by the skin-electrode interface was
made by Tomczyk [40]. The electrode in his study was a gel electrode, and both its model
and its impact on ECG registered on the skin-electrode interface were investigated by
applying a square stimulus signal and recording its response [40]. The procedure he
proposed for correction of the ECG signal error introduced by the skin-electrode interface
included three stages of measurement and calculation. The first involved parametrical
identification of the interface model; the second was registering the signal at the output of
the electrodes; and in the third stage, Tomczyk reconstructed the ECG signal with respect to

28
electrode interface characteristics and the electrical response. The identification system he
applied to obtain the parameters of the interface model comprised a square wave generator, a
data acquisition card and LabVIEW software. Tomczyk obtained the transfer function of the
interface and its inverse, and then applied the inverse function to the ECG registered at the
output of interface. The difference between the result of this recent activity and the output
signal of the interface was indeed the error introduced by skin electrode interface.
In this thesis we will develop a platform to acquire ECG and we use conductive textile as
ECG electrode. The aim of selecting conductive textile is providing the user with the most
convenience. Next we propose a new method to create a pure ECG signal from what the
device acquired. We will remove skin electrode interface effects on acquired ECG signal.

29
Chapter 3: Data Acquisition System (DAS)
In order to acquire ECG with a conductive textile electrode, we first need to develop a
hardware/software platform capable of acquiring ECG. The architecture of such system is
described in this chapter. The device should be capable of monitoring ECG and performing
BP measurement. Such a device can non-invasively determine the BP of the user, and at the
same time, acquire his/her ECG. This represents a compact platform for both ECG and
BPM; therefore, it is suitable to implement ECG assisted BP measurement algorithms. DAS
is composed of a master processor unit (MPU), an ECG amplifier board, an analog-to-digital
converter (ADC) board and a power control board. The MPU is designed based on
“CC2531F256,” Texas Instruments. The ADC employed in this DAS is “ADS8320,” Texas
Instruments. Moreover, like in any other ECG monitoring device, ECG electrodes are
provided; in addition, a BP cuff and some mechanical elements are included in the device to
control the cuff and perform BP measurement. Each element of the device is explained in
turn in the following sections.
For our current prototype, we have not implemented an accelerometer yet, so we ask the user
to avoid moving during measurements. In some commercial ECG monitoring systems, an
accelerometer is included; therefore, if the user is running or walking, his/her ECG signal is
adjusted accordingly.

30
The hardware part of this project which includes MPU, ADC and mechanical parts are done
by CMC Microsystems Company in Canada. We collaborated with them on this part of
project and we integrated software on this hardware in order to meet our needs. We also
wrote an application note as a result of this collaboration; this is available on the CMC
website and presented in [41].
3.1 DAS components
3.1.1 ECG electrodes
As mentioned above, we use conductive textile made of silver-coated nylon filaments as
ECG electrodes in this study. One electrode will be installed on the inner side of the BP cuff,
and the other can be shaped as a wristband and wrapped around the user’s wrist. Another
option for the ECG electrode is available in this device. This is a small (18 mm x 12 mm)
gold plate installed on the device. Indeed, two of these are glued to the case of the device,
one for collecting signals from fingertips and the other for grounding. These plates should
touch the fingertips in order to collect an ECG signal. In the next chapter, we will measure
ECG in this way and compare the results with other available options, such as conductive
textile. Figure 4, above, shows the conductive textile, while Figure 12 depicts the gold
plates.
Figure 12 Golden Plates

31
3.1.2 Master processor unit (MPU)
This Master Processor Unit (MPU) board includes a microcontroller CC2531F256 as the
master processor; it is the core of the device and responsible for hosting the controlling code
of the entire system. Other features of this microprocessor are as follows:
8051 core;
21 GPIO (3 ports);
32.768 K oscillator;
8 K Byte internal RAM;
256K Byte in system programmable flash memory;
3 timers;
Watch dog timer;
8 channel internal ADC:
7–12 selectable bit resolution for ADC;
Sampling rate: 7.575–50 KHz for ADC.
Figure 13 depicts the structure of the MPU.
In addition to the main processor, the MPU also includes 32 K Byte of external RAM
memory. Moreover, the RF antenna and the balun need to communicate wirelessly with a
smartphone or PC; all hardware resources needed to build an 802.l5.4-based wireless control
node are also located on MPU [19]. The CC2531F256 also contains 256KB of in-system
programmable flash memory that hosts the embedded software controlling the system. As
can be seen in Figure 14, a ribbon cable connector that may be used to connect the device to
embedded software programming resources is embedded in the MPU. A pushbutton on this
board can be used for some user commands.

32
I/O
CO
NTR
OLL
ER
RESETWATCHDOG
TIMERON-CHIP VOLTAGE
REGULATOR
32-MHz CRYSTAL OSC.
HIGH SPEED RC-OSC
32.768-KHZ CRYSTAL OSC
32-KHz RC-OSC
DEBUG INTERFACE
CLOCK MUX AND CALLIBRATION
1KB USB FIFO USB
POWER ON RESET BROWN OUT
SLEEP TIMER
SLEEP MODE CONTROLLER
USB PHY
DMA8051 CPU
CORE
ADC AUDIO/DC
8 CHANNELS
MEMORY ARBITRATOR
AES ENCRYPTION
AND DECRYPTION
18/256 KB FLASH
8-KB SRAM
IRQ CTRL FLASH WRITE
RADIO REGISTERS
CS MA/CA STROBE PROCESSOR
USART 1
USART 2
TIMER 1 (16-Bit)
TIMER 2 IEEE802.15.4 MAC TIMER
TIMER 3 (8-Bit)
RADIO DATA INTERFACE
TIMER 4 (8-Bit)
MODULATORAGCDEMODULATOR
RECEIVE CHAIN
TRANSMIT CHAIN
FREQ
UEN
CY
SYN
THES
IZER
VDD(2V-3.6V)
DCOUPL
DP
DM
RESET_N
XOSC_Q2
XOSC_Q1
P2_4
P2_3
P2_2
P2_1
P2_0
P1_7
P1_6
P1_5
P1_4
P1_3
P1_2
P1_1
P1_0
P0_7
P0_6
P0_5
P0_4
P0_3
P0_2
P0_1
P0_0
RF_NRF_P
DIGITAL
ANALOG
MIXED
FIFO
AN
D F
RA
ME
CO
NTR
OL
Figure 13 Internal Structure of CC2531F256 [42]

33
Figure 14 The Master Processor Unit
3.1.3 The ADC and ECG amplifier
When ECG electrodes of the device collect a signal from the body, thus must be amplified.
Therefore, we apply an ECG front-end amplifier board with a notch filter block embedded in
it. This has amplification gain of 100 and includes a notch filter to remove power line noise;
therefore, it is set at 60 Hz. An amplified and filtered signal feeds the ADC and becomes
digitized. The ADC module includes high and low pass filters and the ADC itself. The ADC
employed in our device is ADS8320, TI. Its resolution is 16 bits and the maximum sampling
rate is 100 KS/sec. It is a prepared, plug and play analog ECG amplifier and filter module, as
illustrated in Figure 15.
Figure 15 ECG Amplifier and Filter Board

34
3.1.4 Mechanical parts
In addition to the aforementioned parts, some other elements are embedded in this device to
make it an all-inclusive instrument for BP and ECG measurement. BP measurement using an
oscillometric algorithm required a cuff. The necessity of a motorized air pump to inflate the
cuff automatically is also considered. A 5 volt motor and the air pump work together to
pump air into the bladder inside the cuff. On the other hand, to deflate the cuff, a bleed valve
is embedded in the device. To measure the pressure, a pressure transducer is required. These
pieces of equipment increase the device’s user friendliness because one can press a start
button and the procedure will begin. Delivering the most convenience to the user is one aim
of this design.
The BP measurement scenario is as follows. The user pushes the button, causing the system
to inflate the cuff and measure the blood pressure while receiving the ECG signal
simultaneously at the same time. Blood pressure and ECG signals are transmitted to the
processor and BP is measured accurately using the ECG. Then, both the ECG and BP signals
can be transmitted to a smartphone or a host PC/laptop wirelessly. The transfer of bio-signals
is currently such a hot topic that researchers who are working in the signal transmission area
sometimes use them; that is, they employ ECG signals to examine their methods’
effectiveness. One example of this is presented in [43]. In this device, we used an RF module
for the processor to send the data stream to a host node. Figure 16 gives a block diagram of
the device and its components.

35
AMP
Notch
filter (60
Hz)
ADC
&
HP/LP
Filter
ECG
Electrode
ECG Board
CC2531
(Main
proce-
ssor)
32 K of
External
Ram
Antenna
MPU
Motor Air pump
Pressure
transducer
Omron Cuff
Figure 16 Device Block Diagram
The air pump, 5 volt motor and regular air tubes transmitting air to the cuff, are illustrated in
Figure 17; the Omron cuff applied in this device is shown in Figure 18. Figure 19
demonstrates how the cuff is connected to the device.
Air Tubes
Figure 17 Air Tubes, Air Pump and Motor

36
Figure 18 Omron Blood Pressure Cuff
Figure 19 Cuff Connected to the Device
3.2 Software layers
Like any other microprocessor-based device, this one also needs controlling software to
carry out its procedure. The controlling code should be loaded into the flash memory of the
microprocessor. This code has the following two layers:

37
The hardware abstract layer; and
The application layer.
Below, we explain each of these in more detail.
3.2.1 The hardware abstract layer (HAL)
This layer of software sets the microprocessor’s internal registers in addition to initializing it
during power up. It includes some routines to access software reset, ring buffers and internal
timers of the microprocessor.
3.2.2 Application layer
The application layer is the main part of the software and controls the whole process of BP
measurement or ECG acquisition, that is, device performance is set by loading the
application layer into the microprocessor. Thus, this layer includes many routines to access
all peripherals, such as the ADC RF section. The pressure transducer and all mechanical
parts can also be controlled via the application layer code. The main function of the software
is to control the procedure and initiate the process when the user presses the start button. It
also set the internal registers of peripherals. Data collection, processing and transmission to
the host node through the RF part of the device are three main tasks of this layer.

38
3.2.3 Flash programming tools and debugger
All parts of our code should be loaded into the flash memory of the microprocessor.
Figure 20 IAR Embedded Workbench Editor Area
CC2531F256 includes 256KB of internal flash memory; we need to use the specific
debugger environment that TI has introduced to write the code in the memory. TI has
introduced the “IAR embedded Workbench IDE” to write the code; this can be done in C or
C++ programming languages. Figure 20 and Figure 21 show the IAR Editor Area and its
main panel, respectively.

39
Figure 21 IAR Main Panel
Texas Instruments has provided an evaluation board that can be used for two purposes. First,
it can be employed for learning jobs and working with the CC2531F256 microprocessor, and
second, it can be used as an interface to download the code to a target board. The evaluation
board connects to a PC through the USB port, and there is a certain programming connector
on it to connect it to a target board and program the microprocessor on the target board
through this connector. As mentioned above, a ribbon cable for programming purposes is
embedded in the MPU board; this is shown above in Figure 14. The evaluation board is
depicted in Figure 22.

40
The entire procedure involves writing the code in the IAR Editor window in C or C++,
compiling it and using the “download and debug” tool from the main toolbar of the IAR
Editor Area, as shown in Figure 23. Then, we need to select the target in a new popup
window and let the code load into the target processor, assuming that no error occurs.
Figure 22 Evaluation Board from TI
Figure 23 Download and Debug Tool
In the next chapter, we will show the results of collecting ECG signals with our device and
applying conductive textile as the ECG electrode.

41
Chapter 4: Experimental results
4.1 ECG Acquisition
In this chapter, we will show the results for the first objective of this thesis. The objective
here is to evaluate by what type of electrode and in what position on the body we will obtain
a proper ECG signal to be used in the ECG-assisted blood pressure measurement algorithm.
A proper ECG signal here means a signal without any missing R-peaks and also without any
fake detected R-peaks due to severe distortion or noise. To do this, first, we designed a piece
of code to collect the ECG and send it to the PC; on the host side, we had another code, this
time in MATLAB, to receive the signal continuously and show its graph. We collected the
ECG signal of one person from the wrists and biceps using both the conductive textile
electrode and regular gel Ag/AgCl (Red Dot, shown in Figure 24) electrode and compare the
results. Next, we acquired the ECG signal using two gold plates (shown in Figure 12)
touched to the fingertips. The gold plates were dry contact electrodes and with a size of 12
mm x 18 mm. In the next step of the experiment, we acquired the ECG signal using one gold
plate touched by the index fingertip of one hand and conductive textile on the bicep of the
opposite arm as the second electrode. The results of all these measurement configurations are
shown in Figure 25 through Figure 32. It should be mentioned that we did not use any kind
of skin preparation before data acquisition. Figure 25 to Figure 27 show results of our
experiments for wrists with various electrodes. When applying textile electrodes, one
electrode was wrapped around the right wrist, while the other electrode was on the left wrist.
When we applied the Red Dot electrodes, one was attached to the right wrist, and the other

42
to the left wrist. In this study we use two electrodes to acquire ECG, because it is more
comfortable for home health care devices. Other configurations with more electrodes are
also popular, especially for ECG recording devices in hospitals.
Figure 24 Regular Red Dot Ag/AgCl Electrode
4.1.1 Results for ECG acquired from the wrists
Figure 25 ECG(t) Captured from Wrists Using Gel Electrodes
0 1 2 3 4 5 6-0.02
-0.01
0
0.01
0.02
0.03
0.04
Time (Sec)
Am
plitu
de
(V)
Position: Wrists
Electrode type: Wet electrode

43
Figure 26 ECG(t) Captured from Wrists Using Textile Electrodes
Figure 27 ECG(t) Captured from Wrists Using One Wet and One Textile Electrode
4.1.2 Results for ECG acquired from biceps
Figure 28 to Figure 30 depict the results for ECG collection from biceps with various
electrodes. When applying textile electrodes, one electrode was wrapped around the right
bicep, while the other was on the left bicep; when we applied Red Dot electrodes, one was
attached to the right bicep, and the other to the left bicep.
0 1 2 3 4 5
-0.02
-0.01
0
0.01
0.02
0.03
0.04
Time (Sec)
Am
plitu
de (
V)
Position : Wrists
Electrode type: Conductive textile
0 1 2 3 4 5 6-0.025
-0.02
-0.015
-0.01
-0.005
0
0.005
0.01
0.015
0.02
0.025
Time (Sec)
Am
plitu
de
(V
)
Position : Wrists
Electrode type : one wet, one textile

44
Figure 28 ECG(t) Captured from Biceps Using Wet Electrodes
Figure 29 ECG(t) Captured from Biceps Using Textile Electrodes
0 1 2 3 4 5 6-0.02
-0.015
-0.01
-0.005
0
0.005
0.01
0.015
0.02
0.025
0.03
Time(Sec)
Am
plitu
de
(V
)
Position : Bicep
Electrode type :
Wet electrodes
0 1 2 3 4 5 6-0.03
-0.02
-0.01
0
0.01
0.02
0.03
Time (Sec)
Am
plitu
de
(V
)
Position : Biceps
Electrode Type :
Conductive Textile

45
Figure 30 ECG(t) Captured from Biceps Using One Wet and One Textile Electrode
As can be seen from the figures, the ECGs taken with Ag/AgCl electrodes had stable P, R
and T wave amplitudes, while signals taken with textile electrodes exhibited some variation
in amplitudes and were more contaminated by noise; on the other hand, their P, Q, R, S and
T waves were still recognizable. Thus, the acquired signals are acceptable for our purpose.
When we used two different electrodes types, we obtained smaller R-peak amplitudes. These
observations were valid for both positions, that is, wrists and biceps.
As mentioned above, some other configurations of electrodes are also tested. Figure 31
shows the ECG signal collected from two index fingertips touching gold plates, while Figure
32 depicts the result of collecting ECG from one index fingertip touching one gold plate and
one conductive textile on the bicep of the opposite arm.
0 1 2 3 4 5-0.025
-0.02
-0.015
-0.01
-0.005
0
0.005
0.01
0.015
0.02
Time (Sec)
Am
plitu
de
(V
)
Position: Biceps
Electrode type: One
wet, one textile

46
Figure 31 ECG(t) Captured from Fingertips Using Gold Plate Electrodes
Figure 32 ECG(t) Captured from Fingertips Using One Gold plate and One Textile Electrode
We can conclude that in all tested configurations, the acquired ECG signals were applicable
for ECG-assisted blood pressure measurement algorithms, since we did not detect any extra
R-peaks, nor did we miss any of them. However, some other factors still need to be
0 1 2 3 4 5 6-0.03
-0.02
-0.01
0
0.01
0.02
0.03
0.04
Time (Sec)
Am
plitu
de
(V
)
Position:fingertips
electrode type : Golden
plates
0 1 2 3 4 5 6-0.02
-0.015
-0.01
-0.005
0
0.005
0.01
0.015
0.02
0.025
0.03
Time(Sec)
Am
plitu
de (
V)
Position : Fingertip,
Bicep
Electrode type : Golden
plate, textile

47
investigated. Skin-electrode impedance and its effects on acquired ECG is our first concern,
followed by determining how this impedance varies under pressure. This is because in our
device, one ECG electrode made of conductive textile will be embedded in a cuff to acquire
ECG; ECG will be taken when the cuff is inflating, thereby applying pressure to the skin-
electrode interface. Therefore, we first explore the effects of the skin-electrode interface
impedance of conductive textile on ECG, and then study the effects of applying pressure on
skin-electrode interface impedance.

48
Chapter 5: Impacts of the skin-electrode interface on ECG
measured by conductive textile electrodes
Physicians’ understanding of bio-signals measured by medical instruments is the foundation
of their decisions and diagnoses for patients, as they strongly rely on what the instruments
tell them. Thus, it is critical to ensure that what the instruments show is exactly what is
happening in the patient’s body so that the acquired signal is real one or at least as close to
the real in-body signal as possible, carrying all of its information. This is such an important
issue that physicians sometimes use invasive approaches in order to generate accurate bio-
signal measurements. Generating an in-body signal from the signal acquired by a
measurement device is considered as “signal purification” or “reconstruction,” and can be
done only when we have adequate information about the interface between the body and the
monitoring device. In this chapter, we will propose a method of carrying out ECG
reconstruction from the ECG signal acquired by the proposed device using conductive textile
as the ECG electrode.
5.1 ECG signal purification: Our method
In this thesis, we propose a new method of reconstructing an ECG signal from the measured
one using the previously explained device and conductive textile as the ECG electrode. This
was done in order to mitigate the effects of the skin-electrode interface on measured ECG
and it is considered the main contribution of this thesis. Our method is based on measuring

49
and modeling the skin-electrode interface impedance. The impedance is a function of
frequency and ECG also has a frequency spectrum as well, while the ECG signal acquired
by the device is in the time domain. Thus, we need to migrate from the time domain to the
frequency domain and perform all calculations in the latter domain.
We also need to know the input resistance of the ECG amplifier board and its relation to the
ECG signal. Figure 33 gives a typical view of an ECG acquisition circuit with respect to
skin-electrode impedance and the input resistance of the amplifier. Equations (5), (6) and (7)
explain the relation between acquired ECG signals and other parameters. Here, and
are the input impedances of amplifiers, while ( ) and ( ) represent the skin-electrode
impedance of the electrodes collecting the signal.
+
-
1
~V
2
~V
1V
2V
)(1 Z
)(2 Z
1iR
2iR
Figure 33 General Circuit for ECG Acquisition
( ) ( )
( ) (5)
( ) ( )
( ) (6)
( ) ( ) ( ) ( )
( ) ( )
( )
(7)

50
We can assume that ( ) and ( ) are equal if both electrodes are identical in all
respects, such as material and size, which was the case in our study. The amplifiers used for
both electrodes were also identical, so . Thus, ECG can be calculated as follows:
( ) ( ) ( ) (8)
(9)
( )
( ) ( ( ) ( )) (10)
However, the real ECG signal before it is affected by skin-electrode impedance, called
( ), is:
( ) ( ) ( ) (11)
From Equations (10) and (11):
( ) ( ) ( )
(12)
As can be seen, all equations are in the frequency domain, while the acquired ECG is indeed
in the time domain. Therefore, in order to calculate the in the time domain, we
first need to find the in the frequency domain, calculate the in
the frequency domain according to the previous equation showing its relation to ( ), then
translate this from the frequency domain to the time domain to determine what the
signal is in the time domain. The signal is ECG in tissue under
the skin and before being affected by the skin-electrode interface. Eventually, we need to
compare ( ) with ( ) to examine the differences between them

51
and investigate distortions caused by the skin-electrode interface, as well as how this
interface can influence the interpretation of ECGs from a medical perspective.
In order to purify the ECG signal acquired by our device and conductive textile electrodes,
we needed to measure the skin-electrode interface and identify its model components based
on the single–time constant model described in chapter 2. In the next section, the skin-
electrode interface measurement procedure will be explained.
5.2 Skin-electrode impedance measurement
For skin electrode impedance measurement as a function of frequency, we used state-of-the-
art equipment, specifically a frequency response analyzer and impedance interface. The
measurement configuration is described below.
5.2.1 Experimental setup
Frequency Response
Analyzer
Impedance
Interface Device
Skin
Electrode1 Electrode2
Figure 34 Experimental Setup for Skin-Electrode Interface Measurement
A block diagram of the experimental setup applied in this study is shown in Figure 34. This
represents a two-electrode configuration that works based on injecting a current sine wave

52
signal from one electrode and collecting the same signal from the other electrode, as well as
measuring the voltage drop between two electrodes.
5.2.2 Devices and measurement configuration
Our measurement configuration is depicted schematically in Figure 35.
Rs1Cd1
Rd1
Rs2Cd2
Rd2
Rtissu
e
Figure 35 Schematic View of Skin-Electrode Impedance Measurement
We needed to determine the impedance of a single skin electrode interface, while our
measurements showed the total value of both electrodes plus tissue impedance. If both
electrodes are identical in terms of type, material and size, then we can assume that they
have the same skin-electrode interface. In this experiment, we applied two identical
electrodes made of medical-grade, silver-plated 92% nylon and 8% Dorlastan stretchable
conductive textile. Each electrode was 0.50 mm thick and 3 cm x 18 cm in size. They were
therefore identical and we could divide the total amount by two to determine the skin-
electrode interface for a single electrode. represents the resistance of tissues between
two electrodes. For a healthy human’s middle upper arm (where we do the measurements),
this value is found to be almost 150 Ω [44], while the electrode skin impedance is larger than
1 MΩ. According to this, in our study is assumed to be negligible and its contribution
is considered in .

53
Figure 36 shows the bio-impedance measurement system we used to measure electrode-skin
impedance in response to the AC current with a variable frequency from 1 Hz to 1 MHz with
respect to safety standards for current amplitude. This system included a frequency response
analyzer (FRA) (Model # 1255B, Solartron Analytical, UK) visible in Figure 36 on the left
and an impedance interface device (Model # 1294A, Solartron Analytical, UK) on the right,
as well as a personal computer.
Skin-electrode impedance was measured by injecting a 10 µA AC current sweeping
frequency from 1 Hz to 1 MHz to one electrode located on the left bicep and collecting it
from the other electrode on the same bicep at 10 cm distance from the first one. Solartron
provides user-friendly impedance measurement software called “SMaRT.” The user can
select the sine wave type (voltage or current), its amplitude, fixed frequency or a frequency
range, the number of cycles to be averaged and the number of points in a frequency decade.
Results can be shown in a plot, where a “Bode” or linear diagram may be selected, as well as
in an Excel file like a table with several columns showing time, frequency and magnitude of
impedance. For this study, the system was set to measure five points per frequency decade
Figure 36 Frequency Response Analyzer (left), Impedance Interface Device (right)

54
and average 10 cycles per frequency. Figure 37 shows the results of our experiments in
logarithmic scale.
Figure 37 Skin-Electrode Impedance Frequency Response
5.2.3 Estimating skin-electrode impedance model components and
verification
Applying the least squares nonlinear curve fitting method, we tried to estimate three
components of the skin-electrode impedance model, specifically , and , as depicted
in Figure 38. This is the simplified single–time constant model applicable in our study.
was not applicable in our model because we used dry electrodes, which are polarizable, and
electrolyte was present. In this thesis, we implemented this method in MATLAB (R2008a)
by applying the “lsqcurvefit” function.
RsCd
Rd
Figure 38 Single–Time Constant Model of Skin-Electrode Impedance
100
101
102
103
104
105
106
101
102
103
104
105
106
107
Frequency (Hz)
Z(
)

55
We have already measured the magnitude of impedance varying by frequency. We now need
to estimate our model parameters such that | ( )| of the model matches our observation and
the obtained curve shown in Figure 37. The least squares nonlinear curve fitting method
provides the best fit impedance model from the measured impedance values; this is done by
minimizing the summed squared of the error between the data point and the fitted model.
MATLAB code based on the experimental data returned the following values for the three
components:
( )
( )
In order to verify whether our model matches the observation or not, we substituted the
values of the components in Equation (13), which is the mathematical relation between
| ( )| and its three components. We then drew a graph of | ( )| as a function of frequency
and observed graph data on the same plane for comparative purposes. Figure 39 illustrates
these results.
| ( )| | ( ) ( )| |
|
(13)

56
Figure 39 Measured Data and the Estimated Model
5.2.4 Implementing the algorithm
With respect to the following equation and measured parameters of the skin electrode
impedance model, we needed to find the ( ).
( ) ( ) ( )
Considering how we measure skin electrode impedance, we had to acquire ECG with the
same configuration of the electrodes as for the impedance measurement. Therefore, we
captured ECG from two conductive textile electrodes on one bicep, with a distance of 10 cm
from each other. Figure 40 shows the ECG signal acquired in this way.
100
101
102
103
104
105
106
101
102
103
104
105
106
107
Frequency (Hz)
|Z| (
)
Measured
Estimated

57
Figure 40 Acquired ECG(t), Taken by the Device and Two Textile Electrodes on One Bicep
Based on our previous explanations, the goal here was to remove the skin-electrode
impedance effects from the ECG signal shown in Figure 40. From Equation (12), we first
have to calculate ( )
using the values of all components, including and . The
input resistance of the amplifier we used was measured and found to be . By
substituting all values in equation ( )
and plotting its graph per frequency in linear
scale, the graph in Figure 41 is obtained.
Figure 41 Magnitude of (Ri+Z)/Ri Per Frequency
0 0.5 1 1.5 2 2.5 3 3.5 4 4.5-0.03
-0.02
-0.01
0
0.01
0.02
0.03
Time (Sec)
Am
plitu
de (
V)
0 10 20 30 40 50 60 70 80 90 1001
1.2
1.4
1.6
1.8
2
2.2
2.4
2.6
2.8
3(Ri+Z(f))/Ri
Frequency (Hz)

58
Consequently, we needed to find in the frequency domain. To obtain that,
we needed to apply Fourier transform. Taking the fast Fourier transform (FFT) of the
in the time domain results in the in the frequency domain.
This activity was carried out on MATLAB and by applying the FFT function on samples we
obtained when we took ECG measurements in the time domain. Figure 42 depicts the FFT
of . As can be seen in this figure, the ECG has the largest frequency content
at frequencies below 15 Hz. According to this, we anticipate more changes in those parts of
the ECG waveform that are from this range of frequency, for example, T-wave.
Figure 42 Acquired ECG in the Frequency Domain
In order to obtain in the frequency domain, according to Equation (12), we
needed to multiply the data shown in Figure 41 by those shown in Figure 42. The results are
depicted in Figure 44.
0 10 20 30 40 50 60 70 80 90 1000
1
2
3
4
5
6
7
8
9
10 FFT of Detected ECG
Frequency(Hz)

59
Figure 43 In-Body ECG in the Frequency Domain
What we have obtained so far is our desired signal, that is, the in the
frequency domain. By integrating this, we can convert it to its corresponding signal in the
time domain. Integration is carried out by applying the IFFT function in MATLAB. In
Figure 44, we present the ( ) and ( ) on the same graph to
make the differences easy to observe. We must also mention that, since ECG is a periodic
signal, we eliminated the phase shift effects resulting from imaginary part of skin-electrode
impedance. This also makes comparison of the primary ECG signal and the obtained one
easier.
Figure 44 Acquired and In-Body ECG Waveforms
0 10 20 30 40 50 60 70 80 90 1000
5
10
15
20
25 FFT of In-body ECG
Frequency (Hz)
0 1 2 3 4 5-0.03
-0.02
-0.01
0
0.01
0.02
0.03
Time(sec)
Am
plit
ud
e (
V)
In-body ECG
Acquired ECG
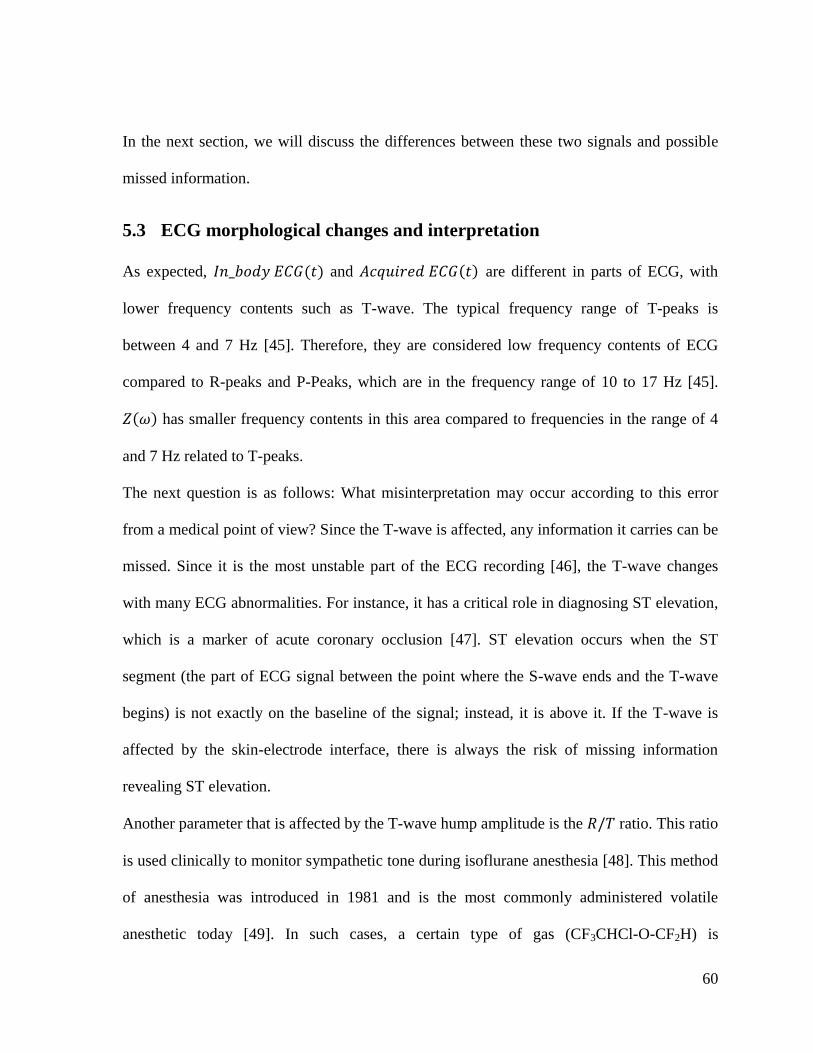
60
In the next section, we will discuss the differences between these two signals and possible
missed information.
5.3 ECG morphological changes and interpretation
As expected, ( ) and ( ) are different in parts of ECG, with
lower frequency contents such as T-wave. The typical frequency range of T-peaks is
between 4 and 7 Hz [45]. Therefore, they are considered low frequency contents of ECG
compared to R-peaks and P-Peaks, which are in the frequency range of 10 to 17 Hz [45].
( ) has smaller frequency contents in this area compared to frequencies in the range of 4
and 7 Hz related to T-peaks.
The next question is as follows: What misinterpretation may occur according to this error
from a medical point of view? Since the T-wave is affected, any information it carries can be
missed. Since it is the most unstable part of the ECG recording [46], the T-wave changes
with many ECG abnormalities. For instance, it has a critical role in diagnosing ST elevation,
which is a marker of acute coronary occlusion [47]. ST elevation occurs when the ST
segment (the part of ECG signal between the point where the S-wave ends and the T-wave
begins) is not exactly on the baseline of the signal; instead, it is above it. If the T-wave is
affected by the skin-electrode interface, there is always the risk of missing information
revealing ST elevation.
Another parameter that is affected by the T-wave hump amplitude is the ratio. This ratio
is used clinically to monitor sympathetic tone during isoflurane anesthesia [48]. This method
of anesthesia was introduced in 1981 and is the most commonly administered volatile
anesthetic today [49]. In such cases, a certain type of gas (CF3CHCl-O-CF2H) is

61
administered that has a short induction and recovery time. During general anesthesia, the T-
wave amplitude decreases [48]; isoflurane anesthesia significantly decreases the T-wave
amplitude but does not influence the R-peak. The authors in [48] showed that the R/T ratio is
a reliable method for monitoring sympathetic tone during isoflurane anesthesia [48].
In addition to the aforementioned parameters, the Q-T interval is also affected by the skin-
electrode interface, and in ECG interpretation, Q-T interval prolongation indicates a specific
form of ventricular tachycardia [46]. Thus, if the T wave is not detected accurately, Q-T
prolongation may be missed. The Q-T interval is defined as the part of ECG signal from the
point at which the Q wave starts to the point at which the T-wave ends. Its time duration
depends on a patient’s heart rate; if it is longer than it should be, the patient may have some
kind of cardiac problem [50]. Hence, if the T-wave shape is not accurately detected,
physicians can miss the presence of QT prolongation.
To sum up, any ECG parameter related to the T-wave can be affected; among these, we have
introduced three major ones, specifically ST elevation recognition, ratio and Q-T
prolongation. Any of these is an applicable indicator for a particular heart abnormality or
situation.
We have determined that skin-electrode interface impedance affects the quality and
morphology of ECG signal, and we have learned how to reconstruct the ECG signal to
obtain purity. Moreover, we discussed issues that the skin-electrode interface causes from a
medical point of view. We want to find a way to minimize these effects so that an ECG
signal can be acquired which is the same as the In-Body ECG. One possible solution for this
is to minimize the skin-electrode interface impedance. The technical solution we selected is
to apply pressure in order to obtain better contact between the electrode and skin, and

62
therefore smaller skin-electrode impedance. In [51], the authors showed that applying
pressure will decrease the skin-electrode impedance; their experiments involved Ag/AgCl
electrodes. We will apply pressure to our electrode, that is, AgNy conductive textile and
investigate how the skin-electrode impedance varies.
We chose a method of applying pressure based on the fact that our device is appropriate for
ECG-assisted blood pressure measurements using the algorithm presented in [3]. Therefore,
it is expected that we can use our electrode under the cuff. Thus, we put both electrodes
under a regular Omron cuff and inflated it up to a certain pressure; we then measured the
skin-electrode interface impedance as we did above. Below, we describe how accomplished
this and how external pressure affects the skin electrode interface and each of the
components.
5.4 Applying pressure to the ECG electrodes
For our measurements, to investigate the effects of pressure on conductive textile skin-
electrode interface impedance, we set up the system as explained above; the only difference
was that when we wanted to measure the impedance, we applied pressure by the cuff, with
the electrodes located underneath. We kept the pressure of the cuff constant during each
measurement. The pressure measurement and maintenance procedures were as follows:
1. Close the valve and turn on the motor to let the cuff inflate; read the pressure
continuously while doing this;
2. When this pressure is at the desired point, the MPU should turn off the motor to stop
inflation. However, we still need to measure the pressure inside the cuff. If it is lower
than our desired value due to leakage, MPU should compensate for this. This means

63
that the motor needs to be turned on again and the cuff inflated to reach the desired
value with consistent monitoring.
We applied pressure from 0 mmHg up to 120 mmHg in 40 mmHg steps. For consistency
with our previous measurements, we used the single–time constant model for the interface
and the least squares nonlinear curve fitting method for component value estimation. The
variation trend line of each component, that is, , and , was tracked and drawn in the
following graphs. To ensure that time did not affect our measurements by establishing better
contact between the skin and electrode, after performing the measurement for each pressure
value, we deflated the cuff, removed it and the electrodes, waited for 10 minutes and then
did the next measurement for another pressure value. Figure 45 shows the measurement
configuration. Skin-electrode impedance as a function of frequency was measured using a
frequency response analyzer (Model # 1255B, Solartron Analytical, UK) and an impedance
interface device (Model # 1294A, Solartron Analytical, UK), both shown in Figure 36.
Frequency Response
Analyzer
Impedance Interface
Device
Bicep
Electrode2
Cuff Applying
pressure
Electrode1
Figure 45 Applying Pressure to Skin-Electrode Impedance Using a Cuff

64
5.5 Results and discussion
In this thesis, we performed the measurements for three different subjects; our results are
illustrated using tables and graphs. This was done to determine the rate of variation of all
three components in the skin-electrode interface model. Measurements were carried out on
healthy subjects (2 females, 1 male). None of the volunteers was taking any medication or
had a known history of cardiovascular disease. All subjects provided a signed informed
consent form for the pressure skin-electrode measurement, in accordance with the guidelines
of the institutional research ethic board. The entire procedure was carried out as follows:
a. Both electrodes were placed on the subject’s bicep at a 10 cm distance from
each other. The electrodes were also connected to Solartron devices;
b. The Omron cuff was wrapped around subject’s bicep on top of the
electrodes.
c. The MPU started to work when the user pushed the button. The motor turned
on, resulting in cuff inflation. The MPU kept the pressure level constant;
d. The cuff pressure was read continuously until it reached a certain level. Then
the motor turned off;
e. The measurement procedure with Solartron devices began and the result was
saved in the PC as .xlsx files.
f. The components of the model were determined by applying the “lsqcurvefit”
function in MATLAB.
g. All components from the single–time constant model were extracted.

65
Table 3 shows all subjects’ gender, height, weight and body mass index (BMI), which is
defined as follows:
( ) (14)
Table 3 Subjects’ characteristics
Figure 46, Figure 47 and Figure 48 show the |Z| variation per frequency for the first, second
and third subjects. The frequency varied between 0 Hz and 1 MHz. The |Z| values for
various pressures are shown on the same graph in logarithmic scale. The value of |Z|
corresponding to the lowest pressure (P = 0 mmHg) and that corresponding to the maximum
pressure we apply (P = 120 mmHg) represent the highest and lowest curves, respectively.
Figure 46 Skin-Electrode Impedance Variation for Subject 1
100
101
102
103
104
105
106
101
102
103
104
105
106
107
Frequency (Hz)
|Z| (
)
P=0mmHg
P=40mmHg
P=80mmHg
P=120mmHg
Gender Height Weight Body Mass Index
Subject1 Female 172 cm 68 kg 23.25
Subject2 Male 181 cm 59 kg 18
Subject3 Female 162 cm 56 kg 21.34

66
Figure 47 Skin-Electrode Impedance Variation for Subject 2
Figure 48 Skin-Electrode Impedance Variation for Subject 3
Measurements were followed by parameter extraction for each curve. The following tables
show the results.
Table 4 Rd values under various pressures for all subjects
100
101
102
103
104
105
106
101
102
103
104
105
106
Frequency (Hz)
|Z|(
)
P=0mmHg
P=40mmHg
P=80mmHg
P=120mmHg
100
101
102
103
104
105
106
101
102
103
104
105
106
107
Frequency (Hz)
|Z| (
)
P=0mmHg
P=40mmHg
P=80mmHg
P=120mmHg
Rd(Ohm) Subject1 Subject2 Subject3
P = 0 mmHg 9.8726e5 3.1111e5 1.1269e6
P = 40 mmHg 5.3802e5 1.2128e5 4.6961e5
P = 80 mmHg 3.3860e5 8.0358e4 3.2839e5
P = 120 mmHg 2.2254e5 5.8393e4 2.4325e5

67
Table 5 Cd values under various pressures for all subjects
5.6 Table 6 Rs values under various pressures for all subjects
Rs(Ohm) Subject1 Subject2 Subject3
P = 0 mmHg 116.6971
49.6238
102.0390
P = 40 mmHg 79.2531
49.2282
91.7804
P = 80 mmHg 79.0467
43.9881
85.7127
P = 120 mmHg 86.8678
45.9717
83.3345
Figure 49 to Figure 51 show the model components, including and variations for
each subject. In each figure, the first graph shows the variation in ; that in the middle
shows variation in the capacitor of the model, that is, and that at the bottom shows the
variation in . The three sets of graphs are similar and each gives data for one of the three
subjects.
Cd (F) Subject1 Subject2 Subject3
P = 0 mmHg 1.5884e-8
1.9415e-8
9.7479e-9
P = 40 mmHg 3.8101e-8
5.1575e-8
2.2302e-8
P = 80 mmHg 5.6327e-8
8.3218e-8
3.2251e-8
P = 120 mmHg 1.0557e-7
1.2467e-7
4.2331e-8

68
Figure 49 Component Variation Rate Versus Pressure for Subject 1
Figure 50 Components Variation Rate Versus Pressure for Subject 2
0 20 40 60 80 100 1200
5
10x 10
5
Pressure(mmHg)
Rd
( )
0 20 40 60 80 100 1200
0.5
1
1.5x 10
-7
Pressure(mmHg)
Cd
(F
)
0 20 40 60 80 100 12060
80
100
120
Pressure(mmHg)
Rs(
)
0 20 40 60 80 100 1200
2
4x 10
5
Pressure(mmHg)
Rd(
)
0 20 40 60 80 100 1200
0.5
1
1.5x 10
-7
Pressure(mmHg)
Cd (
F)
0 20 40 60 80 100 12040
45
50
Pressure(mmHg)
Rs (
)

69
Figure 51 Components Variation Rate Versus Pressure for Subject 3
5.6.1 Discussion
As can be seen from the graphs, continued to decrease while external pressure increased.
This is unsurprising considering what represents—the electrical charges between the skin
and the electrode. The value of any capacitor can be formulated according to general
definition of capacitor. A capacitor forms when two plates are paralleled; the value of the
capacitor between the two plates is expressed by Equation (15).
(15)
The parameters in this equation are defined as follows [52]: C is the capacitance in Farad
(F), shows the dielectric constant of the material between two parallel plates, stands for the
0 20 40 60 80 100 1200
5
10
15x 10
5
Pressure(mmHg)
Rd
(
)
0 20 40 60 80 100 1200
0.5
1x 10
-7
Pressure(mmHg)
Cd
(F
)
0 20 40 60 80 100 12080
90
100
110
Pressure(mmHg)
Rs (
)

70
electric constant (approximately 8.85 X 10⁻¹² F m-1), A is the effective common area between two
parallel plates (m2) and d is the distance between the parallel plates (m).
This equation elucidates ’s response under pressure. Applying pressure makes the effective
area between the two parallel plates larger, while making the distance between them smaller.
Pressing the electrode toward the skin results in smaller d and larger A, and on the other hand C
is directly proportional to effective area A and reversely proportional to distance d therefore it
comes up with a larger value of .
We were also able to anticipate the behaviour of under pressure. stands for resistance and
occurs due to the charge transfer between the skin and electrode. The resistance of any material
can be formulated as Equation (16).
(16)
The parameters in this equation are defined as follows [52]: R is the resistance in ohm (Ω); ρ
is the resistivity of the material with the dimension of (Ω.m); L is the length of the material
with the dimension of (m); and A is the cross-sectional area of the conductor material with
the dimension of (m2).
In the procedure of pressure application, the contact area between the skin and electrode
increases, resulting in smaller values of .
For analyzing behaviour of , we can again refer to Equation (16). Applying pressure
creates more contact area between sweat and the electrode, thereby lowering the value of .
In our case, however, because we let the sweat evaporates after each measurement,
remained approximately constant after 40 mmHg of pressure.
According to our observations and measurements, we can conclude that applying pressure to
the electrodes decreases skin-electrode impedance and thus reduces its impact on the

71
acquired ECG. In other words, applying pressure makes the acquired ECG closer to the In-
Body ECG.

72
Chapter 6: Conclusion and Future work
6.1 Conclusion
In recent years, conductive textile has become increasingly popular in medical applications,
particularly for home health care devices. This is because it is a user-friendly type of
electrode, bringing users convenience and comfort compared to gel electrodes, which are
disposable and cause skin irritation. Moreover, unlike gel electrodes, the signal delivered by
conductive textile does not fade out. In this study, we developed a hardware-based
configuration appropriate for obtaining ECG signals with conductive textile and we acquired
ECG using various types of electrodes from different locations on the body. This was done
to evaluate the overall quality of ECG sensed by textile electrodes. Another purpose of this
part of our work was to explore whether the obtained ECG signal was suitable for ECG-
assisted blood pressure measurement algorithms. We showed that conductive textile is a
good choice for this purpose, since the ECG signals we acquired with it can be applied using
ECG-assisted blood pressure measurement algorithms.
In the next step of this study, we looked into problems that skin-electrode impedance can
cause for the quality of ECG signal registered at the electrodes. In order to address this, we
measured skin-electrode interface impedance variation by frequency. Moreover, we
explained the procedures for modeling this in a simplified equivalent circuit. A new method
of reconstructing ECG was also proposed and we showed that the skin electrode interface
influences the quality and shape of the ECG signal registered at the electrode. Impact of skin
electrode interface was shown and the procedure for detecting the differences between

73
affected ECG and In-Body ECG was explained. In-Body ECG is one step closer to what
really happens in the heart; therefore, we can consider this a pure ECG signal. This thesis
also explored the effects of the skin-electrode interface from a morphological perspective
and some affected parameters were briefly presented.
In the next step of this work, we proposed a method to optimize the ECG sensed by our
electrodes. This method was based on minimizing skin-electrode interface impedance by
applying pressure. We also measured this impedance under various pressure values and
explored how its components vary under different pressure levels. Measurements were taken
for three subjects. The variation rates in all components were observed and their graphs were
plotted.
Based on our measurements, skin-electrode interface impedance decreases when we apply
pressure; this means that under such condition, Acquired -ECG exhibits less difference from
In-Body ECG compared to when pressure is not applied. Therefore, we can assume that our
device is capable of taking accurate ECG readings if we acquire ECG while applying
pressure’ this is what occurs in reality when we use this system to implement ECG-assisted
blood pressure measurement.
6.2 Future work
In the future, we can extend our work along several lines. We will discuss some of them
here.
6.2.1 Parameters affecting skin-electrode impedance
In future work, we will expand our research to do perform such measurements for more
subjects in order to analyze how skin-electrode interface components vary according to age,

74
gender and BMI; moreover, we will take ECG readings under different pressure values to
evaluate the differences between Acquired-ECG and In-Body ECG under pressure.
6.2.2 Impact of different electrodes on ECG
So far, we have determined the effects of the skin-electrode interface on the ECG signal for
AgNy conductive textile. In the future, we can expand this work by performing the same test
for other types of electrodes, for example, gel electrodes and gold plates. Such experiments
can be carried out by placing these electrodes under the cuff, applying pressure and repeating
the same steps we used for conductive textile. Another expansion of this work will involve
measuring intra- and extracellular fluids and their effects on ECG quality.
6.2.3 Intra- and extracellular fluid
Since the device we developed can apply pressure, we can use it for other purposes as well.
One potential area is the measurement of extracellular water, since this varies with pressure.
Therefore, we can explore how its variation influences ECG.
For this part of the research, we first need to know more about intra- and extracellular fluids
and their definitions. Water in the body is stored in two forms—inside the cells (termed
intracellular water, ICW) and between cells (extracellular water, ECW). When a limb is
pressed, extracellular water is removed from one area and migrates to another that is not
under pressure; on the other hand, intracellular water remains inside the cell and does not
change place. Total body water (TBW) plays an important role in total body electrical bio-
impedance, and ECW and ICW have their own roles. Total body electrical bio-impedance is
measured in relation to frequency, and there is a certain function called the Cole function,
which was introduced by K.S. Cole in 1940, associated with this bio-impedance. Cole
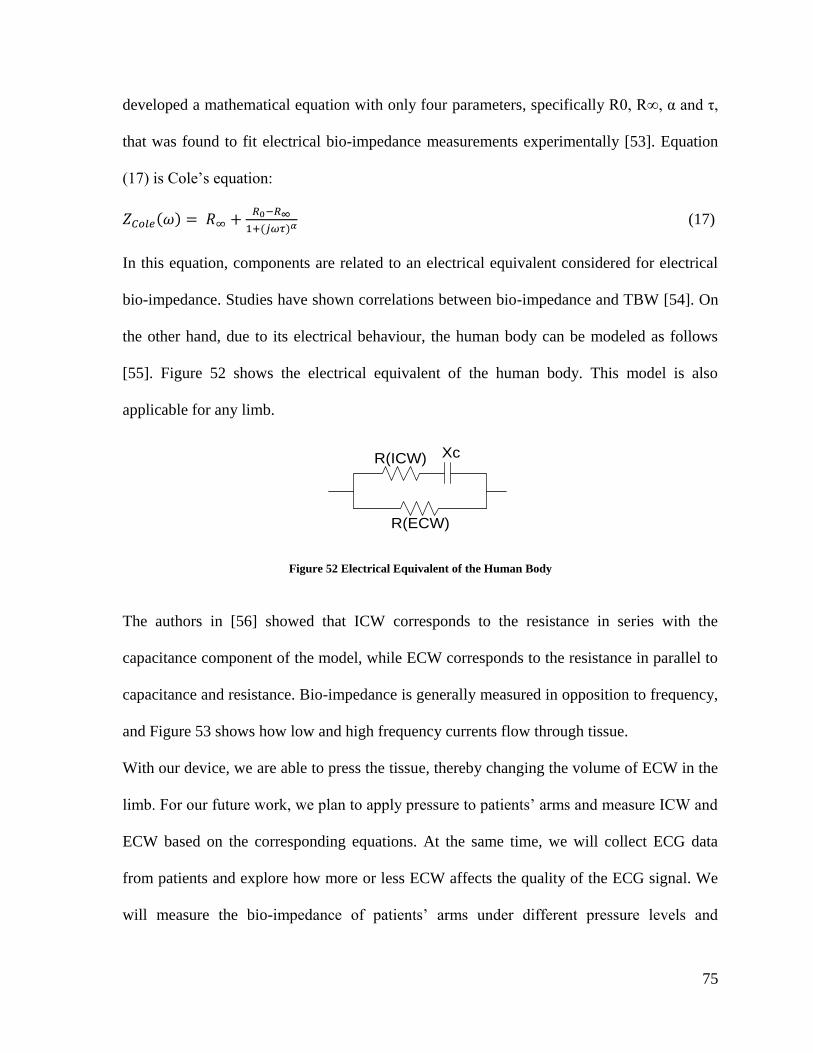
75
developed a mathematical equation with only four parameters, specifically R0, R∞, α and τ,
that was found to fit electrical bio-impedance measurements experimentally [53]. Equation
(17) is Cole’s equation:
( )
( ) (17)
In this equation, components are related to an electrical equivalent considered for electrical
bio-impedance. Studies have shown correlations between bio-impedance and TBW [54]. On
the other hand, due to its electrical behaviour, the human body can be modeled as follows
[55]. Figure 52 shows the electrical equivalent of the human body. This model is also
applicable for any limb.
R(ECW)
XcR(ICW)
Figure 52 Electrical Equivalent of the Human Body
The authors in [56] showed that ICW corresponds to the resistance in series with the
capacitance component of the model, while ECW corresponds to the resistance in parallel to
capacitance and resistance. Bio-impedance is generally measured in opposition to frequency,
and Figure 53 shows how low and high frequency currents flow through tissue.
With our device, we are able to press the tissue, thereby changing the volume of ECW in the
limb. For our future work, we plan to apply pressure to patients’ arms and measure ICW and
ECW based on the corresponding equations. At the same time, we will collect ECG data
from patients and explore how more or less ECW affects the quality of the ECG signal. We
will measure the bio-impedance of patients’ arms under different pressure levels and

76
estimate the components of the bio-impedance model depicted in Figure 52 through the
application of certain techniques and methods. Then, we will apply pressure by inflating the
cuff of our device and measuring ECG in this situation. Next, we will compare the ECG
signals acquired under different pressures and thus different ECW volumes. In this way, we
will identify the relationship between ECW and quality of ECG.
Figure 53 High- and Low-Frequency Current Distribution in Intra- and Extracellular Water [56]

77
References
[1] P. Csordás, A. Mersich and A. Jobbágy, "Advanced indirect method for measuring
blood pressure," Electrical Engineering and Computer Science, vol. 53, no. 3-4, pp.
115-121, 2011.
[2] S. Ahmad, M. Bolic, H. Dajani, V. Groza, I. Batkin and S. Rajan, "Measurement of
Heart Rate Variability Using an Oscillometric Blood Pressure Monitor," IEEE
Transactions on Instrumentation and Measurement, vol. 59, no. 10, pp. 2575-2590,
2010.
[3] S. Ahmad, S. Chen, K. Soueidan, I. Batkin, M. Bolic, H. Dajani and V. Groza,
"Electrocardiogram-assisted blood pressure estimation," IEEE Transactions on
Biomedical Engineering, vol. 59, no. 3, pp. 608-618, 2012.
[4] J. Webster, Medical instrumentation: application and design, 4 ed., John Wiley &
Sons, 2009, pp. 196-198.
[5] "texasheartinstitute," 2012. [Online]. Available:
http://www.texasheartinstitute.org/HIC/Topics/Cond/sicksinus.cfm.
[6] "hyperphysics," [Online]. Available: http://hyperphysics.phy-
astr.gsu.edu/hbase/biology/ecg.html.
[7] G. Bojanov, Handbook of cardiac anatomy, physiology, and devices, P. Iaizzo, Ed.,
NJ: Ed. Totowa, Humana Press,, 2005.
[8] J. Jilek and T. Fukushima, "Oscillometric blood pressure measurement: the
methodology some observations and suggestions," Biomedical Instrumentation and

78
Technology, vol. 39, no. 3, pp. 237-241, 2005.
[9] S. Chen, M. Bolic, V. Groza, H. Dajani, I. Batkin and S. Rajan, "Extraction of
Breathing Signal and Suppression of Its Effects in Oscillometric Blood Pressure
Measurement," IEEE Transactions on Instrumentation and Measurement, vol. 60, no.
5, pp. 1741-1750, 2011.
[10] D. C. Claudio, A. Meduri and M. Rosario, "A Smart ECG Measurement System Based
on Web-Service-Oriented Architecture for Telemedicine Applications," IEEE
Transactions on Instrumentation and Measurement, vol. 59, no. 10, pp. 2530-2538,
2010.
[11] C. T. Lin, K. C. Chang, C. L. Lin, C. C. Chiang, S. W. Lu, S. S. Chang, B. S. Lin, H.
Y. Liang, R. J. Chen, Y. T. Lee and L. W. Ko, "An Intelligent Telecardiology System
Using a Wearable and Wireless ECG to Detect atrial fibrillation," IEEE Transactions
on Information Technology in Biomedicine, vol. 14, no. 3, pp. 726-733, 2010.
[12] E. Nemati, M. Deen and T. Mondal, "A wireless wearable ECG sensor for long-term
applications.," IEEE Communications Magazine, vol. 50, no. 1, pp. 36-43, 2012.
[13] G. Lamarque, P. Ravier and C. Dumez Viou, "A New Concept of Virtual Patient for
Real-Time ECG Analyser," IEEE Transactions on Instrumentation and Measurement,
vol. 60, no. 3, pp. 939-946, 2011.
[14] M. A. Mestrovic, R. J. Helmer, L. Kyratzis and D. Kuma, "Preliminary study of dry
knitted fabric electrodes for physiological monitoring," in Intelligent Sensors, Sensor
Networks and Information 3rd International Conference, 2007.
[15] I. Lee, S. Shin, Y. Jang, Y. Song, J.-W. Jeong and S. Kim, "Comparison of conductive

79
fabric sensor and Ag-AgCl sensor under motion artifacts," in Engineering in Medicine
and Biology Society, EMBS 2008. 30th Annual International Conference of the IEEE,
2008.
[16] A. Karilainen, S. Hansen and J. Muller, "Dry and Capacitive Electrodes for Long-
Term ECG-Monitoring," in 8th Annual workshop on Semiconductor Advances, 2005.
[17] C. Yu Mike, T.-P. Jung and G. Cauwenberghs, "Dry-Contact and Noncontact
Biopotential Electrodes:Methodological Review," IEEE Reviews in Biomedical
Engineering, vol. 3, pp. 106-119, 2010.
[18] M. Ishijima, "cardiopulmonary monitoring by textile electrodes without subject
awareness of being monitored," Medical and Biological Engineering and Computing,
vol. 35, no. 6, pp. 985-690, November 1997.
[19] B. Taji, S. Shirmohammadi, V. Groza and M. Bolic, "An ECG Monitoring System
Using Conductive Fabric," in Medical Measurements and Applications Proceedings
(MeMeA), 2013 IEEE International Symposium on, 2013.
[20] J. Yoo, L. Yan, S. Lee, H. Kim and H.-J. Yoo, "A wearable ECG acquisition system
with compact planar-fashionable circuit board-based shirt," IEEE Transactions on
Information Technology in Biomedicine, vol. 13, no. 6, pp. 897-902, 2009.
[21] C. Park, P. H. Chou, Y. Bai, R. Matthews and A. Hibbs, "An ultra-wearable, wireless,
low power ECG monitoring system," in Biomedical Circuits and Systems Conference
BioCAS 2006, 2006.
[22] S. Grimnes and O. Martinsen, Bioimpedance and bioelectricity basics, 2nd ed.,
Amsterdam: Academic Press, 2008.

80
[23] R. H. Champion, J. L. Burton and F. Eblin, Textbook of Dermatology, 5th ed., vol. 4,
Blackwell: Oxford, 1992.
[24] C. Tronstad, G. K. Johnsen, S. Grimnes and Ø. G. Martinsen, "A study on electrode
gels for skin conductance measurements," Physiol Meas, vol. 31, no. 10, pp. 1395-
1410, 2010.
[25] E. Warburg, "About the behaviour of so-called “impolarizable electrodes” in the
present of alternating current," Ann. Phys. Chem, vol. 67, pp. 493-499, 1899.
[26] F. Feates, D. Ives and J. Pryor, "Alternating current bridge for measurement of
electrolytic Conductance," Journal of The Electrochemical Society, vol. 103, no. 10,
pp. 580-585, 1956.
[27] D. Swanson and J. Webster, A model for skinelectrode impedance, Academic Press,
1974, pp. 117-128.
[28] B. R. Eggins, "Skin contact electrodes for medical applications," Analyst, vol. 118, no.
4, pp. 439-442, April 1993.
[29] L. A. Geddes and M. E. Valentinuzzi, "Temporal changes in electrode impedance
while recording the electrocardiogram with “dry” electrodes," Annals of Biomedical
Engineering, vol. 1, no. 3, pp. 356-367, 1973.
[30] M. Neuman, Biopotential Electrodes , In:Medical Instrumentation_application and
Design, 3rd ed., John Wiley & Sons, 1998, pp. 183-232.
[31] C. Assambo, A. Baba, R. Dozio and M. J. Burke, "Determination of the Parameters of
the Skin-Electrode Impedance Model for ECG Measurement," in Proceedings of the
6th WSEAS international conference on electronics, hardware, wireless and optical

81
communications, 2007.
[32] M. S. Spach, R. C.Barr, J. W. Havstad and E. Croft Long, "Skin-Electrode Impedance
and Its Effect on Recording Cardiac Potentials," Circulation, vol. 34, no. 4, pp. 649-
656, 1966.
[33] G. Medrano, A. Ubl, N. Zimmermann, T. Gries and S. Leonhardt, "Skin Electrode
Impedance of Textile Electrodes for Bioimpedance Spectroscopy," in 13th
International Conference on Electrical Bioimpedance and the 8th Conference on
Electrical Impedance Tomography, 2007.
[34] L. Beckmann, S. Hahne, G. Medrano, S. Kim, M. Walter and S. Leonhardt,
"Monitoring change of body fluids during physical exercise using Bioimpedance
Spectroscopy," in Engineering in Medicine and Biology Society EMBC Annual
International Conference of the IEEE, 2009.
[35] P. S. Hamilton and M. G. Curley, "Adaptive removal of motion artifact [ECG
recordings]," in 19th Annual International Conference IEEE/EMBS, 1997.
[36] B. ko, T. Lee, C. Choi, Y. Kim, G. Park, K. Kang, S. K. Bae and K. Shin, "Motion
artifact reduction in electrocardiogram using adaptive filtering based on half cell
potential monitoring," in Engineering in Medicine and Biology Society (EMBC),
Annual International Conference of the IEEE, 2012.
[37] P. Augustyniak, "Separating cardiac and muscular ECG components using adaptive
modelling in time-frequency domain," in WACBE World Congress on Bioengineering,
2007.
[38] J. J. Almasi and O. H. Schmitt, "system and random variations of ECG electrode

82
system impedance," Annals of the New York Academy of Sciences, vol. 170, no. 2, pp.
509-519, 1970.
[39] A. S. Berson and H. V. Pipberger, "Skin-electrode impedance problems in
electrocardiography," American heart journal, vol. 76, no. 4, pp. 514-525, 1968.
[40] K. Tomczyk, "Procedure for correction of the ECG signal error introduced by skin-
electrode interface," Metrology and Measurement Systems, vol. 18, no. 3, pp. 461-470,
2011.
[41] R. Stevenson, M. Bolic, B. Taji and S. Ahmad, "Application note:Ecg assisted blood
pressure monitoring based on the CMC microsystems compact wireless platform.
CMC Microsystems," 2012. [Online]. Available:
https://www.cmc.ca/WhatWeOffer/Products/CMC00200-02441.aspx.
[42] "Texas Instruments," [Online]. Available:
http://www.ti.com/lit/ds/symlink/cc2531.pdf.
[43] A. Kadrolkar, R. Gao, R. Yan and W. Gong, "Variable-Word-Length Coding for
Energy-Aware Signal Transmission," IEEE Transactions on Instrumentation and
Measurement, vol. 61, no. 4, pp. 850-864, 2012.
[44] S. Grimnes, "Impedance measurement of individual skin surface electrodes," Medical
and Biological Engineering and Computing, vol. 21, no. 6, pp. 750-755, 1983.
[45] R. Shepoval’nikov, A. Nemirko, A. Kalinichenko and V. Abramchenko,
"Investigation of time, amplitude, and frequency parameters of a direct fetal ECG
signal during labor and delivery," Pattern Recognition and Image Analysis, vol. 16,
no. 1, pp. 74-76, 2006.

83
[46] E. Khan, "Clinical skills: the physiological basis and interpretation of the ECG,"
British journal of nursing, vol. 13, no. 8, pp. 440-446, 2004.
[47] I. Rokos, W. French, A. Mattu, G. Nichol, M. Farkouh, J. Reiffel and G. Stone,
"Appropriate cardiac cath lab activation: optimizing electrocardiogram interpretation
and clinical decision-making for acute ST-elevation myocardial infarction," American
Heart Journal, vol. 160, no. 6, pp. 995-1003, 2010.
[48] P. Annila, V. Jantti, L. Lindgren and A. Yli Hankala, "Changes in the T-wave
amplitude of ECG during isoflurane anaesthesia," Acta anaesthesiologica
scandinavica, vol. 37, no. 6, pp. 611-615, 1993.
[49] "http://www.anesthesiawiki.net," 2010. [Online]. Available:
http://www.anesthesiawiki.net/metrohealthanesthesia/MHAnes/edu/inhalational/isoflu
rane1.htm.
[50] "http://www.fpnotebook.com," 2013. [Online]. Available:
http://www.fpnotebook.com/cv/exam/QtIntrvl.htm.
[51] A. Albulbul and A. Chan, "Electrode-skin impedance changes due to an externally
applied force," in Medical Measurements and Applications Proceedings (MeMeA),
2012.
[52] D. Halliday and R. Resnick, Fundamentals of Physics, 2 ed., New York: John Wiley &
Sons, 1970, p. 452–453.
[53] K. S. Cole, "Permeability and impermeability of cell membranes for ions," Cold
Spring Harbor Symposia on Quantitative Biology, vol. 8, pp. 110-122, 1940.
[54] S. Karen R., S. Burastero, A. Chun, P. Coronel, R. N. Pierson and J. Wang,

84
"Estimation of extracellular and total body water by multiple-frequency bioelectrical-
impedance measurement," The American journal of clinical nutrition, vol. 54, no. 1,
pp. 26-29, 1991.
[55] G. Ursula, I. Bosaeus, A. D. De Lorenzo, P. Deurenberg, M. Elia, J. M. Gómez, B.
Lilienthal Heitmann and e. al, "Bioelectrical impedance analysis—part I: review of
principles and methods.," Clinical Nutrition, vol. 23, no. 5, pp. 1226-1243, 2004.
[56] A. De Lorenzo, A. Andreoli, J. Matthie and P. Withers., "Predicting body cell mass
with bioimpedance by using theoretical methods: a technological review," Journal of
Applied Physiology, vol. 82, no. 5, pp. 1542-1558, 1997.