Earthquake Hazards Landslides, Liquefaction, Dam Failure, Ground Rupture and Structural Collapse.


Reconnaissance studies of landslides and other ground damage caused by the MW7.2 Fiordland earthquake
of 22 August 2003
G.T. Hancox S.C. Cox
I.M. Turnbull M.J. Crozier
Institute of Geological & Nuclear Sciences science report 2003/30
Institute of Geological & Nuclear Sciences Limited Lower Hutt, New Zealand
November 2003

BIBLIOGRAPHIC REFERENCE
Hancox, G.T., Cox, S.C., Turnbull, I.M., and Crozier, M.J., 2003. Reconnaissance studies of landslides and other ground damage caused by the MW7.2 Fiordland earthquake of 22 August 2003. Institute of Geological & Nuclear Sciences science report 2003/30. 32 p. G.T. Hancox, Institute of Geological & Nuclear Sciences Limited, Lower Hutt. S.C. Cox, Institute of Geological & Nuclear Sciences Limited, Dunedin. I.M. Turnbull, Institute of Geological & Nuclear Sciences Limited, Dunedin. M.J. Crozier, School of Earth Sciences, Victoria University of Wellington. © Institute of Geological & Nuclear Sciences Limited, 2003 ISSN 1171-9184 ISBN 0-478-09826-x

© Institute of Geological & i Landslides and other ground damage caused by the Nuclear Sciences Limited, 2003 MW 7.2 Fiordland earthquake of 22 August 2003
CONTENTS
ABSTRACT ......................................................................................................................... 1
KEYWORDS ....................................................................................................................... 1
1. INTRODUCTION .................................................................................................... 2 1.1 Background................................................................................................................ 2 1.2 Field response ............................................................................................................ 2 1.3 Scope of report........................................................................................................... 4 1.4 Diary of response activities ........................................................................................ 4 1.5 Studies following field response................................................................................. 5
2. REGIONAL SETTING............................................................................................ 6 2.1 Topography, climate and geology............................................................................... 6 2.2 Seismotectonics.......................................................................................................... 7 2.3 Previous earthquake-induced landsliding.................................................................... 7
3. EARTHQUAKE DATA ........................................................................................... 8 3.1 Main earthquake and aftershocks................................................................................ 8 3.2 Strong motion records ................................................................................................ 8
4. FIELD OBSERVATIONS ....................................................................................... 9 4.1 Landslides.................................................................................................................. 9 4.1.1 General observations ................................................................................................ 11 4.1.2 Larger landslides ...................................................................................................... 13 4.2 Liquefaction effects.................................................................................................. 20 4.3 Damage to structures and infrastructure.................................................................... 23 4.4 Tsunami ................................................................................................................... 24 4.5 Other landslide effects.............................................................................................. 25
5. DISCUSSION ......................................................................................................... 26 5.1 Landslides as a natural landforming process ............................................................. 26 5.2 Landsliding in Fiordland .......................................................................................... 26 5.3 Frequency of landslide events in Fiordland............................................................... 27 5.4 Form and distribution of August 2003 landslides...................................................... 27 5.5 Significance of earthquake-induced landsliding........................................................ 29
6. CONCLUSIONS AND RECOMMENDATIONS ................................................. 30
7. ACKNOWLEDGEMENTS ................................................................................... 31
6. REFERENCES....................................................................................................... 31

© Institute of Geological & ii Landslides and other ground damage caused by the Nuclear Sciences Limited, 2003 MW 7.2 Fiordland earthquake of 22 August 2003
Figures
1. Map showing earthquake location, temporary seismographs and flight lines..................................3
2. Map showing regional geology, physiography, and very large old landslides.................................6
3. Landslide map for the 22 August 2003 Fiordland earthquake. ..................................................... 10
4. Photos of the large debris slide at Deas Cove in Thompson Sound.............................................. 14
5. Photos of the large wedge rock fall in Gold Arm of Charles Sound............................................. 15
6. Photo of multi-lobe debris slide and flow in Charles Sound. ....................................................... 16
7. Photo of multiple rock and debris slides in Nancy Sound. ........................................................... 16
8. Photo of multiple debris slides in mouth of Nancy Sound. .......................................................... 17
9. Photo of debris slides and falls on the west coast of Secretary Island. ......................................... 17
10. Photo of multiple debris slides on the southwest coast of Secretary Island.................................. 18
11. Photo of large soil and debris slide at the head of Hall Arm, Doubtful Sound............................. 18
12. Photo of large rock fall slide above Wilmot Pass Road................................................................ 19
13. Rose diagram showing landslide slope directions......................................................................... 19
14. Photo showing rotational slump and lateral spread on shore of Lake Te Anau............................ 21
15. Photo of lateral spreading and sand boils downstream of Lake Te Anau Control Structure ........ 21
16. Photos of typical sand boils and lateral spread area...................................................................... 22
17. Aerial view of Te Anau Control Structure.................................................................................... 22
18. Photo of lateral spreading and slumping on Hillside Road east of Manapouri............................. 23
19. Minor concrete cracking of Control Structure .............................................................................. 24
20. Photo of soil slump undermining the Kepler Track...................................................................... 25
21. Photo of slump area downstream from Rainbow Reach Bridge ................................................... 25
22. Magnitude/area plot of landslides triggered by the 22 August earthquake................................... 29
Note: Photos included in this report (Figures 4–12 and 14–21) are by G T Hancox.

© Institute of Geological & iii Landslides and other ground damage caused by the Nuclear Sciences Limited, 2003 MW 7.2 Fiordland earthquake of 22 August 2003
Frontispiece. The Fiordland earthquake of 22 August 2003 shattered the peaceful isolation of Cascada Bay at the entrance of Doubtful Sound, leaving the distant slopes of Secretary Island broken and scarred by landslides to provide a lasting reminder one of nature’s most violent natural hazards. This report describes the widespread landsliding that the earthquake caused throughout the region. (Artwork by Jay Hancox, November 2003)

© Institute of Geological & 1 Landslides and other ground damage caused by the Nuclear Sciences Limited, 2003 MW 7.2 Fiordland earthquake of 22 August 2003
ABSTRACT The MW 7.2 Fiordland earthquake of 22 August 2003 was located ~10 km northwest of Secretary Island at the mouth of Thompson Sound (45.13ºS, 166.93ºE) at a depth of~20 km. It was the largest shallow earthquake in New Zealand for 35 years. Preliminary seismological and GPS data from the epicentral region after the event show that the earthquake did not occur on the Alpine Fault, but involved thrusting along the shallow part of the underlying subduction interface between the Australian and Pacific plates. The earthquake was strongly felt over much of Otago and Southland, and caused minor but sometimes spectacular damage throughout the region, with items thrown off shelves in Te Anau and Queenstown, and minor cracking to some concrete structures (e.g., chimneys and marina in Te Anau; Lake Te Anau Control Structure; Deep Cove tailrace). By the end of September 2003, more than 2100 claims for damage had been received by EQC.
Landslide effects were numerous and widespread throughout the mountainous and unpopulated epicentral region, 50-70 km west of Te Anau. More than 400 landslides were triggered by the earthquake within the main landslide area, principally on very steep slopes within 20–30 km of the earthquake fault rupture zone. Landslides range from small debris flows involving a few trees and a few tens of cubic metres of soil, to large debris slides and rock falls running 1000 m downhill and involving bedrock and regolith. Most failures were initiated on slopes of 35–60º or greater, with average runout slope angles of 35–50º. The fifteen largest landslides have estimated volumes of ~50,000 to ~700,000 m3. One of these landslides caused a small (~1–2 m high) tsunami in Gold Arm of Charles Sound, locally damaging shoreline vegetation and a helipad and wharf. Further from the epicentre landslides and rock falls caused only minor damage to the few roads in the area. The Wilmot Pass road was blocked by a cutting collapse failure, and there were small rock and debris falls in several places on SH 94 to Milford Sound, but these were quickly cleared. Minor liquefaction effects (sand boils and small-scale lateral spreading) and slumping of unconsolidated lake sediments and alluvium were observed in several places around the shores of Lake Te Anau. Lateral spreading also caused minor collapses of road edges on Hillside Road east of Manapouri where it crosses a swampy area. Other important infrastructure components in the region (e.g., Manapouri powerhouse and electricity transmission lines, communications) were largely unaffected by the earthquake.
Overall the landsliding and liquefaction effects are far more significant than those that occurred during the August 1993 ML 6.7 earthquake in the same area. Based on these effects the Modified Mercalli (MM) intensities for the August 2003 earthquake are estimated to have been about MM IX in the epicentral area, MM VIII at Deep Cove, and MM VI to MM VII at Te Anau and Manapouri. The main area of landsliding (~3000 km2) fits well on the magnitude/area curve for worldwide data, but is slightly above the mean regression line for New Zealand historical earthquakes – presumably reflecting the steep terrain. Although landslide effects were widespread, the slope failures were mainly superficial. There were no deep-seated very large landslides on the scale of at least 40 very large (~107-109 m3) prehistoric (post-glacial) landslides previously identified in Fiordland. These features are thought to have been triggered by considerably larger earthquakes (~M 7.5 or greater), and quite possibly involving movement on the Alpine Fault. The earthquake occurred in a remote, unpopulated and undeveloped region of New Zealand, and so landsliding caused little damage to infrastructure, and no damage to buildings or loss of life. However, even in this remote area the situation might have been different if the earthquake had been a larger event centred on the Alpine Fault, or was located further to the east or the north.
The reconnaissance studies have revealed some interesting relationships between landslide development and slope aspect and steepness, with preferential failure on north and west facing slopes clearly indicated. Further analysis of the landslide distribution using GIS is recommended to explore the relationships of landsliding to slope aspect and slope angle in more detail. There is also merit in carrying out further studies on the very large prehistoric landslides in Fiordland, including more systematic mapping, analysis and dating of the landslides (using C14 and dendrochronology methods) to determine their paleaeoseismic significance.
KEYWORDS Earthquakes, earthquake-induced landsliding, rockfalls, debris slides, liquefaction, lateral spreading, MM intensity, Fiordland, New Zealand.

© Institute of Geological & 2 Landslides and other ground damage caused by the Nuclear Sciences Limited, 2003 MW 7.2 Fiordland earthquake of 22 August 2003
1. INTRODUCTION 1.1 Background
A large earthquake with a Moment Magnitude of MW 7.2 occurred at 12 minutes after midnight on 22 August 2003, NZ Standard Time (12h12m on 21 August 2003 UT). The earthquake was tentatively located about 10 km northwest of Secretary Island at the mouth of Thompson Sound (45.13°S, 166.93°E) in central Fiordland, about 75 km northwest of Te Anau (NZ earthquake Report, GeoNet1 2003). The earthquake was shallow, and was initially assigned a focal depth of 12 km, which was later revised to 20 km (pers. comm. Ken Gledhill 5/9/2003).
Although the earthquake was strongly felt across Otago and Southland it caused relatively minor damage. Items were thrown off shelves in Te Anau and Queenstown, and some chimneys were broken in Te Anau. By the end of September 2003 more than 2100 damage claims had been received by EQC. Significant landsliding was reported in the mountains west of Te Anau, with minor damage along SH 94 between Te Anau and Milford Sound, and the Wilmot Pass road from Lake Manapouri to Deep Cover was closed by a slip (pers. comm. Mark Falconer, Opus International Consultants). The main earthquake was followed by a large aftershock of ML 6.2 at 2.12 am on 22 August, and more than 20 aftershocks greater than magnitude 5 were recorded over the next 4-weeks.
1.2 Field response
A ‘Rapid Response’ was initiated by GeoNet on the morning of 22 August 2003, with the objective of deploying a network of 7 portable seismographs (EARSS) and 4 strong motion (ETNA) recorders to record the aftershock sequence. This equipment was assembled and transported to Te Anau late on Friday afternoon by Peter McGinty (PM), Tim O’Neill (TO), Nigel Clough (NC) Simon Cox (SC), and Ian Turnbull (IMT). The primary object of this advance response team was to deploy the EARRS and ETNA instruments, while SC and IMT would also carry out initial reconnaissance mapping of the landsliding.
When the scope of landslide damage became apparent late on Friday afternoon, a separate Landslide Response was initiated by Hugh Cowan (GeoNet Manager), who arranged for Graham Hancox (GTH) and Mike Crozier (MJC, Victoria University of Wellington) to undertake a landslide reconnaissance survey for the GeoNet Project. Graham Hancox travelled to Te Anau on Sunday 24 August and joined the initial reconnaissance team on two reconnaissance flights over landslide damaged areas on Monday 25 August. Three days of rain followed, during which GTH carried out surveys of ground damage in the Te Anau – Milford Sound area. With the prospect of clearing weather MJC joined GTH in Te Anau on Thursday 28 August. GTH and MJC undertook a 3-hour aerial reconnaissance of landsliding on Friday 29 August, obtaining more than 300 digital images of the main landslides, and establishing the northern extent of landsliding.
Figure 1 shows the location of the earthquake epicentre about 10 km northwest of Secretary Island, along with locations of temporary EARRS and ETNA recorders deployed in the post-earthquake response, and helicopter flightlines used for reconnaissance mapping of landslides.
__________________________________________________________________________________________________________________ 1 GeoNet Project is a collaboration between the Earthquake Commission, the Institute of Geological & Nuclear Sciences, and the Foundation for Research, Science & Technology for the monitoring, data collection and rapid response to earthquake, volcano, landslide and tsunami hazards in New Zealand. It is managed by the Hazards Monitoring Section of GNS.

© Institute of Geological & 3 Landslides and other ground damage caused by the Nuclear Sciences Limited, 2003 MW 7.2 Fiordland earthquake of 22 August 2003
Figure 1. Map showing the location of the 22 August 2003 earthquake (21 August 2003 Universal Time), positions of temporary seismographs (EARSS) and strong motion (ETNA) recorders, and approximate flightlines used for instrument deployment and landslide reconnaissance mapping.

© Institute of Geological & 4 Landslides and other ground damage caused by the Nuclear Sciences Limited, 2003 MW 7.2 Fiordland earthquake of 22 August 2003
1.3 Scope of report This report provides a summary of the field response to the August 2003 earthquake, and describes the results of reconnaissance studies of landslides, liquefaction effects and other ground damage. The field data collected are summarised, illustrated and briefly analysed to determine the significance of the landsliding, and relationships to seismicity data, MM intensities, and earthquake-induced landsliding (EIL) in New Zealand and overseas. The significance of the landslides caused by the earthquake is also discussed in relation to landsliding as a slope-forming process, and the nature and frequency of major landslide events in Fiordland. Recommendations are made for further studies to follow up some of these issues.
1.4 Diary of response activities 23 August 2003 am: One EARSS instrument was set up temporarily at a Te Anau motel on Saturday 23 August. Minor hardware and software problems were experienced while testing gear at the South West Helicopters hangar, so SC and IMT, with a TVNZ crew (TV1 reporter Sarah Azam) made a helicopter reconnaissance of the Doubtful Sound area. The initial route flown by SC and IMT was partly suggested by Doc Sutherland (DS) the helicopter pilot, who had seen landslide damage in the George Sound – Lake Te Anau area on Friday morning while shifting hunters from George Sound to Lake Marchant. Flew (over fog, initially, and then into clear sky) from Te Anau – South Arm – Robin Saddle – Camelot River – Secretary Island – Deas Cove – upper Namu River – Nancy Sound - Charles Sound (checking on damage to helipad) – upper Irene River, and back to Te Anau. Landslides and ground damage effects were photographed and their locations plotted on to 1:250,000 topographic map.
23 August pm: SC and IMT checked damage to Hillside Road east of Manapouri. TO, SC, IMT flew to Deep Cove via Wilmot Pass to replace an EARSS. TO, PM left at Deep Cover; SC, IMT and NC flew to Crooked Arm – Dagg Sound – upper Coal River - First Arm - Blanket Bay - Campbells Kingdom (NE side Doubtful Sound) – Deep Cove. Collected PM and TO and flew to SW Point on Secretary Island; dropped PM and TO to install ETNA. SC and IMT flew along the coast to Caswell Sound – upper Juno River – Nancy Sound – Secretary Island; collected PM, TO, returned Te Anau via Bradshaw Sound – Freeman Burn – Kepler Track area.
24 August: Low cloud and fog delayed flying in the morning. SC and IMT went to Te Anau Control Structure to check on damage. Once holes appeared in fog, PM, TO, and IMT flew from Te Anau to the outer coast south of Febrero Point in Doubtful Sound and installed an EARSS instrument. The party then installed EARRS instruments on Colonial Point at the north end of Secretary Island; on granite crags southeast from Deas Cove; at Crayfish Heights on the SE corner of Secretary Island beside Secretary Lake; and at Heel Cove in Nancy Sound. They then returned to Te Anau via Precipice Cove, Fowler Pass, and South Arm. The initial reconnaissance party met up with GTH in Te Anau that evening.
25 August: Fog and low cloud delayed flying until mid morning. Visited Ross Kerr, Ken Bradley, Tony Preston at Department of Conservation (DOC) Field Centre in Te Anau. Left 10 am with SC, IMT, GTH, TO, PM and flew from Te Anau to South Arm–Junction Burn–George Sound (checked DOC hut for damage), and then to entrance of Charles Sound via Whitewater River and Two Thumb Bay. Dropped PM and TO off to install EARSS recorder at Hawes Head.

© Institute of Geological & 5 Landslides and other ground damage caused by the Nuclear Sciences Limited, 2003 MW 7.2 Fiordland earthquake of 22 August 2003
GTH, SC, and IMT then flew to the lower Irene River and inspected minor liquefaction effects. They then flew down the lower Irene – Windward River – Gold Arm – Charles Sound. Collected PM and TO and moved to South West Point site on Secretary Island and dropped PM and TO off to download data. SC, IMT, and GTH returned to Te Anau to refuel. SC and GTH then flew from Te Anau – Crooked Arm – Secretary Island and collected PM and TO. They then flew to Cascada Bay on the southern side of the entrance to Doubtful Sound and installed an ETNA instrument. The party returned to Te Anau late afternoon in the face of deteriorating weather, with light rain and strong northwest winds over the mountains and on the outer coast.
In the afternoon IMT hitched a lift with Dave Croutchley (DOC) by boat to Glade House, Worsley Hut, and Middle Fiord of Lake Te Anau to look for soft sediment deformation features around the lake shore. He then went back to Te Anau Downs and returned to Dunedin by car with SC and PM. The rest of the party (TO, NC, and GTH) remained at Te Anau to continue work. Later that evening GTH inspected structural damage and liquefaction effects at the Te Anau Control Structure in poor light and advancing rain.
26 – 28 August: Rain and low cloud prevented helicopter flying so GTH carried out a survey of landslides, liquefaction effects and other ground damage in the Te Anau area, including the Te Anau Control Structure, parts of the Kepler Track, Te Anau – Manapouri –Monowai road, and SH 94 between Te Anau and Milford Sound. He met up with Mike Crozier in the late afternoon on 28 August and briefed him on work progress and planned activities for the next day.
29 August: Low cloud prevented flying until late morning. GTH and MJC departed 11 am with DS on a 3-hour reconnaissance flight in near perfect weather. They flew along a route that covered the main ground damage and landslide areas previously identified, taking more than 300 digital photographs and mapping some new landslides, especially north of George Sound. The main areas covered included: Te Anau Control – Waiau River – Lake Manapouri – Percy Saddle – Wilmot Pass to Deep Cove – Hall Arm, Crooked Arm, and First Arm of Doubtful Sound – Secretary Island – Thompson Sound – Nancy and Charles Sound – George Sound, Bligh Sound and Sutherland Sound – Lake Quill – upper Clinton and Worsley valleys, and back to Te Anau via the eastern Franklin, Stuart, and Murchison mountains (flight line shown in Figure 1). Following this flight and a discussion about observations and further work that would be undertaken, in the early afternoon MJC returned to Dunedin and GTH travelled up the West Coast for unrelated field work in the Poerua valley. 1.5 Studies following field response After returning from the field, Simon Cox and Ian Turnbull prepared an Immediate Report documenting details of the response and presenting initial observations on landsliding, damage to structures, tsunami effects, and soft sediment deformation (Cox and Turnbull, 2003). Much of that information is incorporated in this report. Graham Hancox plotted up and analysed the landslide and ground damage field data, using ~250 high resolution (5 megapixel) digital photos to identify, map and characterise the larger landslides and landslide areas, assisted in this process by Grant Dellow, Ian Turnbull, and Simon Cox. Mike Crozier also contributed his field observations and digital photos of landslides for the preparation of this report.

© Institute of Geological & 6 Landslides and other ground damage caused by the Nuclear Sciences Limited, 2003 MW 7.2 Fiordland earthquake of 22 August 2003
2. REGIONAL SETTING 2.1 Topography, climate and geology
The epicentre of the earthquake has tentatively been located in central Fiordland, just off the coast of Secretary Island at the mouth of Thompson Sound, ~75 km northwest of Te Anau. The Fiordland area is mountainous with relief of ~1000-1900 m, and is typically very steep (many areas with average slopes of 35°– 65° or greater), having been extensively glaciated. There are many deep U-shaped valleys, large glacial lakes (including Te Anau and Manapouri), and a complex network of deep ice-carved fiords (‘sounds’) along the deeply indented western coast (Figure 1). The climate in the area is generally mild, with very high rainfall, ranging from ~1200 mm per year at Te Anau to ~6500 mm or greater per year at Milford Sound and across the mountains in the epicentral area. The area is sparsely populated, with larger permanent settlements and buildings only at Te Anau, Manapouri, and Milford Sound, more than 70 km east of the earthquake epicentre.
Most of Fiordland, especially the mountains west of Lakes Te Anau and Manapouri, is made up of coarse crystalline rocks such as gneiss, schist, diorite, granite and marble of Palaeozoic to Mesozoic age (Wood, 1960). Most of these rocks are very strong and support the very steep slopes and glacial landforms that characterise the region. Regardless of the strong bedrock, the region also contains the remains of at least 40 very large prehistoric landslides of post-glacial age (~13,000 years or less) with volumes ranging from ~5 to 27,000 million m3, many of which are associated with landslide dammed lakes (Hancox and Perrin, 1994a; 1994b). At least 13 of these landslides have volumes of ~100 x 106 m3 or greater, with the largest being Green Lake Landslide (~27,000 x 106 m3) about 50 km southwest of Te Anau (Figure 2). Most of these old landslides have been probably triggered by large earthquakes of ~M 7.5 or greater.
Figure 2. Map showing the regional geology and physiographic features of southern Fiordland, and the location of Green Lake Landslide and some other very large prehistoric landslides in the area.

© Institute of Geological & 7 Landslides and other ground damage caused by the Nuclear Sciences Limited, 2003 MW 7.2 Fiordland earthquake of 22 August 2003
2.2 Seismotectonics
Fiordland is one of the more seismically active regions of New Zealand, having had three earthquakes of greater than magnitude 7 (1939, 1960, 1993) and seven greater than magnitude 6 in the last 150 years. The largest recent earthquakes have been MW 6.7 (ML 6.1) in June 1988, MW 6.4 in May 1989, and MW 7.0 in August 1993 (Van Dissen et al., 1994; Reyners et al., 1991, 2002; Reyners and Webb, 2002). Average return periods for strong earthquake shaking at Te Anau are about 9 years for Modified Mercalli (MM) intensity MM VI; 41 years for MM VII; 310 years for MM VIII; and 5200 years for MM IX, although these return periods are generally much shorter on the west coast of Fiordland, in the area of the recent earthquake (pers. comm. Warwick Smith, 2003).
The major tectonic features in the region include the active Alpine Fault located 10 – 20 km off the Fiordland Coast, where it is presumed to follow the eastern margin of the Puysegur Trench (Figure 2), and the Hauroko and Te Anau boundary faults along the western side of the Te Anau – Waiau basin, which show Cenozoic movements (Turnbull and Uruski, 1995). In addition, a steeply dipping zone of intermediate to shallow depth earthquake activity (which underlies the Fiordland coastal area) is thought to represent the seismicity associated with the east-dipping subduction zone of the Australian plate moving beneath the Pacific plate. Initial indications are that the earthquake of 22 August 2003 and many of the aftershocks were associated with movement on this plate boundary fault, not the Alpine Fault (Reyners et al., 2003). These aspects will be discussed in more detail in other reports.
2.3 Previous earthquake-induced landsliding
Previous larger earthquakes in Fiordland over the last 15 years have caused minor to moderate landsliding and ground damage. For example, the ML 6.1 earthquake 3 June 1988 caused minor landslides and rock falls throughout the Fiordland mountains, one of which blocked SH 94 between Te Anau and Milford, and caused a 1 m high landslide-induced wave or tsunami in North Fiord of Lake Te Anau, and collapses of some lake deltas (Downes, 1995; Turnbull and Beanland, 1988; Thompson, 1988).
In addition, the ML 6.7 earthquake of 10 August 1993 caused minor landsliding in the mountains between Doubtful Sound and Lake Manapouri. These were mainly narrow minor shallow-seated slides, or small reactivated portions of older slides, but overall the landslide damage was less than that caused by a heavy rain storm event (Van Dissen et al., 1994). In general the landsliding caused by these earthquakes was minor but widespread, probably because of the steep terrain (Hancox, et al., 1997).
Initial reports immediately following the 22 August 2003 earthquake suggested that landsliding associated with the recent earthquake was much more extensive and damaging than had been observed in the area during earlier historical earthquakes and it therefore warranted a separate Landslide Response by GeoNet.
© Institute of Geological & 8 Landslides and other ground damage caused by the Nuclear Sciences Limited, 2003 MW 7.2 Fiordland earthquake of 22 August 2003
3. EARTHQUAKE DATA 3.1 Main earthquake and aftershocks
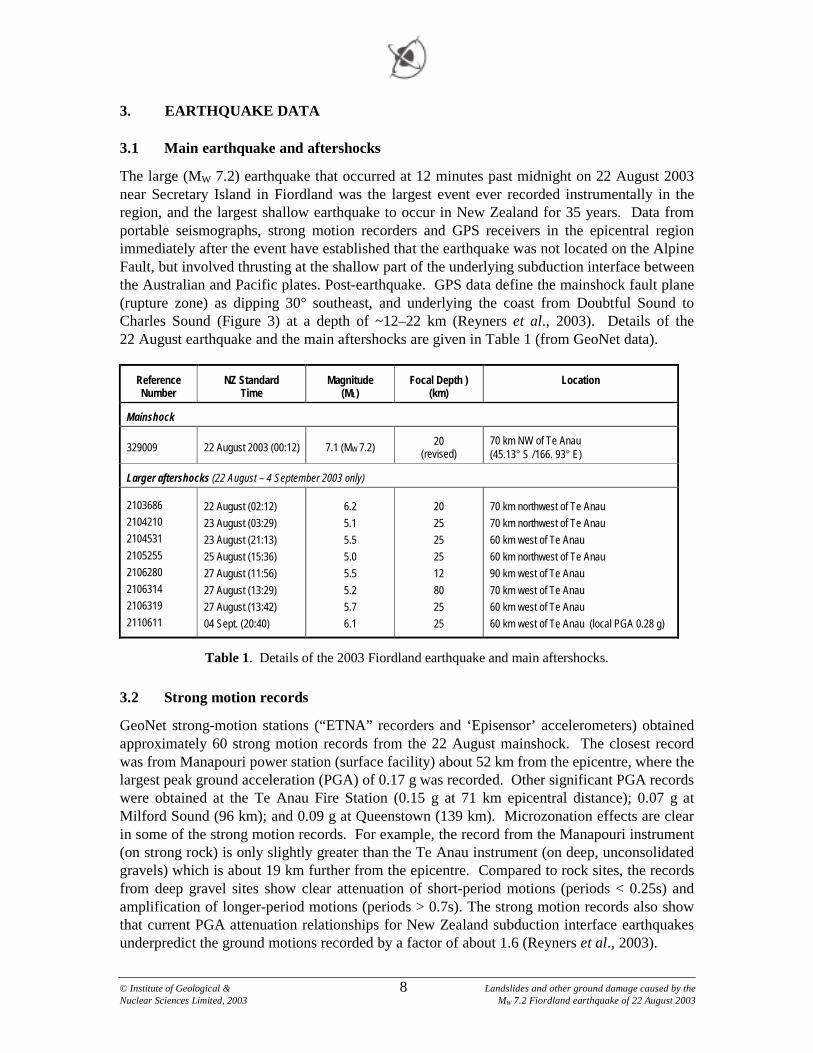
The large (MW 7.2) earthquake that occurred at 12 minutes past midnight on 22 August 2003 near Secretary Island in Fiordland was the largest event ever recorded instrumentally in the region, and the largest shallow earthquake to occur in New Zealand for 35 years. Data from portable seismographs, strong motion recorders and GPS receivers in the epicentral region immediately after the event have established that the earthquake was not located on the Alpine Fault, but involved thrusting at the shallow part of the underlying subduction interface between the Australian and Pacific plates. Post-earthquake. GPS data define the mainshock fault plane (rupture zone) as dipping 30° southeast, and underlying the coast from Doubtful Sound to Charles Sound (Figure 3) at a depth of ~12–22 km (Reyners et al., 2003). Details of the 22 August earthquake and the main aftershocks are given in Table 1 (from GeoNet data).
Reference Number
NZ Standard Time
Magnitude (ML)
Focal Depth ) (km)
Location
Mainshock
329009 22 August 2003 (00:12) 7.1 (MW 7.2) 20 (revised)
70 km NW of Te Anau (45.13° S / 166. 93° E)
Larger aftershocks (22 August – 4 September 2003 only)
2103686 2104210 2104531 2105255 2106280 2106314 2106319 2110611
22 August (02:12) 23 August (03:29) 23 August (21:13) 25 August (15:36) 27 August (11:56) 27 August (13:29) 27 August (13:42) 04 Sept. (20:40)
6.2 5.1 5.5 5.0 5.5 5.2 5.7 6.1
20 25 25 25 12 80 25 25
70 km northwest of Te Anau 70 km northwest of Te Anau 60 km west of Te Anau 60 km northwest of Te Anau 90 km west of Te Anau 70 km west of Te Anau 60 km west of Te Anau 60 km west of Te Anau (local PGA 0.28 g)
Table 1. Details of the 2003 Fiordland earthquake and main aftershocks. 3.2 Strong motion records
GeoNet strong-motion stations (“ETNA” recorders and ‘Episensor’ accelerometers) obtained approximately 60 strong motion records from the 22 August mainshock. The closest record was from Manapouri power station (surface facility) about 52 km from the epicentre, where the largest peak ground acceleration (PGA) of 0.17 g was recorded. Other significant PGA records were obtained at the Te Anau Fire Station (0.15 g at 71 km epicentral distance); 0.07 g at Milford Sound (96 km); and 0.09 g at Queenstown (139 km). Microzonation effects are clear in some of the strong motion records. For example, the record from the Manapouri instrument (on strong rock) is only slightly greater than the Te Anau instrument (on deep, unconsolidated gravels) which is about 19 km further from the epicentre. Compared to rock sites, the records from deep gravel sites show clear attenuation of short-period motions (periods < 0.25s) and amplification of longer-period motions (periods > 0.7s). The strong motion records also show that current PGA attenuation relationships for New Zealand subduction interface earthquakes underpredict the ground motions recorded by a factor of about 1.6 (Reyners et al., 2003).

© Institute of Geological & 9 Landslides and other ground damage caused by the Nuclear Sciences Limited, 2003 MW 7.2 Fiordland earthquake of 22 August 2003
4. FIELD OBSERVATIONS
The effects of the earthquake reported in local news media on Friday 22 August included many items in shops and other buildings thrown off shelves in Te Anau and Queenstown, and even further away in Southland. A lot of landsliding was also reported throughout central Fiordland, along with some soft sediment (liquefaction) effects, and cracking damage and minor deformation to some of concrete structures (e.g. Lake Te Anau Control Structure). The authors’ field observations of these effects and damage are described below. These are supported by several hundred digital photos and a large number of colour 35 mm slides taken during the response. Photos by IMT and SC have been catalogued in the GNS Dunedin slide collection and can be retrieved via the GNS ‘Techfile’ system. Photos by GTH and MJC are available through GNS in Lower Hutt. 4.1 Landslides
From the reconnaissance flights and observations on the ground and lake observations, we have recorded more than 400 individual landslides, including some quite large failures. The positions of most of these slides are shown here only approximately on a small-scale map (Figure 3), but are currently being plotted more accurately from oblique aerial photos on to 1:50,000 topographic maps for the GNS Landslide Catalogue. Many of the plotted landslide locations will be slightly in error (from a few metres to ~500 m) and the lengths of individual features cannot be shown accurately on a map as the terrain is often sub-vertical. The most distant rock falls and slides (mostly small) were seen in Worsley Arm of Lake Te Anau (~75 km northeast of the epicentre) and further to the northeast on SH 94 between Te Anau and Milford Sound, at an epicentral distance of ~85–100 km (Figure 3). To the south the most distant slope failures seen were in Vancouver Arm of Breaksea Sound (~ 55 km southeast).
Figure 1 shows that we did not fly over all catchments. For example, there are some gaps in coverage over the Murchison, Stuart and Franklin mountains, and we have yet to establish the precise southern limit of landsliding. The number of slides mapped so far is a minimum as we have only plotted what was visible from the air or on the ground where we looked. The exact number of slides, especially smaller ones not easily seen from the air, and is probably somewhat greater that what have been mapped thus far.
The landslides observed ranged from small superficial failures involving a few tens of cubic metres of soil a few trees, to large rock falls and debris slides and flows (landslide terms based on Cruden and Varnes, 1996) extending up to ~1000 m down slope, and involving shallow bedrock and regolith (completely weathered rock mass and surficial soils). In the field landslides were ranked on a rough scale from 1 to 3, as follows (see Table 2 also): 1 – Small – minor rock or debris falls or slides. Estimated volumes ~1 – 1,000 m3; 2 – Medium – these included larger features with greater area, length and / or
volume (~1000 to ~5000 m3, with some possibly up to ~10,000 m3); 3 – Large – landslides, usually involving some bedrock and regolith with lengths
of up to 500 m or greater and widths >200 m. These larger slides had estimated volumes of ~10,000 – 100,000 m3or greater, with some 15 larger landslides or landslide areas with volumes of ~50,000 – 700,000 m3

© Institute of Geological & 10 Landslides and other ground damage caused by the Nuclear Sciences Limited, 2003 MW 7.2 Fiordland earthquake of 22 August 2003
Figure 3. Map showing the location of MW 7.2 Fiordland earthquake of 22 August 2003, and the observed distribution of landslides, liquefaction effects, and other ground damage caused by the earthquake. Details of larger (~50,000–700,000 m3) landslides and landslide areas (numbered 1–15) are given in Table 3. FP is the earthquake fault plane (rupture zone) determined from GPS observations. Approximate Modified Mercalli (MM) isoseismals and felt intensity zones have been assigned using environmental criteria (landslide size and frequency, and liquefaction effects). The northern and southern limits of ground damage are approximate as the areas south of Breaksea Sound and Lake Manapouri, and north of Sutherland Sound were not inspected.

© Institute of Geological & 11 Landslides and other ground damage caused by the Nuclear Sciences Limited, 2003 MW 7.2 Fiordland earthquake of 22 August 2003
Table 2 shows the size-related terms used for reconnaissance mapping of landslides triggered by the 22 August 2003 earthquake, compared with terms used in other studies of earthquake-induced landsliding in New Zealand and overseas (Hancox et al., 1997, 2002; INQUA, 2003) and the number of slides mapped. As will be discussed later, the types, sizes, and numbers of landslides triggered are important in assessing the significance of the earthquake in relation to past and future earthquakes in New Zealand. Details of the larger landslides are given in Table 3 and their locations are shown on Figure 3 (numbered slides).
Terms used in Historical EIL1 Studies in NZ and overseas
Landslide Volume(m3)
Terms used for Fiordland earthquake2 Landslide Mapping
Number2
Mapped
VERY SMALL <103 1 – SMALL (<1 – ~1,000 m3) ~354
SMALL 103 – 104 2 – MEDIUM (~1,000 – 10,000 m3) ~53
MODERATE 104 – 105
LARGE 105 – 106
3 – LARGE (>~10,000 m3) (largest observed ~7 x 10⁵ m3)
~15
(see Table 3)
VERY LARGE 1–50 x 106
EXTREMELY LARGE >50 x 106 None observed larger than 106 m3 None
mapped
1. Based on Hancox et al., 1997; 2002; and INQUA, 2003. 2. Based on this report.
TOTAL 422
Table 2. Comparison of size terminology used for earthquake-induced landslides.
4.1.1 General observations Regolith failures are by far the most common landslides triggered by the earthquake. Most of these were first-time failures, although many were on the margins of older slide areas. The larger regolith slides (some ranked as 2 and 3, but most as 1) were apparently initiated by point failures (at ridge-top level, or at the tops of very steep slopes) involving dislodgement of a single boulder or ‘crag’, which then spreads and gains mass down slope. Large regolith failures are common along the shores of Doubtful Sound, where debris has completely disappeared under water (e.g., Table 3, slide 8). Other large regolith failures, and some involving bedrock, have quite fluid debris run-out zones with flow patterns still preserved. Some debris runout zones bifurcate and climb over ridges bounding gullies (e.g., in Charles Sound, Table 3, slide 3). Similar regolith landslides were described by Van Dissen et al., (1994) following the 1993 Fiordland earthquake.
Where slides involve bedrock, the most common failure mechanisms noted were translational or wedge block failures in strong jointed granitic and gneissic rocks. Metasediments seem to be somewhat less affected, except where slopes are extremely steep. Some bedrock slides were still active three days after the earthquake. Both bedrock and regolith slides are common on the outer coast of Secretary Island, and around Nancy and Charles Sounds (slides 5 and 6, Table 3). In these areas the rocks are shattered (probably by faulting) and more weathered, and there is more loose debris on the slopes which are being actively undercut by wave action. These slopes are not of glacial origin, and are generally less steep than slopes in the fiords (30°-40° compared to 45°-65°, Table3).

© Institute of Geological & 12 Landslides and other ground damage caused by the Nuclear Sciences Limited, 2003 MW 7.2 Fiordland earthquake of 22 August 2003
Slide No. / Location
Landslide 1 Type
Approx. Area 2 Total/Source (SA)
(km2)
Approx.3 Volume
(m3)
Slope 4 Angle
(o)
Slope 5 Aspect /
V/Fall (m)
Rock 6Type Comments
1. Deas Cove, Thompson Sound
Rock slide / debris flow
0.275 0.125 (SA) (Depth SA ~5m)
625,000 35-40 (SA)15-20 (DR)
WNW ~500
Granite Large debris slide in weathered granite and regolith. Debris within ~50 m of DOC Hut. 1980 photos show old slide in same location.
2. Gold Arm, Charles Sound
Rock slide (wedge failure)
0.05 (Depth ~3-4m)
150,000 -200,000
40 (SA) 30 (DR)
N ~350
Gneiss Large rock wedge failure in gneiss bedrock. Map shows debris cone from previous failures at this location. Caused small tsunami (wave) in sound which affected an area of ~0.45 km2.
3. Charles Sound
Debris slide/ flow
0.23 (Depth ~2-3m)
500,000 - 700,000
45 (SA) 30 (DR)
NE-N ~800
Gneiss Large shallow multiple-lobe debris slide in weathered gneiss and regolith.
4. Nancy Sound Rock/debris slide
0.125 (Depth ~4-5 m)
500,000- 600,000
45-50 (SA/DR)
N ~520
Gneiss 4. Large debris slide in bedrock and thin regolith extending ~500 m from near ridge crest to valley floor (~620-100 m). 4a: Multiple debris slides extend over areas of ~0.1 - 0.35 km2 on north-facing slopes of side streams draining SW side of sound.
5. West coast Secretary Is
Debris slide/ fall (DS/DF)
0.2 (Depth ~2-3m)
400,000- 500,000
30-35 (DS)60-70 (DF)
W ~220
Gneiss Large debris slide/fall areas in weathered gneiss and regolith on steep coastal slope.
6. Coast Nth of Nancy Sd.
Multiple Debris slides
Total area ~1.3 km2
(Depth ~1-2m)
>250,000 35-40 (SA/DR)
W ~500
Gneiss Large area of multiple shallow debris slides in gullies and steep coastal face; mainly in weathered bedrock and slope debris (areas 0.05-0.17 km2).
7. Headland Sth side Nancy Sd.
Multiple Debris slides
Total slide area ~0.5 km2
(Depth ~1-3m)
200,000- 400,000
45-55 (SA/DR)
N ~700
Gneiss /Schist
Area of multiple large shallow debris slides on steep coastal face; mainly in regolith (main two areas 0.2 and 0.15 km2).
8. Doubtful Sd, (Malaspina R)
Debris slide
0.1 (Depth ~1-2 m)
100,000-200,000
40-35 (SA/DR)
NE ~500
Gneiss /Schist
Large shallow debris slide in regolith, notable for long runout (~700 m) and widening down slope.
9. Head of First Arm (DS)
Two large debris rock/ fall slides
(a) 0.125 (b) 0.10 (Depth ~1-2 m)
(a) 75,000 (b) 200,000
60-40 (SA)60-50 (SA)
N-~750E-~500
Gneiss /Schist
(a) Large shallow soil and regolith debris slide. (b) Larger blocky debris/rockfall slide in pale weathered gneiss.
10. Stella Falls, Wilmot P Rd
Rock fall / debris slide
0.125 (Depth ~3-4 m)
400,000--500,000
65-45 (SA)35 (DR)
W ~650
Gneiss /Schist
Large debris and rock fall/slide in regolith and bedrock from near summit of Turpentine peak. Extends to within ~200 m of Wilmot Pass Road.
11. Crooked Arm (DS)l
Thee large debris slides
(a) 0.10 (RA) (b) 0.125 (c) 0.11
50,000 150,000 200,000
40-35 (SA)60-45 (SA)60-40 (SA)
N ~800 NW ~650 NW ~680
Gneiss Three large debris/rock slides; minor reactivation of old slide area (a). All are narrow, relatively shallow (<1 m -~2 m) very long-runout slides.
12. Stump Lake (Head of Hall Arm, DS)
Two large soil / debris slides
(a) 0.10 (b) 0.08
75,000 100,000
75-65 (SA)50-45 (SA)
SE ~850SW ~400
Gneiss /Schist
(a) Extensive but superficial (0.5-1 m) soil/debris slide in former slide area; (b) Less extensive but deeper blocky debris slide in regolith and bedrock.
13. Murchison Mountains
Rock fall/ avalanche
0.025 (SA) (Depth ~6-8 m)
150,000 -200,000
75-50 (SA) NNE ~700 m
Gneiss /Schist
Partial ridge edge collapse causing large rockfall avalanche into Jennings Burn valley.
14. South coast Secretary Is
Multiple debris slides
~0.5 (SA/DR)
~250,000 -500,000
(total area)
60-55 (SA)40-35(DR)
SW ~500 Gneiss /Schist
Very large area of multiple (8-10 main areas) but shallow (~0.5-1 m) debris slides on south-west coastal face of Secretary Island.
15. Narrow Neck (CA, DS)
1large and four smaller debris slides
(a) 0.15 (b) 0.3 (total area)
150,000 – 250,000
(a) 55-45 (SA)(b) 50-40 (SA)
NE ~650E ~550
Gneiss /Schist
(a) Large debris slide in regolith minor bedrock. (b) Aarea of multiple (~4) superficial debris slides
NOTES: 1. Landslide types based on definitions of Cruden and Varnes (1996). Regolith refers to surficial soils and weathered bedrock; Debris refers to a mixture of rock
fragments, slope deposits (colluvium and top soils), vegetation, and any water contained in this material. RA- reactivated slide; DS – Doubtful Sound 2. Area of landslide (as plotted on 1:50,000 map) refers to total area affected. Source Area (SA) and average Depth (D) estimated where possible. 3. Landslide volumes estimated very approximately based on the landslide area and estimated average thickness of mobilised slide debris. 4. Average Slope Angle in Source Area (SA) and Debris Runout (DR) zones (determined from 1:50,000 topographic map). 5. Slope Aspect (direction) and maximum Vertical Fall (VF, m) of slide debris (determined from 1:50,000 topographic map). 6. Rock types generalised from 1:250,000 Geological Map (Wood, 1960). In some cases more specific information is provided by I Turnbull (IMT).
Table 3. Details of larger landslides and landslide areas triggered by the 22 August earthquake.

© Institute of Geological & 13 Landslides and other ground damage caused by the Nuclear Sciences Limited, 2003 MW 7.2 Fiordland earthquake of 22 August 2003
Only a few small debris-dams were seen, including one in Campbell’s Kingdom (Doubtful Sound). This dam and others like it appeared to have been quickly overtopped and breached by the local creeks. Further away from the epicentre, boulders were shaken off slopes in many places throughout Fiordland, and some temporarily blocked SH 94 between Te Anau - Milford Sound (Figure 3). Boulders have also been reported falling through trees at Deep Cove and on the Milford Track, but these sites have not been accurately located. During the few days prior to the earthquake, there was a heavy snowfall which appeared to have bonded into a relatively strong snowpack. This may be the reason that few snow avalanches were triggered by the earthquake, at least in the areas that were over-flown (Figure 1). The snow was, however, invaluable for helping to distinguish the new landslides, which were free of snow. There were several instances of river bank collapses outside the epicentral area, for example on the true left side of the Waiau River ~1 km downstream from the Te Anau Control Structure; further downstream on the right bank (Kepler track near Rainbow Reach bridge); and on the right bank of the Eglinton River ~7 km northeast of Te Anau Downs (Figure 3).
4.1.2 Larger landslides The larger landslides and landslide areas are all located within 50 km of the epicentre (Figure 3 and Table 3). Most are shallow (~1–4 m deep) debris slides and flows in regolith and bedrock, with estimated volumes ranging from about 50,000 to 700,000 m3. Many of the individual slides are long and narrow features, with lengths of ~300–1200 m, and widths of ~50–400 m. Landslide source areas are generally steep to very steep (35–65° or more) (Table 3). The largest landslide is probably the large rock/debris slide and flow at Deas Cove (Slide 1, Figure 3), which extended to within ~50 m of the DOC hut (Figure 4). This bedrock and regolith failure is a reactivated and retrogressively enlarged former landslide area, as the 1980’s air photos show an old slide at the same location.
Another spectacular slide occurred in Gold Arm of Charles Sound (Slide 2, Figure 3), where a large (150,000–200,000 m3) wedge failure in gneiss bedrock collapsed into the fiord from the steep (40°) southern slope (Figure 5). The rock fall created a wave which travelled ~800 m across the fiord and damaged vegetation up to 4-5 m above high tide on the northern side, where trees were debarked and soil and vegetation stripped from the rock. Similar damage also occurred across on the western half of a small island in the fiord, 500 m northeast of the rock slide. About 250 m to the west the wave displaced a helipad on piles and an adjacent wharf, moving them several metres up the beach – but without any other apparent damage. A pre-existing rock fall cone at the rock slide site shows that this too was a reactivated old landslide. Apart from this landslide-induced wave in Gold Arm, to the authors’ knowledge no other earthquake-induced waves have been reported either on the sounds or in the lakes.
Other spectacular large landslides and landslide areas that are worthy of specific comment and illustration include: the multi-lobed debris slide and flow in Charles Sound (Figure 6); multiple rock and debris slides in the outer parts of Nancy Sound (Figures 7 and 8) and on the western and southwestern coast of Secretary Island (Figures 9 and 10); a large debris slide at the head of Hall Arm (Figure 11); and the large rock fall/debris slide at Stella Falls, which came close to the Wilmot Pass Road (Figure 12). These landslides are typical of the larger slope failures caused by the earthquake. No very large (> 106 m3) landslides or bedrock collapses were formed, and none was large enough or occurred in an area where a large landslide dam could form (many larger slides went into fiords). There was also clear evidence of preferential landsliding (both small and large slides) on north and west facing slopes (Figures 7, 8 and 13). These effects will be discussed later.

© Institute of Geological & 14 Landslides and other ground damage caused by the Nuclear Sciences Limited, 2003 MW 7.2 Fiordland earthquake of 22 August 2003
Figure 4. Aerial photos of the large (~625,000 m3) debris slide at Deas Cove in Thompson Sound(Slide 1, Table 3). The upper photo shows the location and overall extent of the slide. The vertical fall is about 500 m from the source area (sa) to the debris flow (df) at the slide toe, which extends to about 50 m from the DOC hut. The lower photo shows more clearly the debris flow at the toe and its close proximity to the DOC hut (in small clearing to the right of the slide toe).

© Institute of Geological & 15 Landslides and other ground damage caused by the Nuclear Sciences Limited, 2003 MW 7.2 Fiordland earthquake of 22 August 2003
Figure 5. Aerial photos of the large (~200,000 m3) wedge rockfall slide in Gold Arm of Charles Sound (Slide 2, Table 3). The top photo shows the slide location and overall extent of the slide. The vertical fall is about 350 m, on a 40° slope. The rock fall caused a small tsunami (wave) which travelled ~800m across the sound,where it damaged vegetation and soil up to 4–5 m above high tide level on the northern side, and strippedvegetation off part of a small island.It also damaged a helipad ~250 m west of the slide (bottom right). The lower photo shows a closer view of the foliation and joint-controlled failure area and rock fall debris cone. Weathered rock adjacent to the slide and a pre-existing debris cone at the site show this to be an old slide area that was reactivated and enlarged by the earthquake.

© Institute of Geological & 16 Landslides and other ground damage caused by the Nuclear Sciences Limited, 2003 MW 7.2 Fiordland earthquake of 22 August 2003
Figure 6. Large debris slide and flow on southern side of Charles Sound (Slide 3, Table 3), where multiple debris slides in steep gullies have merged forming a ~1600 m long debris flow runout zone which bifurcates and overtops the bounding ridge to the east (left). The vertical fall is ~800 m.
Figure 7. Large rock fall debris slide (centre left- slide 4, Table 3) and multiple shallow narrow debris slides on steep (45-50°) slopes of side streams on the south side of Nancy Sound. Note the preferential development of landsliding on north-facing slopes.

© Institute of Geological & 17 Landslides and other ground damage caused by the Nuclear Sciences Limited, 2003 MW 7.2 Fiordland earthquake of 22 August 2003
Figure 8. Multiple shallow debris slides on the steep (45-55°) slopes of the headland on the south side of Nancy Sound (Slide 7, Table 3). Preferential landsliding on north-facing slopes is also evident here.
Figure 9. Debris slides and falls on the west coast of Secretary Island (Slide 5, Table 3).

© Institute of Geological & 18 Landslides and other ground damage caused by the Nuclear Sciences Limited, 2003 MW 7.2 Fiordland earthquake of 22 August 2003
Figure 10. Multiple shallow debris slides on southwest coast of Secretary Island (Slide 14, Table 3).
Figure 11. Large soil and debris slide above Stump Lake at the head of Hall Arm, Doubtful Sound. (Slide 12, Table 3).

© Institute of Geological & 19 Landslides and other ground damage caused by the Nuclear Sciences Limited, 2003 MW 7.2 Fiordland earthquake of 22 August 2003
Figure 12. Large rockfall/debris slide at Stella Falls above the Wilmot Pass Road (Slide 10, Table 3), ~2.5 km southeast of Deep Cove.
Figure 13. Rose diagram showing the aspect of slopes (direction slope faces) on which landslides occurred. This plot, based on preliminary field mapping, shows that across the most affected area ~62% of the landslides occurred on north and west (NNE-SSW) facing slopes, with fewer slides on east–south facing slopes. In areas such as the south side of Nancy Sound the preferential sliding on northwest facing slopes is pronounced (see Figures 7 and 8).

© Institute of Geological & 20 Landslides and other ground damage caused by the Nuclear Sciences Limited, 2003 MW 7.2 Fiordland earthquake of 22 August 2003
4.2 Liquefaction effects
Liquefaction is the process by which some fine-grained soils collapse and flow due to a sudden loss of shear strength (cohesion) as a result of a temporary increase in pore water pressure caused by strong earthquake shaking. Saturated loose, fine sands and silts are likely to liquefy, while gravely or clayey soils are not susceptible to liquefaction (Dowrick, 1987). Soil liquefaction can cause loss of bearing strength, sand and water fountains (‘sand boils’), settlement, and in some cases severe ground deformation, including slumping, flow sliding and lateral spreading (extensional movements often involving fissuring with sand and water ejections) along rivers and streams, canals, lakes and coastal areas.
Perhaps the most common manifestation of liquefaction in New Zealand are ‘sand boils’, which are ejections of sand and water from a central point. These are commonly seen in alluvium adjacent to rivers, streams and lakes. Even in coarse alluvium (sandy gravels), liquefaction in fine sand layers at depth can cause an upward flow of sand and water to the ground surface. Although sand boils can be spectacular, especially during a large earthquake when water fountains a metre or more high can occur, they are seldom damaging. Lateral spreads and flows, however, can cause severe damage due to sudden ground collapse, fissuring and extensional displacements. In New Zealand the minimum intensity threshold for soil liquefaction is commonly MM VII for sand boils and MM VIII for lateral spreading. However, these effects can also occur at one intensity level lower in areas of highly susceptible materials or high groundwater levels (Hancox et al, 1997; 2002).
Liquefaction effects, including sand boils and small-scale lateral spreading, were observed in many places after the 22 August 2003 earthquake, particularly in areas of highly susceptible fine sandy materials at the southwest and northern ends of Lake Te Anau, and on Hillside Road east of Manapouri, about 70–80 from the epicentre (Figure 3). Only slight effects were observed closer to the earthquake source, mainly due to the absence of more susceptible materials in the fiords and narrow valleys in that area. Although liquefaction effects were quite widespread, they were generally minor compared to some other recent large earthquakes in New Zealand (for example, Napier, 1931; Inangahua 1968, and Edgecumbe 1987) where spectacular sand boils and lateral spreading effects occurred in the areas of strongest shaking (MM VIII–MM X) within 10–30 km of the epicentre (Hancox et al., 1997).
A spectacular liquefaction feature formed during the earthquake was observed on the southwest shore of Lake Te Anau, about 400 m west of the control structure. At this location a liquefaction-induced lateral spread and rotational failure uplifted an area of lake shore about 20 m long and 15 m wide (Figure 14). The area has a well defined ~400 mm wide head scarp, and there are several extensional fissures up to ~10 m long in beach gravels, from which fine sand was ejected. The back of the slumped area dropped 200–500 mm, while the slide toe at the lake edge was raised a similar amount, forming a low ridge on which sand boils formed. Although this failure did not cause any significant or long-lasting damage to the lake shore, it is interesting because of the combination of rotational and lateral spreading failure modes that are demonstrated, and the coarse alluvium in which failure occurred. This suggests that finer and more susceptible sandy materials underlie the beach gravel deposits in this area.
There was also an interesting area of sand boils, and lateral spreading cracks and shallow rotational deformation and uplift on the right abutment of the western (true right) bank of the Waiau River approximately 100 m downstream from the Lake Te Anau Control Structure, with a spectacular and unusual ‘field’ of underwater sand boils just off the beach (Figures 15–17).

© Institute of Geological & 21 Landslides and other ground damage caused by the Nuclear Sciences Limited, 2003 MW 7.2 Fiordland earthquake of 22 August 2003
Figure 14. Aerial view of a shallow rotational slump and lateral spreading, with sand boils (sb) and fissuring on the shore of Lake Te Anau, approximately 400 m west of the lake Control Structure. The affected area is about 20 m long and 15 m wide, and has a 400 mm wide head scarp (in grassed area left) and several extensional fissures (300–400 mm wide and up to ~10 m long) in beach gravels, from which fine sand and water was ejected. The back of the slumped area dropped 200–500 mm, while the slide toe at the lake edge was raised a similar amount, forming a low ridge on which sand boils formed.
Figure 15. Area of lateral spreading and shallow rotational failure, with cracks, thrusts and sand boils (sb) on the right bank of the Waiau River ~100 m downstream from the Lake Te Anau Control Structure (see Figure 17). An unusual field of underwater sand boils (left) was also formed at this site.

© Institute of Geological & 22 Landslides and other ground damage caused by the Nuclear Sciences Limited, 2003 MW 7.2 Fiordland earthquake of 22 August 2003
Figure 16. Closer views of a typical sand boil in stony gravels (top) with sand ejected from a small thrust crack (beside pen); and (bottom) sand ejected from a narrow lateral spreading crack in grassed area on the right bank of the Waiau River ~100 m down-stream from the Te Anau Control Structure (see Figures 15 and 17) Note the small back-tilted trees on the toe of the shallow rotational slide area (left and centre).
Figure 17. Aerial view of the Lake Te Anau Control Structure looking downstream. The area of lateral spreading and sand boils is on the right bank, ~100 m downstream from the structure (top right). Another area of spreading and slumping of gravels occurred on the west side of the intake channel next to the upstream concrete facing slabs (bottom right). This had no apparent effect on the structure.

© Institute of Geological & 23 Landslides and other ground damage caused by the Nuclear Sciences Limited, 2003 MW 7.2 Fiordland earthquake of 22 August 2003
Figure 18. Lateral spreading and slumping of road edges along Hillside Road where it crosses a swampy area about 2.5 km east of Manapouri.
Other liquefaction and soft sediment deformation effects observed after the earthquake included lateral spreading and slumping of road edges along Hillside Road where the road crosses a swampy area (and is raised 1–2 m on fill) ~2.5 km east of Manapouri (Figure 18). Nearer the epicentre, only minor effects were noted, with sand boils observed in saturated alluvium in Campbell’s Kingdom (valley on north side of Doubtful sound), and sand boils and small (mm wide) spreading failures in the bed of the lower Irene River (Figure 3). Further to the northeast, there were a few small cracks in snow-covered sand beside a deep pool in a creek at the mouth of Worsley River, but the gently sloping shoreline below the hut was unaffected. At Glade House wharf, near the southern end of the Milford Track (Figure 3), there was some subsidence of sandy gravel around piles, and pull-apart cracking (lateral spreading) 1–3 m back from the lake edge. The end of the delta at Sandfly Point also appeared to have collapsed, with a 500 mm high scarp beside the creek (this delta also collapsed during the 1988 earthquake; see Turnbull and Beanland, 1988). Several instances of cracking and slumping of beaches by ~250 mm were noted beside the Snag Burn in Middle Fiord (Figure 3). One bouldery delta was noted to have collapsed, with lateral spreading scarps up to 500 mm in the gravel and cracks 50–100 mm wide 5 m back from the lake shore among roots of mature trees.
4.3 Damage to structures and infrastructure
The most spectacular, but relatively minor damage occurred at the Lake Te Anau Control Structure. The embankment fill is retained by a series of concrete slabs, which moved outward by up to 50 mm, and vertically relative to each other by up to 75 mm. Some inter-slab clashing has knocked concrete chips off in several areas (Figure 19). Liquefaction induced slumping of alluvium adjacent to the structure on the west side of the intake channel had no affect on the structure. Damage to buildings and other structures in the Te Anau–Manapouri area was also minor, and included cracking and breakage of chimneys and masonry in Te Anau, and cracking and breaks in concrete at the Te Anau Marina. Small (mm-wide) cracks were also observed in abutment earth fills at the Mararoa Dam ~10 km southeast of Manapouri, and at the Dawson City flood detention dam 15 km east of Te Anau (Figure 3).

© Institute of Geological & 24 Landslides and other ground damage caused by the Nuclear Sciences Limited, 2003 MW 7.2 Fiordland earthquake of 22 August 2003
Figure 19. Minor cracking of concrete and small displacement (~30 mm) of a steel rail on the downstream side of the Control Structure. Such effects are typical of the minor damage sustained by the structure.
Slight damage also occurred at the fisherman’s wharf at Deep Cove where several new mm-wide cracks were noted in concrete and an old crack had opened by about 5 mm. At the northern end of Lake Te Anau the wooden wharf at Glade House has moved 40 mm away from its concrete abutment, but is not otherwise damaged. At the Te Anau Downs boat ramp a single mm-wide crack has cut across the concrete.
Landslides and rock falls caused only minor damage to roads in the area. The Wilmot Pass road to Deep Cove was blocked by a road cutting collapse, and there were small rock and debris falls in several places on the road to Milford Sound, but this material was quickly cleared. Road cutting failures ranged from small boulders to falls of ~10–100 m3 but most of the rocks and debris had been removed from the road when inspected by the authors. Other important infrastructure components (e.g., Manapouri powerhouse and electricity transmission lines, communications) were also largely unaffected by the earthquake. 4.4 Tsunami As already mentioned, a large rock fall in Gold Arm of Charles Sound caused a small tsunami (~1–2 m high wave) resulting in local damage to shoreline vegetation and a nearby helipad. Tide gauge data at Jacksons Bay also recorded an apparent very small (~150 mm) tsunami ‘surge’ following the event, but it was too late for the main shock and too early for any of the significant aftershocks. Submarine landsliding is a possible explanation. Along the outer coast and in the fiords, landslide debris 2–3 m above high tide had not been disturbed or washed away by wave action. The earthquake occurred at low tide, with relatively little swell. We conclude that no significant tsunami wave, with wash >3 m, occurred in the area. There was no obvious evidence of any uplift (or subsidence), but the characteristic lines of dead organisms may not become obvious for some weeks or several months. However, no tidal zone changes were noted when inspected again in late October 2003 (pers. comm. Ursula Cochran, 2003). The DOC vessel ‘Renown’ and local fishermen have been asked to keep an eye out for any changes. The helipad and wharf at Blanket Bay (south side of Secretary Island) was apparently unaffected, in spite of early reports of damage.

© Institute of Geological & 25 Landslides and other ground damage caused by the Nuclear Sciences Limited, 2003 MW 7.2 Fiordland earthquake of 22 August 2003
4.5 Other landslide effects
There may have been several surface failures in scree, or else wet snow avalanches, off the western slopes of the southern Countess Range (east of the Eglinton River, Figure 3) – seen from a distance only. Landcare staff who were in Waitutu Forest in southern Fiordland during the earthquake report that although it was an interesting event, there does not appear to have been any landsliding or other obvious damage in that region. DOC staff report that large sections of the Kepler Track have collapsed, mainly where the track is on fill rather than solid rock. Figures 20 and 21 show a typical earthquake-induced soil slump which caused closure of the track close to the Rainbow Reach Bridge, 10 km south of Te Anau (Figure 3). As much of the track above bushline has been under snow, and the track has been closed for some time because of broken bridges and a collapsed gantry section in the Iris Burn, the total damage is still unknown. The big slip in the Iris Burn which came down in 1984 (Thomson, 1994) does not appear to have been reactivated, although an active slide lower in the Iris Burn has probably moved a small amount.
Figure 20. Slump in fill and soils caused closure of this section of the Kepler Track ~100 m south of the Rainbow Reach bridge. This failure was at the top of a reactivated larger failure area on the west bank of the Waiau River (see Figure 21).
Figure 21. Aerial view of an older(but still active) area of river-bankerosion and collapse (middle left) onthe west bank of the Waiau River~100 m south of the Rainbow ReachBridge (bottom right). This area wasreactivated by the earthquake, withretrogressive slumping from theterrace edge undermining the KeplerTrack causing its temporary closureat this point (see Figure 20 above).

© Institute of Geological & 26 Landslides and other ground damage caused by the Nuclear Sciences Limited, 2003 MW 7.2 Fiordland earthquake of 22 August 2003
5. DISCUSSION 5.1 Landslides as a natural landforming process
High, steep mountainous terrain is naturally acted upon by erosional processes. Gravity is constantly working to reduce steep landforms and to produce lower and flatter hillslopes. On gentle slopes, erosion takes place by slow processes such as soil creep, slope wash and stream erosion. These processes are so slow and shallow that they cause no problems to people and they are hardly noticed. However, on steep terrain, such as occurs in Fiordland, erosional processes are more active and episodic. Steep slopes tend to be reduced in height, slope angle and mass by landslides. Landslides occur when there are susceptible preconditions and (generally) active triggering factors. Preconditions relate to such things as slope form, rock type and structure. Common landslide triggering and causal factors include rainstorms, earthquakes, coastal, fluvial, and glacial undercutting, or human activity. However, large spontaneous collapses without an apparent trigger also occur from time to time, as occurred on Mt Cook in 1991 and Mt Adams in 1999. 5.2 Landsliding in Fiordland The Fiordland slopes are very steep, commonly occurring at angles between 35–80°. In geomorphic terms, they are referred to as ‘oversteepened’ slopes. Oversteepening indicates that, in the past, some process has created steep slopes that will subsequently undergo rapid reduction by landslides. In Fiordland, oversteepening of slopes has been caused principally by two processes: (1) glacial erosion, which reached a peak during the last glacial about 20,000 years ago and ended ~13,000 years ago; (2) coastal erosion on exposed western slopes facing the Tasman Sea The latter is minor over Fiordland, but is certainly relevant to this earthquake.
Landslides in Fiordland are natural and expected. It has been long recognised that, as a soil and vegetation cover develops on very steep rock slopes it will reach a stage of accumulation where the combined weight will be too great for the slopes to sustain and a landslide will occur. These landslides are typical of Fiordland and are often referred to as ‘debris avalanches’ (Wright and Miller, 1952) or ‘forest landslides’ (Schweinfurth, 1966). They occur frequently, their volume is usually less then 10,000 m3, but generally they require a moderately heavy rainstorm to trigger them.
As already mentioned, Fiordland contains some very large landslides, in some cases involving the bedrock of whole mountainsides (Figure 2). Most of these are very old (prehistoric) and clearly do not happen very frequently (Perrin and Hancox, 1992; Hancox and Perrin, 1994; Hancox et al., 1997; Korup, 2003). These huge landslides, often involving millions, and even hundreds of millions of cubic metres of rock are best described as slump-like mountainside collapses, and are almost certainly triggered by very large earthquakes, quite possibly events centred on the Alpine Fault. In some mountain areas, such as the Southern Alps in Canterbury, large rock avalanches, rock slides and wedge failures are common. However in Fiordland, because of the generally strong, massive bedrock, often without well-developed close jointing, bedding, and other structural discontinuities, these types of landslide are not as common. Thus a triggering event such as the August 2003 earthquake can be expected to produce many surficial landslides such as debris slides and avalanches, and possibly large bedrock failures and mountainside collapses. Our studies after the earthquake have clearly shown that superficial landsliding was indeed widespread, but the shaking intensity was below the threshold required for very large bedrock failures and mountain collapses in Fiordland.

© Institute of Geological & 27 Landslides and other ground damage caused by the Nuclear Sciences Limited, 2003 MW 7.2 Fiordland earthquake of 22 August 2003
5.3 Frequency of landslide events in Fiordland
One question that is often asked is how frequently we can expect a landslide event such as that of August 2003. The answer to this cannot be given based solely on historical seismic records and earthquake magnitudes. As has been indicated earlier, there have been seven earthquake events of magnitude 6 or greater recorded over the last 150 years, which have caused only relatively minor earthquake-induced landsliding. However, landslide occurrence depends not only on earthquake magnitude, but also on earthquake shaking intensity. Intensity depends on where the earthquake is located, in terms of depth and distance, as well as the nature of the rock and soil materials subjected to strong shaking. None of the recorded historical earthquakes are known to have produced a multi-million cubic meter bedrock failure or mountain side collapses like those that are evident from the prehistoric record. So it is reasonable to suppose that the return period for these major landslides is greater than the historical record – i.e. greater than 150 years, or indeed much less frequently. Although the record of ~40 large bedrock failure in the last 13,000 years produces an average of 350 years for one event, this should not be used as an indicator of the frequency of such events. This is because climatic and vegetation conditions have changed over this period, many of the landslides may have occurred during one particular event, and there may be many more yet unrecognised large landslides in the region. However, what can be said is that there is a probability of unknown magnitude that some time in the future there will be much more serious landsliding event than the one that occurred in August 2003. The sort of landsliding seen during the August 2003 earthquake might perhaps be expected on average about once every fifty years but, in a sparsely populated area like Fiordland, there are inadequate data from which to draw any firm conclusions. There are also other factors that will determine the landsliding response to a given earthquake, particularly for shallow regolith slides (such as those which occurred in August 2003). These include the weather conditions at and prior to the time of the earthquake, and the history of past landsliding. If an earthquake coincides with a prolonged period of wet weather or intense rain, the landslide response to a given shaking intensity will be enhanced, as occurred during the 1929 Murchison earthquake (Hancox et al., 2002). Similarly, if the slopes affected have not had regolith removed in previous events there will be an accumulation of susceptible material that will be ready for removal in an earthquake. Such behaviour has been referred to as slope ripening, event resistance (Crozier and Preston, 1999) and exhaustion (Cruden and Hu, 1993).
5.4 Form and distribution of August 2003 landslides As expected, the landslides triggered by the 22 August earthquake decreased in volume and density with distance from the epicentre. Figure 3 shows that the greatest density of landsliding, and indeed many of the larger landslides, occurred within or close to the area of the mainshock fault plane determined from GPS observations (Reyners et al., 2003). Near the epicentre a few small 3rd-order alpine catchments of about 5 km2 in area had up to 20% of the slopes affected. High-density landsliding also occurred on the steep coastal slopes nearest the epicentre. Landslide density in the entire affected area was low, with the largest percentage of the affected area having only isolated, individual slides.
In the alpine and many coastal catchments with the highest density of slipping, there was a distinct locational preference for the northerly facing slopes (see Figures 7 and 8), with 62% of the landslides occurring on north and west (NNE-SSW) facing slopes (Figure 13). Slope aspect preference has been noted on a number of multiple landslide events in the past (Crozier et al., 1980). A number of explanations are offered in the literature for slope preference (all other factors but orientation being equal).

© Institute of Geological & 28 Landslides and other ground damage caused by the Nuclear Sciences Limited, 2003 MW 7.2 Fiordland earthquake of 22 August 2003
One factor involves the orientational character of the triggering agent. For example, rainfall mainly from one direction can produce higher intensity rainfall and hence landsliding on the exposed slopes. The directional transmission of earthquake waves with respect to topography may produce a similar local intensity variation of slopes of different aspect, but this does not appear to be a significant factor for the August 2003 earthquake as the preference for sliding on northerly slopes is general across the affected area.
A second possibility is that ‘sunny’ slopes (i.e. northerly aspect in the Southern Hemisphere) will undergo a greater frequency and range of thermal expansion and wetting and drying cycles, leading to a weakening of joints and more rapid regolith production than on shady slopes. Sunny slopes may also have thicker vegetation, which on steep slopes could make them more prone to failure during earthquakes because the soil mass cannot support the vegetation cover when strongly shaken. Another explanation may be that ‘event resistance’ can vary with slope aspect. For example, wetter (southerly facing) slopes can initially be more susceptible to failure in rainstorm events than their drier northerly counterparts. More frequent failure of these southerly slopes sequentially removes susceptible surficial materials and hence regolith failures become less frequent. Thus, at any one time, the spatial distribution of landslides in an event may be dictated by the history of landslide events on particular slopes.
The two factors most strongly associated with landslide location are slope angle and slope form. The majority of landslides have been initiated near the ridge crest or close to the upper-slope break of slope (see Figures 6 to 12). A significant number of landslides also occurred high on ridge and spur ends. This suggests strong topographic enhancement of shaking was an initiating factor at these locations, with the failure sites controlled by site-specific soil, rock and slope conditions. Secondly, many landslides occurred on the steepest slopes within the terrain (60–80°). As these locations tend to have the strongest rock and the thinnest soil or regolith cover, this observation suggests that regolith depth may not be a critical factor in landslide initiation on some steeper slopes, especially the south facing slopes. However, in Nancy and Charles sounds where strong preferential landsliding was noted on northwest facing slopes (Figures 6–8), the slopes are generally less steep (45–55°) and appear to have a thicker regolith cover (see Figure 6 for example).
In terms of landslide form, the most dominant characteristic is the hairpin shape of the landslide scar. This is typical of shallow regolith failures of the debris flow, debris avalanche type, and indicates that there was little influence of bedrock structural control. Many of the landslides show a typical debris flow form, with a distinctive erosional scar in the source area evacuated to bedrock, an eroded and scoured debris transport track, and a distal depositional zone. Where slides occur on planar slopes, the ‘hairpin’ form is spread widely at the distal end. In areas of higher drainage density, the transport tracks become deflected into drainage depressions. Many of the slides have convergent, multiple-head erosion scars, and some have multiple distributory transport tracks. If there is even a small, forested low-angle foot slope it is often sufficient to arrest the debris before it enters fiords or river channels. However, a significant number of slides have contributed debris directly to the drainage network, fiords or coastal waters. Evidence of high velocity movement of landslide material is provided in some cases by the presence of debris levees, super-elevation on transport track corners and (in one case) evidence of wave generation in the receiving fiord.

© Institute of Geological & 29 Landslides and other ground damage caused by the Nuclear Sciences Limited, 2003 MW 7.2 Fiordland earthquake of 22 August 2003
5.5 Significance of earthquake-induced landsliding
Although the August 2003 earthquake triggered many superficial landslides over a wide area, the energy input (magnitude and intensity of earthquake shaking) was not sufficient to produce deep-seated bedrock failures and mountainside collapses. The intensity of earthquake shaking can be estimated indirectly from environmental effects, including the type, size and number of landslides produced, and the extent of the area over which landslides occur (Keefer, 1984; Hancox et al., 1997, 2002; Crozier et al., 1995; INQUA, 2003). Landslide and ground damage criteria have been used to estimate MM intensities produced by the earthquake (Figure 3). The main area affected by landsliding extends over ~3000 km2, and the total area affected covers about 10,000 km2). Figure 22 shows that the landslide affected areas fit well on the magnitude/area curve for worldwide earthquake data, but they plot slightly above the mean regression line for historical earthquakes in New Zealand (Hancox et al., 2002) – presumably reflecting the steep terrain throughout Fiordland.
Figure 22. Plot shot relationship of the main and total areas affected by landslides during the 22 August 2003 Fiordland earthquake compared to historical earthquakes of different magnitude in New Zealand (Hancox et al., 2002) and overseas (Keefer 1984).

© Institute of Geological & 30 Landslides and other ground damage caused by the Nuclear Sciences Limited, 2003 MW 7.2 Fiordland earthquake of 22 August 2003
Overall, the landsliding and liquefaction effects are significantly greater than those which occurred during the August 1993 ML 6.7 earthquake in the same area. Based on environmental criteria (landslide and ground damage) used for assessing earthquake intensities (INQUA, 2003; Hancox et al., 1997; 2002;) the frequency and size of landslides triggered by the August 2003 earthquake suggest that the Modified Mercalli (MM) shaking intensity in the epicentral area was about MM IX, while at Deep Cove it was MM VIII, and Te Anau and Manapouri between MM VI and MM VII. This is generally consistent with intensities indicated by damage to buildings and structures in and around Te Anau, and also the PGA values recorded by strong motion instruments at Deep Cove (0.17 g) and Te Anau (0.15 g).
Although the landslide damage was widespread, the slope failures were mainly superficial. There were no deep-seated very large landslides on the scale of at least 40 very large and extremely large (~107–109 m3) prehistoric (post-glacial) landslides identified in Fiordland (Hancox and Perrin, 1994). Such very large bedrock collapses are thought to have been triggered by considerably larger earthquakes (~M 7.5 or greater) than that of 22 August 2003, and quite possibly events centred on the Alpine Fault. The recent earthquake occurred in a remote, unpopulated and undeveloped region of New Zealand, and so landsliding caused little damage to infrastructure, and no damage to buildings or loss of life. However, even in this remote area the situation might have been somewhat different if the earthquake had been a larger event centred on the Alpine Fault, or was located further to the east or the north.
6. CONCLUSIONS AND RECOMMENDATIONS
(1) The MW 7.2 earthquake in Fiordland on 22 August 2003 was the largest shallow earthquake in New Zealand for 35 years. Initial seismological and GPS data show that it did not occur on the Alpine Fault, but involved thrusting along the underlying subduction interface zone. The earthquake caused widespread superficial landsliding over more than 3000 km2, mainly across remote and unpopulated mountains 50–70 km west of Te Anau. The earthquake triggered more than 400 landslides, with volumes ranging up to about 700,000 m3, principally on very steep slopes within 20–30 km of the earthquake fault rupture zone. Minor liquefaction effects (sand boils and small-scale lateral spreading) and slumping of unconsolidated lake sediments and alluvium were also observed in many places around the shores of Lake Te Anau and elsewhere in the most affected area.
(2) Landslides and rock falls caused only minor damage to the few roads in the area, with a cutting collapse closing the Wilmot Pass road, and small rock and debris falls on SH 94 to Milford Sound. Lateral spreading caused minor collapses of road edges on Hillside Road east of Manapouri. Other infrastructure components in the region (e.g., Manapouri powerhouse and electricity transmission lines, communications) were largely unaffected. There were no deep-seated failures on the scale of some 40 very large prehistoric bedrock slides and mountainside collapses previously identified in Fiordland. These features are thought to have been triggered by considerably larger earthquakes (~M 7.5 or greater), and quite possibly involving movement on the Alpine Fault.
(3) Our initial landslide reconnaissance mapping has shown some interesting relationships between landslide development and slope aspect and steepness, with preferential failure on north and west facing slopes clearly indicated. Once the detailed plotting of landslides on to 1:50,000 maps has been completed, further analysis using GIS is recommended to explore the relationships of landsliding to slope aspect and slope angle in more detail. There is also merit in carrying out further studies on the very large prehistoric landslides in Fiordland, including more systematic mapping, analysis and dating of the landslides (using C14 and dendrochronology methods) to determine their paleaeoseismic significance.

© Institute of Geological & 31 Landslides and other ground damage caused by the Nuclear Sciences Limited, 2003 MW 7.2 Fiordland earthquake of 22 August 2003
7. ACKNOWLEDGEMENTS The authors wish to thank Peter Mc Ginty, Tim O’Neill, and Nigel Clough for help in the field, and Doc Sutherland for his cooperation and skilful piloting of the helicopter in the very challenging terrain and often changeable weather. We would also like to thank staff of the Department of Conservation, especially Dave Croutchley, for their cooperation in our reconnaissance mapping and instrument deployment, and our GNS colleagues Grant Dellow and Nick Perrin for assistance with landslide plotting, and for reviewing the report. We also wish to acknowledge Hugh Cowan (GeoNet Manager) and Phil Glassey for initiating and coordinating the GeoNet landslide response to the earthquake. This reconnaissance study was initiated through the GeoNet Project, funded by the Earthquake Commission and the Foundation for Research Science and Technology.
6. REFERENCES
Cox, S., and Turnbull, I.M.T., 2003: Immediate Report on the 22 August 2003 post-earthquake reconnaissance, Central Fiordland. GNS Immediate Report QM397/876,947, 29 August 2003. Crozier, M.J., Diemel, M.S. and Simon, J.S., 1995: Investigation of earthquake triggering for deep-seated landslides, Taranaki, New Zealand. Quaternary International 25: 65-73. Crozier, M.J. and Preston, N.J., 1999. Modelling changes in terrain resistance as a component of landform evolution in unstable hillcountry. In, S. Hergarten and H. J. Neugebauer (Eds.), Process Modelling & Landform Evolution. Lecture Notes in Earth Sciences. Springer Verlag, 78:267-284. Crozier, M.J., Eyles, R.J., McConchie, J.A. and Owen, R.C., 1980: Distribution of landslips in Wairarapa hillcountry. NZ Journal of Geology and Geophysics 23: 575-586. Cruden, D.M. and X.Q. Hu, 1993. Exhaustion and steady-state models for predicting landslide hazards in the Canadian Rocky Mountains. Geomorphology 8: 279-285. Cruden, D.M., and Varnes, D.J., 1996: Landslide Types and Processes. Chapter 3 In Landslides- Investigation and Mitigation. Eds. Turner, A.K., and Schuster, R.L. Special Report 247, Transport Research Board, National Research Council, Washington D.C. p 36 – 75.
Downes, G.L., 1995: Atlas of isoseismal maps of New Zealand earthquakes. Institute of Geological and Nuclear Sciences monograph 11, 304 p. Dowrick, D.J., 1987: Earthquake resistant design: for engineers and architects. Second Edition, John Wiley & Sons Ltd. Hancox, G.T., and Perrin, N. D., 1994a: Green Lake landslide: a very large ancient rock slide in Fiordland, New Zealand. GNS science report 93/18, 31 p. Hancox, G.T., and Perrin, N.D., 1994b: Green Lake landslide: a very large ancient rock slide in Fiordland, New Zealand. Proceedings of the VIIth I.A.E.G. International Congress, Lisbon, Portugal, 5-9 Sept 1994, p 1677 – 1689. Hancox, G.T., Perrin, N.D., Dellow, G.D., 1997: Earthquake-induced landsliding in New Zealand and implications for MM intensity and seismic hazard assessment. GNS Client Report 43601B.
Hancox, G.T., Perrin, N.D., and Dellow, G.D., 2002: Recent studies of historical earthquake-induced landsliding, ground damage, and MM intensity in New Zealand. Bulletin of the New Zealand Society for Earthquake Engineering, 35(2) 59-95.

© Institute of Geological & 32 Landslides and other ground damage caused by the Nuclear Sciences Limited, 2003 MW 7.2 Fiordland earthquake of 22 August 2003
INQUA, 2003: An innovative approach for assessing earthquake intensities: The proposed INQUA Scale based on seismically-induced effects in the environment. Report of Working Group under the INQUA Subcommission on Palaeoseismicity. 16th INQUA Congress, Reno, USA, July 2003. Keefer, D.K., 1984: Landslides caused by earthquakes. Geological Society of America Bulletin 95(4): 406-421. Korup, O., 2003: Landslide-induced River Disruption - Geomorphic Imprints, and Scaling Effects in Alpine Catchments of South Westland and Fiordland, New Zealand. Unpublished PhD thesis in Physical Geography, Victoria University of Wellington: 310 pp.
Perrin, N.D., and Hancox, G.T., 1992: Landslide-dammed lakes in New Zealand- preliminary studies on their distribution, causes, and effects. In D. Bell (Ed.), Landslides, Proc. 6th International Symposium, Christchurch, 1992. Balkema, Rotterdam: 1457-1466. Reyners, M., Gledhill, K. and Waters, D., 1991: Tearing of the subducted Australian plate during the Te Anau, New Zealand, earthquake of 1988 June 03. Geophysical Journal International 104: 105-115. Reyners, M., Robinson, R., Pancha, A., McGinty, P., 2002: Stresses and strains in a twisted subduction zone – Fiordland, New Zealand. Geophysical Journal International 148, 637-648. Reyners, M. and Webb. T, 2002: Large earthquakes in Fiordland, New Zealand, 1989-93. New Zealand Journal of Geology and Geophysics 45: 109-120. Reyners, M., McGinty, P., Cox, S., Turnbull, I., O’Neill, T., Gledhill, K., Hancox, G., Beavan, J., Matheson, D., McVerry, G., Cousins, J., Zhao, J., Cowan, H., Caldwell, G., Bennie, S, and the GeoNet team, 2003: The MW 7.2 Fiordland earthquake of August 21, 2003: background and preliminary results. Bulletin of the New Zealand Society for Earthquake Engineering 36(4):xx-xx.
Schweinfurth, U., 1966. Uber eine besondere Art der Hangabtragung in neuseelandischen Fjordland. Zeitschrift fur Geomorphologie 10: 144-149. Thompson, R., 1988: Immediate Report on inspections conducted near the head of Lake Te Anau following the earthquake of June 1988. Unpublished Immediate Report D41/876. DSIR NZ Geological Survey (now GNS), Dunedin. Turnbull, I.M., and Uruski, C.I., 1995: Geological map of the Waiau Basin–Lake Monowai area. 1:50,000 Geological Map 19, Sheet C46 and part C45. Institute of Geological and Nuclear Sciences Limited, Lower Hutt. Turnbull, I.M.; Beanland, S. 1988: Te Anau earthquake inspection. EDS Immediate Report 88/06, Institute of Geological & Nuclear Sciences. Van Dissen, R., Cousins, J., Robinson, R., and Reyners, M., 1994: The Fiordland Earthquake of 10 August 1993: A reconnaissance report covering tectonic setting, peak ground acceleration, and landslide damage. Bulletin of the N Z Society for Earthquake Engineering, 27(3): 147-154.
Wright, A.C.S., and Miller, R.B., 1952: Soils of southwest Fiordland. N.Z. Soil Bureau Bulletin 7. Whitehouse, I.E., 1983: Distribution of large rock avalanches in the central Southern Alps, New Zealand. New Zealand Journal of Geology and Geophysics, 26:271 – 279. Wood, B.L., 1960: Sheet 27 Fiord (1st edition), Geological Map of New Zealand 1:250,000. DSIR, Wellington.

Institute of Geological & Nuclear Sciences Limited
Gracefield Research Centre Rafter Research Centre
69 Gracefield Road 30 Gracefield RoadPO Box 30 368 PO Box 31 312Lower Hutt Lower HuttNew Zealand New Zealand
Phone +64-4-570 1444 Phone +64-4-570 4637Fax +64-4-570 4600 Fax +64-4-570 4657
Dunedin Research Centre Wairakei Research Centre
764 Cumberland Street State Highway 1, WairakeiPrivate Bag 1930 Private Bag 2000Dunedin TaupoNew Zealand New Zealand
Phone +64-3-477 4050 Phone +64-7-374 8211Fax +64-3-477 5232 Fax +64-7-374 8199
For more information visit the GNS website
http://www.gns.cri.nz