Reconciling research and implementation in micro health insurance experiments in India: study...
16
TRIALS Reconciling research and implementation in micro health insurance experiments in India: study protocol for a randomized controlled trial Doyle et al. Doyle et al. Trials 2011, 12:224 http://www.trialsjournal.com/content/12/1/224 (11 October 2011)
-
Upload
conor-doyle -
Category
Documents
-
view
217 -
download
0
Transcript of Reconciling research and implementation in micro health insurance experiments in India: study...

TRIALS
Reconciling research and implementation inmicro health insurance experiments in India:study protocol for a randomized controlled trialDoyle et al.
Doyle et al. Trials 2011, 12:224http://www.trialsjournal.com/content/12/1/224 (11 October 2011)

STUDY PROTOCOL Open Access
Reconciling research and implementation inmicro health insurance experiments in India:study protocol for a randomized controlled trialConor Doyle1, Pradeep Panda1, Ellen Van de Poel2, Ralf Radermacher1 and David M Dror1,2*
Abstract
Background: Microinsurance or Community-Based Health Insurance is a promising healthcare financing mechanism,which is increasingly applied to aid rural poor persons in low-income countries. Robust empirical evidence on thecausal relations between Community-Based Health Insurance and healthcare utilisation, financial protection and otherareas is scarce and necessary. This paper contains a discussion of the research design of three Cluster RandomisedControlled Trials in India to measure the impact of Community-Based Health Insurance on several outcomes.
Methods/Design: Each trial sets up a Community-Based Health Insurance scheme among a group of micro-financeaffiliate families. Villages are grouped into clusters which are congruous with pre-existing social groupings. Theseclusters are randomly assigned to one of three waves of implementation, ensuring the entire population is offeredCommunity-Based Health Insurance by the end of the experiment. Each wave of treatment is preceded by a round ofmixed methods evaluation, with quantitative, qualitative and spatial evidence on impact collected. Improving uponpractices in published Cluster Randomised Controlled Trial literature, we detail how research design decisions haveensured that both the households offered insurance and the implementers of the Community-Based Health Insurancescheme operate in an environment replicating a non-experimental implementation.
Discussion: When a Cluster Randomised Controlled Trial involves randomizing within a community, generatingadequate and valid conclusions requires that the research design must be made congruous with social structureswithin the target population, to ensure that such trials are conducted in an implementing environment which is asuitable analogue to that of a non-experimental implementing environment.
Keywords: Micro insurance, community based, healthcare utilisation, financial protection, randomised trial
Background and RationaleBackgroundHealth insurance coverage is woefully lacking in the devel-oping world. Poor households must often resort to high-cost loans or asset sales to finance healthcare, and may beforced to forego essential treatments altogether (BinnedijkE, et al, Hardship financing of healthcare among ruralpoor in Orissa, India, submitted). Development organisa-tions have increasingly recognised the role that healthmicroinsurance (HMI) can play as a poverty reductiontool [1,2]. One form of HMI is Community-Based Health
Insurance (CBHI), in which communities mutualise risksand resources into a locally-managed healthcare fund [3].CBHI schemes have been implemented in India, Afghani-stan, Nepal, Burkina Faso, Mali, Senegal, Nigeria, andextensively throughout Rwanda and Tanzania. However,recent literature reviews have noted both a limited body ofevidence on both HMI and CBHI impact, and consider-able methodological problems in many of the availablestudies [4-6].To help close knowledge gaps and aid policy design,
Erasmus University Rotterdam, the University of Cologneand the Micro Insurance Academy (MIA) are operatingthree separate CBHI impact evaluations in rural areas ofnorthern India. The microinsurance schemes are beingimplemented by three Indian charitable NGOs (BAIF,
* Correspondence: [email protected] Insurance Academy, 246 Sant Nagar, East of Kailash, New Delhi110065, IndiaFull list of author information is available at the end of the article
Doyle et al. Trials 2011, 12:224http://www.trialsjournal.com/content/12/1/224 TRIALS
© 2011 Doyle et al; licensee BioMed Central Ltd. This is an Open Access article distributed under the terms of the Creative CommonsAttribution License (http://creativecommons.org/licenses/by/2.0), which permits unrestricted use, distribution, and reproduction inany medium, provided the original work is properly cited.

Nidan and Shramik Bharti) with technical support fromMIA. Each evaluation is organised as a cluster randomisedcontrolled trial (CRCT), in which randomly selected mem-bers of a network of women’s microfinance groups (“SelfHelp Groups” or SHGs) are offered the option to affiliateto a CBHI scheme which they design and manage. Theimpact of each scheme on a range of indicators will beanalysed, including healthcare utilisation and financialprotection of members.This article describes the study protocol of these trials,
with a focus on the issues faced in designing a methodolo-gically robust CRCT that must also meet the constraintsimposed by implementation requirements. Scientific eva-luations of development programs must always take placein a specific context, with the result that the institutionalsetting and implementation needs of the program caninfluence both the internal and external validity of analysesof its impact. The article details how implementation con-straints impacted research design, and how research andimplementation needs were jointly considered prior tolaunching the project, in order to ensure both a supportiveand scientifically robust trial environment.
RationaleThe crucial issue in measuring the impact of CBHI is theconstruction of a comparable and unbiased counter-fac-tual. Let Yi be annual health care use in a village i that isoffered the opportunity to enroll in a CBHI scheme. Thevillage has two potential outcomes; its annual health careuse if it avails of CBHI (treated, or yit) and its annualhealth care use if it does not (control, or yic). The treat-ment effect of CBHI on annual village level health care useequals yit-yic; but only one of the potential outcomes canbe observed, as a single village cannot simultaneously beinsured and uninsured. If multiple villages are observed,some which avail of CBHI and others which do not, anestimate of the expected treatment effect, E(yit-yic), can berecovered by measuring the difference between them,(Yt-Yc). For this to provide unbiased estimates, the villagesthat take up CBHI must be comparable, both in observa-ble and unobservable characteristics, to those which donot. However, in the context of a voluntary insurance pro-gram, those villages which take up CBHI are likely to bericher, sicker, or otherwise systematically different fromthose which do not. The effects of these selection biasesover treatment and control groups, B, means the measuredeffect of CBHI is (Yt-Yc) = E(yit-yic)+B.One way to avoid this problem is by randomising villages
into treatment and control groups. Cluster randomisedcontrolled trials (also known as “Group RandomisedTrials”), ensure an unbiased counterfactual by explicitlyrandomising treatment over clusters of individuals. In theabove context, the treatment is the offer of CBHI, and the
groups/clusters are villages. As external variables areblocked from influencing selection into treatment and con-trol groups, the outcomes of villages randomly assigned tothe control group are the same in expectation as the out-comes the treatment group would have experienced hadthey remained untreated i.e. E(B) = 0. The measured treat-ment effect, (Yt-Yc), is thus an unbiased estimate of themean treatment effect, E(yit-yic) [7,8]*. For this reason, ran-domised trials are generally considered the “gold standard”in quantitative impact evaluations [9].Unfortunately, by this standard, the quantitative knowl-
edge base on the impact of CBHI is methodologicallyweak, as well as limited in scope. We are aware of only 6CBHI schemes which have been subject to quantitativeevaluations employing regressions or more rigorousmethods. Only 1 scheme has been evaluated by CRCT[10], with 2 other schemes having been evaluated using aless rigorous quasi-experimental approach [11]. Theremaining 3 schemes have been evaluated only via regres-sion-based methodologies [12-14], which cannot controlfor unobservable differences between insured and unin-sured populations, and are therefore likely to deliverbiased impact estimates. The body of available evidenceon CBHI impact is too small and methodologically weakto make any general conclusions. Moreover, these sixevaluations each utilise different indicators to measurethe impact of CBHI, which causes considerable difficul-ties in making cross-study comparisons of impact.The motivation for the three CRCTs described in this
paper is to help close these knowledge gaps: to providereliable quantitative evidence on CBHI impact by employ-ing the CRCT approach; to quickly upscale the number ofCBHI trials which have been evaluated by running threeseparate trials; and to begin generating evidence which iscomparable across trials by using standard data collectiontools and outcome indicators.
MethodsAll three CRCTs follow the same research protocol. Pre-defined clusters of individuals are randomly assigned toeither treatment or control groups. Those in the treat-ment clusters take part in a structured education pro-gram on insurance and CBHI, participate in packagedesign and pricing decisions, and are then offered theoption to pay a premium and join the CBHI scheme.Those paying the premium enjoy pre-defined healthinsurance benefits for one year. Those in control clus-ters are offered neither insurance education nor CBHImembership. Three waves of implementation sequen-tially roll out treatment to all clusters over time. Thefollowing discussion focuses on how the research proto-col has been pro-actively developed to take into accountimplementation considerations.
Doyle et al. Trials 2011, 12:224http://www.trialsjournal.com/content/12/1/224
Page 2 of 15

Location, Implementing Partners & Target PopulationThe three CRCTs are being undertaken at three separatesites in Northern India - one each in Kanpur Dehat andPratapgarh districts in Uttar Pradesh, and one in Vaishalidistrict in Bihar (Figure 1). All three sites are poor ruralareas primarily dependent on agriculture, located 50-100km outside major urban centers.Implementation of a CBHI scheme pre-supposes that
the trial region contains a self-identified community,with experience of co-operating democratically formutual benefit, and an apex body within this communitycapable of driving new social programs. At each trial,implementation is thus facilitated by a locally basedNGO, or “implementing partner”. Each implementingpartner oversees a pre-existing network of Self HelpGroups (SHGs) in the project area. SHGs typically con-sist of a group of 10-20 women from a village, who agreeto add a pre-specified amount of money to a communalpot/bank account each month. Members may take loansfrom the pot for investment activities and emergencyexpenditures. The SHG concept originated in India inthe 1980s as a self-contained alternative to governmentsponsored co-operative societies [15]. The number ofSHGs has grown steadily since the early 1990’s, andgroups are now found throughout India [16]. In 2009,over 1.6 million functioning SHGs were affiliated withformal-sector banks [17]. Implementing partners for ourCBHI project were purposively selected on the basis ofan evaluation of their capacity to provide support to theirSHGs during the insurance set-up process† .At each site, the experimental cohort is defined as all
members of households with at least one woman regis-tered in March 2010 as a member of an SHG facilitated by
the local implementing partner. Totals of 8933, 7105 and7838 persons are eligible to take part in the experiment atPratapgarh, Kanpur Dehat and Vaishali respectively. Table1 presents summary statistics of those eligible to partici-pate in the trial (based on data from the baseline survey -see below). The average daily consumption per person (inpurchasing power parity $, including home producedfood) is estimated at $2.72 (Pratapgarh), $3.05 (Vaishali)and $4.17 (Kanpur Dehat). Respectively, 26%, 18% and23% of households report themselves as being below theinternational absolute poverty line of PPP $1.25 per personper day. The majority of adult males work in agriculture,either farming their own small holdings or working ascasual labourers on others’ land. At Pratapgarh andVaishali, which include some small rural town areas, 19%-20% of adult males work in a small business, such as road-side vending. In Kanpur Dehat, 70% of all adult maleswork in agriculture, and only 12% work in any form ofbusiness. At all sites, most adult females attend to domes-tic duties for their households. Healthcare access is poor:as is common in India, when a new illness develops, atleast half of first-contact outpatient visits at all three sitesare to unqualified providers [18].
Description of treatment programThe treatment on these CRCTs is a CBHI implementationprogram which has been developed by the Micro Insur-ance Academy. The MIA is an Indian-based charitabletrust which provides research, training, structured techni-cal assistance, and advisory services to CBHI and othermicroinsurance programs. In a CBHI scheme, a local com-munity owns and operates a health insurance fund on anot-for-profit basis. Community members are involved in
Trial 2 - Kanpur Dehat
Trial 1 - Pratapgarh
Trial 3 - Vaishali
Uttar Pradesh
Bihar
Figure 1 Locations of Trial Sites.
Doyle et al. Trials 2011, 12:224http://www.trialsjournal.com/content/12/1/224
Page 3 of 15

Table 1 Summary Statistics of Families of SHG Members by Trial Sites
Trial 1 - Pratapgarh Trial 2 -Kanpur Dehat
Trial 3 - Vaishali
State Uttar Pradesh Uttar Pradesh Bihar
Implementing Partner BAIF Shramik Bharti Nidan
No. Villages 15 42 34
Trial Population* 8933 7105 7838
No. SHG Members 1557 1226 1459
Mean Annual Consumption per capita Rs (Standard Deviation) 16233 (15131) 24934 (30298) 18231 (21772)
Mean Annual Consumption per capita $US (Standard Deviation)** 358 (334) 551 (669) 403 (481)
Mean Consumption, per capita per annum, $PPP (Standard Deviation)*** 991 (924) 1523 (1850) 1113 (1329)
Mean Daily Consumption per capita, $PPP (Standard Deviation) 2.72 (2.53) 4.17 (5.07) 3.05 (3.64)
% of HHs below International Absolute Poverty Line (PPP “tabcaption”.25 at 2005 prices) 26 18 23
% Adult Males in Agriculture 53 70 59
% Adult Females at Home 65 70 67
% First Visits to Unqualified Providers 55 67 50
* Estimate - Number of SHG members is known, but not all SHG members answered a HH survey, so size of all households is not known. Estimate = [(No. of SHG members who did not answer HH survey) ×(average HH size at site)] + [No. people in HHs of SHG members who answered HH survey]
** Calculated at USD/Rupee midrate of 1/45.29, Dec 3 2010
*** Calculated at World Bank PPP conversion factor for 2009 of 0.3616
Doyle
etal.Trials
2011,12:224http://w
ww.trialsjournal.com
/content/12/1/224Page
4of
15

package design and pricing decisions, and ideally elect/nominate members to act as administrative staff. Anyprofits are retained as capital buffers, or returned to mem-bers. The particular CBHI implementation model used isbased on the MIA’s extensive field experience in the set-up of CBHI schemes, and has previously been rolled-outin full at four sites, two in India and two in Nepal.Although it has proven successful in establishing CBHIschemes among low income persons with little or no priorexperience of insurance, this model’s impact on access tocare and financial protection has not previously been the
subject of rigorous evaluation. The model consists of asequence of four self-contained modules (Figure 2). To aidgeneralisability of findings, and comparisons across thethree trials, each module is defined by function (the pur-pose it seeks to achieve) rather than content (the specificmanner in which this purpose is achieved) [19]. Thesequencing and time span of each module is homogeneousacross sites, but content and operations are subject to(usually minor) context specific modifications.Implementation begins with a “Design” module, which
optimises the contents and operation of the CBHI scheme,
2. Awareness
Awareness Campaign (x3) CHAT (x2)
Enrollment (x1)
1. Design
Design workshop (x1) Benefit Options workshop (x1)
Awareness Tools workshop (x1)
4. Live Scheme
Claim Submission Claim Decision Claim Payment
3. Launching
Selection of Officers Training of Officers Installation of MIS
Baseline Research
Provider Survey HH Survey Qualitative: Healthcare GPS & GIS Mapping Qualitative: Social Capital
4. Live Scheme
Claim SubmissionClaim DecisionClaim Payment
3. Launching
Selection of OfficersTraining of OfficersInstallation of MIS
2. Awareness
Awareness Campaign (x3)CHAT (x2)
Enrollment (x1)
Key Outcome Indicators
Intensity of Usage of Health Services Equity of Usage of Health Services Levels of Healthcare Expenditure Socio-Economic Status of Household
Accessibility of Healthcare
Figure 2 CBHI Implementation & Research Processes.
Doyle et al. Trials 2011, 12:224http://www.trialsjournal.com/content/12/1/224
Page 5 of 15

aiming to secure community buy-in and scheme sustain-ability. SHG leaders and scheme staff from the implement-ing partner are taken through 3 structured workshops.First, a Design workshop develops business processes foroperational aspects of CBHI (premium collection, claimsprocessing, etc.), integrating them into the existing NGOand SHG management structures. Second, a BenefitOptions Finalisation workshop engages SHG leaders todesign up to 5 potential CBHI coverage packages. A sim-ple MS-Excel interface allows participants to cost a profit-neutral premium for any combination of coverage optionsand caps, reflecting the prices and illness incidencesreported in a baseline survey (see below). Third, the sameaudience is exposed to a range of pilot insurance educa-tion tools (posters, songs, street plays, videos and a movie)at an Awareness Tools workshop, and feedback gathered.The “Awareness” module is then rolled out to the treat-
ment clusters. This module structures enrolment deci-sions via a program of 6 fortnightly SHG meetings. Thefirst 3 discussions (“awareness campaign”) are structurededucational sessions explaining the concept and workingsof insurance, intended for SHG members and the finan-cial decision makers in their households. Two furtherstructured discussions introduce households to the avail-able CBHI packages and ask each SHG to cast a vote forone preferred package (“Choosing Healthplans AllTogether” or CHAT). SHG votes are aggregated tochoose one insurance package for the trial. In one furthergroup meeting, the price and coverage of the selectedpackage are explained. Treatment group members canenroll in CBHI at this meeting, or for a limited periodafterwards. Enrolment decisions are intended to be madeen-bloc: the members of each SHG must decide either tojoin the insurance scheme as a group, along with all themembers of their households, or not enroll at all. En-blocenrollment helps to avoid adverse selection. Enrollmentdecisions are voluntary, but necessarily public, as SHGmembers must debate among themselves whether to join.The simultaneous “Launching” module sets up back-
office and operations elements of the scheme. Processesare formalised, and forms developed. Local variations inspecific processes are allowed. Five levels of staff areelected from among SHG members and implementingpartner staff (local insurance activists, insurance coordina-tor, claims committee, coordination committee, andombudsman). Multi-day trainings are held on-site for eachcadre of staff. A scheme office is set up at a focal pointwithin the project area, facilitated with phones and com-puters. A dedicated microinsurance management informa-tion system (MIS) application is delivered by MIA to theimplementing partner, and separate trainings on its useare held.Finally, once Awareness and Launching modules are
complete, the scheme goes live. Members are supplied
with pre-printed claim forms and printed materialsdescribing benefits. Insurance activists, present in allclusters, assist CBHI members in submitting claims andreceiving payouts. All claims are transmitted to theClaims Committee, composed of locally-elected leaders,who meet monthly to decide on payouts. Successfulclaims are paid in cash to the claimants. The separatelyelected ombudsman mediates any disputes which ariseover claims decisions.
Objectives & outcome measuresThe key objective of these trials is to examine the effect ofCBHI on members’ usage of healthcare services andhealthcare financing patterns. We put forward two pri-mary hypotheses:
1. Members of a CBHI scheme will increase theirutilization of available healthcare, as compared tothose without insurance cover, for those categoriesof treatment which are covered by the insurancepackage.2. Membership in a CBHI scheme is associated with adecrease in the household’s Out-of-Pocket Spending(OOPS) on healthcare, as compared to those withoutinsurance cover.
Two analogous primary outcome measures are used:
1. Number of consultations with a physician per caseof illness or injury2. Net OOPS per case of illness or injury = Expendi-ture on (Fees + cost of prescribed drugs + cost ofrecommended tests + cost of other recommendedmaterials/procedures + insurance premium). OOPSdoes not include, transport, accommodation, otherindirect costs of attaining healthcare, self-treatment,costs reimbursed by insurance
A variety of additional measures will be used to helpassess healthcare usage in terms of the range of servicesutilised by those seeking care. Beyond these areas ofcore study, a rich set of quantitative, qualitative and spa-tial data which is being collected will enable researchersto examine secondary questions of the effect of CBHIon households’ risk exposure, healthcare financingmethods, probability of catastrophic health expenditures,consumption and investment patterns, and physicalaccessibility of healthcare.
Method of ClusteringThe first step in experimental design was to define theunits which would be used for randomisation. Buildingfrom the smallest unit upwards, individuals, households,SHGs and villages are not suitable: the first three provide
Doyle et al. Trials 2011, 12:224http://www.trialsjournal.com/content/12/1/224
Page 6 of 15

inaccurate analogues of the implementation environmentwhich would prevail in a non-experimental implementa-tion; the fourth additionally causes research issues. Indi-viduals and households are unsuitable units ofrandomisation because the treatment program isdesigned to be administered to and managed by groupsof geographically proximate people with previous associa-tions to each other. The SHG is an unsuitable unitbecause villages typically contain multiple SHGs, andmembers of control group SHGs with a strong preferencefor insurance may push treatment group members toinclude them. This may be difficult to resist within thesocial structure of a small village. Implementing partnersfurther advised that randomisation at a sub-village levelwould be perceived as capricious by the target popula-tion, and would damage uptake rates. Villages are anunsuitable unit of randomisation because SHG member-ship levels are highly unbalanced over villages (Table 2):the largest villages contain up to 18 times as many mem-bers as the smallest. Randomising by village would openthe possibility of very small treatment groups in the firstwave, creating problems of statistical power, possiblyweakening implementation structures, and leaving theinsurance scheme more financially exposed to insolvency.A group of villages is thus the smallest feasible clus-
ter/unit of randomisation. Researchers developed a tech-nique to cluster villages together which explicitlyaddresses the implementation constraints outlined abovei.e. communities must not be subdivided, clusters mustbe geographically compact, and the insurance schememust have a roughly equal sized pool of potential mem-bers whatever the outcome of randomisation. Baselinerecords of number of household surveys completed bySHG members were combined with GIS maps of theimplementation area to show the spatial distribution ofthe trial population over villages (see Figure 3, panel 1
for the map used at Kanpur Dehat) ‡. Three criteriawere then used to group villages into clusters:
• Non-Divisibility: A village cannot be divided overdifferent clusters.• Equal Size: Clusters must contain (roughly) equalnumbers of SHG members. In interaction with thenon-divisibility criterion, this defines a target clustersize, X:
X ≈ Highest No. Complete HH surveys at a Single Village
Note that the cluster size is defined as number ofbaseline household surveys completed by SHG mem-bers (rather than number of SHG members) as thisis the effective number of household-level observa-tions per cluster.• Continuity: Each cluster should be geographicallycontinuous. Where this is not possible, a clustermust be formed from proximate villages, such thatno external village lies on a straight line betweenany two villages in the cluster.
15, 17 and 16 clusters were defined at Pratapgarh, Kan-pur Dehat and Vaishali respectively (see Figure 3, panel 2for the configuration determined at Kanpur Dehat). Clus-ters contain 60-80 households each (Table 2).
Power calculationsSample size on these trials is pre-determined by thenumber of persons meeting the inclusion criteria i.e. thenumber of persons in households in which at least onemember has chosen to affiliate to an SHG. Researchershave designed the trials to maximize their ability to
Table 2 Summary Research Statistics by Trial Sites
Trial 1 - Pratapgarh Trial 2 -Kanpur Dehat
Trial 3 -Vaishali
No. SHG Members 1557 1226 1459
No. Households# 1455 1156 1454
No HH surveys complete 1284 1042 1363
No. Individuals## 8933 7105 7838
Smallest village: Largest village 1:17 1:8 1:18
No. Villages 15 42 34
No. Clusters 15 17 16
Average HHs per cluster 86 61 84
Minimum Detectable Effect Size 0.406 0.397 0.394
# Estimate - As a HH may contain more than one SHG member, we do not know how many HHs are among the SHG members who did not answer surveys.Estimate = [Counted number of households]+[(No of SHG members not answering a survey)*(1-proportion of households containing more than 1 SHG memberamong HH survey respondents)]
## Estimate - Number of SHG members is known, but not all SHG members answered a HH survey, so size of all households is not known. Estimate = [(No. ofSHG members who did not answer HH survey) × (average HH size at site)] + [No. people in HHs of SHG members who answered HH survey]
Doyle et al. Trials 2011, 12:224http://www.trialsjournal.com/content/12/1/224
Page 7 of 15

detect outcomes within the proscribed sample size.Power calculations can provide a useful indication of theprobability that, given a certain study design, researcherswill be able to reject the hypothesis of zero effect when
an effect in fact exists. Using a priori information onmean and variability of the outcomes of interest and thecorrelation in these outcomes between households inthe same clusters, one can calculate, for a given study
3. Treatment and
Control Clusters, Wave 1
2. Clusters for
Random Assignment
1. Raw Distribution
of SHG
Members
Figure 3 Illustration of Clustering and Randomisation Process at Trial 2 (Kanpur Dehat). In panel 1, each coloured and bounded area isone village. In Panel 2, villages marked in the same colour and with the same number, form a cluster.
Doyle et al. Trials 2011, 12:224http://www.trialsjournal.com/content/12/1/224
Page 8 of 15

design, the minimum detectable effect size (MDES) ofthe study. The standardised MDES for an outcome ofinterest, y, given a study design that has J clusters ofidentical size n, and a proportion P of the sample that isconsidered treated, can be calculated as [7]:
MDESy =tα/2 + t1−κ√P(1 − P)J
√ρ +
1 − ρ
n
where r is the correlation in y between households inthe same cluster, � represents the probability that wereject the null hypothesis of no effect when it is in factfalse (power), a is the significance level and ta/2 and t1-�are given by t-tables. This equation illustrates that theMDES is very dependent on the number of clusters (J),while cluster size (n) affects MDES much less; especiallywhen households within clusters are quite similar (r islarge). In sum, when individuals in clusters are very alike,having more clusters is preferred to having more peoplewithin clusters [20]. However, creating clusters smallerthan groups of villages complicates the implementationof the CBHI scheme. Therefore several negotiationrounds have taken place between implementing andresearch partners to get to a study design that is workablefor both parties. The following conservative assumptionshave been made in our power calculations, which weredone using the Optimal Design 1.77 :
• a = 0.05 - Type I error rate of 5%• � = 0.80 - Power of 80%• r = 0.05 - Intra-cluster correlation (ICC) of 5%.This estimate was chosen to be conservative withregards to empirical experience on the most similarprevious trial [21], and also with regards to our ownbaseline data**.• n = 60-80 - see Table 2 for the average cluster sizeby site• J = 15-17 - see Table 2 for the number of clustersper site
The parameters used implicitly assume that evaluationis undertaken at a household level. For variables mea-sured at the individual level, power is higher due to theincreased number of observations per cluster. The result-ing standardised MDES were calculated at 0.39-0.40,meaning that our experiment allows picking up an effectof the magnitude of 0.39-0.40 times the standard devia-tion of the variable of interest (see Table 2).
Method of RandomisationThe final step in study design is to determine the processwhich will assign clusters to either the treatment or con-trol group. Random assignment of clusters is the methodmost likely to ensure there are no systematic differences
between the two groups. Prior to randomisation, it wasevident that the trials would inevitably take place in anunblinded environment, i.e. both treatment and controlgroup members would be aware of their status (as wouldresearchers and implementers). For any configuration ofclusters, villages in the treatment and control clusters areproximate to each other and social, familial, business andpolitical linkages can exist across them. Knowledge ofCBHI will inevitably become available to the controlpopulation. Unblinded trials can contain risks of bias - ofparticular concern was the risk that control populationmembers with a strong preference for inclusion in theCBHI program would push scheme administrators toregister them, or change their health care seeking beha-viour/answers during data collection because of theirawareness of the insurance schemes [22]. Moreover, ethi-cal concerns were expressed by implementers about pre-cluding members from access to a potentially beneficialprogram (this is a common justification for stepped-wedge randomisation [23]). To forestall the risk of bias ofresults, and assuage ethical concerns, it was decided toassign treatment on a “stepped-wedge” basis [24]. Threewaves of treatment will be undertaken, with one third ofclusters randomly assigned for treatment in each wave.By the end of the project, all clusters will receive treat-ment. Prior to wave 1, it was publicly announced that allvillages would be included in the scheme, but that imple-mentation would be gradual.Pre-randomisation matching of clusters was considered,
in order to improve balance on important observable char-acteristics between treated and controls groups. As thereare few clusters and many variables we would like tomatch on, we employed a method for reducing the dimen-sionality of the matching characteristics, similar to propen-sity score matching techniques [25]. For each site, a probitregression was run at the household level, with a binaryindicator of any healthcare use in the last one month asdependent variable, against a variety of socioeconomic,health and demographic variables†† . Data was taken fromthe baseline survey (see section 3.4.1). The linear predic-tions from this probit model were then used to rank clus-ters: clusters with similar predicted outcome values can beexpected to have broadly similar values of the determinantsof health care use. The top three ranked clusters werematched into one triplet, the next three into a second tri-plet and so on. Within each triplet, one cluster is then ran-domly assigned to the first treatment wave, one to thesecond and one to the third. In this manner, we ensurethat clusters in the three groups are likely to be similar inthe matching variable, and therefore also likely to havesimilar observable characteristics.Table 3 and Table 4 show means of selected variables
for treatment and control groups (for wave 1)†† generatedusing a simple random draw and the matching procedure
Doyle et al. Trials 2011, 12:224http://www.trialsjournal.com/content/12/1/224
Page 9 of 15

described above. As the main outcomes of interest inthese studies are related to health care use, supply ofhealth care and health status (see section 4.5), it is espe-cially important to achieve balance on these variables.Generally there are few significant differences in observa-ble characteristics between treatment and control groupsacross the three sites, with the exception of variablesrelated to health care supply (especially in Pratapgarh),and religion/caste. Matching induces little improvementin balancing as compared to simple randomisation, andgiven the decrease in power that typically results fromusing a matching design with limited clusters numbers[26], research staff used a simple random draw (utilizingthe sample routine available in Stata 11) to define theorder in which clusters were offered CBHI at KanpurDehat and Vaishali (see Figure 3, panel 3 for randomisa-tion at Kanpur Dehat).This random draw procedure was modified for Pratap-
garh, which has a small number of villages (15) andhighly varying numbers of SHG members per village.
This situation makes it impossible to define clusters ofvillages as described in section above. Therefore, at Pra-tapgarh, we created 5 triplets of 3 villages each, by rank-ing villages according to the number of SHG memberswithin each village, then placing the three largest in onetriplet, and so on. In each triplet of villages, one villagewas then randomly assigned to each of the three treat-ment waves. This procedure is expected to involve asmaller loss of power than pure matching, due to thesmaller number of degrees of freedom taken up [27].
Outcome Measures & Data CollectionThese trials follow a mixed methods design, collectingquantitative, qualitative and spatial data on trial impact.The quantitative outcome indicators being tracked offera holistic coverage of the key impact areas in CBHI:health services utilisation levels, healthcare expenditureand financing patterns, equity in healthcare use, andhouseholds’ socio-economic status. Parallel programs ofspatial and qualitative research provide complimentary
Table 3 Means of selected covariates across treatment and controls (in wave 1)
Random draw
Kanpur Dehat Pratapgarh Vaishali
treated control p-value treated control p-value treated control p-value
Female (1/0) 0.48 0.49 0.22 0.52 0.53 0.27 0.53 0.52 0.52
Education (years) 4.83 4.95 0.48 4.30 4.30 0.97 3.34 3.08 0.07
Middle wealth third† (1/0) 0.35 0.35 0.90 0.40 0.31 0.00 0.27 0.38 0.00
Highest wealth third† (1/0) 0.37 0.34 0.33 0.29 0.33 0.10 0.34 0.30 0.22
Scheduled Tribe (1/0) 0.04 0.06 0.08 0.02 0.04 0.11 0.03 0.01 0.01
Scheduled Caste(1/0) 0.24 0.19 0.05 0.34 0.34 0.83 0.36 0.28 0.00
Other backward caste(1/0) 0.50 0.54 0.22 0.44 0.41 0.37 0.51 0.63 0.00
General Caste (1/0) 0.14 0.13 0.78 0.07 0.09 0.17 0.07 0.03 0.00
Nomadic Tribe (1/0) 0.09 0.08 0.64 0.13 0.12 0.33 0.03 0.05 0.04
age 0-5 years (1/0) 0.11 0.11 0.82 0.12 0.11 0.19 0.15 0.16 0.28
age 5-18 years (1/0) 0.35 0.35 0.74 0.37 0.37 0.97 0.35 0.35 0.55
age 50 years and older (1/0)s 0.14 0.14 0.65 0.16 0.16 0.64 0.13 0.13 0.64
reporting excellent or good health (1/0) 0.60 0.61 0.46 0.59 0.60 0.16 0.48 0.50 0.16
number of acute illness in last 30 days 1.35 1.37 0.85 1.18 1.10 0.21 1.12 1.00 0.02
self employed agriculture (1/0) 0.23 0.19 0.00 0.07 0.07 0.56 0.08 0.07 0.63
self employed business (1/0) 0.03 0.03 0.80 0.04 0.06 0.02 0.06 0.06 0.81
not working (1/0) 0.46 0.49 0.03 0.55 0.53 0.07 0.53 0.53 0.88
Salaried worker (1/0) 0.02 0.02 0.52 0.02 0.03 0.14 0.01 0.01 0.54
occasional salary (1/0) 0.05 0.05 0.38 0.11 0.11 0.89 0.12 0.12 0.81
number of chronic illness in last 30 days 0.73 0.84 0.07 1.44 1.31 0.04 0.71 0.80 0.09
inpatient facility within 30 min (1/0) 0.15 0.24 0.00 0.58 0.55 0.31 0.75 0.75 0.83
outpatient facility within 15 min (1/0) 0.38 0.45 0.01 0.52 0.51 0.77 0.56 0.69 0.00
pharmacy within 15 min (1/0) 0.36 0.45 0.00 0.52 0.51 0.77 0.53 0.63 0.00
minimum time to a health facility (minutes) 23.21 20.41 0.04 16.82 15.88 0.10 14.58 12.36 0.00
not got care when needed (1/0) 0.17 0.16 0.76 0.22 0.23 0.59 0.18 0.19 0.69
A simple random draw is used to draw 3 equally sized groups of clusters.† Information on asset ownership and housing characteristics were combined to estimate a wealth index using principal component analysis and divide the populationin wealth thirds [39]
Doyle et al. Trials 2011, 12:224http://www.trialsjournal.com/content/12/1/224
Page 10 of 15

evidence on these areas, and additionally examineimpact areas which are not amenable to purely quantita-tive analysis (e.g. social capital, or physical access tocare). This section describes all tools used for data col-lection. These will be administered in all 3 waves overthe course of the study, with each research wave beingundertaken immediately prior to a wave of implementa-tion. A longitudinal database is thus built up in eachresearch strand, allowing evaluators to map the evolu-tion of the impact of insurance over time. All tools weredrafted with input from a scientific advisory committeeand researchers with prior field surveying experience onrelated topics. Ethical approval for all tools was gainedfrom the independent ethics committee of the Univer-sity of Cologne. Informed consent was taken prior toeach interview, and respondents were free to halt theinterview at any time, or to refuse to answer questionswithin it. All baseline surveying took place prior to therelease of information about the CBHI project to thecommunity, such that the baseline data is not biased byknowledge of the experiment.
Quantitative data collectionThe core quantitative tool is a Household (HH) survey.This survey covers a standard set of demographic vari-ables, along with brief self-reports of health status (drawnfrom the EQ-5D tool) and a vulnerability module [28]§§ .Core sections record illness-level data on health-seekingbehaviour, expenditure levels and financing methods. Thesurvey contains an exceptional amount of detail on healthcare seeking behavior and financing, as these are the maintopics of study, but also because detailed information onfrequency of visits and associated costs is needed for thecalculation of insurance premia. HH socio-economic sta-tus is captured via questions on monthly non-healthexpenditures and asset ownership, similar to the formatsused by the Indian government’s National Sample SurveyOrganisation.Baseline data collection took place from March to May
2010. The tool was administered to all households inboth treatment and control groups, with either the SHGmember or the head of household as the primary respon-dent. A separate, additional sampling frame of non-SHG
Table 4 Means of selected covariates across treatment and controls (in wave 1)
Random draw with matching
Kanpur Dehat Pratapgarh Vaishali
treated control p-value treated control p-value treated control p-value
female 0.47 0.49 0.06 0.52 0.53 0.37 0.53 0.52 0.62
education year 4.89 4.91 0.86 4.49 4.22 0.05 3.58 2.97 0.00
middle asset third 0.36 0.34 0.63 0.32 0.35 0.23 0.29 0.37 0.01
highest asset third 0.38 0.33 0.09 0.37 0.29 0.00 0.39 0.28 0.00
Scheduled Tribe (1/0) 0.03 0.07 0.00 0.04 0.03 0.67 0.02 0.02 0.70
Scheduled Caste(1/0) 0.21 0.21 0.97 0.43 0.30 0.00 0.24 0.33 0.00
Other backward caste(1/0) 0.61 0.47 0.00 0.37 0.45 0.00 0.60 0.59 0.93
General Caste (1/0) 0.08 0.17 0.00 0.06 0.09 0.09 0.06 0.03 0.01
Nomadic Tribe (1/0) 0.08 0.08 0.78 0.11 0.13 0.40 0.08 0.03 0.00
age 0-5 years (1/0) 0.10 0.11 0.44 0.12 0.11 0.92 0.15 0.16 0.15
age 5-18 years (1/0) 0.36 0.34 0.28 0.37 0.36 0.78 0.35 0.35 0.57
age 50 years and older (1/0)s 0.13 0.14 0.50 0.16 0.16 0.54 0.13 0.13 0.91
reporting excellent or good health (1/0) 0.60 0.61 0.61 0.61 0.59 0.37 0.50 0.49 0.31
number of acute illness in last 30 days 1.41 1.33 0.26 1.21 1.10 0.11 1.08 1.02 0.27
self employed agriculture (1/0) 0.23 0.19 0.00 0.07 0.07 0.79 0.07 0.08 0.44
self employed business (1/0) 0.03 0.03 0.94 0.06 0.05 0.05 0.07 0.06 0.05
not working (1/0) 0.47 0.48 0.49 0.52 0.54 0.15 0.53 0.53 0.84
Salaried worker (1/0) 0.02 0.02 0.51 0.03 0.02 0.01 0.01 0.01 0.07
occasional salary (1/0) 0.05 0.06 0.20 0.10 0.11 0.53 0.10 0.12 0.09
number of chronic illness in last 30 days 0.76 0.82 0.30 1.32 1.37 0.40 0.77 0.77 0.96
inpatient facility within 30 min (1/0) 0.18 0.22 0.18 0.53 0.58 0.09 0.76 0.74 0.63
outpatient facility within 15 min (1/0) 0.38 0.45 0.02 0.59 0.48 0.00 0.62 0.66 0.10
pharmacy within 15 min (1/0) 0.44 0.40 0.22 0.66 0.44 0.00 0.60 0.60 0.89
minimum time to a health facility (minutes) 20.39 22.11 0.22 14.13 17.13 0.00 13.22 13.00 0.73
not got care when needed (1/0) 0.02 -0.10 0.47 0.21 0.23 0.36 0.19 0.19 0.95
female autonomy index 1772.50 1577.70 0.48 0.25 -0.17 0.01 -0.18 -0.01 0.22
Doyle et al. Trials 2011, 12:224http://www.trialsjournal.com/content/12/1/224
Page 11 of 15
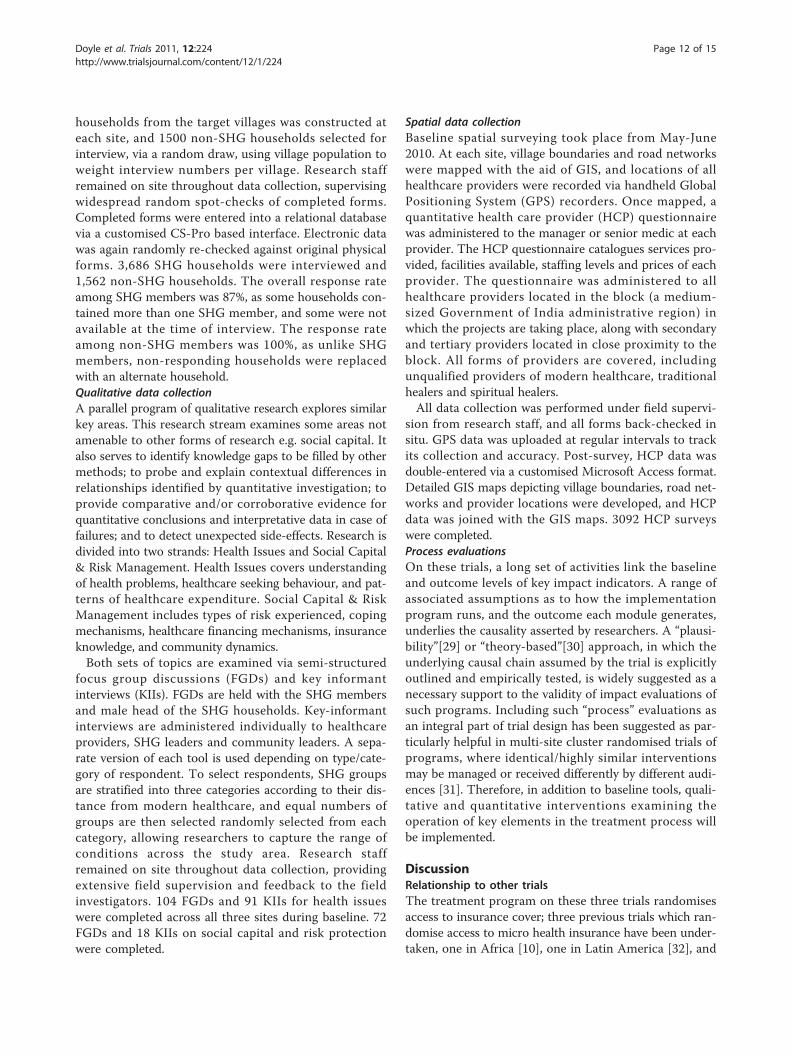
households from the target villages was constructed ateach site, and 1500 non-SHG households selected forinterview, via a random draw, using village population toweight interview numbers per village. Research staffremained on site throughout data collection, supervisingwidespread random spot-checks of completed forms.Completed forms were entered into a relational databasevia a customised CS-Pro based interface. Electronic datawas again randomly re-checked against original physicalforms. 3,686 SHG households were interviewed and1,562 non-SHG households. The overall response rateamong SHG members was 87%, as some households con-tained more than one SHG member, and some were notavailable at the time of interview. The response rateamong non-SHG members was 100%, as unlike SHGmembers, non-responding households were replacedwith an alternate household.Qualitative data collectionA parallel program of qualitative research explores similarkey areas. This research stream examines some areas notamenable to other forms of research e.g. social capital. Italso serves to identify knowledge gaps to be filled by othermethods; to probe and explain contextual differences inrelationships identified by quantitative investigation; toprovide comparative and/or corroborative evidence forquantitative conclusions and interpretative data in case offailures; and to detect unexpected side-effects. Research isdivided into two strands: Health Issues and Social Capital& Risk Management. Health Issues covers understandingof health problems, healthcare seeking behaviour, and pat-terns of healthcare expenditure. Social Capital & RiskManagement includes types of risk experienced, copingmechanisms, healthcare financing mechanisms, insuranceknowledge, and community dynamics.Both sets of topics are examined via semi-structured
focus group discussions (FGDs) and key informantinterviews (KIIs). FGDs are held with the SHG membersand male head of the SHG households. Key-informantinterviews are administered individually to healthcareproviders, SHG leaders and community leaders. A sepa-rate version of each tool is used depending on type/cate-gory of respondent. To select respondents, SHG groupsare stratified into three categories according to their dis-tance from modern healthcare, and equal numbers ofgroups are then selected randomly selected from eachcategory, allowing researchers to capture the range ofconditions across the study area. Research staffremained on site throughout data collection, providingextensive field supervision and feedback to the fieldinvestigators. 104 FGDs and 91 KIIs for health issueswere completed across all three sites during baseline. 72FGDs and 18 KIIs on social capital and risk protectionwere completed.
Spatial data collectionBaseline spatial surveying took place from May-June2010. At each site, village boundaries and road networkswere mapped with the aid of GIS, and locations of allhealthcare providers were recorded via handheld GlobalPositioning System (GPS) recorders. Once mapped, aquantitative health care provider (HCP) questionnairewas administered to the manager or senior medic at eachprovider. The HCP questionnaire catalogues services pro-vided, facilities available, staffing levels and prices of eachprovider. The questionnaire was administered to allhealthcare providers located in the block (a medium-sized Government of India administrative region) inwhich the projects are taking place, along with secondaryand tertiary providers located in close proximity to theblock. All forms of providers are covered, includingunqualified providers of modern healthcare, traditionalhealers and spiritual healers.All data collection was performed under field supervi-
sion from research staff, and all forms back-checked insitu. GPS data was uploaded at regular intervals to trackits collection and accuracy. Post-survey, HCP data wasdouble-entered via a customised Microsoft Access format.Detailed GIS maps depicting village boundaries, road net-works and provider locations were developed, and HCPdata was joined with the GIS maps. 3092 HCP surveyswere completed.Process evaluationsOn these trials, a long set of activities link the baselineand outcome levels of key impact indicators. A range ofassociated assumptions as to how the implementationprogram runs, and the outcome each module generates,underlies the causality asserted by researchers. A “plausi-bility”[29] or “theory-based”[30] approach, in which theunderlying causal chain assumed by the trial is explicitlyoutlined and empirically tested, is widely suggested as anecessary support to the validity of impact evaluations ofsuch programs. Including such “process” evaluations asan integral part of trial design has been suggested as par-ticularly helpful in multi-site cluster randomised trials ofprograms, where identical/highly similar interventionsmay be managed or received differently by different audi-ences [31]. Therefore, in addition to baseline tools, quali-tative and quantitative interventions examining theoperation of key elements in the treatment process willbe implemented.
DiscussionRelationship to other trialsThe treatment program on these three trials randomisesaccess to insurance cover; three previous trials which ran-domise access to micro health insurance have been under-taken, one in Africa [10], one in Latin America [32], and
Doyle et al. Trials 2011, 12:224http://www.trialsjournal.com/content/12/1/224
Page 12 of 15

one ongoing in India [33]. However, more fundamentally,these trials apply a program of community action: thetreatment population is enjoined in group settings to learnabout insurance, before actively making community deci-sions regarding the content, form, and management of theinsurance scheme. The response to treatment is not purelyreactive, but interactive. A recent strand of literature hasseen CRCTs which randomise participation in structured,interactive programs of participatory community actionbeing developed [34] and conducted [35]. At least one pre-vious study has combined two of these elements (access toa microfinance product, and a participatory communitytraining and action cycle) into a single treatment program[36,37]. It should be noted that while the treatmentapplied is thematically related to those used in other trials,the overall treatment effect should not be considered as asum of these parts: the treatment applied in this study is aprogram, whose effects must be evaluated as a whole [19].
External validity of trialsCRCTs provide sound quantitative information on thecausal effects of an intervention on the outcome measuresof interest. However, no randomised trial generates resultswhich are applicable to all persons in all settings [38]. Thelimits on the external validity and generalisability of find-ings on these trials are defined by the two stages of selec-tion prior to randomisation: the purposive selection ofimplementing partners, and the self-selection of local resi-dents into implementing partners’ SHG ground structure.Both stages of selection are necessary to establish the con-ditions required for implementation of this program. Itshould be made explicit that our experiments will onlyallow statements on the impact of CBHI on access to careand financial protection within a population of SHGs.Researchers have thus taken steps to ensure that the limitsof external validity of the trials can be probed. All quanti-tative elements of the baseline study were applied to sepa-rately selected samples of SHG and non-SHG populationin the trial areas, allowing researchers to map in detailobserved differences between the two groups. Additionally,the treatment program is replicated in three separate set-tings, with three almost entirely separate implementationteams. This affords researchers greater confidence in dis-cerning results that are potentially generalisable, by allow-ing them to search for results which are repeated overtrials. Social science RCTs typically run only one trial: inthis context, three replications is a considerable advancefor external validity.The only aspect of the institutional environment which
has been purposively varied by site is the average length ofoperation of SHGs. At site 1, most SHGs have been inexistence for over a decade. At site 3, most SHGs werespecially created for the purposes of the insurance trial,and were in operation for only 9-12 months prior to the
beginning of CBHI activities. Trial 2 has average SHGoperating lengths of 4-6 years. This variation allows insightinto the depth of community involvement necessary toproduce effective implementations.
ConclusionIn this paper, we have described the design of three trialswhich must randomise access to an insurance schemewithin a pre-existing community, but also aim to set upinsurance administration structures based on social lin-kages between treatment group members. We point outseveral dangers to the validity and accuracy of the mea-sured outcomes of these trials. Of particular concern isthat randomisation across community lines can lowertreatment uptake, and create conditions that encouragecontamination of the control group. These dangers arecaused because of the fact that the treatment programmust be run as a trial.In order to avoid these dangers, we have made a unique
package of research design decisions. Of particular note isan innovative approach to defining the clusters/units ofrandomisation used in the trial, which aims to preservecommunity structures within each cluster as far as possi-ble; this is allied to the infrequently used “step-wedge” ran-domisation design to dis-incentivise control groupmembers from pushing for inclusion in the scheme.Two lessons can be drawn, one narrow, and one more
general. Narrowly, trials which must subdivide within acommunity, but seek to preserve community structures,may find that the design described here, or a variantthereof, will serve to increase the robustness of their out-put. More broadly, this paper can be read as a case studyof how the research demands of a randomised trial of asocial program have the potential to alter the environmentin which the program is implemented. This in turn canalter the impact of the program: so what is measured bythe experiment is not what would have occurred if theprogram had been run non-experimentally. This is a littlediscussed, but no doubt often encountered issue in thedesign of randomised trials in the social sciences.Researchers must take care to identify and make theirtrials robust to these potential feedbacks.
Endnotes*Note that in the context of voluntary insurance, self-
selection of households into the CBHI scheme still exists.For this reason, it is important to compare those initiallyassigned to the treatment group to those in the controlgroup, independent of insurance status and measure theintention to treat effect. Longitudinal data collection alsooffers possibilities to control for selection into the insur-ance scheme.
† Note that this purposive selection was used toincrease the probability of successful uptake of the
Doyle et al. Trials 2011, 12:224http://www.trialsjournal.com/content/12/1/224
Page 13 of 15

CBHI schemes, but also means that measures of impactare not necessarily generalisable to the entire IndianSHG population.
‡Experimental design took place immediately afterbaseline surveying was completed
§Available from www.wtgrantfoundation.org/resources/overview/research_tools.The Cluster Randomised Trialswith Repeated Measures module was used, whichemploys a considerably more complex version of thebasic formula presented in the text. Within this morecomplex formulation we additionally set the parametersF (frequency of surveying) = 1, D (trial duration) = 2. Pis not a required parameter.**ICC was found to be less than 5% for most variables
of interest in baseline data (calculated using Stata’s lone-way routine). This implies lower MDESs than thosepresented.
†† To avoid having to impose a dependent variable,which obviously affects the weight that is given to each ofthe variables in creating the matching variable, we alsotried using principal component analysis. Results werequalitatively similar, but we prefer using a regressionbased approach as this has the advantage that the covari-ates that are highly correlated with the probability to usehealth care, and therefore important to achieve balanceon, get a larger ‘weight’ in the matching variable.
‡‡Note that we define treated as those offered CBHI inthe first wave, and controls as those treated at any pointafter the first wave.
§§More information on vulnerability survey scan befound at http://go.worldbank.org/R048B34JF0
AcknowledgementsThis work was financially supported by the European Commission 7th
Framework Program, grant ID HEALTH-F2-2009-223518. The authors wouldlike to thank the staff of the implementing partners (BAIF, Shramik Bhartiand Nidan), and in particular Mr. Swarup Datta, Mr. Amitabh Singh and Dr.Sandeep Kishore for invaluable research assistance and many inputs toresearch design. Mr. Sachin Shinde and Dr. Shikha Dixit of the MicroInsurance Academy provided key inputs to those portions of this paperdiscussing, respectively, qualitative and spatial techniques. The authors alsogratefully acknowledge the guidance of the members of the scientificadvisory committee of this project.
Author details1Micro Insurance Academy, 246 Sant Nagar, East of Kailash, New Delhi110065, India. 2Institute of Health Policy and Management, ErasmusUniversity Rotterdam, P.O. Box 1738, 3000 DR Rotterdam, The Netherlands.
Authors’ contributionsDD & RR conceived the study, and participated in its design and co-ordination. CD & PP participated in the design of the study and survey tools,and managed data collection. EVDP participated in the design of the studyand survey tools. All authors read and approved the final manuscript.
Competing interestsThe authors declare that they have no competing interests.
Received: 2 August 2011 Accepted: 11 October 2011Published: 11 October 2011
References1. ILO/STEP, GTZ: The Role of Microinsurance as a Tool to face Risks in the
context of Social Protection Geneva: ILO/STEP & GTZ; 2006.2. UNDP: Building Security for the Poor: Potential and Prospects for
Microinsurance in India Colombo: United Nations Development Programme;2007.
3. Dror D, Jacquier C: Micro-insurance: Extending Health Insurance to theExcluded. International Social Security Review 1999, 52(1):71-97.
4. Ekman B: Community-Based Health Insurance in Low-Income Countries:A Systematic Review of the Evidence. Health Policy & Planning 2004,19(5):249-270.
5. Dercon S, Kirchberger M: Literature Review on Microinsurance Geneva: ILO; 2008.6. Radermacher R, McGowan H, Dercon S: The Impact of Microinsurance. In
Microinsurance Compendium 2 (working title). Edited by: Churchill C & MatulM. Geneva: ILO; .
7. Duflo E, Glennerster R, Kremer M: Using Randomisation in DevelopmentEconomics Research: A Toolkit. National Bureau of Economic Research2006, Technical Working Paper 333.
8. Rubin DB: Estimating Causal Effects of Treatments in Randomised andNon-randomised Studies. Journal of Educational Psychology 1974,66:688-701.
9. Murray D, Varnell S, Blitstein J: Design & Analysis of Group RandomisedTrials: A Review of Recent Methodological Developments. AmericanJournal of Public Health 2004, 94(3):423-432.
10. Gnawali DP, Pokhrel S, Sie A, Sanon M, De Allegri M, Souares A, Dong H,Sauerborn R: The Effect of Community-Based Health Insurance on theUtilization of Modern Health Care Services: Evidence from Burkina-Faso.Health Policy 2009, 90(2-3):214-222.
11. Rao KR, Waters H, Steinhard L, Alam S, Hansen P, Naeem AJ: AnExperiment with Community Health Funds in Afghanistan. Health Policyand Planning 2009, 24(4):301-311.
12. Schneider P, Diop F: Synopsis of Results on the Impact of Community-Based Health Insurance on Financial Accessibility to Health Care inRwanda. Health, Nutrition and Population Family Discussion PaperWashington DC; World Bank; 2001.
13. Jütting JP: Do Community-Based Health Insurance Schemes ImprovePoor People’s Access to Health Care? Evidence from Rural Senegal.World Development 2004, 32(2):273-288.
14. Franco LM, Diop F, Burgert CR, Kelley AG, Makinen M, Simpara CHT: Effectsof Mutual Health Organisations on use of Priority Healthcare Services inUrban and Rural Mali: a Case-Control Study. Bulletin of the World HealthOrganisation 2008, 86(11):830-838.
15. Reddy CS, Bhaskar Rao G, Ramalakshmi S, Samatha V, Vanaja S, MuraliKrishna MKS, Raja Reddy K, Tirupataiah N, Poorna Chandrika P, TrivikramaDevi G, Sreenivasulu V, Kolluru S, Srinivas Rao C, Kanchwala R: SHGFederations in India Hyderabad: APMAS; 2007.
16. Fouillet C, Augsburg B: Spread of the Self-Help Groups Banking LinkageProgramme in India. International Conference on Rural Finance Research:Moving Results, FAO & IFAD, Rome; 2007.
17. National Bank for Agriculture and Rural Development: NABARD AnnualReport 2009. Mumbai: NABARD; 2010.
18. Gautham M, Koren R, Binnendijk E, Dror DM: “First We Go to the SmallDoctor": 1st Contact Healthcare Providers of Rural Communities inAndhra Pradesh and Orissa, India. Indian Journal of Medical Research 2011.
19. Hawe P, Shiell A, Riley T: Complex Interventions: How “Out of Control”can a Randomised Control Trial Be? British Medical Journal 2004,328:1561-3.
20. Raudenbush S: Statistical Analysis and Optimal Design for ClusterRandomised Trials. Psychological Methods 197 2(2):173-185.
21. De Allegri M, Pokhrel S, Becher H, Dong H, Mansmann U, Kouyaté B,Kynast-Wolf G, Gbangou A, Sanon M, Bridges J, Sauerborn R: Step-wedgeCluster-randomised Community-based trials: An Application to the Studyof the Impact of Community Health Insurance. Health Research Policy andSystems 2008, 6(10):6-10.
22. Campbell M, Fitzpatrick R, Haines A, Kinmonth AL, Sandercock P,Spiegelhalter D, Tyrer P: Framework for Design and Evaluation ofComplex Interventions to Improve Health. British Medical Journal 2000,312:694-696.
23. Levy RW, Rayner CR, Fairley CK, Kong DCM, Mijch A, Costello K, McArthur C:Multidisciplinary HIV Adherence Intervention: A Randomised Study. InAIDS Patient Care and STDs. Volume 18. 2004;728-735.
Doyle et al. Trials 2011, 12:224http://www.trialsjournal.com/content/12/1/224
Page 14 of 15

24. Brown C, Lilford R: The Stepped-Wedge Trial Design: A SystematicReview. BMC Medical Research Methodology 2006, 6(54).
25. Rosenbaum PR, Rubin DB: The Central Role of the Propensity Score inObservational Studies for Causal Effects. Biometrica 1983, 70:41-50.
26. Raudenbush S, Martinez A, Spybrook J: Strategies for Improving Precisionin Group Randomised Experiments. Educational Evaluation and PolicyAnalysis 2007, 29(1):5-29.
27. Klar N, Donner A: Current and Future Challenges in the Design andAnalysis of Cluster Randomization Trials. Statistics in Medicine 2001,20:3729-3740.
28. Wagstaff A, Lindelow M: Are Health Shocks Different? Evidence from aMulti-Shock Survey in Laos. Policy Research Working Paper 5335: WorldBank; 2010.
29. Victoria CG, Habicht JP, Bryce J: Evidence-Based Public Health: MovingBeyond Randomised Trials. American Journal of Public Health 2004,94(3):400-405.
30. White H: Theory-Based Impact Evaluation: Principles & Practice. WorkingPaper No. 3, International Initiative for Impact Evaluation 2009.
31. Oakley A, Strange V, Bonell C, Allen E, Stephenson J: Process Evaluation inRandomised Control Trials of Complex Interventions. British MedicalJournal 2006, 332:413-416.
32. Thornton RL, Hatt LE, Field EM, Islam M, Diaz FS, González MA: SocialSecurity Health Insurance for the Informal Sector in Nicaragua: ARandomised Evaluation. Health Economics 2009, 19:181-206.
33. Mukhopahyay T, Behl A: Impact Evaluation of Health Micro Insurancethrough Randomised control Trials: Two Interventions targeting RenewalRates and Health Outcomes. Chennai: Institute for Financial Managementand Research 2011.
34. More NS, Bapat U, Das S, Patil S, Porel M, Vaidya L, Koriya B, Barnett S,Costello A, Fernandez A, Osrin D: Study Protocol: Cluster-RandomisedControlled Trial of Community Mobilisation in Mumbai Slums toImprove Care during Pregnancy, Delivery, Postpartum and for theNewborn. Trials 2008, 9(7).
35. Manandar D, Osrin D, Shrestha BP, Mesko N, Morrison J,Tumbahangphe KM, Tamang S, Thapa S, Shrestha D, Thapa B, Shrestha JR,Wade A, Borghi J, Standing H, Manandhar M, Costello AM, Members of theMIRA Makwanpur trial team: Effect of a Participatory Intervention withWomen’s Groups on Birth Outcomes in Nepal: a Cluster-RandomisedControl Trial. Lancet 2004, 364:970-79.
36. Pronyk , et al: Effect of a Structural Intervention for the Prevention ofIntimate Partner Violence and HIV in Rural South Africa: a ClusterRandomised Trial. Lancet 2006, 368:1973-83.
37. Pronyk PM, Hargreaves JR, Kim JC, Morison LA, Phetla G, Watts C, Busza J,Porter JD: Can Social Capital be Intentionally Generated? A RandomisedTrial from Rural South Africa. Social Science & Medicine 2008, 67:1559-1570.
38. Rothwell P: Factors That Can Affect the External Validity of RandomisedControlled Trials. PLoS Clinical Trials 2006, 1(1).
39. Filmer D, Pritchett L: Estimating Wealth Effects Without ExpenditureData-Or Tears: An Application To Educational Enrollments In States OfIndia. Demography 2001, 38(1):115-132.
doi:10.1186/1745-6215-12-224Cite this article as: Doyle et al.: Reconciling research andimplementation in micro health insurance experiments in India: studyprotocol for a randomized controlled trial. Trials 2011 12:224.
Submit your next manuscript to BioMed Centraland take full advantage of:
• Convenient online submission
• Thorough peer review
• No space constraints or color figure charges
• Immediate publication on acceptance
• Inclusion in PubMed, CAS, Scopus and Google Scholar
• Research which is freely available for redistribution
Submit your manuscript at www.biomedcentral.com/submit
Doyle et al. Trials 2011, 12:224http://www.trialsjournal.com/content/12/1/224
Page 15 of 15