RECONCILIATION OF COST AND FINANCIAL … or over-absorption of ... reconciliation statement, ......
128
1 LESSON 1 RECONCILIATION OF COST AND FINANCIAL ACCOUNTS - I 1.0 Introduction 1.1 Objectives 1.2 Requirement for Reconciliation 1.3 Reasons for difference in Profit/Loss 1.4 System of Reconciliation 1.5 Memorandum Reconciliation Account 1.6 Summary of the chapter 1.7 Exercise 1.1 Objectives After studying this chapter, you would be able to: Understand the meaning and need of reconciliation of cost accounts and financial accounts Explain the reasons for difference in profit or loss as per cost and financial accounts Know the method of preparing a reconciliation statement or a memorandum reconciliation account When cost accounts and financial accounts are maintained separately in two different sets of books, two profit and loss accounts will be prepared-one for costing books and the other for financial books. The profit or loss shown by financial books may not agree with that shown by costing books. So, both sets of books are tallied to know the reasons for disagreement of the two profits. It is essential to know that the question of reconciliation of cost and financial accounts arises only under non-integral system. However, under the integral accounts, the problem of reconciliation does not arise since cost and financial accounts are integrated into one set of books and only one Profit and Loss Account is prepared. 1.2 Requirement for Reconciliation The necessity for reconciliation arises owing to the following reasons- 1. It discloses the causes for variance in profit or loss between cost and financial accounts. 2. Reconciliation aids in checking the arithmetic accuracy of both sets of books. In other words, it enables to test the reliability of cost accounts. 3. It promotes coordination between cost accounting and financial accounting departments.
Transcript of RECONCILIATION OF COST AND FINANCIAL … or over-absorption of ... reconciliation statement, ......
1
LESSON 1
RECONCILIATION OF COST AND FINANCIAL ACCOUNTS - I
1.0 Introduction
1.1 Objectives
1.2 Requirement for Reconciliation
1.3 Reasons for difference in Profit/Loss
1.4 System of Reconciliation
1.5 Memorandum Reconciliation Account
1.6 Summary of the chapter
1.7 Exercise
1.1 Objectives
After studying this chapter, you would be able to:
Understand the meaning and need of reconciliation of cost accounts and
financial accounts Explain the reasons for difference in profit or loss as per cost and financial accounts
Know the method of preparing a reconciliation statement or a memorandum
reconciliation account When cost accounts and financial accounts are maintained separately in two different sets of
books, two profit and loss accounts will be prepared-one for costing books and the other for
financial books. The profit or loss shown by financial books may not agree with that shown by
costing books. So, both sets of books are tallied to know the reasons for disagreement of the
two profits.
It is essential to know that the question of reconciliation of cost and financial accounts
arises only under non-integral system. However, under the integral accounts, the problem
of reconciliation does not arise since cost and financial accounts are integrated into one set
of books and only one Profit and Loss Account is prepared.
1.2 Requirement for Reconciliation The necessity for reconciliation arises owing to the following reasons-
1. It discloses the causes for variance in profit or loss between cost and
financial accounts.
2. Reconciliation aids in checking the arithmetic accuracy of both sets of
books. In other words, it enables to test the reliability of cost accounts.
3. It promotes coordination between cost accounting and financial accounting
departments.

2
1.3 Reasons for difference in Profit/Loss
Difference in profit or loss between cost and financial accounts may arise due to the
following reasons:
1. Items shown in cost accounts only- There are a few items which are included
in cost accounts and not in financial accounts. Examples:
• The notional cost of employing capital (Interest on capital employed but
not actually paid.)
• Notional rent (charge in lieu of rent when premises are owned and no
rent is payable), Notional salaries
• Notional depreciation (Depreciation on fully depreciated assets still in use)
2. Items shown only in financial accounts -there are a number of items which does
not appear in cost accounts but shown in financial accounts. At the time of reconciling,
any items under this category must be taken under consideration. Following are the
examples of such items.
(a) financial incomes
▪ Income tax refund
▪ Transfer fees received
▪ Dividend and interest received on investments
▪ Interest received on bank deposits
▪ Rent receivable
(b) financial expenses
• Loss on the sale of capital assets
• Amounts written off, goodwill, discount on debentures, preliminary expenses
• Provision for bad and doubtful debts
• Loss due to theft, pilferage, etc.
• Interest on bank loans and mortgages etc.
3. Under-absorption or over-absorption of overheads - overheads are recovered
at a predetermined rate in cost accounts while in financial accounts overheads are
recorded at actual cost. It causes difference in profit shown by cost accounts and
financial accounts.
4. Bases of stock valuation - stock valuation in financial accounts is based on the
principle of cost or market price whichever is less. Whereas stocks are valued
according to the method adopted in stores accounts, e.g. FIFO, LIFO, etc in cost
accounts. Different stock values result in some difference in profit or loss as shown
by the two sets of account books.
5. Different charges for depreciation- in financial accounts, depreciation may be
charged at straight line or diminishing balance method, etc., whereas machine hour
rate, production unit method, etc., may be adopted in cost accounts. This will also
cause a difference in the profit/ loss figures.

3
1.4 SYSTEM OF RECONCILIATION
The financial and cost accounts are reconciled by preparing a Reconciliation Statement or a
Memorandum Reconciliation Account. The following procedure is suggested for preparing
a Reconciliation Statement:
1. Start with the profit as per cost accounts.
2. Additions/ deductions regarding items
(a) expenses and losses:
Deduct: Items under-charged in cost accounts
Add: Items over-charged in cost accounts
For example, depreciation in cost accounts is Rs. 2,700 and that
in financial accounts is Rs. 2,900. There will be increase in costing
profit by Rs. 200 as compared to financial profit. Then in order to
reconcile, there will be deduction of Rs 200 from costing profit.
(b) Incomes and gains:
Deduct: Items over-recorded in cost accounts
Add: Items under-recorded or not recorded in cost accounts
For example, interest on investments received amounting to Rs.
2500 is not recorded in cost accounts. It will have negative effect in
profit as per cost books. So to reconcile, this amount of Rs. 2500 for
interest should be added in the costing profit.
(c) valuation of stock:
• Opening Stock-
Deduct: Amount of under-valuation in cost accounts
Add: Amount of over-valuation in cost accounts
• Closing Stock-
Deduct: Amount of over-valuation in cost accounts
Add: Amount of under-valuation in cost accounts
6. Closing stock of finished goods in cost accounts in calculated on the basis of cost
of production. Thus
Value of closing stock = Cost of production X Units Produced
Units of Closing Stock
Here
Units Produced =Units sold+ Units in closing stock - Units in opening stock
4. After making all the above additions and deductions in costing profit, the result will
be the profit as per financial books.

4
5. The above treatment of items will be reversed when the starting point in the
Reconciliation Statement is the profit as per financial accounts or loss as per cost
accounts.
Proforma of Reconciliation Statement Rs. Rs.
Profit as per cost accounts
Add:
• Financial incomes not recorded in cost books
• Items charged only in cost accounts
(Notional rent and interest on capital, etc.)
Over-absorption of overheads
• Over-valuation of opening stocks in cost books
• Under-valuation of closing stock in cost books
Less: . Under-absorption of overheads
• financial charges
• Under-valuation of opening stock in cost books
• Over-valuation of closing stock in cost books Profit as per financial accounts
Memorandum Reconciliation Account
It is a method of Reconciliation. The only difference is that the information is
shown in the form of an account. The procedure of its preparation is like that of
reconciliation statement, the only difference is that items shown under "+" column are
shown on the credit side and items shown under "-" column are shown on the debit side of
the memorandum reconciliation account. Proforma of Memorandum Reconciliation Account
Rs.
To (Item to be deducted) -
To (Item to be deducted) -
To (Item to be deducted) -
To (Item to be deducted) -
To (Item to be deducted) -
-(Balancing figure)
Rs.
To Profit as per financial
accounts
By (Item to be added) -
By (Item to be added) -
By (Item to be added) -
By (Item to be added) -
By (Item to be added) -

5
PROBLEMS AND SOLUTIONS
Illustration.1 From the following figures, prepare a reconciliation statement:
Rs.
Net profit as per financial books 31890
Net profit as per costing books 33380
Factory overheads under-recovered in costing 2850
Administration overheads recovered in excess 2125
Depreciation charged in financial books 1830
Depreciation recovered in costing 1975
Interest received but not included in costing 225
Income-tax provided in financial books 300
Bank interest credited in financial books 115
Stores adjustment (credited in financial books) 210
Depreciation of stock charged in financial accounts 430
Dividends appropriate in financial accounts 600
Loss due to theft and pilferage provided only in financial books 130
Solution
Reconciliation Statement
Rs. Rs.
Profit as per costing books 33380
Add: 1. Adm. overheads recovered in excess 2125
2. Depreciation overcharged in cost books (1975 - 1830) 145
3. Interest received but not included in costing 225
4. Bank interest credited in financial books only 115
5. Stores adjustment credited in financial books 210 2820
36200
Less: 1. Factory overheads under-recovered 2850
2. Income tax provided in financial books 300
3. Dividends appropriated 600
4. Depreciation of stock in financial books 430
5. Loss due to theft and pilferage not shown in cost books 130
4310
Profit as per financial books 31890

6
Illustration 2.
The profits as per cost accounts were Rs. 14,330, whereas the net profit as per
financial accounts of a company amounted to Rs. 9275. On reconciling the figure,
the following were noted:
Rs.
Director's fees not charged in cost accounts 525
A provision for bad and doubtful debts 485
Bank interest credited 15
Provision for income-tax 4150
Over-recovery of overhead in cost accounts 90
Prepare reconciliation statement. Also prepare memorandum
reconciliation account.
Solution
Reconciliation Statement
Particulars Rs. (+) Rs. (-)
Profit as per Cost Accounts 14,330
Less: Directors Fees not charged in Cost Account 525
Less: Provision for bad debts. not shown in Cost Accounts 485
Add: Bank interest credited in Profit & Loss Account 15
Less: Provision for income tax not shown in Cost Accounts 4150
Add: Over-recovery of overhead in Cost Accounts 90
14435 5160
Profit as per Financial Accounts 9275
14,435 14,435
Memorandum Reconciliation Account
Particulars Rs. Particulars Rs.
To Director's fees not By Profit as per Cost A/cs 14,435
charged in Cost A/c 525 By Bank Interest credited
15
To Provision for Bad Debts 485 in Profit and Loss A/c
To Provision for Income Tax 4150 By Over Recovery of
90
To Profit as per Financial A/cs 9275 Overhead in Cost A/c
14,330 14,330

7
Illustration 3.
From the following figures prepare a reconciliation statement:
Rs.
Profit as per costing records 10,000
Factory overheads under-recovered in costing 6,000
Selling and administration overheads over-recovered in costing 4,000
Bank interest credited in financial books 1000
Preliminary expenses written off in financial books 13000
Opening stock value:
in cost books 10000
in financial books 8000
Closing stock value:
in cost books 24000
in financial books 20,000
Solution (Do it yourself)
Reconciliation Statement
Particulars Rs. (+) Rs. (-)
Profit as per Cost A/cs 10,000
Add: Selling and administration overheads over-recovered _____
in Cost A/cs ____
Add: Bank Interest credited in Financial Books ______
Add: Opening Stock over valued in Costing Books
Less: Factory overheads under recovered in Cost A/cs _____
Less: Preliminary expenses written off in Financial Books ______
Less: Closing Stock overvalued in Costing Books _____
Loss as per Financial A/cs ______ _____
______
_______ _____

8
Illustration 4.
From the following figures,
prepare a reconciliation statement:
Cost Books Financial Books
Profit 25000 ?
Marketing overheads 4000 4,000
Provision for bad debts - 2500
Factory overheads 4250 3500
Director's fees - 1,000
Income Tax paid - 7500
Rent of owned Premises 3,000 -
Depreciation 5625 6,000
Share transfer fee (Cr.) - 500
Administrative overheads 2500 4,000
Solution
Reconciliation Statement
Particulars Rs - (+) Rs. (-)
Profit as per cost books 25000
Less: Provision for bad debts charged in financial books 2500
Add: Factory overheads over-absorbed in cost accounts 750
Less: Director's fees charged in financial books 1,000
Less: Income tax charged in financial books 7500
Add: Rent of owned premises charged in cost books 3,000
Less: Depreciation overcharged in financial books 375
Add: Share transfer fees credited in financial books 500
Less: Administrative overheads under absorbed in cost books 1500
29250
12875
Profit as per Financial Books 16375
29250 29250

9
Illustration 5 From the following information, reconcile the profit as per cost accounts with financial
accounts:
Cost A/c Financial A/c
Rs. Rs.
Profit 86,250
Opening Stock:
Material 10,000 10,300
Work-in-progress 8,500 8,000
Closing Stock:
Material 14,200 15,000
Work-In-Progress 6,000 5,600
Dividend and interest received Rs. 600. Loss on sale of investment Rs. 1,000. Interest
charged by the bank not considered in Financial Accounts and Cost Accounts Rs. 1,500.
Goodwill written off during the year Rs. 2,500. Preliminary expenses written off Rs. 3,000.
Overhead incurred Rs. 40,000. Overhead absorbed in Cost Accounts Rs. 38,500. Find out
profit as per financial accounts.
Solution (Do it yourself)
Reconciliation Statement
Particulars Rs. (+) Rs. (-)
Profit as per Cost Accounts 86,250
Add: Overvaluation of opening stock of material in
cost Accounts _____
Add: Overvaluation of opening stock of work-in-
progress in cost accounts _____
Add: Undervaluation of closing stock of material
in cost accounts _____
Less: Overvaluation of closing stock of work-in-progress
in cost accounts ______
Add: Dividend and interest credited in financial accounts ______
Less: Goodwill written off not recorded in cost accounts ______
Less: Preliminary expenses written off not recorded
in cost Accounts _______
Less: Loss on sale of investment not recorded in cost accounts ______
Less: Under-absorption of overheads in cost accounts _______
88,350 8,400
Profit as per Financial Accounts 79,950
88,350 88,350
Working Note: Interest charged by the bank not considered in Financial Accounts as
well as Cost Accounts will not be shown in Reconciliation Statement.

10
Illustration 6 (Do it yourself) A manufacturing company disclosed a net loss of Rs. 3,47,000 as per their cost accounts for the
year ended March 31, 2004. The financial accounts however disclosed a net loss of Rs.
5,10,000 for the same period. The following information was discovered as a result of
inspection of the figures of both the sets of accounts:
Rs.
Factory overheads under-absorbed 40,000
Administration overheads over-absorbed 60,000
Depreciation charged in Financial Accounts 3,25,000
Depreciation recovered in Cost Accounts 2,75,000
Interest on investments not included in Cost Accounts 96,000
Income-tax provided 54,000
Interest on loan funds in Financial Accounts 2,45,000
Transfer fee (credit in financial books) 24,000
Stores adjustment (credit in financial books) 14,000
Dividend received 32,000
Prepare a statement showing reconciliation between the figure of net loss as per
cost accounts and the figure of net loss shown in the financial books.
Solution (Do it yourself)
Memorandum Reconciliation Account
Particulars Rs. Particulars Rs.
To Net Loss as per Cost By Administration
Accounts 3,47,000 Overheads Over-absorbed ________
To Factory Overheads By Interest on Investments
Under-absorbed ______ not included in costs _______
To Income Tax not recorded By Transfer fees in
in Cost A/c _______ Financial Books ________
To Depreciation under By Stores Adjustment 14,000
absorbed in Cost A/c ________ By Dividend Received 32,000
To Interest on Loan funds in By Net Loss as per
Financial A/c 2,45,000 Financial Books
7,36,000 7,36,000
11
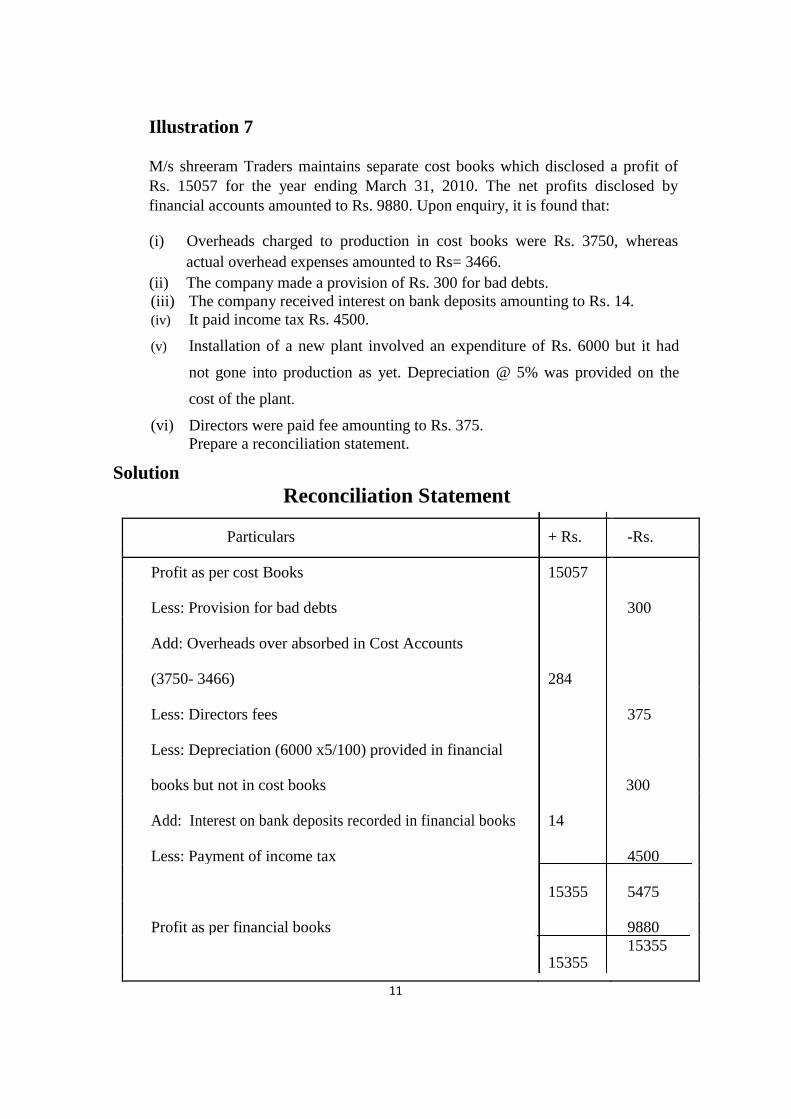
Illustration 7
M/s shreeram Traders maintains separate cost books which disclosed a profit of
Rs. 15057 for the year ending March 31, 2010. The net profits disclosed by
financial accounts amounted to Rs. 9880. Upon enquiry, it is found that:
(i) Overheads charged to production in cost books were Rs. 3750, whereas
actual overhead expenses amounted to Rs= 3466.
(ii) The company made a provision of Rs. 300 for bad debts.
(iii) The company received interest on bank deposits amounting to Rs. 14.
(iv) It paid income tax Rs. 4500.
(v) Installation of a new plant involved an expenditure of Rs. 6000 but it had
not gone into production as yet. Depreciation @ 5% was provided on the
cost of the plant.
(vi) Directors were paid fee amounting to Rs. 375.
Prepare a reconciliation statement.
Solution
Reconciliation Statement
Particulars + Rs. -Rs.
Profit as per cost Books 15057
Less: Provision for bad debts 300
Add: Overheads over absorbed in Cost Accounts
(3750- 3466) 284
Less: Directors fees 375
Less: Depreciation (6000 x5/100) provided in financial
books but not in cost books 300
Add: Interest on bank deposits recorded in financial books 14
Less: Payment of income tax 4500
15355 5475
Profit as per financial books 9880
15355 15355

12
Illustration 8
The following is the Trading and Profit & Loss Account of Sumit Industries Ltd.
for the year ended 31st December, 2016
Rs. Rs.
To Materials 45,000 By Sales (4,800 units) 96,000
To Wages 33,000 By Closing Stock
To Administrative Expenses 240,000 (1,200 units) 20,400
To Net Profit 8,400
1,16,400 1,16,400
The company's cost records show that:
(i) Works Overheads have been absorbed at Rs. 3 per unit produced; and
(ii) Administrative Overheads have been absorbed at Rs. 1.50 per unit produced.
Assuming there is nothing by way of work-in-progress either at the
beginning or at the end and there is no opening stock of finished goods.
Prepare:
(i) A statement of cost indicating the net profit; and
(ii) A statement reconciling the profit as disclosed by cost accounts and that
shown in financial accounts.
Solution:
Statement of Cost
Particulars Rs.
Materials 45,000
Wages 33,000
Prime Cost 78.000
Add: Works overhead (6,000 x 3) 18,000
Works Cost 96,000
Add: Administrative Overhead (6,000 x 1.50) 9,000
Cost of Production 1,05,000
Less: Closing Stock (1,05,000 x 1,200/6,000) 21,000
Cost of Goods sold 84,000
Profit 12,000
Sales 96,000

13
Working Note:
No. of units Produced = No. of units sold
+ No. of units in closing stock = 4.800 + 1.200 = 6,000
Reconciliation Statement
Particulars Rs. (+) Rs. (-)
Profits as per Cost Accounts 12,000
Less: Works overhead under absorbed in Cost
Accounts 6,000
Add: Administrative Overheads over absorbed in
Cost Accounts 3,000
Less: Closing Stock overvalued in Cost Accounts 600
15,000 6,600
Profits as per Profit and Loss A\c - 8,400
15,000 15,000
Illustration 9
The following Profit and Loss Account for the year ending 31st March, 2010 has
been extracted from the books of Awadesh Ltd.
Profit and Loss Accounts for the year ending 31.3.2010
Rs.
To Direct Materials 10,000
To Direct Labour 20,000
To Factory Expenses 9,500
To Administration Expenses 5,200
To Selling and Distribution Expenses 3,800
To Interest on Capital 1,000
To Goodwill written off 1,500
14
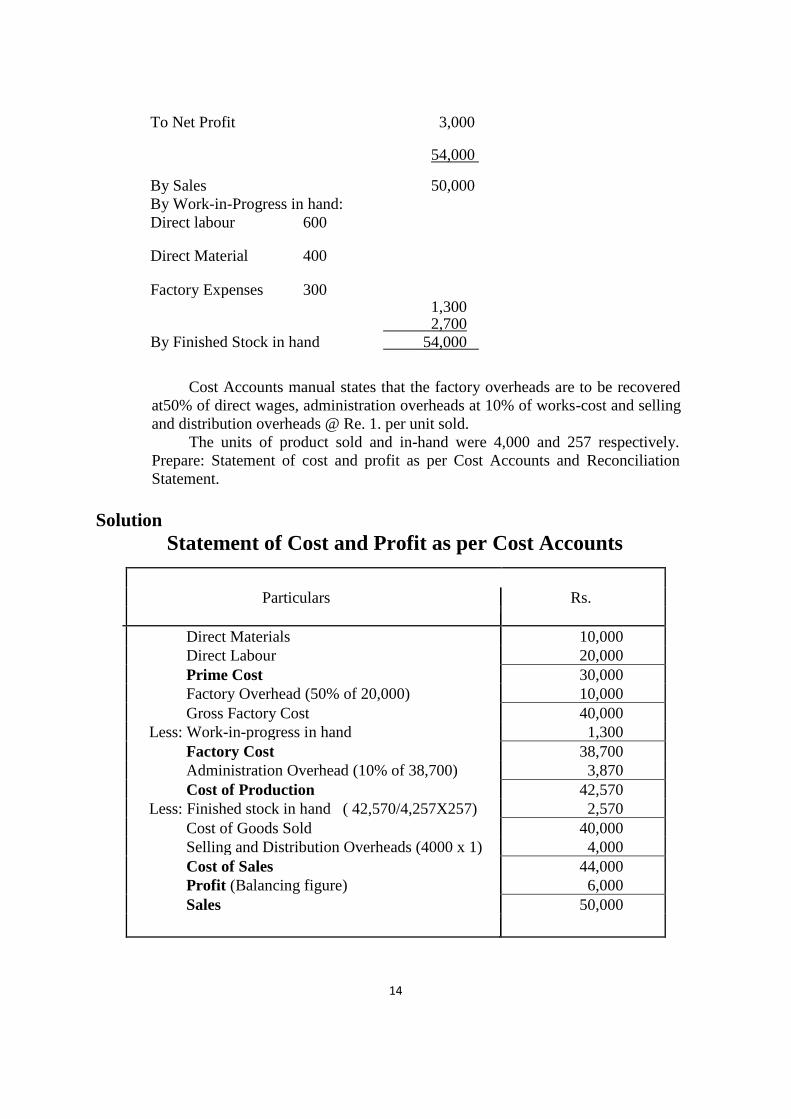
To Net Profit 3,000
54,000
By Sales 50,000
By Work-in-Progress in hand:
Direct labour 600
Direct Material 400
Factory Expenses 300 1,300 2,700
By Finished Stock in hand 54,000
Cost Accounts manual states that the factory overheads are to be recovered
at50% of direct wages, administration overheads at 10% of works-cost and selling
and distribution overheads @ Re. 1. per unit sold.
The units of product sold and in-hand were 4,000 and 257 respectively.
Prepare: Statement of cost and profit as per Cost Accounts and Reconciliation
Statement.
Solution
Statement of Cost and Profit as per Cost Accounts
Particulars
Rs.
Direct Materials 10,000
Direct Labour 20,000
Prime Cost 30,000
Factory Overhead (50% of 20,000) 10,000
Gross Factory Cost 40,000
Less: Work-in-progress in hand 1,300
Factory Cost 38,700
Administration Overhead (10% of 38,700) 3,870
Cost of Production 42,570
Less: Finished stock in hand ( 42,570/4,257X257) 2,570
Cost of Goods Sold 40,000
Selling and Distribution Overheads (4000 x 1) 4,000
Cost of Sales 44,000
Profit (Balancing figure) 6,000
Sales 50,000

15
Reconciliation Statement
Particulars Rs. (+) Rs. (-)
Profit as per Cost Accounts 6,000 -
Add: Factory Expenses over-absorbed in Cost Accounts 500 -
Selling and Distribution Expenses over-absorbed in
Cost Accounts 200 -
Closing stock of finished goods under-valued in
Cost Accounts 130 -
Less: Interest on Capital not shown in Cost Accounts - 1,000
Goodwill written off not shown in Cost Accounts - 1,500
Administration Overhead under-absorbed in
Cost Accounts - 1,330
6,830 3,830
Profit as per Profit and Loss Account (6,830 - 3,830) 3,000
6,830 6,830
Illustration 10 From the following information, prepare:
(a) Profit and Loss Account
(b) Cost Sheet
(c) Reconciliation Statement.
Rs. Units
Sales 2,50,000 20,000
Materials 1,00,000
Wages 50,000
Factory Overheads 45,000
Office and Administration Overheads 26,000
Selling and Distribution Overheads 18,000
Closing Stock: Finished Goods
Work-in-Progress :
Material 3,000
Wages 2,000
Factory Overheads 2,000
7,000
Goodwill written off 20,000
Interest on Capital 2,000
In Costing Books, factory overhead is charged at 100% on wages,
administration overhead at 10% of factory cost and selling and distribution
overheads at the rate of Re. 1 per unit sold.

16
Solution (Do it yourself)
Profit and Loss Account
Particulars Rs. Particulars Rs.
To Materials 1,00,000 By Sales 2,50,000
To Wages 50,000 By Closing stock of finished
To Factory Overheads 45,000 Goods ?
To Office and Administration By Work-in-progress
Overheads 26,000 Materials
To Selling and Distribution Wages
Overheads 18,000 Factory overheads ?
To Goodwill written off 2,000
To Interest on Capital 2,000
To Net Profit 11,000
2,72,000 2,72,000
Cost Sheet
Particulars Rs.
Materials 1,00,000
Wages 50,000
Prime Cost 1,50,000
Factory Overhead ?
Gross Factory Cost 2,00,000
Less: Closing Work-in-Progress 7,000
Factory Cost 1,93,000
Office and Administrative Overheads
(10% of Factory Cost 19,300
Cost of Production 2,12,300
Less: Closing Stock of Finished Goods ?
Cost of Goods Sold 2,00,000
?
Cost of Sales 2,20,000
Profit (Balancing figure) 30,000
Sales 2,50,000

17
Working Notes:
(i) Work-in-progress has been adjusted to calculate factory cost.
(ii) Value of work-in-progress has been taken the same as is given for Profit and
Loss Account.
(iii) Value of closing stock of finished goods has been calculated on the basis of
cost of production.
(iv) Number of Units Produced = Number of Units Sold
+ Number of Units in Closing Stock =
20,000 + 1,230 = 21,230 Units
(v) Selling and distribution overhead is calculated for number of units sold.
Reconciliation Statement
Particulars Rs. (+) Rs. (-)
Profit as per Cost Accounts 30,000 -
Add: Over-absorption of factory overheads in
Cost Accounts ? -
Less: Under-absorption of office and administration
overheads in Cost Accounts - 6700
Add: Over-absorption of selling and distribution
overheads in Cost A/cs ? -
Less: Goodwill written off and interest on capital
not included in Cost Accounts - 2,200
Add: Under-valuation of closing stock in Cost A/cs ?
39,700 28,700
Profit as per Profit and Loss A/c (39,700 - 28,700) - 11,000
39,700 39,700

18
Illustration 11(Do it yourself) From the following information you are required to prepare:
(i) Cost Sheet for Articles A and B.
(ii) Profit and Loss Account as per financial hooks.
(iii) Reconciliation between profit as per cost books and as per financial books.
Works overhead (Actual) 1,42,000
Office expenses (Actual) 95,700
Number of Price per Price per
Articles sold Article Rs.
A 180 1,450
B 220 1,600
There was neither opening stock nor any closing stock. Works overhead are charged
100% on labour and office overhead are charged at 25% on works cost.
Solution:
Profit & Loss Account as per Financials’ Books
Particulars Rs. Particulars Rs.
To Material communed By Sales
? ?
To Labour ?
To Works Overheads 1,42,000
To Office Overheads 95,700
To Net Profit 1,44,300
6,13,000 6,13,000
Cost Sheet
Particulars A B Total
Rs. Rs. Rs.
Material communed 36,000 48,400 84,400
Labour Cost 63,000 83,600 1,46,600
Prime Cost 99,000 1,32,000 2,31,000
Add: Works overheads @ 100% on Labour Cost ? ? ?
Works Cost 1,62,000 2,15,600 3,77,600
Add: Office overhead @ 25% on works cost ? ? ?
Cost of Goods produced/Sold ? ? ?
Profit 58,500 82 500 1,41,000
Total Sales 2,61,000 3,52,000 6,13,000

19
Reconciliation Statement
Particulars Rs.
Profit as per Cost Accounts 1,41,000
Add: Over-absorption of Works Overheads ?
Less: Under-absorption of Office Overheads ?
Profit as per Financial Accounts -1,300
1,44,300
Illustration 12 M/s Mysore petro Ltd. Showed a net loss of Rs 2,08,000 as per their financial accounts for
the year ended 31st march, 1989. The cost accounts, however, disclosed a net loss of Rs
1,64,00 for the same period. The following information was revealed as a result of the
scrutiny of the figures of both the sets of books:
Factory overhead under-recovered 3000
Administration overhead over-recovered 2000
Depreciation charged in financial accounts 60,000
Interest on investment not included in costs 10000
Depreciation recovered in costs 65000
Income-tax provided 60000
Transfer fees (in financial books) 1000
Stores adjustment (credit in financial books) 1000
Prepare a memorandum reconciliation account Solution
Memorandum Reconciliation Account ================================================================ To Net Loss as per Costing Books 1,64,000 By administration overhead Over-recovered in costs 2,000 To Factory overhead Under-recovered in costs 3000 By Depreciation over-charged In costs 5,000 To Income-tax not provided in
Costs 60,000 By interest on investment not included in costs 10,000 By Transfer fees in financial Books 1,000 By Stores adjustments 1,000 By Net loss as per financial Books 2,08,000
2,27,000 2,27,000 =============================================================================== Illustration 13
In reconciliation between cost and financial accounts, one of the areas of differences is for
different methods of stock valuation. State, with reasons, in each of the following
circumstances whether costing profit will be higher or lower than the financial profit.
20
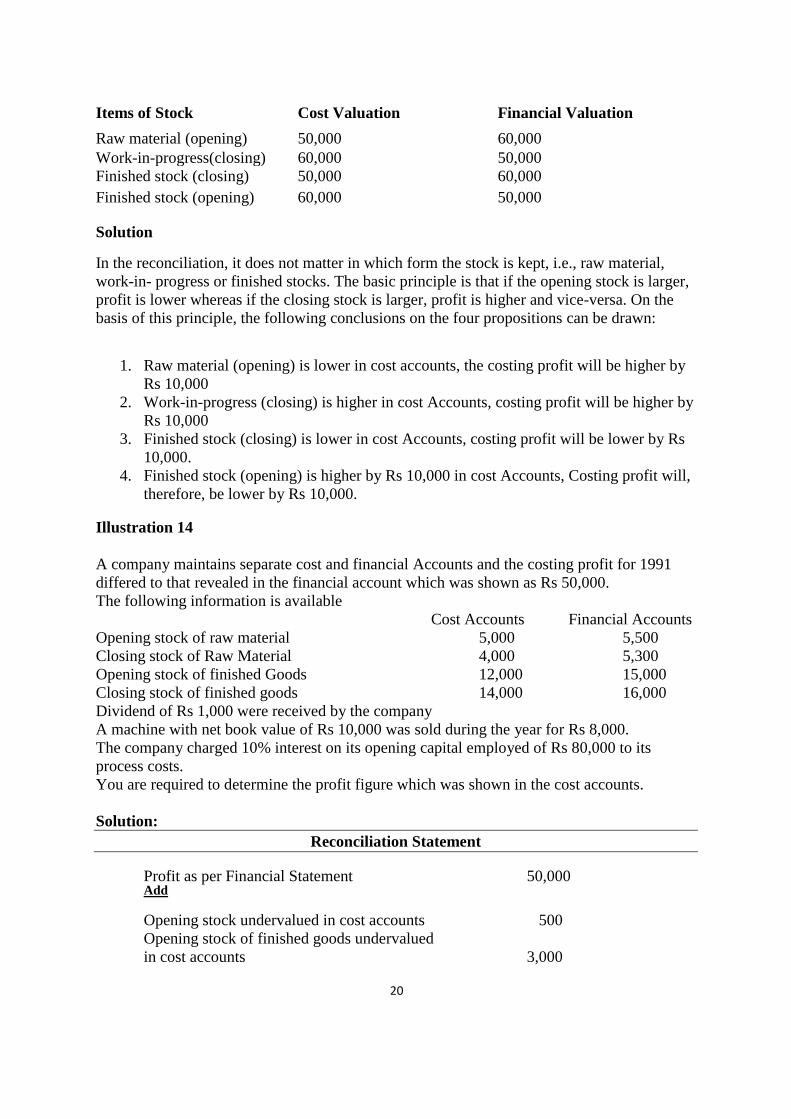
Items of Stock Cost Valuation Financial Valuation
Raw material (opening) 50,000 60,000
Work-in-progress(closing) 60,000 50,000
Finished stock (closing) 50,000 60,000
Finished stock (opening) 60,000 50,000
Solution
In the reconciliation, it does not matter in which form the stock is kept, i.e., raw material,
work-in- progress or finished stocks. The basic principle is that if the opening stock is larger,
profit is lower whereas if the closing stock is larger, profit is higher and vice-versa. On the
basis of this principle, the following conclusions on the four propositions can be drawn:
1. Raw material (opening) is lower in cost accounts, the costing profit will be higher by
Rs 10,000
2. Work-in-progress (closing) is higher in cost Accounts, costing profit will be higher by
Rs 10,000
3. Finished stock (closing) is lower in cost Accounts, costing profit will be lower by Rs
10,000.
4. Finished stock (opening) is higher by Rs 10,000 in cost Accounts, Costing profit will,
therefore, be lower by Rs 10,000.
Illustration 14
A company maintains separate cost and financial Accounts and the costing profit for 1991
differed to that revealed in the financial account which was shown as Rs 50,000.
The following information is available
Cost Accounts Financial Accounts
Opening stock of raw material 5,000 5,500
Closing stock of Raw Material 4,000 5,300
Opening stock of finished Goods 12,000 15,000
Closing stock of finished goods 14,000 16,000
Dividend of Rs 1,000 were received by the company
A machine with net book value of Rs 10,000 was sold during the year for Rs 8,000.
The company charged 10% interest on its opening capital employed of Rs 80,000 to its
process costs.
You are required to determine the profit figure which was shown in the cost accounts.
Solution:
Reconciliation Statement
Profit as per Financial Statement 50,000 Add Opening stock undervalued in cost accounts 500
Opening stock of finished goods undervalued
in cost accounts 3,000
21
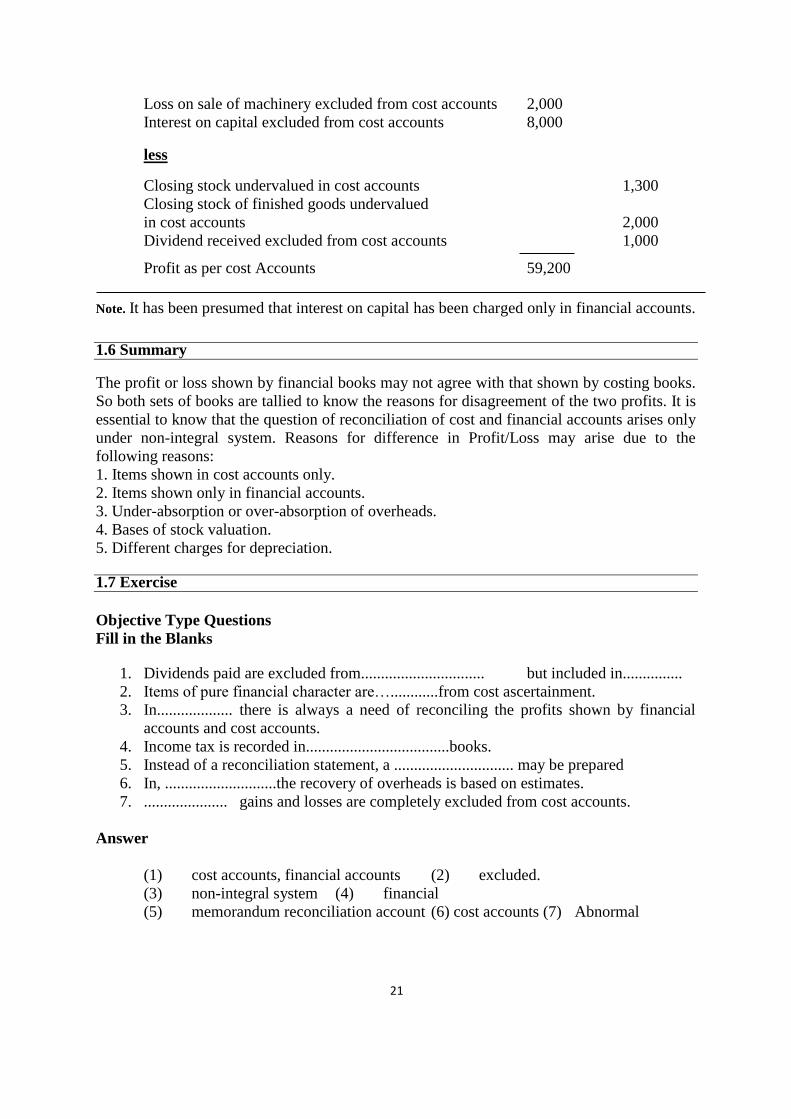
Loss on sale of machinery excluded from cost accounts 2,000
Interest on capital excluded from cost accounts 8,000
less Closing stock undervalued in cost accounts 1,300
Closing stock of finished goods undervalued
in cost accounts 2,000
Dividend received excluded from cost accounts 1,000 Profit as per cost Accounts 59,200
Note. It has been presumed that interest on capital has been charged only in financial accounts.
1.6 Summary The profit or loss shown by financial books may not agree with that shown by costing books.
So both sets of books are tallied to know the reasons for disagreement of the two profits. It is
essential to know that the question of reconciliation of cost and financial accounts arises only
under non-integral system. Reasons for difference in Profit/Loss may arise due to the
following reasons:
1. Items shown in cost accounts only.
2. Items shown only in financial accounts.
3. Under-absorption or over-absorption of overheads.
4. Bases of stock valuation.
5. Different charges for depreciation.
1.7 Exercise
Objective Type Questions
Fill in the Blanks
1. Dividends paid are excluded from............................... but included in...............
2. Items of pure financial character are…............from cost ascertainment.
3. In................... there is always a need of reconciling the profits shown by financial
accounts and cost accounts.
4. Income tax is recorded in....................................books.
5. Instead of a reconciliation statement, a .............................. may be prepared
6. In, ............................the recovery of overheads is based on estimates.
7. ..................... gains and losses are completely excluded from cost accounts.
Answer
(1) cost accounts, financial accounts (2) excluded.
(3) non-integral system (4) financial
(5) memorandum reconciliation account (6) cost accounts (7) Abnormal

22
True or False Statements
1. The requirement for reconciliation of costing profits and financial profits arises if cost accounts are maintained independent of financial accounts.
2. Income tax is provided only in financial accounts and not in cost accounts. 3. Different methods of charging depreciation are adopted in cost and financial books. 4. Rent on owned building is included in cost: accounts. 5. Purely financial incomes are included in Profit and Loss Account but are excluded
from the cost sheet. 6. Under-absorption of overheads decreases profit in costing books.
Answer
a) True
b) True. c) True d) True
e) True. f) False. Under-absorption of overheads results in more profits.
Descriptive Questions
1. What is meant by Reconciliation Statement? What is the need for Reconciliation
Statement?
2. Enumerate the items which are generally excluded from cost accounts.
3. Name any five items which are included in financial accounts but are excluded in cost
accounts.
4. Describe, in brief, the conditions which necessitate reconciliation of financial and cost
records.
5. State the steps involved in the preparation of reconciliation statement.
6. Write a note on "Memorandum Reconciliation Statement".
7. Explain the causes of difference between profit shown by Financial accounts and
profit shown by Cost Accounts.
8. Enumerate the causes of difference between profits shown by financial and cost
accounts.
9. Indicate the reasons why it is necessary for the cost and financial accounts of an
organisation to be reconciled.
10. Indicate the reasons why it is necessary for the cost and financial accounts of an
organisation to be reconciled and explain the main reasons of difference which would
enter in such accounts.
11. Write short note on items excluded from Cost Accounts.
12. Distinguish between Reconciliation Statement and Reconciliation Account.
13. Name any five items which are included in financial accounts but are not included in
cost accounts and also state the effect on the profits of cost accounts.
14. write short notes on
(a) Why we need reconciliation statement
(b) Items excluded from financial Account
(c) Items added in reconciliation statement
(d) Items less in reconciliation Statement

23
LESSON 2
RECONCILIATION OF COST AND FINANCIAL ACCOUNTS
2.0 Introduction
2.1 Objectives
2.2 Reconciliation
2.3 Profit and Loss Account as per financial books
2.4 Summary of the chapter
2.5 Exercise
2.1 Objectives
After Studying this chapter, you would be able to : Explain the reasons for difference in profit or loss as per cost and financial accounts
Know the method of preparing a reconciliation statement or a memorandum
reconciliation account.
Illustration 1.The net profit of a Manufacturing Co. Ltd. appeared at Rs. 64,377
as per financial records for the year ended 31st December, 1990. The cost books,
however, showed a net profit of Rs. 86,200 for the same period. A scrutiny of the
figures from both the sets of accounts revealed the following facts:
Rs.
Works overhead under-recovered in costs 1,560
Administration overhead over-recovered in costs 850
Depreciation charged in financial accounts 5,600
Depreciation recovered in costs 6,250
Interest on investments not included in costs 4,000
Loss due to obsolescence charged in financial accounts 2,850
Income tax provided in financial accounts 20,150
Bank interest and transfer fees in financial books 375
Stores adjustments (credit in financial books) 237
Loss due to depreciation in stock values (charged in financial 3,375
Prepare a statement showing the reconciliation between the figures of net profit
as per cost accounts and the figure of net profit shown in the financial books.
2.1 RECONCILIATION STATEMENT
RECONCILIATION STATEMENT
=============================================================
Net profit as per cost accounts 86,200
Add
Administration overhead over-recovered in costs 850
Excess depreciation charged in costs(6250-5600) 650
Interest on investment not included in costs 4,000

24
Bank interest and transfer fees 375
Stores adjustments 237
Less
Work overhead under-recovered in costs loss
Due to obsolescence not charged income-
Tax not provided 1,560
Depreciation in stock 20,150
Net profit as per Financial Records 64,377
=============================================================
RECONCILIATION WHEN COST AND/OR FINANCIAL PROFIT IS NOT GIVEN
Illustration 2
A transistor manufacturer, who commenced his business on 1st January, 1999
supplies you with the following information and asks you to prepare a statement
showing the profit per transistor sold. Wages and materials are to be charged at
actual cost, works overhead at 75% of wages and office overhead at 30% of works
cost. Number of transistors manufactured and sold during the year was 540.Other
particulars are:
Materials per set Rs. 240 Wages per set Rs. 80
Selling price per set Rs. 600
If the actual works expenses were Rs. 32,160 and office expenses were Rs. 61,800 .
Prepare a Reconciliation Statement.
Solution :
STATEMENT OF PROFIT AS PER COST ACCOUNTS
=============================================================
Materials (Rs 240x540) Rs 1,29,600
Wages (Rs 80*540) 43,200
Prime cost 1,72,800
Works overhead (75% of wages) 32,400
Works cost 2,05,200
Office overhead (30% of works cost) 61,560
Total cost 2,66,760
Profit 57,240
Sales 3,24,000
=============================================================
2.3 PROFIT AND LOSS ACCOUNT (AS PER FINANCIAL BOOKS)
Profit and Loss Account ( As per Financial Books)
=============================================================
To materials 129600 By Sales 3,24,000
To wages 43,200
To works expenses 32,160
To office expenses 61,800
To Net Profit 57,240
3,24000 3,24000
25
=============================================================
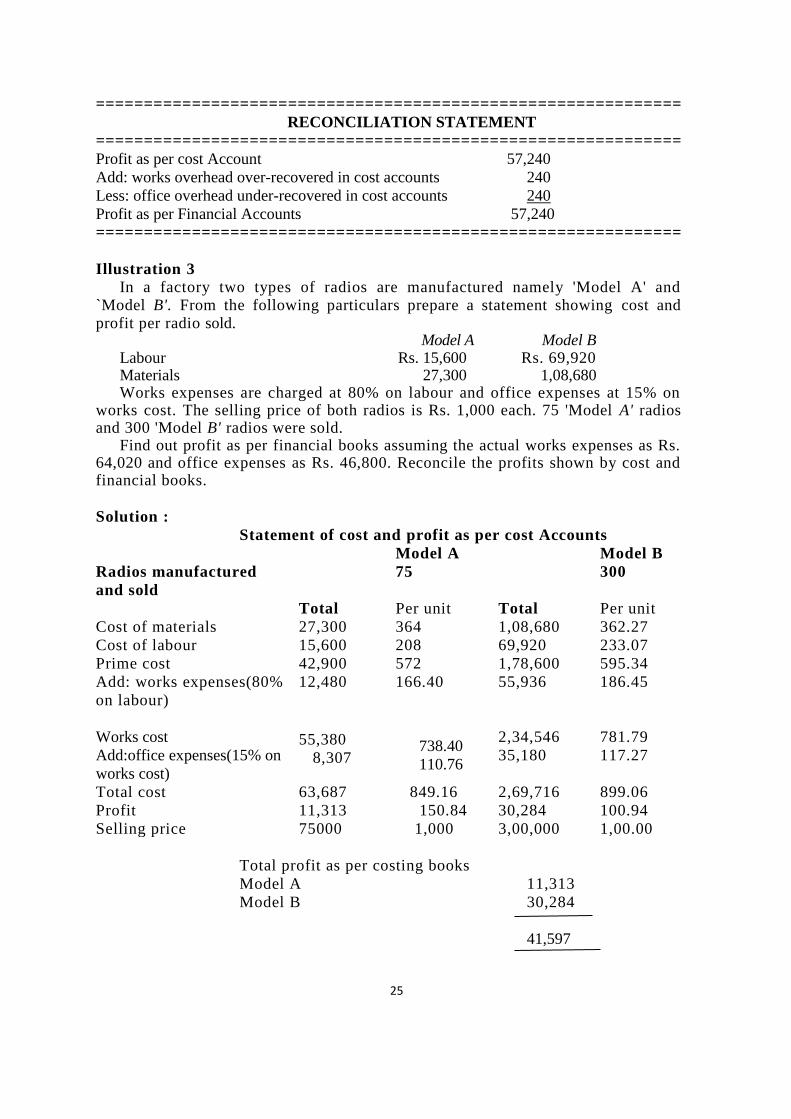
RECONCILIATION STATEMENT
=============================================================
Profit as per cost Account 57,240
Add: works overhead over-recovered in cost accounts 240
Less: office overhead under-recovered in cost accounts 240
Profit as per Financial Accounts 57,240
=============================================================
Illustration 3
In a factory two types of radios are manufactured namely 'Model A' and `Model B'. From the following particulars prepare a statement showing cost and profit per radio sold.
Model A Model B Labour Rs. 15,600 Rs. 69,920 Materials 27,300 1,08,680 Works expenses are charged at 80% on labour and office expenses at 15% on
works cost. The selling price of both radios is Rs. 1,000 each. 75 'Model A' radios and 300 'Model B' radios were sold.
Find out profit as per financial books assuming the actual works expenses as Rs. 64,020 and office expenses as Rs. 46,800. Reconcile the profits shown by cost and financial books.
Solution :
Statement of cost and profit as per cost Accounts
Model A Model B
Radios manufactured
and sold
75 300
Total Per unit Total Per unit
Cost of materials 27,300 364 1,08,680 362.27
Cost of labour 15,600 208 69,920 233.07
Prime cost
Add: works expenses(80%
on labour)
42,900
12,480
572
166.40
1,78,600
55,936
595.34
186.45
Works cost
Add:office expenses(15% on
works cost)
55,380
8,307
738.40
110.76
2,34,546
35,180
781.79
117.27
Total cost 63,687 849.16 2,69,716 899.06
Profit 11,313 150.84 30,284 100.94
Selling price 75000 1,000 3,00,000 1,00.00
Total profit as per costing books
Model A 11,313
Model B 30,284
41,597

26
Profit and Loss Account (As per financial Books)
=============================================================
To materials By sales
Model A 27,300 Model A 75,000
Model B 1,08,680 Model B 3,00,000
To Labour
Model A 15,600
Model 69,920
To work expenses 64,020
To office expenses 46,800
To Net Profit 42,680
3,75,000 3,75,000
=============================================================
RECONCILIATION STATEMENT
(+)
Profit as per Financial Accounts Rs. 42,680
Less :Works Expenses over-recovered in Costs Rs. 4,396
Add: Office Expenses under-recovered in Costs 3,313
43,993 4,396
Profit as per Cost Accounts 41,597
Working Notes :
1. Work Expenses charged in Cost
Accounts
Model A 12,480
Model B 55,936 68,416
Works Expenses charged in Financial Accounts 64,020
Works Expenses Over-recovered in Costs
4,396
2. Office Expenses charged in Financial
Accounts
46,800
Office Expenses charged in Cost Accounts
Model A 8,307
Model B 35,180 43,487
Works Expenses under-recovered in Costs.
3,313

27
Illustration 4
Mrs Piano co. which commenced business on 1 st January,1990, puts before you the
following information, and asks you to prepare a statement showing the profit per
piano sold (charge labour and material at actual cost, works overhead at 100% on
labour, and office overheads at 25% on works cost), and a statement showing a
reconciliation between the profits, as shown by the cost accounts and the profit as
shown by the profit and loss account for the year ended 31 st December, 1990.
Two grades of pianos are manufactured and are known as ‘Finis’ and ‘omega’.
There were no pianos in stock or in course of manufacture on 31 stDecember, 1990.
Average cost of materials per piano ‘Finis’ 8.000
Average cost of materials per piano ‘Omega’ 6.625
Average cost of Labour per Piano ‘Finis’ 14.625
Average cost of Labour per Piano ‘Omega’ 12.000
Finished Piano sold ‘finis’ 95
Finished Piano sold ‘Omega’ 160
Sale price per piano ‘Finis’ 60.000
Sale price per piano ‘Omega’ 45.000
Work expenses 4,200.00
Office expenses 1,555.00
You are required to prepare the necessary reconciliation statement
Solution: statement showing profit per piano sold
Particulars Finis Omega
Materials per piano 8.000 6.625
Labour per piano 14.625 12.000
Prime cost 22.625 18.625
Add: works overhead 100% on labour 14.625 12.00
Works cost 37.250 30.625
Add: office overhead 25% on
works cost 9.3125 7.65625
Total Cost 46.5625 38.28125
Profit 13.4375 6.71875
Selling price 60.0000 45.00000
=============================================================
PROFIT AND LOSS ACCOUNT FOR THE YEAR ENDED DEC. 31, 1990
=============================================================
To Material: Rs Rs By Sales Rs Rs.
‘Finis’ 760 ‘Finis’ 5,700
‘Omega’ 1,060 1,820.000 ‘Omega’ 7,200 12,900.00
To Labour:
‘Finis’ 1,389.375
‘Omega’ 1,920.000 3,309.375
To work expenses 4,200.000
To office expenses 1,555.000
To Net profit 2,015.625
------------- -------------
12,900.000 12,900.000

28
=============================================================
STATEMENT OF RECONCILIATION
=============================================================
(+) (-)
Profit as per profit and loss Account 2,015.625
Add: works overhead undercharged in cost accounts:
Works expenses 4200
Works overhead 3,309.375 890.625
Less: office overhead overcharged in cost accounts
Office overheads 2,109.688
Office expenses 1,565.000 554.688
2,906.250 554.688
Profit as per cost Accounts 2,351.562
‘finis’ Rs 13.4375 per piano on 95 pianos 1,276.562
‘Omega’ Rs 6.71875 per piano on 160 pianos 1,075.000
2,351.562
Illustration 5
The financial records by Modern Manufactures Ltd.
Reveal the following data for the year ended March 31, 1993 :
Sales (20,000 units) 4,000
Materials 1,600
Wages 800
Factory Overheads 720
Office and Administrative Overheads 416
Selling and Distribution Overheads 288
Closing Stock of Finished Goods (1,230 units) 240
Work-in-progress (Closing) Rs.
Materials 48
Labour 32
Overheads (Factory) 32 112
Goodwill written off 320
Interest on Capital 32
In the costing records, factory overhead is charged at 100% of wages,
administration overhead at 10% of works cost and selling and distribution
overhead at Rs. 16 per unit sold.
Prepare a statement reconciling the profit as per cost records with the profit as
per financial records of the company.
All workings should form part of your answer.

29
Solution :
=============================================================
STATEMENT OF PROFIT AS PER COST ACCOUNTS
=============================================================
Materials Rs. 16,00,000 Wages 8,00,000
Prime Cost 24,00,000
Factory Overheads (100% of Wages) 8,00,000
32,00,000
Less :Closing Stock of Work-in-progress 1,12,000
Works Cost 30,88,000
Add: Administration overheads(10% on works cost) 3,08,800
Cost of production(21,230 units) 33,96,800
Less: closing stock (1,230 units) 1,96,800
Cost of production of goods sold 32,00,000
Add: selling and distribution over heads @Rs 16per unit sold 3,20,000
Cost of sales 35,20,000
Profit 4,80,000
Sales 40,00,000
=============================================================
Profit and loss Account (financial Books) =============================================================
To Materials 16,00,000 By Sales 40,00,000
To Wages 8,00,000 By Closing Stock:
To Factory Overheads 7,20,000 work-in-progress 1,12,000
To Office & admin.overheads 4,16,000 finished Goods 2,40,000
To selling &dist. Overheads 2,88,000
To Goodwill written off 3,20,000
To interest on capital 32,000
To Net profit 1,76,000
43,52,000 43,52,000
=============================================================
Reconciliation Statement
=============================================================
(+) (-)
Profit as per cost Accounts 4,80,000
Add: over-absorption of factory overheads in cost account 80,000
Over-absorption of selling & dist. Ov.hds. in cost Accounts 32,000
Over-valuation of finished goods in financial Accounts 43,200
Less: un-absorption of admin. Overheads in cost Accounts 1,07,200
Goodwill written off in Financial Accounts 3,20,000
Interest on capital charged in Financial Accounts 32,000
6,35,200 4,59,200
Profit as per Financial Accounts 1,76,000
=============================================================
30
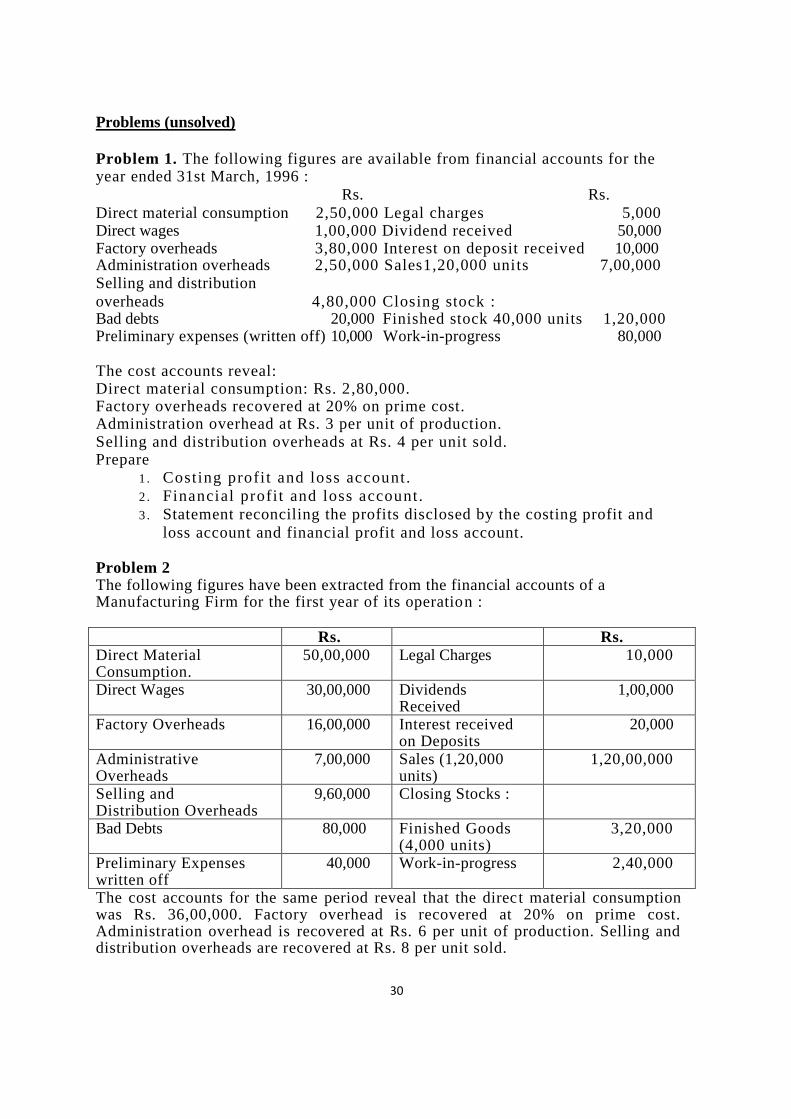
Problems (unsolved)
Problem 1. The following figures are available from financial accounts for the year ended 31st March, 1996 :
Rs. Rs.
Direct material consumption 2,50,000 Legal charges 5,000 Direct wages 1,00,000 Dividend received 50,000 Factory overheads 3,80,000 Interest on deposit received 10,000 Administration overheads 2,50,000 Sales1,20,000 units 7,00,000 Selling and distribution
overheads 4,80,000 Closing stock : Bad debts 20,000 Finished stock 40,000 units 1,20,000 Preliminary expenses (written off) 10,000 Work-in-progress 80,000 The cost accounts reveal: Direct material consumption: Rs. 2,80,000. Factory overheads recovered at 20% on prime cost. Administration overhead at Rs. 3 per unit of production. Selling and distribution overheads at Rs. 4 per unit sold. Prepare
1 . Costing profit and loss account.
2 . Financial profit and loss account.
3 . Statement reconciling the profits disclosed by the costing profit and
loss account and financial profit and loss account. Problem 2 The following figures have been extracted from the financial accounts of a Manufacturing Firm for the first year of its operation :
Rs. Rs.
Direct Material Consumption.
50,00,000 Legal Charges 10,000
Direct Wages 30,00,000 Dividends Received
1,00,000
Factory Overheads 16,00,000 Interest received on Deposits
20,000
Administrative Overheads
7,00,000 Sales (1,20,000 units)
1,20,00,000
Selling and Distribution Overheads
9,60,000 Closing Stocks :
Bad Debts 80,000 Finished Goods (4,000 units)
3,20,000
Preliminary Expenses written off
40,000 Work-in-progress 2,40,000
The cost accounts for the same period reveal that the direct material consumption was Rs. 36,00,000. Factory overhead is recovered at 20% on prime cost. Administration overhead is recovered at Rs. 6 per unit of production. Selling and distribution overheads are recovered at Rs. 8 per unit sold.

31
Prepare the Profit and Loss Accounts both as per Financial Records and as per
Cost Records. Reconcile the profits as per the two records.
Problem 3 The net profit of a company amounted to Rs. 60,412 for the year ending 31st
December, 1996, as per its financial records. The cost records, however, revealed a different figure. A scrutiny of the two sets of accounts disclosed the following facts:
(a) Works overhead recovered in Cost Accounts during the period amounted to Rs. 28,450 while the actual amount of these expenses was Rs. 21,390 only.
(b) Actual office expenses for the period were Rs. 19,850, whereas the office overhead recovered in Cost Accounts amounted to Rs. 14,500.
(c) The annual rental value of premises owned by the company, amounting to Rs: 10,800 was charged in Cost Accounts but not in Financial Accounts.
(d) Selling and Distribution expenses for the period amounting to Rs. 16,490 were excluded from costing records.
(e) Excess depreciation charged in Cost Accounts-Rs. 2,400. (f) Expenses not included in Cost Accounts and shown in Financial Accounts :
Interest of Bank Loan Rs. 1,600 Bank charges 160 Director's fees 750 Penalty due to late completion on contract 2,500
(g) Gains during the year not included in Cost Accounts Transfer fees Rs. 45 Profit on sale of investment 4,250
Interest on investments 9,450 (h) The following appropriation had been made before arriving at the profit
figure of Rs. 60,412, shown above : Transfer to Dividend Equalization Fund Rs. 10,500
Transfer to Income Tax Reserve 6,400 Transfer to Debenture Redemption Fund 9,000
(i) A sum of Rs. 10,000 given as donation to the Prime Minister's Relief Fund had been charged to-Profit and Loss Account as business expense.
Problem 4
The following information is available from the financial books of a company
having a normal production capacity of 60,000 units for the year ended 31st
March 1995 :
(i) Sales Rs. 10,00,000 (50,000 units).
(ii) There was no opening and closing stocks of finished units.
(iii) Direct material and direct wages cost were Rs.5,00,000 and Rs.2,50,000
respectively.
(iv) Actual factory expenses were Rs. 1,50,000 of which 60% are fixed.
(v) Actual administrative expenses were Rs. 45,000 which are completely
fixed.
(vi) Actual selling and distribution expenses were Rs. 30,000 of which 40% are
fixed.
(vii) Interest and dividends received Rs. 15,000.

32
You are required to :
(a) Find out profit as per financial books for the year ended 31st March, 1995;
(b) Prepare the cost sheet and ascertain the profit as per cost account for the year
ended 31st March, 1995 assuming that the indirect expenses are absorbed on the
basis of normal production capacity; and Prepare a statement reconciling
profits shown by financial and cost books.
Problem 5
The following transactions have been extracted from the financial books of
M/s Maheshwari Bros:
Rs. Units
Sales 2,50,000 20,000
Materials ' 1,00,000
Wages 50,000
Factory overheads 45,000
Office and administration overheads 26,000
Selling and distribution overheads 18,000
Closing Stock :
Finished goods 15,000 1,230
Work-in-progress:
Materials Rs. 3,000
Wages 2,000
Factory overheads 2,000 7,000
Goodwill written off 20,000
Interest on capital 2,000
In costing books factory overhead is charged at 100% on wages,
administration overhead at 10% of factory cost and selling and distribution at
the rate of Re 1 per unit sold. Prepare a statement reconciling the profit as per
cost and financial accounts.
Problem 6
From the following information
(i) determine the profit as it would be shown by cost accounts, and
(ii) prepare a statement reconciling it with profit shown by financial accounts
======================================================================
TRADING AND PROFIT AND LOSS ACCOUNT
(for the year ended 31st December, 1990)
======================================================================
Materials consumed Rs. 2,00,000 Sales (1,00,000 units) Rs. 4,00,000
Direct wages 1,00,000
Indirect expenses (works) 60,000
Office expenses 18,000
Selling and distribution
expenses 12,000
Net profit 10,000
Total 4,00,000
4,00,000

33
The normal output of the factory is 1,50,000 units. Works expenses of a fixed nature are Rs. 36,000. Office expenses are for all practical purposes constant. Selling and distribution expenses are constant to the extent of Rs. 6,000, and the balance varies directly with sales.
Problem 7: A firm of Sports Equipments commenced business on 1.4.93 for
manufacturing 2 varieties of bat, 'Senior' and `Sub-Junior'. The following information
has been extracted from the account records for the half-year period ended 30.9.1993:
Rs.
(i) Average material cost per piece of 'Senior' bat 80
(ii)Average material cost per piece of 'Sub-Junior' bat 60
(iii) Average cost of labour per piece of 'Senior' bat 140
(iv) Average cost of labour per piece of `Sub-Junior' bat 110
(v) Finished goods sold :
Senior 300 pieces
Sub-Junior 700 pieces
(vi) Sale price :
—per piece of 'Senior' bat 500
---per piece of `Sub-Junior' bat 390
(vi) Work expenses incurred during the period 1,20,000
(viii) Office expenses 68,000
You are required to prepare a statement showing
(1) The profit per each brand-piece of bat charge labour and material at
actual average cost, works on-cost at 100% on labour cost and office
cost at 25% of works cost. .
(2) Financial profit for the half-year ending 30.9.1993.
Reconciliation between profit as shown by cost accounts and financial accounts
Problem 8
A transistor manufacturer who commenced his business on 1st January, 1999
supplies you with the following information and asks you to prepare a statement
showing the profit per transistor sold. Wages and materials are to be charged at
actual cost, works overhead at 75% of wages and office overhead at 30% of works
cost. Number of transistors manufactured and sold during the year was 540.
Other particulars are:
Materials per set Rs.240
Wages per set Rs. 80
Selling price per set Rs. 600
If the actual works expenses were Rs. 32,160 and office expenses were Rs. 61,800,
prepare a Reconciliation Statement.
Problem 9
The following information is available from the financial books of a company
having a normal production capacity of 60,000 units for the year ended 31st
March 1995 :
(i) Sales Rs. 10,00,000 (50,000 units).
(it) There was no opening and closing stocks of finished units.

34
(iii) Direct material and direct wages cost were Rs. 5,00,000 and Rs.
2,50,000 respectively.
(iv) Actual factory expenses were Rs. 1,50,000 of which 60% are fixed.
(v) Actual administrative expenses were Rs. 45,000 which are completely
fixed. (vt) Actual selling and distribution expenses were Rs. 30,000 of which
40% are fixed. (vii) Interest and dividends received Rs. 15,000.
You are required to :
(a) Find out profit as per financial books for the year ended 31st March,
1995;
(b) Prepare the cost sheet and ascertain the profit as per cost account for the
year ended 31st March, 1995 assuming that the indirect expenses are
absorbed on the basis of normal production capacity; and
Prepare a statement reconciling profits shown by financial and cost books .
Problem 10
M/s Alpha Ltd. made a profit of Rs. 23,000 during the year 1990 as
per costing records, whereas their financial accounts disclosed a profit of Rs.
15,000. From the following profit and 16"ss account for the year ended 31.12.1990,
as per the financial books you are required to prepare a reconciliation statement :
RECONCILIATION OF COST AND FINANCIAL ACCOUNTS
PROFIT & LOSS ACCOUNT
Rs. Rs.
To Opening Stock 1,00,000 By Sales 1,75,000
To Purchases 80,000 By Closing Stock 80,000
To Direct Wages 20,000
To Factory Expenses 15,000
To Administration Expenses 10,000
To Selling Expenses 15,000
To Net Profit 15,000
2,55,000 2,55,000
The Costing records show the following :
(a) Stock Ledger Closing balance Rs. 89,000.
(b) Factory Overheads Rs. 13,000.
(c) Administrative overheads calculated @ 8% of the selling price.
(d) Selling expenses calculated @ 8% of the selling price.
Problem 11 During the year a company's profits have been estimated from the costing system to be Rs. 46,126, whereas the financial accounts audited by the auditors disclose a profit of Rs. 33,248. Given the following information, you are requi red to prepare a reconciliation statement showing clearly the reasons for the difference:

35
To Opening StockRs. 4,94,358 By Sales Rs. 6,93,000
To Purchases 1,64,308
6,58,666
Less :Closing Stock1,50,242 5,08,424
To Direct Wages 46,266 To Factory Overhea,d 41,652 To Gross Profit c/d 96,658
6,93,000 6,93,000
To Administration Expenses 19,690 By Gross Profit b/d 96,658
To Selling Expenses 44,352 By Sundry Income 632 To Net Profit 33,248
97,290 97,290
(a) Stock ledger closing balance is Rs. 1,56,394;
(b) Credit balance in wages control account is Rs. 49,734;
(c) Credit balance in factory overhead control account is Rs. 39,428;
(d) Administration expenses are charged to sales at 3% of selling price in cost
accounts, Selling price includes 5% (on sales) provision for selling
expenses. Sundry income is not considered in cost accounts.
Problem 12
From the following information (i) determine the profit as it would be shown by cost
accounts, and (a) prepare a statement reconciling it with profit shown by financial accounts
TRADING AND PROFIT AND LOSS ACCOUNT
(for the year ended 31st December, 1990)
Materials consumed Rs.
2,00,000
Sales (1,00,000
units) Rs. 4,00,000
Direct wages 1,00,000
Indirect expenses (works) 60,000
Office expenses 18,000
Selling and distribution
expenses 12,000
Net profit 10,000
Total 4,00,000
4,00,000
The normal output of the factory is 1,50,000 units. Works expenses of a fixed nature are Rs. 36,000. Office expenses are for all practical purposes constant. Selling and distribution expenses are constant to the extent of Rs. 6,000, and the balance varies directly with sales.
Problem 13
M/s B.K Piano Co., which commenced business on 1st January, 1990, puts
before you the following information, and asks you to prepare a statement showing
the profit per piano sold (charge labour and material at actual cost, works
overhead at 100% on labour, and office overheads at 25% on works cost), and a
statement showing a reconciliation between the profits, as shown by the cost

36
accounts and the profit as shown by the profit and loss account for the year
ended 31st December, 1990.
Two grades of pianos are manufactured and are known as 'Finis' and 'Omega'.
There were no pianos in stock or in course of manufacture on 31st December,
1990.
Average cost of materials per piano 'Finis' Rs. 8.000
Average cost of materials per piano 'Omega' 6.625
Average cost of labour per piano 'Finis' 14.625
Average cost of labour per piano `Omega' 12.000
Finished piano sold `Finis' 95
Finished piano sold 'Omega' 160
Sale price per piano 'Finis' 60.000
Sale price per piano 'Omega' 45.000
Works expenses 4,200.000
Office expenses 1,555.000
You are required to prepare the necessary reconciliation statement.
Problem 14 The net profit of a company amounted to Rs. 60,412 for the year ending 31st
December, 1996, as per its financial records. The cost records, however, revealed a different figure. A scrutiny of the two sets of accounts disclosed the following facts:
(a) Works overhead recovered in Cost Accounts during the period amounted to
Rs. 28,450 while the actual amount of these expenses was Rs. 21,390 only. (b) Actual office expenses for the period were Rs. 19,850, whereas the office
overhead recovered in Cost Accounts amounted to Rs. 14,500. (c) The annual rental value of premises owned by the company, amounting to
Rs: 10,800 was charged in Cost Accounts but not in Financial Accounts. (d) Selling and Distribution expenses for the period amounting to Rs. 16,490 were
excluded from costing records. (e) Excess depreciation charged in Cost Accounts-Rs. 2,400. (f) Expenses not included in Cost Accounts and shown in Financial Accounts :
Interest of Bank Loan Rs. 1,600 Bank charges 160 Director's fees 750 Penalty due to late completion on contract 2,500
(g)Gains during the year not included in Cost Accounts Transfer fees Rs. 45 Profit on sale of investment 4,250
Interest on investments 9,450 (h)The following appropriation had been made before arriving at the profit
figure of Rs. 60,412, shown above : Transfer to Dividend Equalization Fund Rs. 10,500
Transfer to Income Tax Reserve 6,400 Transfer to Debenture Redemption Fund 9,000
(i) A sum of Rs. 10,000 given as donation to the Prime Minister's Relief Fund had been charged to-Profit and Loss Account as business expense.
37
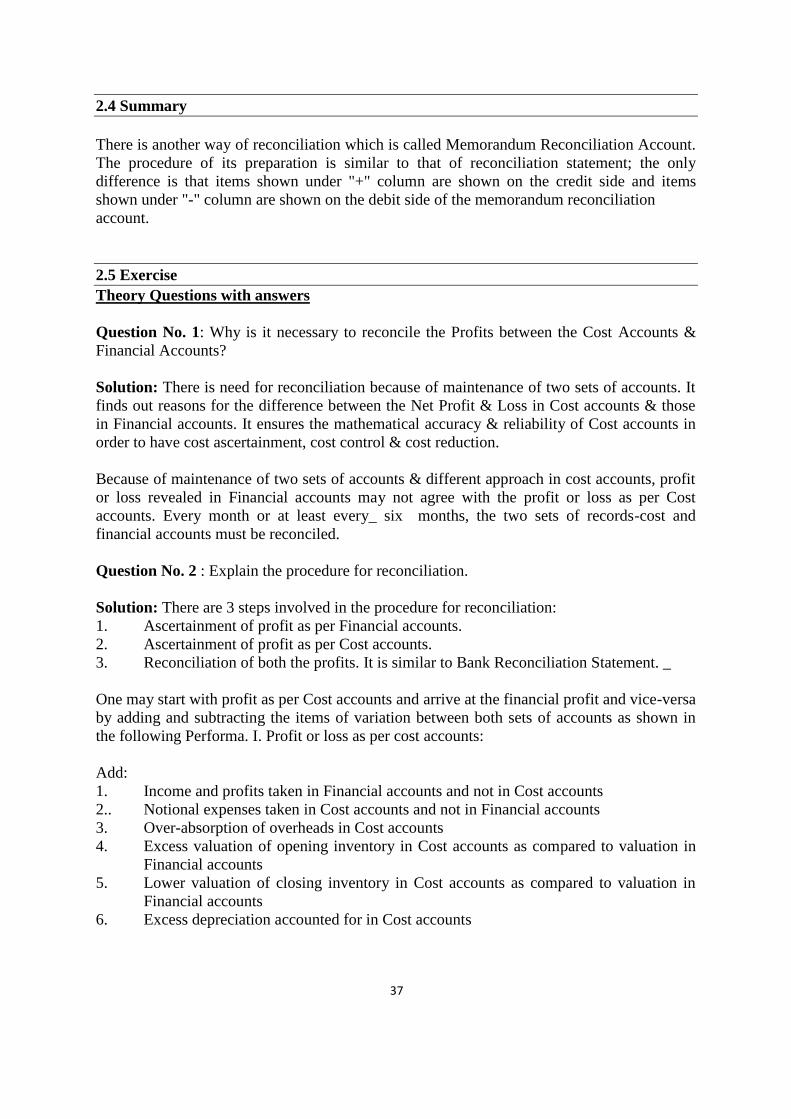
2.4 Summary
There is another way of reconciliation which is called Memorandum Reconciliation Account.
The procedure of its preparation is similar to that of reconciliation statement; the only
difference is that items shown under "+" column are shown on the credit side and items
shown under "-" column are shown on the debit side of the memorandum reconciliation
account.
2.5 Exercise
Theory Questions with answers
Question No. 1: Why is it necessary to reconcile the Profits between the Cost Accounts &
Financial Accounts?
Solution: There is need for reconciliation because of maintenance of two sets of accounts. It
finds out reasons for the difference between the Net Profit & Loss in Cost accounts & those
in Financial accounts. It ensures the mathematical accuracy & reliability of Cost accounts in
order to have cost ascertainment, cost control & cost reduction.
Because of maintenance of two sets of accounts & different approach in cost accounts, profit
or loss revealed in Financial accounts may not agree with the profit or loss as per Cost
accounts. Every month or at least every_ six months, the two sets of records-cost and
financial accounts must be reconciled.
Question No. 2 : Explain the procedure for reconciliation.
Solution: There are 3 steps involved in the procedure for reconciliation:
1. Ascertainment of profit as per Financial accounts.
2. Ascertainment of profit as per Cost accounts.
3. Reconciliation of both the profits. It is similar to Bank Reconciliation Statement. _
One may start with profit as per Cost accounts and arrive at the financial profit and vice-versa
by adding and subtracting the items of variation between both sets of accounts as shown in
the following Performa. I. Profit or loss as per cost accounts:
Add:
1. Income and profits taken in Financial accounts and not in Cost accounts
2.. Notional expenses taken in Cost accounts and not in Financial accounts
3. Over-absorption of overheads in Cost accounts
4. Excess valuation of opening inventory in Cost accounts as compared to valuation in
Financial accounts
5. Lower valuation of closing inventory in Cost accounts as compared to valuation in
Financial accounts
6. Excess depreciation accounted for in Cost accounts

38
Less:
7. Expenses and Losses accounted for in Financial accounts sand not in Cost accounts
8. Appropriations in Financial accounts only
9. Notional income taken in Cost accounts and not in Financial accounts
10. Under-absorption of overheads in Cost accounts
11. Lower valuation of opening inventory in Cost accounts as compared to valuation in
Financial accounts
12. Higher valuation of closing inventory in Cost accounts as compared to valuation in
Financial accounts
13. Lower depreciation accounted for in Cost accounts
Profit or loss as per Financial accounts
Note-Inventory includes raw materials, stores, spares, work-in-progress, stock of finished
goods etc. U. Profit as per Financial Accounts Add-Items 7 to 13 as mentioned above Less-
Items 1 to 6 as mentioned above Prof it or loss as per Cost accounts
Memorandum Reconciliation account: Alternatively, reconciliation may be affected by
Memorandum Reconciliation account also. The profit as per Cost accounts is credited to this
account. Items 1 to 6 which are to be added are entered on the credit side A items 7 to 13
which are to be deducted are debited to this account.
Question No. 3: What are the reasons for disagreement of Profits as per financial accounts &
cost Accounts? Discuss.
or
List the Financial expenses which are not included in cost
Solution: Reasons for difference between Profits shown in Cost accounts & those shown in
Financial accounts.
1. Items included in Financial Accounts-only
(a) Purely financial expenses:
(i) Interest on loans, bank mortgages.
(ii) Expenses & discounts on issue of shares, debentures etc.
(iii) Losses on sale of fixed assets & investments.
(iv) Other capital losses i.e., loss by fire not covered by insurance etc.
(v) Fines & penalties.
(vi) Stamp duty & expenses on transfer of shares.
(vii) Goodwill written off.
(viii) Preliminary expenses written off.
(ix) Donations & Subscriptions etc.
(x) Income Tax.
(xi) Underwriting commission written ff.
(xii) Cash Discount allowed to customers.
(b) Purely financial Income:
(i) Interest received on bank deposits, loans & investments.
(ii) Dividends received.

39
(iii) Profit on sale of fixed assets & investments.
(iv) Rents receivable.
(v) Fees received on issue & transfer of shares.
(vi) Profit on sale of shares.
(c) Appropriations of Profits:
(i) Dividends.
(ii) Transfer to reserves.
2. Items included in cost accounts only: These are notional charges called as imputed
costs/opportunity costs.
(a) Interest on capital at notional figure though not incurred. -
(b) Salary of owner manager at notional figure though not incurred.
(c) Notional rent of own building.
(d) Notional Depreciation on the asset fully depreciated for which book value is
nil.
3. Under or over-absorption of overheads, if transferred to next year's accounts: If the
under or over-absorption of overheads is transferred to next year's accounts. Profit or
losses in both sets of accounts may vary as
There will be difference between the overhead actually incurred in financial
accounts & overhead absorbed in cost accounts of a particular period. In other case
i.e., if it is transferred to same year's costing P&L A/c & if it is adjusted by
application of supplementary overhead rate, profit or losses of both sets of accounts
may not differ to this extent.
4. Different basis of stock valuation: In Financial accounts, stock may be valued at the
FIFO, Weighted Average or specific identification method whereas in Cost accounts,
the value of stock in hand may differ depending on the method followed for pricing of
material issues i.e., Simple Average, Specific identification, LIFO, HIFO, FIFO,
Weighted Average etc, resulting in different values of inventories in both these sets of
accounts:-
Valuation of work-in-progress (WTP) may be at prime cost or at prime cost + Factory
overhead & different basis may be used in valuing inventory of WIP in Cost &
Financial accounts. Similarly finished goods may be valued at prime cost ? Factory
overhead + Administration overhead i.e.. Cost of Production in Cost accounts and at
prime cost + Factory overhead in Financial accounts.
5. Different methods of charging depreciation: In Financial accounts, depreciation may
be calculated on the basis of straight line method (SLM) or written down value
(WDV) method etc whereas in Cost accounts, depreciation may be calculated on the
basis of machine hours or production units.
Question No. 4: "Is reconciliation of cost accounts and financial accounts necessary in case
of integrated accounting system?'
Solution: Integrated Accounting is the-name given to a system of accounting whereby cost
and financial accounts are kept in the same set of books. Such a system will have to afford

40
full information required for Costing as well as for Financial Accounts. In other words",
information and data Should be recorded in such a way so as to enable the firm to ascertain
the cost together with the necessary analysis of each product, job, process, operation or any
other identifiable activity.
The integrated accounts give full information in such a manner so that the profit and loss
account and the balance sheet can be prepared according to the requirements of law and the
management maintains full control over the liabilities, and assets of its business.
While non-integrated system of accounting necessitates reconciliation between financial and
cost accounts, no reconciliation between two sets of accounts is required under integrated
accounting.
Question No. 5 : "Reconciliation of cost & financial accounts in the modern computer age is
redundant."
Solution: In the modern computer age the use of computer knowledge and accounting
software has helped the field of Financial and Cost Accounting in a big way. In fact,
computers work at a very high speed and can process voluminous data for generating desired
output in no time. Output produced is precise and accurate. Computers can work for hours
without any fatigue. They can bring out different Financial Accounting Statements A reports
accurately in a presentable form. Financial accounts and Cost accounts show their results
accurately and precisely, when maintained on a computer system, but the profit shown by one
set of books may not agree with that of the other set.
Hence, the above statement is not correct & still reconciliation of financial & cost records is
impatient as both of records may differ.

41
LESSON 3
BUDGETARY CONTROL
3.0 Introduction
3.1 Objectives
3.2 Budget
2.2.1 Meaning
2.2.2 Definition of Budget
2.2.3 Characteristics
3.3 Budgeting
3.3.1 Meaning
3.3.2 Definition of Budgeting
3.3.3 Characteristics
3.3.4 Necessities of Budgeting
3.4 Budgetary Control
3.4.1 Definitions
3.4.2 Steps in the process of Budgetary Control System
3.4.3 Features
3.4.4 Objectives of Budgetary control
3.4.5 Advantages of Budgetary Control
3.4.6 Limitations of Budgetary Control
3.5 Fixed Budget and Flexible budget
3.6 Limitations of Fixed Budget and Flexible budget
3.7 Flexible Budget
3.7.1 Steps in preparing a flexible budget
3.7.2 Features
3.7.3 Benefits
3.8 Distinction between Distinction between Fixed & flexible budget
3.9 Summary of the chapter
3.10 Exercise
3.1 Objectives
After studying this chapter, students would be able to:
• Understand Budgeting- Meaning, Definition of Budgeting, characteristics &
Necessities of Budgeting
• Understand Budgetary Control-Definitions
• Understand Steps in the process of Budgetary Control System
• Understand Features and Objectives of Budgetary control
• Understand Advantages of Budgetary Control and Limitations of Budgetary Control
• Understand fixed Budget and Flexible budget and Limitations
• Understand Flexible Budget
--Steps in preparing a flexible budget
--Features
--Benefits • Distinction between Fixed & flexible budget

42
3.2 Budgetary Control
Planning is the basic step for good management because it involves observing systematically at
the future. Monetary planning plays an important role in all the spheres of activities. Whether
it is household or business or government, planning is the first basic exercise to carry out
before venturing out for any activity. Financial budgets help managers in developing
financial plan to guide them in allocating their resources over a specific future period.
Budgeting is the most commonly management used tool of planning and controlling cost.
Control is the process of measuring and correcting actual performance to ensure that plans for
implementing the chosen course of action are carried out.
3.2.1 Meaning
The word ‘budget’ is derived from a French term “bougette” denoting a leather pouch in
which money is put in order to meet expected expenses.
Budget is a plan relating which is expressed in monetary and/ or quantitative terms for a
definite future period of time in relative to commercial aspect; a budget is a formal
expression of the expected incomes and expenditures for a definite future period.
3.2.2 Definition of Budget
"A budget is a pre-determined statement of management policy during a given period which
provides a standard for comparison with the results actually achieved." Brown and Howard
“Budget is an estimate of future needs arranged according to an orderly basis covering
some or all the activities of an enterprise for definite period of time.” George R. Terry
The Chartered Institute of Management Accountants (C.I.M.A.) London, has defined a
budget as "a financial and/or quantitative statement, prepared prior to a defined period of time, of
the policy to be pursued during that period for the purpose of attaining a given objective. ' It may
include income, expenditure and employment of capital.
3.2.3 Characteristics
1. A budget is prepared in advance. Planning precedes an action.
2. A budget is prepared either in monetary or quantitative terms or both.
3. A budget i s prepared for a def in i te future per iod .
4. A budget is a coordinated plan. Budgets are prepared for different divisions/activities
of an enterprise so as to take care of the situations and problems facing each division.
3.3 Budgeting
3.3.1 Meaning & Definition of Budgeting
Budgeting is a process undertaken by organizations to manage money in the most effective
way that facilitates the organizations to meet their financial goals and dreams. It is a means of
finding out how much the organisation would earn and how much should it spend. Thus, it is
an art of building budgets and using them for future planning, coordinating and control
43
purposes. In short, it is the process of preparing a detailed statement of financial applications
and results that are likely to happen in a future period of time.
3.3.2 Definitions
“Budgeting may be said to be the act of building budget.” Rowland & Hary
“The entire process of preparing the budget is known as budgeting.” Batty
Thus budgeting involves studying the business situations, understanding the management
objectives and also the capacity of the enterprise. Budgeting is a planning function while its
implementation is a control function. 3.3.3 Characteristics
• It is the process of allocation of resources within different activities, processes,
departments and levels etc.
• It is a method of planning keeping future aspects in mind.
• Its main objective is fixation and achievement of goals for different parts of the
organization.
• It tries to solve various problems that may arise in future.
It is a method of planning keeping future aspects in mind. b. It tries to solve various
problems that may arise in future. c. It is the process of allocation of resources within
different activities, processes, departments and levels etc. d. Its main objective is fixation and
achievement of goals for different parts of the organization and the organization as a whole.
3.3.4 Necessities of Budgeting
1. Realistic goals. The budget goals should be realistic and almost attainable. The
responsible executives should do a lot of effort before preparing budget.
2. Maximum profits. Budget should be made to get maximum profits.
3. Involvement of executives. Those entrusted with the performance of the budgets should contribute in the process of setting the budget. This will make sure proper implementation of budget programmes.
4. Clearly defined responsibility centres-well defined responsibility centres should be
built up within the organisation to derive maximum benefits from the budget system,.
The controllable costs for each responsibility centres should be separately shown.
5. Integration with standard costing system. Where standard costing system is also
used, it should be completely integrated with the budget programme, in respect of
both budget preparation and variance analysis.
6. Cost of the system. The cost of budget system should not be more than the benefit
of it. Since, it is not practicable to calculate exactly what a budget system is worth, it
only implies a caution against adding expensive refinements unless their value
clearly justifies them.

44
7. Support of top Management. Support of the top management required to implement
the budget system is successfully. No control system can be effective unless the
organisation is convinced that the top management considers the system to be
important. Since the top management must be committed to the budget idea as well as
to the principles, policies and philosophy underlying the system.
3.4 Budgetary Control
3.4.1 Definitions
According to C.I.M.A., London, '"Budgetary control is the establishment of budgets relating to the responsibilities of executives of a policy and the continuous comparison of the actual with the budgeted results, either to secure by individual action the objective of the policy or provide a basis for its revision." "Budgetary control system is a system of controlling costs which includes the preparation of budgets, co-ordinating the departments and establishing achieve maximum profitability"
- Brown and Howard
3.4.2 Steps in the process of Budgetary Control System
A budgetary control system has the following characteristics
1. Establishment of budgets - Budgets are prepared for each department and then
they are presented to the management for approval.
2. Coordination among departments– The plans of various departments are
coordinated and finally integrated into the master budget.
3. Comparison– Under budgetary control, the actual performance is compared with
The budgetary estimates on a continuous basis to discover the variations and fix
responsibilities.
4. Revision – The budgets are revised in the light of changes in the conditions and
Circumstances.
3.4.3 Features
1. The efficiency of budgetary control depends on how correctly estimates have been made
about future.
2. Budgetary control involves comparison of actual results with budgetary standards.
3. Budgetary control is a persistent activity. Managers at all levels need to participate in the
budgetary control.
4. Budgetary control focuses on specific and time-bound goals.
5. Budgetary control is a continuous exercise. A budgeted plan is framed, it is implemented, it
is compared with actual results, it is revised and followed by another plan.
3.4.4 Objectives of Budgetary Control
The following are the main objectives of a budgetary control system.
45
1. Planning. A budget offers a detailed plan of action for a business over a definite period
of time. Plans are drawn up relating to production, sales, raw material requirements,
labour needs, advertising and sales promotion performance, research and development
activities, capital additions, etc.
2. Co-ordination.-It helps managers in co-ordinating their efforts so that objectives of the
organisation as a whole harmonise with the objectives of its divisions. There should be co-
ordination in the budgets of various departments. For example, the budget of sales should
be in co-ordination with the budget of production. Similarly, the production budget
should be prepared in co-ordination with the purchase budget, and so on.
3. Communication- It is a communication device. The agreed budget copies are circulated to
all management personnel who provide not only adequate understanding and knowledge
of the programmes and policies to be followed but also alerts about the restrictions to be
adhered to.
4. Motivation. A budget is a useful device for motivating managers to perform. If personnel have actively participated in the preparation of budgets, it acts as a strong motivating force to achieve the targets.
5. Control. Control is necessary to ensure that plans and objectives as laid down in the budgets are being achieved
3.4.5 Advantages of Budgetary Control
1. A budget motivates executives to attain the given goals.
2. Budgeting co-ordinates the activities of various departments and functions of the business.
3. It shows management where action is needed to remedy a situation.
4. It increases production efficiency, eliminates waste and controls the costs.
5. Budgetary control aims at maximisation of profits through careful planning and control
6. Budgeting compels managers to think ahead-to anticipate and prepare for changing
conditions.
7. It provides a yardstick against which actual results can be compared.
3.4.6 Limitations of Budgetary Control
1. Since budgets are based on the estimates of future and future is uncertain, so the budgets
may or may not be true.
2. Budgets cannot be executed automatically. Thus it may provide a false sense of security.
3. When the staff co-operation is not available, the whole budgetary control exercise will be
waste.
4. Introducing and implementing the budgetary control system is an expensive exercise.
Sometimes it may happen that the cost of introducing and operating a budgetary control
system exceeds the benefits derived there from.
5. Budgets are considered to be rigid documents. Therefore budgets should be thoroughly
revised with the change in the circumstances.
3.5 Fixed budget and Flexible budget
On the basis of level of activity or capacity, budgets are classified into fixed budget and
flexible budget.
46
A fixed budget means a budget which is prepared for fixed level of activity. It is defined as a
fixed budget is a budget designed to remain unchanged irrespective of the level of activity
attained. A fixed budget has following characteristics:
• A fixed budget is a rigid budget.
• It is suitable for the conditions when output and sales can be estimated with a fair
degree of accuracy. It means where sales and output cannot be accurately estimated,
fixed budget does not suit.
• A fixed budget is geared towards a single level of activity,
Fixed budget is also known as "Static" or "Rigid' budget. A fixed budget does not take into
consideration any change in the level of activity,
3.6 Limitations
1. Preparation of fixed budget does not involve detailed analysis of costs into fixed,
variable and semi-variable costs.
2. It cannot be used for price fixation and cost ascertainment.
3. As a tool of cost control, it is ineffective if the level of activity attained is different
from the level of budgeted activity. Generally actual level of activity is different from
budgeted level of activity.
4. Fixed budget does not suit in the situations where sales and output cannot be
accurately estimated.
3.7 Flexible Budget
A flexible budget is designed to change in relation to the change in the level of activity. In
this budget, a series of budgets are prepared at different levels of activity. It can be prepared
for different levels of activity, like 60%, 70%, 80% etc. It is useful for cost control, cost
ascertainment and performance appraisal for the tenders and quotations.
CIMA London defines a flexible budget as a budget which is designed to change in
relation to the level of activity attained:"
3.7.1 Steps
Following are the basic steps in preparing a flexible budget:
(i) The first step is to determine the relevant range over which activity is expected to
fluctuate during the budget period.
(ii.) Next step is to analyse the costs that will be incurred over the relevant range in terms
of determining cost behaviour.
(iii) Now all the costs are classified into fixed, variable and semi-variable costs.
(iv) Semi-variable costs are segregated into fixed component and variable component.
Variable component of semi-variable cost is calculated by using following
formula:

47
Variable Component of Semi-Variable Cost per unit
Change in Semi-variable Cost
Change in Output
On the basis of variable component per unit, variable component of semi-variable
cost is calculated as under:
Variable Component = Variable Component per unit
x No. of units at a production level
Now fixed component of semi-variable cost is calculated as under: Fixed
Component ---- Semi-variable Cost
— Variable Component
(v) Finally various elements of cost are ascertained for various levels of activity.
3.7.2 Features
Flexible budget has following features:
(i) A flexible budget does not confine itself to a single level of activity but is geared
towards a range of activity. A flexible budget can complied for any level of
activity say 50%, 60%„ 70% or 100% capacity utilisation.
(ii) A flexible budget is dynamic in nature rather than static.
(iii) A flexible budget is prepared after making an intelligent classification of all expenses
between fixed, semi-variable and variable expenses.
3.7.3 Benefits
Flexible budget is prepared in such a way so as to present the budgeted cost for different levels of
activity. Flexible budget is more realistic and practical because changes expected at
different levels of activity are given due consideration. Following are the main, advantages
of a flexible budget:
(i) A flexible budget makes it possible to establish budgeted cost for any level of activity
within the relevant range even after the period. 's activity is over.
(ii) A flexible budget is helpful in assessing the performance of departmental
heads because their performance can be judged in relation to the level of
activity attained. Flexible budget is a readymade comparison for cost control,
(iii) Flexible budget makes it possible to ascertain the cost at various levels of activity.
Flexible budget is helpful in price fixation and sending quotations.
(iv) Flexible budget assists in evaluating the effects of varying volumes of activities on profits
and on cash position. Flexible budget facilitates production planning as well as profit
planning.
(v) Flexible budget helps in controlling overheads.
Following are the situations where flexible budget proves its worth in decision-making:
48
(i) Where the industry is subject to sudden changes in fashion, designs, tastes and
consumer preferences.
(ii) Where overall business is highly dynamic and fast changing.
(iii) Where consumer profile, product profile and technology are fast changing.
(iv) Where the company frequently introduces new products.
(v) Where large part of output is meant for export.
3.8 Distinction between fixed budget and flexible budget
Following table shows the distinction between fixed budget and flexible budget:
Basis of distinction Fixed Budget Flexible Budget
Assumption It assumes that business
conditions are static.
It assumes that business Conditions are dynamic. '
Level of activity It is prepared for only one
level of activity.
It is prepared for different
Levels of activity.
Flexibility It does not change with the
actual volume of output
achieved.
It is re-casted quickly
according to actual level of
activity.
cost. Classification
of Costs
It does not require Classification of costs.
It requires classification of costs
into fixed cost, semi-variable cost
and variable cost.
C o m p a r i s o n Comparison between actual
costs and budgeted costs can
not be made if the volume of
output differs. It is of limited
use for control.
Comparison between actual
costs and budgeted costs can
be made. It is useful forecast
control and performance
evaluation.
Illustration 1 ABC Ltd. prepares a flexible budget which revealed that the cost of production is of ' 79000
at an anticipated 10000 unit's activity level. Variable production costs were
Direct Material (per unit) 1.50
Direct labour (per unit) 3.50
Variable Factory Overheads (per unit) 0.75
How much is the total production cost for an activity level of 10800 units
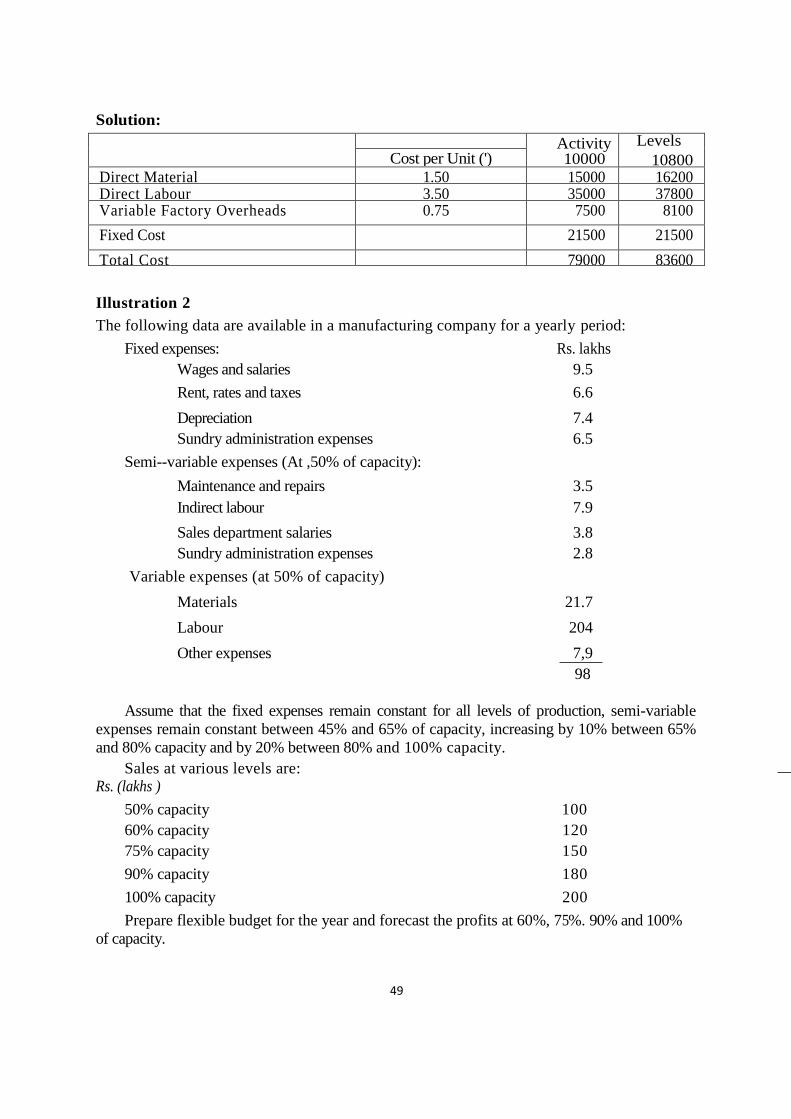
49
Solution: Activity
10000
Levels
10800 Cost per Unit (')
Direct Material 1.50 15000 16200 Direct Labour 3.50 35000 37800 Variable Factory Overheads 0.75 7500 8100
Fixed Cost 21500 21500
Total Cost 79000 83600 Illustration 2
The following data are available in a manufacturing company for a yearly period:
Fixed expenses: Rs. lakhs
Wages and salaries 9.5
Rent, rates and taxes 6.6
Depreciation 7.4
Sundry administration expenses 6.5
Semi--variable expenses (At ,50% of capacity):
Maintenance and repairs 3.5
Indirect labour 7.9
Sales department salaries 3.8
Sundry administration expenses 2.8
Variable expenses (at 50% of capacity)
Materials 21.7
Labour 204
Other expenses 7,9
98
Assume that the fixed expenses remain constant for all levels of production, semi-variable
expenses remain constant between 45% and 65% of capacity, increasing by 10% between 65%
and 80% capacity and by 20% between 80% and 100% capacity.
Sales at various levels are: Rs. (lakhs )
50% capacity 100
60% capacity 120
75% capacity 150
90% capacity 180
100% capacity 200
Prepare flexible budget for the year and forecast the profits at 60%, 75%. 90% and 100%
of capacity.

50
Solution
Flexible Budget for the year
Particulars
50%
Capacity
60%
Capacity
75%
Capacity 90%
Capacity
100%
Capacity
Rs. (lacs) Rs. (lacs) Rs. (lacs) Rs. (lacs) Rs. (lacs)
(A) Sales 100.00 120.00 150.00 180.00 200.00
Variable Costs
Materials 21.70 26.04 32.55 39.06 43.40 Labour 20.40 24.48 30.60 36.72 40.80 Other Expenses 7.90 9.48 11.85 14.22 15.80
(B) Total Variable Expen. 50.00 60.00 75.00 90.00 100.00
Semi-Variable Exp.
Maintenance & Repairs 3.50 3.50 3.85 4.20 4.20 Indirect Labour 7.90 7.90 8.69 9.48 9.48 Sales Deptt. Salaries 3.80 3.80 4.18 4.56 4.56 Sundry Adm. Exp. 2.80 2.80 3.08 3.36 3.36
(C) Total Semi-Variable
Exp. 18.00 18.00 19.80 21.60 21.60
Fixed Expenses
Wages & Salaries 9.50 9.50 9.50 9.50 9.50 Rent, rates & taxes 6.60 6.60 6.60 6.60 6.60 Depreciation 7.40 7.40 7.40 7.40 7.40 Sundry Adm. Exp. 6.50 6.50 6.50 6.50 6.50
Total Fixed Expenses 30.00 30.00 30.00 30.00 30.00
(0) Total Cost (B + C + 0) 98.00 108.00 124.80 141.60 151.60
PROFIT (A -- E) 2.00 12.00 25.20 38.40 48.40 , Illustration 3 XYZ Ltd. has its annual budget for the year ending 31-3-2013 on the basis of 40% capacity utilization. Given below is the summarized budget for the period:
Amount (in lacs)
I. Sales 600 II. Direct Material 125
Direct Labour 125
Direct Expenses 50
III. Semi-Variable Expenses
Repairs & Maintenance 50 Indirect Labour 25 Supervision 25 Heating & Lighting 10
IV. Fixed Expenses
Salaries–Managers 15
Rents, Rates &Taxes 15
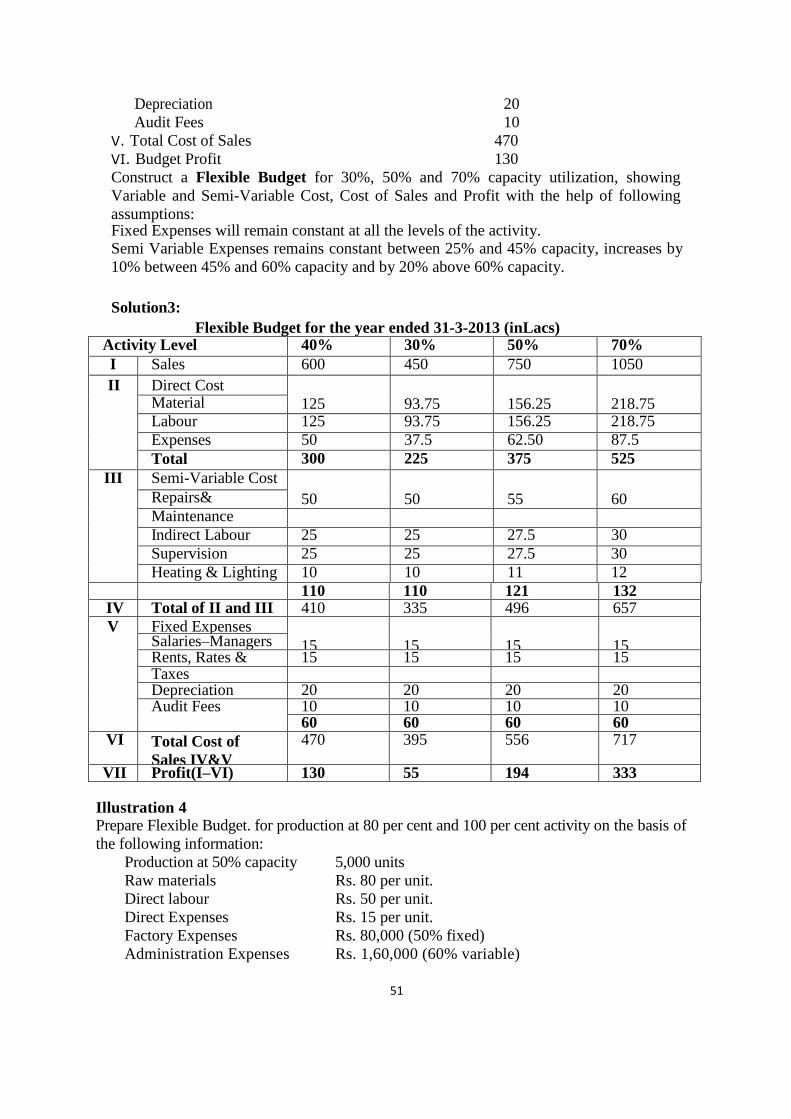
51
Depreciation 20
Audit Fees 10
V. Total Cost of Sales 470
VI. Budget Profit 130
Construct a Flexible Budget for 30%, 50% and 70% capacity utilization, showing
Variable and Semi-Variable Cost, Cost of Sales and Profit with the help of following
assumptions: Fixed Expenses will remain constant at all the levels of the activity. Semi Variable Expenses remains constant between 25% and 45% capacity, increases by
10% between 45% and 60% capacity and by 20% above 60% capacity.
Solution3:
Flexible Budget for the year ended 31-3-2013 (inLacs) Activity Level 40% 30% 50% 70%
I Sales 600 450 750 1050
II Direct Cost
125
93.75
156.25
218.75 Material
Labour 125 93.75 156.25 218.75
Expenses 50 37.5 62.50 87.5
Total 300 225 375 525
III Semi-Variable Cost
50
50
55
60 Repairs&
Maintenance Indirect Labour 25 25 27.5 30
Supervision 25 25 27.5 30
Heating & Lighting 10 10 11 12
110 110 121 132 IV Total of II and III 410 335 496 657
V Fixed Expenses
15
15
15
15 Salaries–Managers Rents, Rates & 15 15 15 15 Taxes Depreciation 20 20 20 20 Audit Fees 10 10 10 10
60 60 60 60 VI Total Cost of
Sales IV&V
470 395 556 717
VII Profit(I–VI) 130 55 194 333
Illustration 4 Prepare Flexible Budget. for production at 80 per cent and 100 per cent activity on the basis of
the following information:
Production at 50% capacity 5,000 units
Raw materials Rs. 80 per unit.
Direct labour Rs. 50 per unit.
Direct Expenses Rs. 15 per unit.
Factory Expenses Rs. 80,000 (50% fixed)
Administration Expenses Rs. 1,60,000 (60% variable)

52
Solution
Statement of Budgeted Cost (Flexible Budget)
Particulars 80%Capacity 8000 units
100% Capacity 10,000units
Total
Rs.
Per Unit
Rs. Total
Rs.
Per Unit
Rs.
Raw Materials 6,40,000 80 8,00,000 80
Direct Labour 4,00,000 50 5,00,000 50
Direct Expenses 1,20,000 15 1,50,000 15
Factory Expenses
— Fixed 40,000 5 40,000
— Variable 64,000 8 80,000 8
Administration Expenses
— Fixed 64,000 8 64,000 6.4
— Variable 1,28,000 16 1,60,000 16
14,56,000 182 17,94,000 179.4
Illustration 5
Production costs of Oriental Enterprises Limited are as follows:
Level of Activity
60% 70% 80% Output (units) 1200 1400 1600
Costs (Rs.):
Direct materials 24000 28000 32000
Direct labour 7200 8400 9600
Factory overheads 12,800 13,600 14,400
Works cost 44,000 50,000 56,000
A proposal to increase production to 90% level of activity is under the consideration of
management. The proposal is not expected to involve any increase in fixed factory
overheads.
Prepare a statement showing the prime cost, total marginal cost and total factory cost at
60%, 70%, 80% and 90% activity levels.

53
Solution (try to find yourself)
Statement -Showing Costs at Various Levels of Activities Level of Activity
Output (in units)
Direct material
Direct labour
Prime Cost
Variable factory overhead
Marginal Cost
Fixed factory overhead
Factory Cost
Working note:
Factory overhead is a semi-variable cost.
Variable component of factory overhead will be calculated as under:
Variable Component per unit = Change in Cost
Change in Output
13,600-12,800
1,400-1,200
Rs. 4
Fixed Component of Factory Overhead = 12,800 - (1,200 x 4)
= Rs. 8,000
Illustration 6
You are required to draw a flexible budget for overhead expenses on the following data at
70%, 80% and 90% plant capacity.
Variable overheads:
At 70%
Capacity
At 80% At 90%. Capacity LCapacity
Rs. Rs. Re.
Indirect labour - 12,000 -
Stores including spares - 4,000 -
Semi-variable overhead
Power (30% fixed, 70% variable) - 20,000 -
Repairs and maintenance (60% fixed
40% variable) - 2,000 -
Fixed overheads
Depreciation - 11,000 --
Insurance - 3,000 -
Salaries - 10,000 -
Total overheads 62,000 _

54
Solution
Flexible budget for the period…………
Particulars ,
At 70% At 80%
Capacity Capacity
Ri At 90% Capacity i .
Variable overheads: Rs. Rs. R s .
Indirect labour 10,500 12,000 13,500
Stores including spares 3,500 4,000 4,500
Semi-variable overheads:
Power—Fixed 6,000 6,000 6,000
Variable 12,250 14,000 15,750
Repairs and maintenance—Fixed
Variable
1200 700
1200 800
1200 900
Fixed overheads:
Depreciation 11000 11,000 11,000
Insurance 3,000 3,000 3,000
Salaries 10,000 10,000 10,000
Total overheads 58,150 62,000 62,850
Illustration 7
The budget manager of Jupiter Electricals Limited is preparing a flexible budget for the
accounting year starting from 1 July, 2008.
The company produces one product-DETX II. Direct material costs Rs. 7 per unit. Direct
labour averages Rs. 2.50 per hour and requires 1.6 hours to produce one unit of DETX II.
Salesmen are paid a commission of Re. I per unit sold. Fixed selling and administrative expenses
amount to Rs. 85,000 per year..
Manufacturing overhead is estimated in the following amounts under specified
conditions of volume:
Volume of production (m units):1,20,0001,50,000
Rs.. Rs.
Expenses:
Indirect material 2,64,000 3,30,000
Indirect labour 1,50,000 1,87,500
Inspection 90,000 1,12,500
Maintenance 84,000 1,02,000
Supervision 1,98,000 2,34,000
Depreciation-plant and equipment 90,000 90,000
Engineering Services 94,000 94,000
Total manufacturing overhead 9,70,000 11,50,000
Prepare a Total Cost Budget for 1,40,000 units of production.

55
Solution
Particular Total
Rs,
Per Unit
Rs,
Direct Materials 9,80,000 7:00
Direct Labour 5,60,000 4 . 00 Salesmen's Commission 1,40,000 1.00 Indirect Materials 3,08,000 2.20 Indirect Labour 1,75,000 1.25 Inspection 1,05,000 0.75 Supervision — Fixed 54,000 0.39
Variable 1,68,000 1.20 Maintenance — Fixed 12,000 0.09
Variable 84,000 0.60 Depreciation 90,000 0 64 Engineering Services 94,000 0.67
Selling and Distribution Expense 85,000 0.60
28,55,000 20.39
Working Notes.
(i) Depreciation and engineering services are same at two levels of production and,
therefore, are of fixed nature.
(ii) Supervision and maintenance are semi-variable costs. Variable components of these
two items will be calculated as under:
(iii) Variable cost per unit = Change in Cost
Change in Output
Variable component of supervision per unit= 2,34,000-1,98,000
1,50,000 – 1,20,000
36,000
30,000
= Rs. 1.20 per unit
Fixed component of supervision = Total cost – Variable cost
= 1,98,000 – (1,20,000 x 1.20)
= 1,98,000 – 1,44,000
= Rs. 54,000
(iv) Fixed and variable components of maintenance will be calculated as above.
3.9 Summary
Financial budgets help managers in developing financial plan to guide them in allocating
their resources over a specific future period.
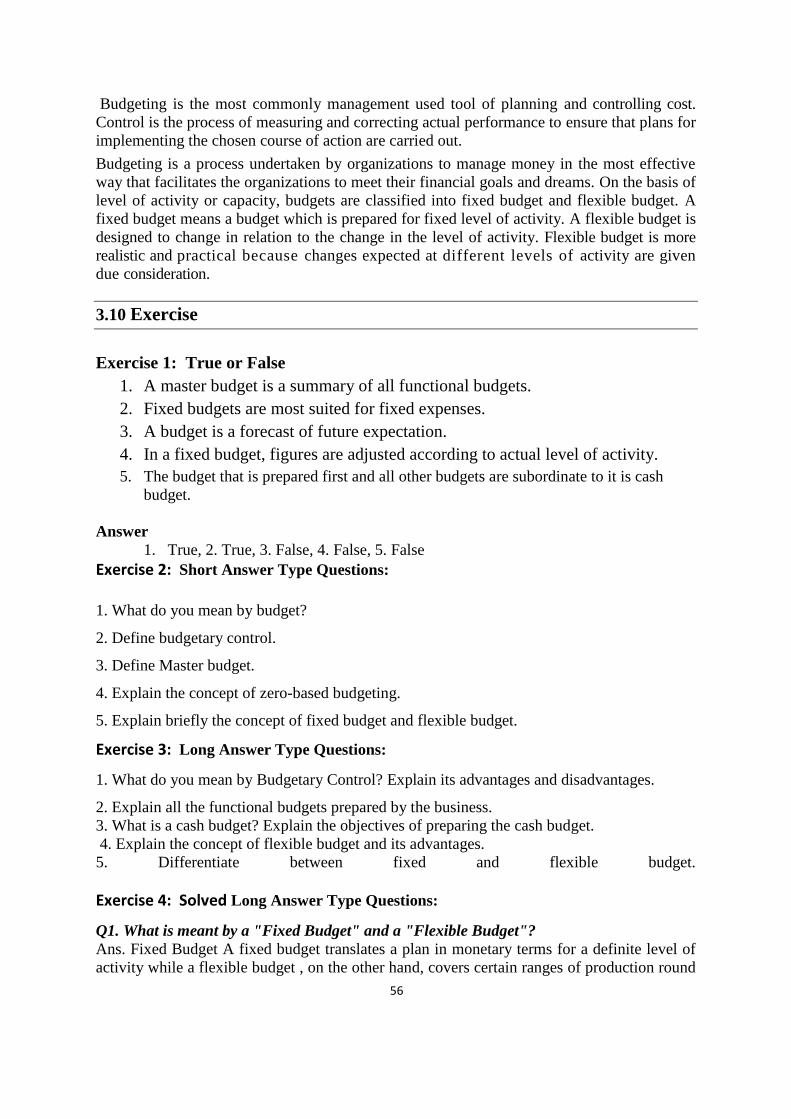
56
Budgeting is the most commonly management used tool of planning and controlling cost.
Control is the process of measuring and correcting actual performance to ensure that plans for
implementing the chosen course of action are carried out.
Budgeting is a process undertaken by organizations to manage money in the most effective
way that facilitates the organizations to meet their financial goals and dreams. On the basis of
level of activity or capacity, budgets are classified into fixed budget and flexible budget. A
fixed budget means a budget which is prepared for fixed level of activity. A flexible budget is
designed to change in relation to the change in the level of activity. Flexible budget is more
realistic and practical because changes expected at different levels of activity are given
due consideration.
3.10 Exercise
Exercise 1: True or False
1. A master budget is a summary of all functional budgets.
2. Fixed budgets are most suited for fixed expenses.
3. A budget is a forecast of future expectation.
4. In a fixed budget, figures are adjusted according to actual level of activity.
5. The budget that is prepared first and all other budgets are subordinate to it is cash
budget.
Answer
1. True, 2. True, 3. False, 4. False, 5. False
Exercise 2: Short Answer Type Questions:
1. What do you mean by budget?
2. Define budgetary control.
3. Define Master budget.
4. Explain the concept of zero-based budgeting.
5. Explain briefly the concept of fixed budget and flexible budget.
Exercise 3: Long Answer Type Questions:
1. What do you mean by Budgetary Control? Explain its advantages and disadvantages.
2. Explain all the functional budgets prepared by the business.
3. What is a cash budget? Explain the objectives of preparing the cash budget.
4. Explain the concept of flexible budget and its advantages.
5. Differentiate between fixed and flexible budget.
Exercise 4: Solved Long Answer Type Questions:
Q1. What is meant by a "Fixed Budget" and a "Flexible Budget"?
Ans. Fixed Budget A fixed budget translates a plan in monetary terms for a definite level of
activity while a flexible budget , on the other hand, covers certain ranges of production round

57
about the initial target on similar monetary terms. This is necessary due to the behaviour of
costs towards volume changes. When we say a budget or forecast of expenditure and income,
the expenditure represented the total of all items of expenses and the income or all items of
output-all for total activity for a period.
Flexible Budget
We know that certain items of expenditure vary either proportionately or otherwise
with changing levels of production and some do not. A budget refers to a certain volume of
activity which in actual practice might or might not be adhered to due to several causes. With
the characteristic behaviour of cost the total expenditure might vary with changing levels of
production. Non-varying or fixed costs will be almost static for different volumes of activity
within certain ranges. Hence the comparison of total actual expenditure comprising both
variable and fixed elements, for varying levels of production with the budget for a definite
volume of production might more often lead to erroneous conclusions and invariably be
irrational in assigning responsibility. Thus, any expenditure, except for fixed elements,
cannot be compared unless adjustments are made for the level of activity actually attained.
The adjustment will be done by an analysis of the various elements of expenses and their
individual behaviour with reference to the volume of activity. This will lead to a preparation
of flexible budgets for varying ranges of production or output volume. This assumes much
greater significance especially when it is realised that an influence of volume on costs is
extremely pertinent in assessing the profitability of individual products and any change in the
pricing policy of a management in trade cycles.
Thus any scheme of budgeting which fully recognises the behaviour of costs towards volume
changes and translates in financial terms the expenditure for varying levels of output, within
of course a certain range, will be called "Flexible Budgeting". In flexible budget, therefore, a
certain amount of flexibility is introduced for varying levels of activity within a range.
Q2. What do you understand by the term "Budgetary Control"?
Ans. Budgetary Control forms an integral part of Management Accounting. Budget and
Budgetary Control comprises the preparation of various aspects of the plan in detail,
conversion of the plan in financial terms and subsequent comparison and checking of actual
performances with the plan. The profitability aspect for otherwise of an enterprise is to a
certain extent forecast much earlier to the commencement of the period by means of a budget.
Budget is nothing but a pre-estimated financial and quantitative interpretation of a set plan of
a policy to be pursued for that period and budgetary control is an establishment of
departmental budgets relating to each responsibility centre in consonance with the policy to
be pursued so that each individual is given an opportunity to secure the objectives of the
policy and control his action wherever possible.
A budget is always aimed for a specific period and that period should be determined
to have a sufficient tenure which will permit fairly accurate predictions. If it is a long period,
the validity of such a forecast will be watered down. Usually in all manufacturing enterprises,
the period corresponds to a financial year.
No budget will be considered worth the while unless control is exercised in
comparing the cost in its actual performance with that budgeted, analysing the variances as to
quantum and causes, and taking remedial steps to secure as close an adherence to budget
plans as is possible under the existing conditions.
Thus, Budget and Budgetary Control is one of the most fruitful and effective tool for
any management. This is achieved by "Planning, Recording, Comparing and Controlling".

58
There is no better method of co-ordinating the financial, production, sale and
operational results than through budget and budgetary control.
A properly constructed budget and planned system of control.
(i) "provides for a well-defined objective for future operations:
(ii) formulates and elucidates the executive policies for ensuring periods:
(iii) forms a yard stick for measuring actual performance of planned objectives;
(iv) fixes responsibility on individuals for the attainment of planned objectives;
(v) creates an incentive and incites the psychology of responsible individuals in
comparing and matching actual performances with planned target; and
(vi) Encourages the staff in the attainment of planned objectives."

59
LESSON 4
CASH BUDGET
4.0 Introduction
4.1 Cash Budget
4.2 Advantages of Cash Budget
4.3 Zero–Based Budgeting
4.3.1 –Advantages
4.3.2 -Limitations
4.4 Master Budget
4.5 Summary of the chapter
4.6 Exercise
Objectives
After studying this chapter, students would be able to:
• Understand the definition of Cash Budget
• Explain the Advantages of Cash Budget
• Understand the Zero–Based Budgeting-Advantages-Limitations
• Understand the Master Budget
4.1 Cash Budget
The cash budget is one of the most important and one of the last to be prepared. It is a
detailed estimate of cash receipts from all sources and cash payments for all purposes and the
resultant cash balances during the budget period. It makes certain that the business has sufficient
cash available -to- meet its needs as and when these arise. It is a device for coordinating and
controlling the financial side of the business to ensure solvency and provide a basis for planning
and financing required to cover up any deficiency in cash. Cash budget thus plays an important
role in the financial management of a business undertaking.
Purposes: The main purposes of cash budget are outlined below:
a) It ensures that sufficient cash is available when required.
b) It indicates cash excesses and shortages so that action may be taken in time to invest any excess
cash or to borrow funds to meet any shortages.
c) It establishes a sound basis for credit.
d)It shows whether capital expenditure may be financed internally.
e) It establishes a sound basis for control of cash position.
Cash budget is prepared on the basis of anticipated cash receipts and anticipated cash
payments during the budget period. One part of the budget shows anticipated cash receipts
while other part shows estimated cash payments. The excess of opening cash balance and
estimated cash receipts over estimated cash payments results in budgeted closing balance of

60
cash. Budgeted closing balance of cash may be positive or negative. The equation of cash
budget may be expressed as under:
Budgeted Closing Cash Balance = Opening Cash Balance + Anticipated Cash Receipts
- Anticipated Cash Payments
4.2 Advantages of Cash Budget Cash budget is an important financial tool for the management. Following are the main advantages of cash budget: Efficient Cash Management: Cash is the basis for all operations. Cash budget helps in evaluating financial policies and cash position. Cash budget enables the management to plan and coordinate the financial operations properly. The management can know how much cash is needed and from which source it will be generated. Internal Financial Management: Cash budget provides information about cash which will be available. This will help the management in determining policies regarding internal financial management e.g. possibility of payment of long-term debt, dividend policy, replacement of machinery etc. Movement of Cash: Cash budget discloses the complete story of cash movement. Cash budget enables a company to meet all its commitments in time and at the same time prevent accumulations of unnecessary large balance with it. Cash Planning: Cash budget determines the future cash needs of the firm. The extent of success or failure of cash planning can be known by the cash budget. Cash budget ensures that sufficient cash is available when required. If shortage of cash is expected, action may be taken to raise the funds internally or externally. If surplus of cash is expected management may invest or lend this surplus.
4.3 Zero–Based Budgeting
This is a method of budgeting which is based on the objective of resetting the clock
each year. In this method of budgeting, during the process of review, no reference is made
to the previous level of expenditure and budgets are re-evaluated thoroughly, starting from
the zero-base level. In this method of budgeting, each cost element is justified specifically
as if the activities which are related to the budget are undertaken for the first time, as this is
based on the promise that even the expenditure of a rupee requires justification. No
reference is made to the previous level of expenditure during the process of review of this
method. This method of budgeting is based on the premises that even the expenditure of a
rupee requires justification. Therefore, the activities related to the budget which are
undertaken for the first time are required to be justified for each cost element. Thus, in this
method of budgeting the concentration is put on, “why this unit requires a particular amount
and not simply on how much” this unit requires. With the use of this method of budgeting
there is an effective utilization of limited resources, so that organization objectives can be
achieved. 4.3.1 Advantages
1. Different activities are evaluated on the basis of systematic approach. 2. On the basis of priorities, different activities are ranked and resources are allocated
accordingly by the management. 3. It improves coordination and communication in the organization. 4. It improves the decision-making ability of managers as it requires them to review

61
their activities each time a budget is developed.
5. It increases the motivation in the organization because of increased participation. 6. It enables the management to make optimum utilization of scarce resources as funds
are allocated on the basis of priority. 7. This method enables the critical appraisal of different activities of an organization. 8. It makes the managers cost conscious and helps them in identifying priorities in the
interest of the organization. 4.3.2 Limitations
1. This method is very expensive and time consuming. 2. Assigning ranking on the basis of priority is very subjective and may cause conflicts
in the organization. 3. This method is not adopted by those managers who resist changes and new ideas. 4. Lot of paper work is involved in this method of budgeting.
Illustration 1 From the following data, prepare a cash budget for the three months commencing from 1st June, 2008 when the bank balance was Rs. 1,00,000:
There is a two months credit period allowed to customers and received from suppliers. Wages, production expenses and administration expenses are payable in the following month. Solution
Preparation of Cash Budget from June to August, 2008
Month Sales Purchases Wages Production Administration
Expenses Expenses
Rs. Rs. Rs. Rs. Rs.
April 80,000 41,000 5,600 3,900 10,000
May 76,500 40,500 5,400 4,200 14,000
June 78,500 38,500 5,400 5,100 15,000
July 90,000 37,000 4,800 5,100 17,000
August 95,000 35,000 4,700 6,000 13,000
Particulars June July August Opening Balance Add: Receipts:
Collection from Debtors
1,00,000 80,000 1,15,400 76,500 1,25,900 78,500
1,80,000
1,91,900
2,04,400
Less: Payments:
Paid to Creditors
Wages
Production Expenses
Administration Expenses
41,000
5,400
4,200
14,000
40,500
5,400
5,100
15,000
38,500
4,800
5,100
17,000
64,600
66,000
65,400
Closing Balance
1,15,400
1,25,900
1,39,000
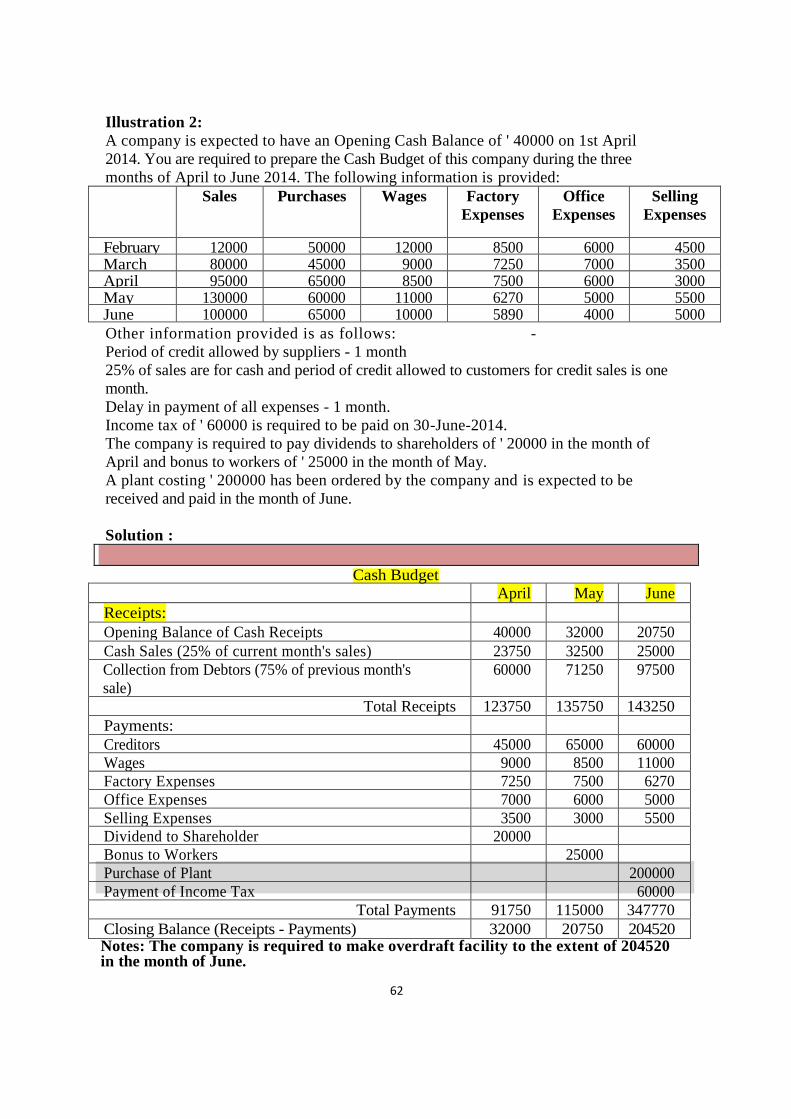
62
\
Illustration 2:
A company is expected to have an Opening Cash Balance of ' 40000 on 1st April
2014. You are required to prepare the Cash Budget of this company during the three
months of April to June 2014. The following information is provided:
Sales
Purchases
Wages
Factory
Expenses
Office
Expenses
Selling
Expenses
February 12000 50000 12000 8500 6000 4500 March 80000 45000 9000 7250 7000 3500 April 95000 65000 8500 7500 6000 3000 May 130000 60000 11000 6270 5000 5500 June 100000 65000 10000 5890 4000 5000 Other information provided is as follows: -
Period of credit allowed by suppliers - 1 month
25% of sales are for cash and period of credit allowed to customers for credit sales is one
month.
Delay in payment of all expenses - 1 month.
Income tax of ' 60000 is required to be paid on 30-June-2014.
The company is required to pay dividends to shareholders of ' 20000 in the month of
April and bonus to workers of ' 25000 in the month of May.
A plant costing ' 200000 has been ordered by the company and is expected to be
received and paid in the month of June.
Solution :
Cash Budget
April May June
Receipts:
Opening Balance of Cash Receipts 40000 32000 20750
Cash Sales (25% of current month's sales) 23750 32500 25000
Collection from Debtors (75% of previous month's
sale)
60000 71250 97500
Total Receipts 123750 135750 143250
Payments:
Creditors 45000 65000 60000
Wages 9000 8500 11000
Factory Expenses 7250 7500 6270
Office Expenses 7000 6000 5000
Selling Expenses 3500 3000 5500
Dividend to Shareholder 20000
Bonus to Workers 25000
Purchase of Plant 200000
Payment of Income Tax 60000
Total Payments 91750 115000 347770
Closing Balance (Receipts - Payments) 32000 20750 204520 Notes: The company is required to make overdraft facility to the extent of 204520 in the month of June.

63
Fifty per cent to credit sales are realized in the month following the sales and the remaining fifty per cent in the second month following.
Creditors are paid in the month following the month of purchase. Wages paid in the month itself. Cash at bank on 1.4.2008 (estimated) Rs. 25,000. Solution
Cash Budget for 3 Months Ending
Bank Overdraft to be arranged for May is Rs. 47,000; for June is Rs. 1,20,000 (1,67,000-47,000).
Illustration 4
A company making for stocks in the first quarter of the year is assisted by its bankers with overdraft accommodation. The following are the relevant figures (budgeted): Sales Purchases Wages (Rs.) (Rs.) (Rs.) November 2007 60,000 41,500 4,900 December 2007 64,000 48,000 5,000 January 2008 36,000 81,000 4,000 February 2008 58,000 82,000 3,800 March 2008 42,000 89,500 5,200
Budgeted cash at the bank 1 st January is Rs. 8,600. Credit terms of sales are payment by the
end of the month following the month of supply. On average, one half of the sales are paid on
Illustration 3 Prepare a cash budget from the following data for three months from 1.4.2008
(Rs.) Month Credit sales Purchases Wages
February 2008 1,80,000 1,24,800 12,000
March 2008 1,92,000 1,44,000 14,000
April 2008 1,08,000 2,43,000 11,000
May 2008 1,74,000 2,46,000 10,000
June 2008 1,26,000 2,68,000 15,000
Particulars April May June
Opening Balance
Receipts:
Collection from
Debtors
Payments: Purchases
Wages
Closing Balance
25,000 1,86,000 56,000 1,50,000 (47,000) 1,41,000
2,11,000 2,06,000 94,000
1,44,000 11,000
2,43,000
10,000
2,46,000
15,000
1,55,000 2,53,000 2,61,000
56,000 (47,000) (1,67,000)

64
the due date while the other half are paid during the next month. Creditors are paid during the
month following the month of supply.
You are required to prepare a Cash Budget for the quarter 1st January to 31st March, 2008
showing the budgeted amount of bank facilities required at each month end. Solution
Cash Budget for the quarter ending 31st March, 2008
Note: Bank overdraft required for February is Rs. 16,200 and for March is
Rs. 40,200 (56,400- 16,200). Illustration 4 A company is expecting to have Rs. 35,000 cash in hand on 1st April, 2008 and it requires you to prepare a budget for three months April to June 2008. The following information is supplied to you:
Other information: 1. Period of credit allowed by suppliers: two months.
2. 25% of the sales are for cash and period of credit allowed to customers for credit
sales one month.
3. Delay in payment of wages and expenses: one month.
4. Income Tax of Rs. 20,000 is to be paid in June 2008.
Particulars January February March
Opening Cash balance as on
Receipts:
Sales proceeds
Total Receipts
Payments:
Purchases
Wages
Total Payments Closing Balance
Rs.
8,600
62,000
Rs.
18,600
50,000
Rs.
(-)16,200
47,000
70,600 68,600 30,800
48,000
4,000
81,000
3,800
82,000
5,200
52,000 84,800 87,200
18,600 (-)
16,200
(-)
56,400
Sales Purchases Wages Expenses
Rs. Rs. Rs. Rs.
February 70,000 40,000 8,000 6,000
March 80,000 50,000 8,000 7,000
April 92,000 52,000 9,000 7,000
May 1,00,000 60,000 10,000 8,000
June 1,20,000 55,000 12,000 9,000

65
Solution
Cash Budget for the three months April-June 2008
Particul
ars
April Rs. May
Rs.
June
Rs.
Opening Balance (A)
Receipts:
Cash sales
Debtors
Total (B)
Payments:
Creditors
Wages
Expenses
Income Tax
Total (C)
Closing Balance (A + B -
C)
35,000 63,000 91,000
23,000
60,000
25,000
69,000
30,000
75,000
83,000 94,000 1,05,000
40,000
8,000
7,000
_-------
50,000
9,000
7,000
-------
52,000
10,000
8,000
20,000
55,000 66,000 90,000
63,000
91,000
1,06,000
Illustration 5 Prepare cash budget of a company for April, May and June 2008 in a columnar
form using the following information:
Months Sales Purchases Wages Expenses
2008 Rs. Rs. Rs. Rs.
January (Actual) 80,000 45,000 20,000 5,000
February (Actual) 80,000 40,000 18,000 6,000
March (Actual) 75,000 42,000 22,000 6,000
April (Budgeted) 90,000 50,000 24,000 7,000
May (Budgeted) 85,000 45,000 20,000 6,000
June (Budgeted) 80,000 35,000 18,000 5,000
You are further informed that:
(a) 10% of the purchases and 20% of the sales are for cash.
(b) The average collection period of the company is — month and the credit purchases
arc paid off regularly after one month.
(c) Wages & Expenses are paid half-monthly and the Rent of Rs. 500 included in
expenses is paid monthly.
(d) Cash and Bank balance as on April 1, was Rs. 15,000 and the company wants to keep
it on the end of every month below this figure, the excess cash being put in Fixed
Deposits.
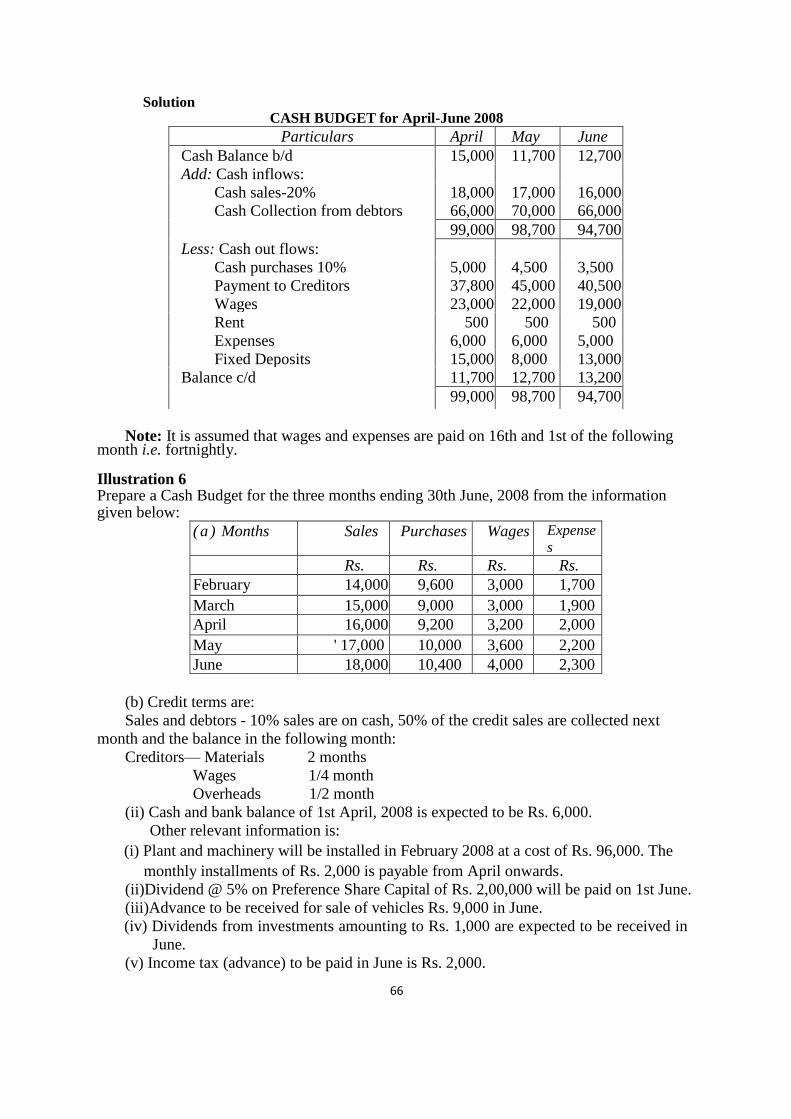
66
Solution
CASH BUDGET for April-June 2008
Note: It is assumed that wages and expenses are paid on 16th and 1st of the following
month i.e. fortnightly.
Illustration 6 Prepare a Cash Budget for the three months ending 30th June, 2008 from the information given below:
(b) Credit terms are:
Sales and debtors - 10% sales are on cash, 50% of the credit sales are collected next
month and the balance in the following month:
Creditors— Materials 2 months
Wages 1/4 month
Overheads 1/2 month
(ii) Cash and bank balance of 1st April, 2008 is expected to be Rs. 6,000.
Other relevant information is:
(i) Plant and machinery will be installed in February 2008 at a cost of Rs. 96,000. The
monthly installments of Rs. 2,000 is payable from April onwards.
(ii)Dividend @ 5% on Preference Share Capital of Rs. 2,00,000 will be paid on 1st June.
(iii)Advance to be received for sale of vehicles Rs. 9,000 in June.
(iv) Dividends from investments amounting to Rs. 1,000 are expected to be received in
June.
(v) Income tax (advance) to be paid in June is Rs. 2,000.
Particulars April May June
Cash Balance b/d 15,000 11,700 12,700
Add: Cash inflows:
Cash sales-20% 18,000 17,000 16,000
Cash Collection from debtors 66,000 70,000 66,000
99,000 98,700 94,700
Less: Cash out flows:
Cash purchases 10% 5,000 4,500 3,500
Payment to Creditors 37,800 45,000 40,500
Wages 23,000 22,000 19,000
Rent 500 500 500
Expenses 6,000 6,000 5,000
Fixed Deposits 15,000 8,000 13,000
Balance c/d 11,700 12,700 13,200
99,000 98,700 94,700
(a ) Months Sales Purchases Wages Expense
s
Rs. Rs. Rs. Rs.
February 14,000 9,600 3,000 1,700
March 15,000 9,000 3,000 1,900
April 16,000 9,200 3,200 2,000
May ' 17,000 10,000 3,600 2,200
June 18,000 10,400 4,000 2,300

67
Solution
Cash Budget For three months ending 30th June, 2008
Working Notes:
(i) Cash sales —April (10% of 16,000) = Rs. 1,600
—May (10% of 17,000) = Rs. 1,700 —June (10% of 18,000) = Rs. 1,800
(ii) Credit Sales = Sales - Cash Sales
Credit Sales of Feb. = 14,000-1,400 = Rs. 12,600
Credit sales realised in April = 12,600x50/100 =Rs. 6,300
(iii) Credit Sales of March = 1,5000-1,500 = Rs. 13,500
Credit Sales realised in April = 13,500x50/100 = Rs. 6,750
Credit Sales realised in May = Rs. 6,750
(iv) Credit Sales of April = 16,000 - 1,600 = Rs. 14,400
Credit Sales realised in May = 14,400x50/100 =RS. 7,200
Credit Sales realised in June = Rs. 7,200
(v) Credit Sales of May = 17,000 - 1,700 = Rs. 15,300
50
Credit Sales realised in June = 15,300 x 50/100
= Rs. 7,650
Collection from Debtors
April = 6,300 + 6,750 = Rs. 13,050
May = 6,750 + 7,200 = Rs. 13,950
June = 7,200 + 7,650 = Rs. 14,850
Particulars April May June
Rs. Rs. Rs.
Opening Balance 6,000 3,950 3,000
Receipts:
Cash Sales 1,600 1,700 1,800
Collection from Debtors 13,050 13,950 14,850
Dividend — — 1,000
Advance against vehicle — — 9,000
Total 20,650 19,600 29,650
Payments:
Creditors (materials) 9,600 9,000 9,200
Wages 3,150 3,500 3,900
Overheads 1,950 2,100 2,250
Instalment for plant 2,000 2,000 2,000
Preference dividend — — 10,000
Income-tax advance — — . 2,000
Total 16,700 16,600 29,350
Closing balance 3,950 3,000 300

68
Payment to creditors for materials will be as under:
Purchases of February will be paid in April
Purchases of March will be paid in May
Purchases of April will be paid in June
Payment of Wages in April = (3,000x1/4)+(3,200x3/4)= RS. 3,150
Payment of Wages in May = (3,200x ¼)+(3,600x3/4) = RS. 3,500
Payment of Wages in June = (3,600x1/4)+(4,000x3/4) = Rs 3,900
Payment of Overhead in April = (900x1/2)+(2,000x1/2) = Rs 1,950
Payment of Overhead in May = (2,000x1/2)+(2,200x1/2) =Rs 2,100
Payment of Overhead in June = (2,200x1/2)+( 2,300x1/2) =Rs 2,250.
4.4 Master Budget
Each manager who is responsible for meeting the budgeted performance has to prepare a
budget. When all the budgets are prepared by respective managers, these are coordinated
with each, other and summarized into a budget which is known as Master Budget. Thus, a
master budget is a consolidated summary of all the functional budgets. According to CIMA
London "Master budget is a summary budget incorporating its component functional
budgets. Accordingly, master budget comprises the functional budget summaries. Master
budget projects the activities of a business during the budget period and is, thus, a profit
plan. Master budget gives a projected overall profit position of the organisation. Master
budget serves as a set of goals to be achieved by the organisation during the budget period.
This budget consists of three parts. budgeted income statement, budgeted balance sheet, and
budget ratios.
4.5 Summary
The cash budget is one of the most important and one of the last to be prepared. It is a
detailed estimate of cash receipts from all sources and cash payments for all purposes and the
resultant cash balances during the budget period. Zero–Based Budgeting this is a method of
budgeting which is based on the objective of resetting the c lock each year. In this method of
budgeting, during the process of review, no reference is made to the previous level of
expenditure and budgets are re–evaluated thoroughly, starting from the zero base level. Each
manager who is responsible for meeting the budgeted performance has to prepare a budget.
When all the budgets are prepared by respective managers, these are coordinated with each,
other and summarized into a budget which is known as Master Budget. Thus, a master budget
is a consolidated summary of all the functional budgets.
4.6 Exercise
Exercise 1: True or False
(i) Budget is prepared in advance for a specified period.
(ii) Fixed budgets are more useful than fluctuating budgets.
(iii) Master budget is a summary of ail functional budgets.
(iv) Cash budget is a master budget.
69
(v) A fixed budget is useful only when the actual level of activity corresponds to the
budgeted level of activity.
(vi) A flexible budget is one which changes from year to year.
(vii) A budget discloses area of potential improvement in the company's operations.
(viii) A budget is nothing but an estimate.
(ix) Budgetary control is exercised through the establishment of budgets.
(x) Forecasting is concerned with planned events.
(xi) A budget usually covers a long period while forecasting is planned for short period.
(xii) Budgetary control is based on the principle of management by exception.
(xiii) A budget is a means and the budgetary control is the end.
(xiv) Flexible budget is one which is designed to change with the level of activity.
Ans.
True (ii) (iii) (v) (vii) (ix) (xii) (xiii) (xiv)
False (ii) (iv) (vi) (viii) (x) (xi)
Exercise 2:Fill in the banks
(i) ------------is a summary of all functional budgets.
(ii) Cash budget is a budget_
(iii) ------------------Budget is useful where the business is new one and it is difficult to
foresee the demand.
(iv) …………….is a budget for a single level of some measure of activity.
(v) A budget is a quantitative statement prepared prior to a ______ period.
(vi) Budget helps in _____ the policies.
(vii) Forecasting is concerned with______ events.
(viii) -------------is pre-requisite to budgetary control.
(ix) --------relate to economic activities while----may relate to economic and non-
economic activities.
(x) Budget is a ------------ and budgetary control is the
Ans.
(i) Master budget
(ii) Functional
(iii) Flexible
(iv) Fixed
(v) Defined
(vi) Making
(vii) Anticipated
(viii) Forecasting
(ix) Budgets, forecasts
(x) Means, end.
Exercise 3: Long Answer Type Questions:
1. Define budgetary control and state its advantages.
2. Discuss briefly the objectives and limitations of budgetary control.

70
3. "A budget is a means and budgetary control is the end result." Explain.
4. What is a budget? How does it serve as an instrument of control.
5. Distinguish between a forecast and a budget!
6. What are functional budgets? Describe any one functional budget.
7. What is a cash budget? What are its objectives.
8. What is a flexible budget? What advantages has a flexible budget over a fixed budget?
9. Define flexible budget and explain its importance.
10. Distinguish between fixed budget and flexible budget. Exercise 4: Problems
Sales and purchases all are on credit. You are given the following further information:
Plant costing Rs. 16,000 is due for delivery in July, payable 10% on delivery and the balance after three months.
Advance Tax installments of Rs. 8,000 each are payable in March and June.
The period of credit allowed by suppliers is 2 months and that allowed to customers is one
months.
Time-lag in payment of manufacturing expenses is 1/2 month, while the lag in payment of all
other expenses is one month.
You are required to prepare a Cash Budget for three months starting on 1st May, 2008 when
cash balance was Rs. 8,000.
Ans. Cash balance May Rs. 13,750, June Rs. 12,250 and July Rs. 16,900.
2. From the following forecasts of income and expenditure, you are required to prepare a
cash budget for three months ending 30th November. The bank balance on 1st September
was Rs. 10,000.
1: Summarised below are the income and expenditure forecasts for the months March to August 2008.
Month Sales Purchases Wages Mfg.
Exp,
Office Exp. Selling Exp.
Rs. Rs. Rs. Rs. Rs. Rs.
March 60,000 36,000 9,000 4,000 2,000 4,000
April 62,000 38,000 8,000 3,000 1,500 5,000
May 64,000 33,000 10,000 4,500 2,500 4,500
June 58,000 35,000 8,500 3,500 2,000 3,500
July 56,000 39,000 9,500 4,000 1,000 4,500
August 60,000- 34,000 8,000 3,000 1,500 4,000

71
A sales commission of 4% on sales, due in the month following the month in which the
sales dues are collected, is payable in addition to office expenses. Fixed assets worth Rs.
65,000 will be purchased in September to be paid for in the following month. Rs. 20,000
in respect of debenture interest will be paid in October. The period of credit allowed to
customers is two months and one month credit is obtained from suppliers of goods.
Wages are paid on an average fortnightly on 1 and 16 of each month in respect of dues for
period ending on the date preceding such days. Expenses are paid in the month in which
they are due. Ans. Cash balance - 30 Sept. Rs. 24,000, 31 Oct. Rs. (-) 53,150, 30 Nov. (-) Rs. 40,610.
3.Vani Ltd. a newly started company wishes to prepare cash budget from January. Prepare
a cash budget for the first six months from the following estimated revenue and expenses:
Cash balances on 1st January was Rs. 10,000. A new machinery is to be installed at Rs.
20,000 on credit, to be repaid by two equal installments in March and April.
Sales Commission @ 5% on total sales is to be paid within a month following actual
sales.
Rs. 10,000 being the amount of 2nd call may be received in March. Share premium
amounting to Rs. 2,000 is also obtainable with the 2nd call.
Period of credit allowed by suppliers - 2 months
Period of credit allowed to customers - 1 month
Delay in payment of overheads -1month
Delay in payment of wages - ½ month
Assume cash sales to be 50% of total sales.
Ans. Closing Balances: Jan. Rs. 18,000; Feb. Rs. 29,800; March Rs. 27,000; April Rs.
24,700, May Rs. 33,100; June Rs. 36,000.
Months Sales Purchases Wages Factory Office
expenses expenses
Rs. Rs. Rs. Rs. Rs.
July 80,000 40,000 5,600 3,900 10,000
August 76,500 42,000 5,800 4,100 12,000
September 78,000 38,500 5,800 4,200 14,000
October 90,000 37,500 5,900 5,100 16,000
November, 95,000 43,000 5,900 6,000 13,000
Overheads
Months Total Sales Materials Wages Production Selling and
distribution
Rs. Rs. Rs. Rs. Rs.
Jan. 20,000 20,000 4,000 3,200 800
Feb. 22,000 14,000 4,400 3,300 900
Mar. 28,000 14,000 4,600 3,400 900
April 36,000 22,000 4,600 3,500 1,000
May 30,000 20,000 4,000 3,200 900
June 40,000 25,000 5,000 3,600 1,200

72
4: Make out a Cash Budget for April, May and June 2008 from the following information: Actual and Budgeted Sales:
Actual Rs. Budgeted Rs.
January 80,000 April 90,000
February 80,000 May 85,000
March 75,000 June 80,000
Actual and Budgeted Purchases:
Actual and Budgeted Wages and Expenses:
Actual
Wages Expenses
Rs. Rs.
January 20,000 5,000
February 18,000 6,000
March 22,000 6,000
Budgeted
wages Expenses
Rs. Rs.
April 24,000 7,000
May 20,000 6,000
June 18,000 5,000
1. Special: The advance income tax for May, Rs. 4,000 plant in April, Rs. 10,000.
2. Rent of Rs. 300 payable each month, not included in expenses.
3. 10% of purchases and sales are on cash terms.
4. Credit purchases are paid after one month and credit sales are collected
5. after two months. The time lag in wages and expenses 1/2 month.
6. Cash and bank balances in April, Rs. 13,000.
Ans. Cash balance Rs. 11,400, Rs. 5,100, Rs. 25,300.
5: The cost of an article at capacity level of 5,000 units is given under A below. For a
variation of 20% in capacity above or below this level, the individual expenses vary as indicated under B below:
Actual Rs. Budgeted Rs.
January 45,000 April 50,000
February 40,000 May 45,000
March 42,000 June 35,000

73
A(Rs) B
Material cost 25,000 (100%varying)
Labour cost 15,000 (100% varying)
Power 1,250 (80% varying)
Repairs and maintenance 2,000 (75% varying)
Stores 1,000 (100% varying)
Inspection 500 (20% varying)
Depreciation 10,000 (100% fixed)
Administration overheads 5,000 (25% varying)
Selling overheads 3,000 (50% varying)
62,750
Cost per unit 12.55
Find the unit cost of the product under each individual expense at production levels of
4,000 units and 6,000 units.
Ans. 4,000 units Total cost 53,480 Per unit 13.37
6,000 units Total cost 72,020 Per unit 12.00.
6: The monthly budgets for manufacturing overhead of a concern for two levels of activity
were as follows:
Capacity 60% 100%
Budgets production (units) 600 1,000
Rs. Rs.
Wages 1,200 2,000
Consumable stores 900 1,500
Maintenance 1,100 1,500
Power & fuel 1,600 2,000
Depreciation 4,000 4,000
Insurance 1,000 1,000
9,800 12,000
You are required to: (i) Indicate which of the items are fixed, variable and semi-
variable, (ii) Prepare a budget for 80% capacity; and (iii) Find the total cost, both fixed and
variable, per unit of output at 60%, 80% and 100% capacity.
Ans. 80% Total Cost Rs. 10,900.
7: Gemini Steel Ltd. manufactures a single product for which market demand exists for
additional quantity. Present sales of Rs. 60,000 per month utilises only 60% capacity
of the plant. Marketing Manager assures that with the reduction of 10% in the price he
would be in a position to increase the sale by about 25% to 30%.
The following data are available:
Selling price Rs. 10 per unit
Variable cost Rs. 3 per unit
Semi-variable cost Rs 6,000 fixed + 50 paise per unit
Fixed cost Rs. 20,000, at present level estimated to be
Rs. 24,000 at 80% output.

74
You are required to prepare the following statements:
(i) The operating profits at 60%, 70% and 80% levels at current
Selling price, and
(ii) The operating profits at proposed selling price at the above levels
Ans. Profit at 60% Rs. 13,000; at 70% Rs. 19,500 at 80% Rs. 22,000.
Profit at proposed selling prices in above levels Rs. 7,000, Rs. 12,500, Rs, 14,000.
8: For production of 10,000 articles, the following are budgeted expenses per unit:
Prepare a flexible budget for production of 6,000, 7,000 and 8,000 units of articles,
showing clearly Variable cost, Fixed cost and Total cost.
Ans. Rs. 10,30,000; Rs. 11,67,000; Rs. 12,98,000.
9: The following data is for a 60% activity. Prepare a flexible budget at 80% and 100%
activity.
Production at 60% capacity-600 units.
Materials Rs. 100 per unit.
Labour Rs. 40 per unit.
Expenses Rs. 10 per unit.
Factory expenses Rs. 40,000 (40% fixed).
Administrative expenses Rs. 30,000 (60% fixed).
Ans. Total Rs. 1,60,000; 2,02,000; 2,44,000.
10: The expenses budgeted for production of 10,000 units in a factory are furnished below:
Prepare a budget for production of
Expenses Per unit
Rs.
Direct materials 60
Direct labour 30
Variable overheads 20
Fixed overheads (Rs. 1,60,000) 16
Variable expenses (direct) 5
Selling expenses (20% fixed) 15
Administration expenses (Rs. 50,000 fixed for
all levels of production) 5
Distribution expenses (20% fixed) 5
156
Per unit
Rs.
Materials 70
Labour 25
Variable overheads 20
Fixed overheads (Rs. 1,00,000) 10
Variable expenses (Direct) 5
Selling expenses (10% Fixed) 13
Distribution expenses (20% Fixed) 7
Administrative expenses (Rs. 50,000) 5
Total cost of sales per unit (to make and sell) 155

75
I 8,000 units, and
6,000 units.
Assume that administrative expenses are rigid for all levels of production.
Ans. Rs. 12,75,400; 10,00,800.
11: A manufacturing company has the production capacity of 20,000 units per annum. The
expenses budgeted for 12,000 units for a period are as follows:
Per unit
Rs.
Materials 100
Wages (40% Fixed) 20
Manufacturing Expenses (40% Fixed) 20
Administration Expenses (Fixed) 10
Selling & Distribution Expenses (60% Fixed) 10
160
Profit 40
Selling Price 200
Prepare a Flexible Budget showing 70% and 100% level of capacity. It is expected that
the per unit selling price will remain constant upto 60% capacity, there after a 5%
reduction is expected upto 90% capacity level. Above 90% a2 * 1 /2 .
2 % reduction-in original price is expected for every 5% increase in volume.
Ans. Profit.70% 4,84,000; 100% 8,56,000
76
LESSON 5
MARGINAL COSTING-I
5.0Introduction
5.1 Marginal cost- Definition and Concept
5.2 Methods of segregation of semi-variable costs
5.3 Two popular methods are described-Level of Activity Method
and Range of High and Low Method
5.4 Definition of marginal costing
5.5 Features of marginal costing
5.6 Ascertainment of Net Profit under Marginal Costing
5.7 Distinction between Absorption/full/ convention Costing and Marginal Costing
5.8 Assumptions underlying Marginal Costing
5.9 Advantages of Marginal Costing
5.10 Limitations of Marginal Costing
5.11 Applications of Marginal Costing
5.12 Cost-Volume-Profit (c-v-p) Analysis- Definition, meaning,
Impact of the factors on the profit.
5.13 Break-even Analysis-Assumptions Underlying Break-Even Analysis
5.14 Methods of Break-Even Analysis-
1) Algebraic Method (following terms explained with numerical problems)
(i) Contribution
(ii) PV Ratio
(iii) Break-even point (BEP)
(iv) Margin of Safety. (explained in next chapter)
2 Graphic method (explained in next chapter)
5.15 Summary of the chapter
5.16 Exercise
Objectives
After studying this chapter, students would be able to:
• Understand the definition of marginal cost
• Explain the methods of segregation of semi-variable costs
• Understand the definition of marginal costing and features of marginal costing
• Understand the Ascertainment of Net Profit under Marginal Costing
5.1 Marginal Costing
Marginal costing provides the cost information to management for decision making. The cost
of the product, service, department etc, can be determined by different methods like single
Output costing, job costing, process costing etc. In addition to these methods, there are
several techniques of costing used for managerial decision making. These techniques can be
combined with any of the methods of costing. Marginal costing is one of the techniques of

77
costing used for the purpose of assessing the profitability or otherwise of the products,
processes, departments or cost centres.
The technique of marginal costing includes the term marginal cost.
Marginal Cost
According to C.I.M.A. London, "Marginal cost means the amount at any given volume of
output by which aggregate costs are changed if the volume of output is increased or
decreased by one unit."
Therefore, marginal cost is the cost through which total cost changes when there is a change
in output by one unit. An important point is that marginal cost per unit remains unchanged
irrespective of the level of activity or output.
For example,
If the total cost of producing 10 units of a product is Rs. 100 and the cost for 11 units is Rs.
105, the marginal cost of producing one additional unit will be Rs. 5.
Marginal cost is also called as variable cost because an increase of one unit in production will
cause an increase invariable costs only. Hence,
Marginal Cost = Direct Materials cost + Direct Labour cost + Direct Expenses +
Variable Factory Overheads + Variable Office and Administration
Overhead + Variable Selling and Distribution Overheads.
Example
A plant produces =10 units of product per annum.
Variable cost = Rs. 10(per unit)
The fixed costs = Rs. 2,00 per annum.
Calculate the total cost of 10units of product.
Rs.
Variable Cost (10 x Rs. 10) 100
Fixed Cost 200
Total Cost 300
Suppose production is increased by one unit then it will become 11 units of product per
annum;
Rs.
Variable Cost (11 x RS. 10) 110
Fixed Cost 200
Total Cost 310
marginal cost of producing one additional unit is Rs. 10 and it is same as variable cost.
Question 1
Following is the cost sheet of producing 500units of product against a capacity of 750units:
Cost per unit {in Rs.)
Direct materials 72
Direct wages 60
Works overheads (50% of this is variable) 20
Selling overheads (25% of this is variable) 8
The manufacturer decides to increase his output to 600 units. You are required to calculate
marginal cost of 100 units and total cost of 600 units.

78
Solution
Statement Showing Marginal Cost and Total Cost
Particulars 500 units
(Rs.)
100
units (Rs.)
600 units
(Rs.)
Direct Materials
Direct Wages
Variable Works Overhead
Variable Selling Overhead
Marginal or Variable Costs
Fixed Works Overhead
Fixed Selling Overhead
Total Cost
36000
30000
5000
1000
7200
6000
1000
200
43,200
36000
6000
1200
72000
500
30000
14,400
------
------
86,400
6000
3600
75,500 14,400 96000
5.2 Methods of Segregation of Semi-variable Costs
Semi-variable cost can be separated into fixed and variable costs by the following methods.
1. Level of activity method
2. Range or high and low method
3. Scatter graph method
4. Analytical method
5. Simultaneous equation method.
6. Least squares method
5.3 Two Popular Methods
The first two methods are commonly used, which have been discussed below:
Level of Activity Method
Under this method, output and overheads are compared at two levels of output.
The variable overhead per unit can be obtained by dividing the change in overheads by the
change in output or activity and fixed overheads remain fixed.
Variable overhead per unit = Change in Overheads /change in Output
Question 2
March April
Output (in units) 2000 2,400
Factory Overheads ( in Rs.) 25,600 27,200
Calculate the fixed factory overhead of the company.
Solution:
Variable overhead per unit = Change in Factory Overheads /change in Output
=1600/400
= Rs. 4 per unit
To calculate fixed OH apply Rs 4 per unit rate for the month of March,

79
Fixed Factory Overheads = Total Factory Overheads- Variable Factory Overheads
= 25,600 - (2000 x 4)
= Rs. 17,600.
For the month of April
Fixed Factory Overheads = Total Factory Overheads- Variable Factory Overheads
= 27,200 - (2400 x 4)
= Rs. 17,600.
Fixed overhead is same for the month of March and April.
Range of High and Low Method
Highest and lowest points of output are taken into consideration, under this method. Change
in overhead is divided by the change in output to obtain the variable cost per unit.
Question 3
January February March April
Units of Output 500 600 700 1000
Factory Overheads (Rs )6,000 6600 7200 8000
You are required to calculate fixed overheads.
Solution
Output {units) Factory Overhead (Rs.)
Highest 1000 8000
Lowest 500 6000
Change 1500 14000
Variable overhead per unit= 2000/1500
= Rs. 4 per unit
Fixed overhead = 8000 - (1000 x 4)
= 8000- 4000
= Rs. 4,000
5.4 Marginal Costing
According to Chartered Institute of Management Accountants, London "The accounting
system in which variable costs are charged to cost units and fixed costs of the period are
written off in full against the aggregate contribution. Its special value is in decision making"
only variable costs are charged to cost units. It is also called as 'variable costing'. Profit is
measured by contribution minus total fixed costs. Fixed costs are charged to Profit and Loss
Account during which costs are incurred because it is considered as period costs.
5.5 Features of Marginal Costing
1. It is a technique for managerial decision making.

80
2. Only variable costs are taken into consideration for computing cost of production and
value of stocks.
3 Semi-variable costs are segregated into fixed and variable costs.
4. Marginal contribution is calculated by sales value less variable costs, to ascertain the
profitability of a product or department.
5. Fixed costs are charged to Profit and Loss Account of the period for which costs are
incurred.
6. Marginal costing is not a method of costing just as job costing, process costing etc.
5.6 Ascertainment of Net Profit under Marginal Costing
Net Profit is ascertained by deducting fixed costs from marginal contribution. For this
purpose marginal cost sheet is prepared. Proforma of marginal cost sheet is shown as under:
Marginal Cost Sheet
(A) Sales
Direct Materials
Direct Labour
Direct Expenses
Variable Overheads
Rs.
(B) Variable Costs
(C) (D)
Contribution (A - B)
Fixed Overheads
(E) Profit (C - D)
5.7 Distinction between Absorption/full/ convention Costing and Marginal Costing
Under absorption costing, all manufacturing costs whether fixed or variable are ‘absorbed’ in
the cost of the products produced.
According to C.I.M.A, London, "Absorption costing as the practice of charging all costs, both
variable and fixed, to operations, process or products ".
Product cost= prime cost + variable manufacturing overheads + fixed manufacturing
overheads.
Absorption costing is also known as full costing or total costing. It is the basis of all financial
accounting statements. In this technique, the cost per unit varies to a large extent with the
volume of production because fixed costs are also included therein. In this method, profit
means the difference between sales and cost of sales.

81
Following table shows the distinction between absorption costing and marginal costing:
Basis of Distinction Absorption Costing Marginal Costing
(i) product costing
All costs are allocated
to products. All costs are treated as
product costs.
Only variable costs are treated
as product costs.
(ii) Cost element
Fixed overheads are added to the
cost of production.
Fixed overheads are not included
in the cost of production.
(iii) inventory
valuation
Value of inventory is
comparatively higher because
inventory is valued at total cost
(including variable and fixed costs)
Value of inventory is
comparatively lower because
inventory is valued at variable
costs only:
(iv) Profit concept
Profit is computed and decisions
are taken on profit basis. Under
absorption costing, profit is the
difference between sales and cost
of sales.
Contribution is the key to take
decisions under marginal costing.
Sales and variable cost of sales is
contribution. Profit is calculated
by difference between
contribution and fixed cost.
(v) Effect of
inventory
Increase in inventory results in
higher profit and vice- versa.
Increase in inventory results in
lower profit and vice-versa.
5.8 Assumptions underlying Marginal Costing
Following are the assumptions underlying marginal costing: Selling price per unit does not change as volume changes.
Total fixed cost will remain constant at all levels of output. Variable cost per unit remains constant. It implies that the law of variable proportions
does not apply. Total variable cost varies in direct proportion to the volume of production.
Sales mix will remain constant.
Total variable cost will change only due to change in volume.
Costs can be categorized into fixed and variable costs.
5.9 Advantages of Marginal Costing
Following are the advantages of marginal costing:
1. Benefit to Management: Marginal costing is helpful to management in taking many valuable decisions like fixing selling prices below cost, introduction of new product line, make or buy, selecting the most profitable product or product mix, accepting orders, at low price, reduction of price in times of competition or depression, etc.

82
2. Easy to apply: Marginal costing is simple to use as it avoids the complications
involved in allocation, apportionment and absorption of fixed overheads on estimated basis.
3. Cost Control: control over cost can be possible by classifying costs into fixed and variable costs. Management can concentrate more on the control of variable costs which are usually controllable and pay less attention to fixed costs which may be controlled only by the top management.
4. No under and over- absorption of overheads: In Marginal costing, there is no problem of under or over-absorption of overheads.
5. Tool of Profit Planning: cost- volume-profit analysis is one of the important tools used by the management for profit planning. The use of break even analysis and chart allows the management to understand the implications of change in different variables on the profitability of the enterprise.
5.10 Limitations of Marginal Costing The main limitations of Marginal costing are as follows:
1. Difficulties in cost division: marginal cost assumes that all costs can be divided into fixed and variable cost precisely. However, in practice, there are certain items of semi-variable cost which cannot be precisely divided into fixed and variable. These items of costs are segregated on the basis of some estimation and may differ from person to person. 2. Inventories Valuation: Finished goods and work-in-progress are evaluated at marginal cost, under marginal costing. It would not show the true and fair view of the financial position, from the point of view of Balance Sheet. 3. Suitable for labour intensive industries: In capital intensive industries, the proportion of fixed costs is more. The marginal costing technique, which ignores fixed cost, thus proves less effective in such industries. 4. Difficulty in application: Marginal costing may not be applied by the concerns which have to carry large stocks by way of work-in- progress. Further, marginal costing is not suitable to industries working on contract basis. 5. Time Factor: By ignoring fixed costs, time factor is also ignored. For example, marginal cost of two jobs may be identical but if one job takes twice as long to complete as the other, the true cost of the job taking longer time is higher than that of the other. It is not disclosed by marginal costing. It creates an illusion that fixed costs have nothing to do with production.
5.11 Applications of Marginal Costing
1. Pricing of products: Pricing of products can be done by applying the technique of
marginal costing. The price of the product should be fixed so that it covers marginal
cost and also makes a reasonable contribution to fixed overheads.
2. Volume of sales: The Company may need to change volume of sales to get a desired
level of profit. It can be ascertained by the marginal costing technique.
3. Different Level of production: This technique is helpful to the management to decide
optimum level of activity (where contribution per unit is the maximum). When the
management is considering different levels of production or selling activities.
4. Valuation of Profitability of various Departments: it helps the management of the
company to decide whether a department should continue or be closed.

83
5. Optimum Sales Mix: A firm needs to decide the best product mix which yields the
maximum contribution. It can be ascertained with the help of marginal costing.
6. Different Techniques to Manufacture: Marginal costing is helpful in deciding best
method of production which can give the greater contribution. For example hand
work or machine work.
7. Make or Buy Decision: When management has to decide whether to make product or
buy it from outside then management compares the marginal cost of manufacturing
the product with its purchase price. Marginal costing techniques are used to make
such decisions.
8. Plant Shut-down Decision: this decision totally depends on revenue generated from
the sales activity. If the sales of the product are inadequate to cover fixed costs, the
management may decide whether to shut down the production of the product
temporarily or continue. Marginal costing assists the management in taking such
decision.
9. Launching of a New Product: Marginal costing technique is used, when a firm
intends to introduce a new product in the market to make use of the available facilities
or to capture a new market.
10. Acceptance of special Price: In the course of normal circumstances, price is fixed on
the basis of the total cost. But under abnormal conditions, the prices may be fixed
below the total cost. If selling price is equal to or more than marginal cost, the firm
may accept a price less than the total cost.
Following circumstances necessitate the fixation of price below total cost:
(i) To eliminate weak competitors.
(ii)To make a new product popular in the market.
(iii) To explore a foreign market.
(iv) To keep plant and machinery in running condition.
(v)When a product can be sold with profit in combination with other products.
5.12 Cost-Volume-Profit (c-v-p) Analysis
Cost-Volume-profit analysis is a profit planning technique to study the impact of change in
any of the variables affecting the profit.
according to C.I.M.A. London, it is “the study of the effects on future profits of changes in
fixed cost, variable cost, sales price, quantity and mix". Sales volume, Selling price, fixed
cost, variable cost per unit and sales mix are the factors which affect the profit of a concern.
Cost- volume-profit analysis explains the inter-relationships of these variables for decision-
making. It is used to determine the impact of fluctuations in cost and volume on the financial
results. It studies the inter-relationship of cost, levels of activity and the profit of different
alternatives available to a firm.
The cost-volume-profit analysis explains the impact of the following on the profit:
(i) Change in the volume of sales
(ii) Change in the selling price
(iii) Change in the fixed cost
(iv) Change in the variable cost

84
5.13 Break-even Analysis
Break-even analysis is a widely used technique to study the cost-volume-profit relationship.
In the narrow sense, break-even analysis is concerned with determining break-even point, i.e.,
that level of production and sales where there is no profit and no loss. At this point total cost
is equal to total sales revenue. In broader sense, break-even analysis is used to determine
probable profit/loss at any given level of production/sales. It also helps to determine the
amount or volume of sales to earn a desired amount of profit.
Assumptions Underlying Break-Even Analysis
Break-even analysis is based on the following assumptions:
1. All costs can be categorized into fixed and variable.
2. Total fixed cost remains constant.
3. There will be no change in general price level.
4. The state of technology, methods of production and efficiency remain unchanged.
5. Productivity per worker does not change.
6. Selling price per unit does not change as volume changes.
7. Variable costs vary in proportion to output and fixed costs remain constant.
8. Stocks are valued at marginal cost.
9. There is synchronization between production and sales. It means volume of production
equals volume of sales.
10. Sales-mix will remain constant.
5.14 Methods of Break-Even Analysis
There are two methods of break-even analysis:
(i) Algebraic (mathematical) method
(ii) Graphic method.
Algebraic Method
(i) Contribution
(ii) PV Ratio
(iii) Break-even point (BEP)
(iv) Margin of Safety.
Contribution
Contribution is the difference between sales and marginal cost of sales. Contribution is also
known as "Gross Margin" or contribution margin.
Contribution is calculated by the following formula:
Contribution = Sales - Variable cost
Contribution = Fixed Cost + Profit
Thus, Profit = Contribution - Fixed costs
Contribution per unit = Selling price per unit - Variable cost per unit
Total Contribution = Contribution per unit x Number of units sold.
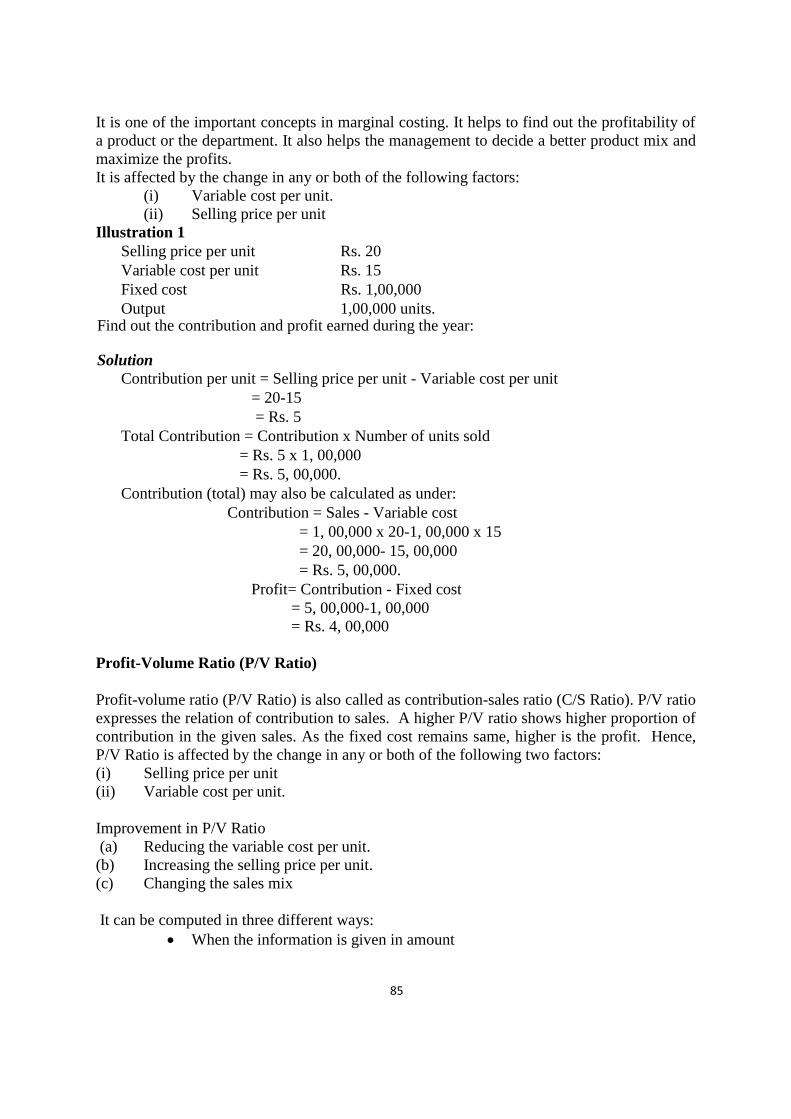
85
It is one of the important concepts in marginal costing. It helps to find out the profitability of
a product or the department. It also helps the management to decide a better product mix and
maximize the profits.
It is affected by the change in any or both of the following factors:
(i) Variable cost per unit.
(ii) Selling price per unit
Illustration 1
Selling price per unit Rs. 20
Variable cost per unit Rs. 15
Fixed cost Rs. 1,00,000
Output 1,00,000 units. Find out the contribution and profit earned during the year:
Solution
Contribution per unit = Selling price per unit - Variable cost per unit
= 20-15
= Rs. 5
Total Contribution = Contribution x Number of units sold
= Rs. 5 x 1, 00,000
= Rs. 5, 00,000.
Contribution (total) may also be calculated as under:
Contribution = Sales - Variable cost
= 1, 00,000 x 20-1, 00,000 x 15
= 20, 00,000- 15, 00,000
= Rs. 5, 00,000.
Profit= Contribution - Fixed cost
= 5, 00,000-1, 00,000
= Rs. 4, 00,000
Profit-Volume Ratio (P/V Ratio)
Profit-volume ratio (P/V Ratio) is also called as contribution-sales ratio (C/S Ratio). P/V ratio
expresses the relation of contribution to sales. A higher P/V ratio shows higher proportion of
contribution in the given sales. As the fixed cost remains same, higher is the profit. Hence,
P/V Ratio is affected by the change in any or both of the following two factors:
(i) Selling price per unit
(ii) Variable cost per unit.
Improvement in P/V Ratio
(a) Reducing the variable cost per unit.
(b) Increasing the selling price per unit.
(c) Changing the sales mix
It can be computed in three different ways:
• When the information is given in amount

86
P/V Ratio = Contributionxl00
Sales
• When the information is given per unit
P/V Ratio = Contribution per unit xl00
Selling Price per unit
• When the information is given for two time periods
P/V Ratio =Change in Profit/Contributionxl00
Change in Sales
Illustration 2
Marginal cost Rs. 48,000
Sales Rs. 1, 20,000
Find P/V Ratio Solution
Contribution = Sales - Marginal Cost
= 1,20,000-48,000
= Rs. 72,000
P/v Ratio = (contribution/ sales) X 100
= (72,000/1,20,000) x 100
= 60%
Illustration 3
Period I(lacs) Period II(lacs)
Sales Rs. 30 Rs. 20
Profit Rs. 4 Rs. 2
Calculate P/V Ratio.
Solution
P/V Ratio= Change in Profit x lOO
Change in Sales
= 4 Lakhs - 2 Lakhs x lOO =20%.
30 Lakhs - 20 Lakhs
Illustration 4
Following information is given below:
Selling price per unit = Rs. 10
Variable cost per unit = Rs. 8
Contribution per unit = Rs. 2
Fixed overheads are Rs. 8,000 per month
Calculate the present and future P/V Ratio (if there is a reduction of 10% in selling price)

87
Solution
Present P/V Ratio= Contribution per unit x 100
Selling price per unit
= 2/10x 100= 20%
Future Selling price = 10-1= Rs. 9
Future Variable Cost = Rs. 8
Future Contribution = 9 – 8 = Rs. 1
Future P/V Ratio= Contribution per unit x 100
Selling price per unit
= 1/9x100
=11.11%
Illustration 5
Selling price per unit Rs. 200
Variable cost per unit Rs. 120
(i) Find out P/V Ratio.
(ii) Calculate the revised P/V Ratio if
(a) Decrease in selling price by 10%.
(b) Increase in variable cost by 10%.
Solution
i) P/v Ratio = Contribution per unit x 100
Selling Price per unit
= 200-120x100
200
= 40%
(ii) (a) Future P/V Ratio = 180-120 Xl00 = 30%
200
(b) Future P/V Ratio = 200-132 x 100 = 34%
200
Break-even Point
It is the level of sales where the total revenue is equal to the total costs. Break-even point is
the point of "no profit, no loss." Any level of sales above the break-even point gives profit
and if the sale decreases from this level gives loss. Lower the break-even point, higher will be
the chances of higher profitability.
Break-even point may be expressed in terms of units of production (or sales) or in terms of
sales volume. It may be calculated as under:

88
Break-even point (in units) = Fixed Cost /contribution per unit
Break-even point (in sales volume or in Rs.) =Fixed Cost x Sales
Contribution
or
= Fixed Cost
P/V Ratio
A firm which attains break-even point earlier (at less number of units) is definitely better than
one which attains it later (at more number of units).
Illustration 6
Rs.
Selling Price per unit 10
Variable Cost per unit 2
Fixed Cost 40,000
Estimated Sales 1, 00,000
Calculate the break-even point.
Solution
Contribution= Selling price per unit - Variable cost per unit
= Rs. 10-Rs. 2 = Rs. 8
P/V Ratio= (Contribution per unit /Selling Price per unit) x l00
= 8/10 xl00 = 80%
B.E.P. (in units)=Fixed Cost / Contribution per unit
= 40,000/8=5000
B.E.P. (in sales volume) =Fixed Cost / P/V Ratio
= 40000/80 x100
= 50,000 units.
Calculation of Sales for Desired Profit
The level of sales required to earn the desired amount of profit is called desired sales.
Sales for Desired Profit (in units) =Fixed Cost + Desired Profit
Contribution per unit
Sales for Desired Profit (in Rs.) = Fixed Cost + Desired Profit
P/V Ratio

89
Illustration 7
(i) Compute break-even point in terms of units and sales
(ii) Compute how many units must be produced and sold to earn a profit of Rs. 30,000.
You are required to use the information given below
Production = 5,000 units.
The variable cost = Rs. 10 per unit.
The fixed cost = Rs. 20,000.
The selling price is fixed to earn a profit of 25% on cost.
Solution:
Variable Cost per unit = Rs 10
Budgeted Production = 5000 units
Variable Cost (5000 x 10) = Rs 50,000
Fixed Cost =Rs 20,000
Total Cost = variable cost+ fixed cost
= 50,000 +20,000
= Rs. 70,000
Profit = 25% of Total Cost
= 25% of Rs. 70,000
= Rs. 17500
Sales = Total Cost + Profit
70,000 + 17500
Rs. 87500
Selling Price per unit =Sales /No. of Units Sold
=87500/ 5,000
=Rs. 17.5
Contribution per unit = Selling price unit- Variable cost per unit
= 17.5-10 = 7.5
Sales =Total Cost + Profit
=70,000 + 17500
=Rs. 8,75,00
P/V Ratio = (Contribution per unit /Selling Price per unit) xl00
= 7.5/17.5x100
=42.86%
(i) Break-even Point (in units) = fixed cost/Contribution per unit
= 20000/7.5
= 2667 units
Break-even Point (in sales) =Fixed Cost /P/V Ratio
=20,000/42.86xl00

90
=Rs. 46663.56
(ii) Sales (in units) to earn a desired profit of Rs. 30,000
=Fixed Cost + Desired Profit
Contribution per unit
=20,000 + 30,000 = 6666.66 units.
7.5
Illustration 8
Profit volume ratio of a company = 25%
Margin of safety is 20%
Sales volume of the company =Rs. 25 lakhs
Find out its break-even point and net profit.
Solution
Method-I
Sales = Rs. 25, 00,000
Less: Margin of safety (20% of 25, 00,000) = Rs. 5,00,000
(i) Break-even point = Rs. 20, 00,000
P/V Ratio = 25%
Total Contribution = P/V Ratio x Sales
= 25% of 25, 00,000
= Rs. 625000
Less: Fixed Cost = Rs. 5, 00,000
(ii) Net Profit = Rs. 125000
Working notes
Break Even Point =Fixed Cost
P/V Ratio
Hence Fixed Cost = Break Even Point x P/V Ratio
= 20, 00,000 x 25 =RS. 5, 00,000
100
Method-II, for calculating net profit:
Margin of Safety Profit=Profit/P/V Ratio
Profit= Margin of Safety x p/V Ratio
= 5, 00,000 x 25 =RS. 125000
100
Illustration 9
The following figures are available at 31 March of 2007 and 2008:
2007 2008
Rs. (Lacs) Rs. (Lacs)
Sales 200 150
Profit 50 30

91
Calculate:
1. P/V ratio and total fixed expenses.
2. Break-even level of sales.
3. Sales required to earn a profit of Rs. 90 lakhs.
4. Profit or loss that would arise if the sales were Rs. 280 lakhs.
Solution
1. P/V Ratio = Difference in Profit / Difference in Sales
= 20/50 x100
= 40%
Applying P/V Ratio to the sales for the year ending 31st March, 2007
Contribution = 40% of 200 Lakhs
= Rs. 80 Lakhs
Fixed Cost = Contribution - Profit
= 80 Lakhs - 50 Lakhs
= Rs. 30 Lakhs.
Fixed cost of Rs. 30 lakhs would be obtained even if P/V Ratio is applied to the sales for the
year ending 31st March, 2008:
(b) Break-even level of Sales = Fixed Expenses/ P/V Ratio
=Rs. 30 lakhs/40%
= Rs. 75 Lakhs
(c) Sales to earn a profit of Rs. 90 lakhs =Fixed Cost + Required Profit
P/V Ratio
= Rs. 30 lakhs + Rs. 90 lakhs
40%
= Rs. 300 Lakhs
(d) Profit or loss that would arise if the sales were Rs. 280 Lakhs
Profit = Contribution - Fixed Expenses
= (P/V Ratio x Sales) - Fixed Expenses
= (40% x Rs. 280 lakhs) - Rs. 30 lakhs
= Rs. 82 lakhs.
5.15 Summary of the chapter
In this chapter few topics of marginal costing are covered and rest topics are covered in next
two chapters. Marginal or variable costing is a managerial technique of income determination
under which only variable cost is taken in consideration. Cost-volume-profit analysis is a
powerful tool of profit planning and break-even analysis is a widely used technique to study
CVP analysis. Break-even analysis is a widely used technique to study the cost-volume-profit
relationship. In the narrow sense, break-even analysis is concerned with determining break-
even point, i.e., that level of production and sales where there is no profit and no loss. At this
point total cost is equal to total sales revenue.

92
5.16 Exercise
Exercise 1: True or False
True or False
1. Absorption costing is a total cost technique.
2. Under absorption costing, inventory valuation is at total cost.
3. Variable costing is used mainly for internal reporting.
4. At break-even point, fixed cost is equal to contribution.
5. Cost volume profit analysis assumes that sales volume does not change.
1. True, 2. True, 3. True, 4. True, 5. False
Exercise 2: fill in the blanks
1. When fixed cost is Rs 5 lakhs, P/V ratio is 40%, then the break-even point is
Rs………..
2. When sales increase from Rs 20,000 to 40,000 while profit increase from Rs 1,000 to
Rs 2,000, P/V ratio is …………..
3. Break-even sales are 1000 units, fixed cost Rs 2000, contribution per unit is
Rs…………
4. Fixed cost is Rs 2000 and variable cost is 60% of sales, the break-even point is
Rs…………
5. When contribution is Rs 15000, P/V ratio 40%, the sales is Rs………..
Answer
(1) 12,50,000 (2) 5%, (3) Rs 2, (4) 5000, (5) Rs 37,500
Exercise 3: Multiple choice Questions
1) To obtain the break-even point in rupee sales value, total fixed costs are divided
by:
a) Variable cost
b) Profit/ volume ratio
c) Fixed cost per unit
2) The break-even point is the point at which:
a) total revenue is equal to total cost
b) Contribution margin is equal to total fixed cost
c) All of the above
3) CVP analysis is based on several assumptions. Which one of the following is not
one of these assumptions:
a) inventory quantities change during the year

93
b) The sales mix of the products is constant
c) Material prices and labour rates do not change
4) When sales volume increases
a) Total profit increases
b) Total loss increases
c) All of these
5) An increase in fixed cost results in
a) increase in break-even point
b) Increase in contribution
c) Increase in P/V ratio
Answer
1) b, 2) c, 3) a, 4) a, 5) a
Exercise 4: Consider the each of the following as independent situations, indicate whether P/V ratio
will increase, decrease or not change
1. an increase in sales quantity
2. an increase in fixed cost
3. a 10% increase in both selling price and variable cost per unit
4. A 50% increase in variable cost per unit and 50% decrease in fixed cost.
5. A decrease in contribution.
Answer
1. No change, 2. No change, 3. No change, 4. Decrease, 5. Decrease

94
LESSON 6
MARGINAL COSTING-II
6.0 Introduction
6.1 Objectives
6.2 Meaning of Margin of Safety
6.3 Introduction of Break-even Chart
6.4 Uses of break-even chart
6.5 Assumptions Regarding Break-even Chart
6.6 Steps in Preparing Break-even Chart
6.7 Angle of incidence
6.8 Types of Break-Even Charts
6.9 Advantages of Break-Even Analysis and Chart
6.10 Specific Applications Break-Even Chart and Analysis
6.11 Limitations of Break-Even Chart
6.12 Cost Break-Even Point
6.13 Composite Break-Even Point
6.14 Cash Break-Even Point
6.15 Summary of the chapter
6.16 Exercise
6.1 Objectives
After studying this chapter, students would be able to:
• Understand the Margin of Safety and Break-even Chart
• Explain the Uses of break-even chart and Assumptions Regarding Break-even Chart
• Understand the Steps in Preparing Break-even Chart and Angle of incidence
• Understand the Types of Break-Even Charts and Advantages of Break-Even Analysis
• Understand Specific Applications Break-Even Chart and Analysis
• Limitations of Break-Even Chart
• Understand Cost Break-Even Point, Composite Break-Even Point and Cash Break-
Even Point
6.2 Margin of Safety
Margin of safety is the difference between total sales and the sales at breakeven, point.
Margin of safety may be calculated as under:
Margin of Safety = Total Sales - Sales at B.E.P.
or
Margin of Safety = Profit/ PV Ratio

95
Margin of Safety (as a percentage) = Margin of Safety xl00
Total Sales
Margin of safety indicates the soundness of the business. A high margin of safety indicates an
extremely favorable position of the firm in the market since even with a substantial decline in
sales, the firm will continue to earn profit. If the margin of safety is small, any decline in
sales may touch BEP and finally results into a loss. Since higher margin of safety implies
higher strength of the business, the management of the concern would like to improve its
margin of safety by :
(a) Increasing the selling price if the market permits.
(b) Increasing the volume of sales if capacity is available for increasing the production.
(c) Reducing the variable costs.
(d) Reducing the fixed costs.
(e) Switching the production to more profitable products.
Illustration 1
Rs.
Sales 5, 00,000
Fixed Costs 150000
Profit 1, 00,000
Compute break-even sales and margin of safety:
Solution
Contribution = Fixed Costs + Profit
= 150000 + 1, 00,000
= 250000
P/V Ratio =Contribution x 100
Sales
=(250000 /5,00,000)x100
=50 %
(i) Break-even Sales =Fixed Costs / P/V Ratio
=150000xl00 = Rs. 3,00,000
50
(ii) Margin of Safety = Actual Sales - Break-even Sales
= 5,00,000-3,00,000
= Rs. 2,00,000
Alternatively,
Margin of Safety =Profit/ P/V Ratio
=1,00,000x100
50
= Rs. 2,00,000.

96
Illustration 2
Profit =Rs. 30,000
Marginal cost = Rs. 4 per unit
Selling price = Rs. 5 per unit
Find out the amount of 'Margin of Safety'.
Solution
Selling Price per unit = Rs. 5
Marginal Cost per unit = Rs. 4
Contribution per unit (5-4) = Rs. 1
P/V Ratio = Contribution per unit xl00
Selling Price per unit
= (1/5)x100
=20%
Margin of safety = Profit
P/V Ratio
=(30,000/20)x100
= Rs. 150000
Illustration 3
The profit volume ratio = 25%
and the margin of safety = 20%.
calculate the net profit if the sales volume is Rs. 50000.
Solution
P/V Ratio = 25%
Margin of Safety = 20%
% Break - even Sales = 100 %- Margin of Safety
= 80% of Present Sales
= 80 % Rs. 50000 = 40,000
Break-even sales =Fixed Cost/P/V Ratio
40,000 =Fixed Cost/25%
Fixed Cost = 25% of 40,000
=Rs. 10,000
Profit =Contribution - Fixed Cost
=25% of 50000 - 10,000 = Rs. 2500
Margin of Safety =Profit / P/V Ratio
20% =Profit /25%
Profit =20 x 25 x100= 5% of Sales
100 x 100
Profit = 5% of 50000 = Rs. 2500.

97
Illustration 4
Rs.
Sales 10,000
Total Cost 8000
Variable Cost 6000
calculate:
(i) Break-even Sales.
(ii) Margin of Safety, and
(iii) Sales to earn a profit of Rs. 2,000.
Solution
Sales =10,000
Variable Cost =6,000
Contribution =4,000
Fixed Cost = Total Cost - Variable Cost
=8,000- 6,000 = Rs. 2,000
Profit =Contribution - Fixed Cost
=4,000 - 2,000 = Rs. 2,000
P/V Ratio =(Contribution/sales )x100
= (4000/10000)x100=40%
(i) Break-even Sales =Fixed Costs/ P/V Ratio
=(2000/40)x100
= Rs. 800
(ii) Margin of Safety =Actual Sales - BEP Sales
=10,000- 800 =Rs. 9200
Alternatively,
Margin of Safety = profit/ P/V Ratio
= (2000/40)x100
=Rs. 800
(iii) Sales to earn a profit of Rs. 2,000
=Fixed Cost + Desired Profit
P/V Ratio
=2,000 + 2,000x100
40
=(4,000/40)x100
=RS. 10,000.

98
Illustration 5
ABC LTD manufactures cycles. The cost structure of a cycle is as under:
Material = Rs. 25
Labour = Rs. 40
Variable Overheads = 50% of labour
Fixed overheads = Rs. 120 lakhs per annum
Sale Price = Rs. 115
(a) Calculate the number of cycles that have to be manufactured and sold in a year to
break-even.
(b) How many cycles have to be sold to make a profit of Rs. 50,000 per year?
(c) Suppose sale price is decreased by Rs. 8 each, how many cycles have to be sold to
break-even?
Solution
Sale Price per cycle 115
Less: Marginal Cost per motor
Material 25
Labour 40
Variable overhead (50% of Rs. 40) 20 = Rs. 85
Contribution per unit =115- 85
= Rs. 30
Fixed overheads per year = Rs. 1, 20,000
(a) B.E.P. (units) =Fixed Cost
Contribution per unit
= 120000/30
= 40000 cycles
(b) Sales to earn a profit of Rs. 1 lakh = Fixed Cost+1,00,000
Contribution per unit
= 1,20,000 + 50,000
30
= 1,70,000
30
= 5667 cycles
(c) Revised Selling Price = 115- 8 = Rs. 107
Marginal Cost = Rs. 85
Revised Contribution = New Selling Price - Marginal Cost
= 107-85
= 22
Revised B.E.P. (units) = Fixed Cost /Contribution per unit
= 1,20,000
22
= 5455cycles

99
Illustration 6
Two Companies ABC Ltd. and XYZ Ltd. sell the same type of product in the same market.
The forecasted Profit and Loss Accounts for the year 2011-12 are as follows:
ABC Ltd. XYZ Ltd.
Rs. Rs. Rs. Rs.
Sales 10,00,000 10,00,000
Less: Variable Cost of Sales 8,00,000 6,00,000
Fixed Costs 100,000 9,00,000 3,00,000 9,00,000
Forecasted Net
Profit before tax 100,000 100,000
You need to determine which company is likely to earn greater profits in conditions of:
(a) Low demand, and
(b) High demand.
Solution
(a) In the conditions of low demand, a company having low BEP and fixed cost i.e.
higher margin of safety is more profitable. So ABC LTD Limited is more profitable in case
of low demand because its margin of safety is higher. Even if the sale is reduced to 50% due
to low demand, it will not incur any loss.
Particulars ABC Ltd. XYZ Ltd.
Sales Rs. 10,00,000 Rs. 10,00,000
Variable Cost Rs. 8,00,000 Rs. 6,00,000
Contribution (Sales - Variable
Cost)
Rs. 2,00,000 Rs. 4,00,000
Fixed Costs Rs. 100,000 Rs. 3,00,000
Profit (Contribution - Fixed
Cost)
Rs. 100,000 Rs. 100,000
P/V Ratio = Contributionx100
Sales
2,00,000 x100
10,00,000
4,00,000x100
10,00,000
= 20% = 40%
BEP Sales = Fixed Cost
P/V Ratio
100,000 x100
20
3,00,000x100
40
= Rs. 5,00,000 = Rs. 7,50,000
Margin of Safety
= Actual Sales - BEP Sales 10,00,000-
5,00,000
10,00,000-7,50,000
= Rs. 5,00,000 Rs. 2,50,000

100
(b) In the conditions of high demand, a company having high P/V Ratio is more
profitable. SoXYZ Ltd. is more profitable as its P/V Ratio is higher (40%) as compared to
ABC Ltd. (20%). XYZ Ltd. will earn 40% of the additional sales as profit while ABC Ltd
will earn only 20% of the increased sales.
Illustration 7
A company budgets for a production of 1,50,000 units. The variable cost per unit is Rs. 14
and fixed cost is Rs. 2 per unit. The company fixes its selling price to fetch a profit of 15% on
cost.
(i) What is the break-even point?
(ii) What is the profit-volume ratio?
(iii) If it reduces its selling price by 5%, how does the revised selling price affect the
break-even point and the profit-volume ratio?
(iv) If a profit increase of 10% is desired more than the budget, what should be the sales at
the reduced price?
Solution
Variable Cost per unit = Rs. 14.00
Fixed Cost per unit = Rs. 2.00
Total Cost per unit = Rs. 16.00
Profit (15% of Rs. 16) = Rs. 2.40
Selling price per unit = Rs. 18.40
Contribution per unit (18.40-14) = Rs. 4.40
(i) B.E.P. (in units) = Fixed Cost
Contribution per unit
= 1,50,000x2
4.40
= 68,182 units (approx)
B.E.P. (in volume) = Fixed Cost / P/V Ratio
= (1,50,000/23.91)x100
= Rs. 12,54,549 (approx)
(ii) P/V Ratio = Selling Price per unit x 100
Contribution per unit
= (4.40/18.40)x100=23.91%
(iii) New Selling Price = 18.40-5%
= Rs. 17.48
New Contribution = 17.48-14= Rs. 3.48
New BEP (units) = 3,00,000/ 3.48
= 86,207 units
New P/V Ratio = (3.48/17.48)x 100=19.90%
(iv) Budgeted Profit (1,500,000 x 2.40) = Rs. 3,60,000
Add: 10% increase = Rs. 36,000

101
New Profit =Rs. 3,96,000
Sales (in units) for a profit of Rs. 3,96,000
= Fixed Cost + Profit
Contribution per unit
= 3,00,000 + 3,96,000
3.48
= 2,00,000
Sales (in Rs.) for a profit of Rs. 3,96,000
= Break-even units x Selling Price Per unit
= 2,00,000 x 17.48 = Rs. 34,96,000.
Illustration 8
A retail dealer in garments is currently selling 24,000 shirts annually. He supplies the
following details for the year ended 31st March, 2008:
Rs.
Selling price per shirt 40
Variable cost per shirt 25
Staff salaries for the year 1,20,000
General office costs for the year 80,000
Advertising costs for the year 40,000
As a cost accountant of the firm, you are required to answer the following each part
independently:
(i) Calculate the break-even point and margin of safety in sales revenue and number of shirts
sold.
(ii) Assume that 20,000 shirts were sold in year, find out the net profit of the firm.
(iii) If it is decided to introduce selling commission of Rs. 3 per shirt, how many shirts would
require to be sold in a year to earn a net income of Rs. 15,000?
(iv) Assuming that for the year 2008-09 an additional staff salary of Rs. 33,000 is anticipated,
and price of a shirt is likely to be increased by 15%, what should be the break-even point in
number of shirts and sales revenue?
Solution
Selling Price per shirt = Rs. 40
Variable Cost per shirt = Rs. 25
Contribution per unit = Rs. 15
P/V Ratio = Contribution per unit x100
Selling price per unit
= (15/40) x100=75%
2
Fixed Cost (1,20,000 + 80,000 + 40,000) = Rs. 2,40,000
(i) Break-even Point (in units) = Fixed cost
Contribution per unit
= 2,40,000
15

102
= 16,000 shirts
B.E.P (in sales revenue) = Fixed Cost
P/V Ratio
= 2,40,000x2xl00
75
= Rs. 6,40,000
Margin of Safety (in units) =Actual Sales - B.E.P. Sales
=24,000 - 16,000
=8,000 units
Margin of safety (in sales revenue) =Actual Sales - B.E.P. Sales
=9,60,000 - 6,40,000
= Rs. 3,20,000
(ii) Profit on the sale of 20,000 shirts =Contribution on 20,000 shirts
-Fixed Cost
= 15 x 20,000-2,40,000
= Rs. 60,000
(iii) Revised Variable Cost per shirt = Previous variable cost per shirt + Commission
= 25 + 3 = Rs. 28
New contribution per shirt =40-28 = Rs. 12
Sales (in units) for a profit of Rs. 15,000 = New Fixed cost
New Contribution Per unit
= 1,40,000+ 15,000
12
= 21,250 shirts
(iv) New Selling Price (Rs. 40 + 15%) = Rs. 46
New Contribution (46 - 25) = Rs. 21
New Fixed Cost (2,40,000 + 33,000) = Rs. 2,73,000
New Break Even Point (in units) = New Fixed Cost
New Contribution per unit
= 2,73,000
21
= 13,000 shirts
New B.E.P. (in sales revenue) = 13,000 x 46 = Rs. 5,98,000.
6.3 Break-even Chart
Break-even chart is the graphic of break-even analysis. This chart takes its name from the fact
that the point at which the total cost line and the sales line intersect is the break-even point. It
is the presentation of the relationship between cost, volume and profit. It depicts the point of
production at which there is no profit and no loss i.e. break-even point. It not only shows the
break-even point but also shows profit and loss at various levels of activity. According to
CIMA (chartered institute of management accountant), “a chart which shows profit or loss at
various levels of activity, the level at which neither profit nor loss is shown being termed as
break-even point”.

103
6.4 Uses of break-even chart
A break-even chart is used to get the following information
• Break-even point- the point where there is no profit or loss.
• To know the profit or loss at different levels of output.
• The relationship between variable cost, fixed cost and total cost.
• To know the margin of safety.
• The angle of incidence, indicating the rate at which profit is being made.
• The amount of contribution at various levels of sales.
6.5 Assumptions Regarding Break-even Chart
Following are the assumptions on which break-even graph (chart) are drawn:
1. Costs can be categorized into fixed and variable costs.
2. Fixed costs will be fixed i.e. static during the relevant range of graph.
3. During the relevant range of graph variable cost per unit will remain constant.
4. Change in the volume of sales will not affect selling price per unit. In other words,
selling price per unit will be constant
5. Sales mix will be constant.
6. Production and sales volume are equal.
7 The relationship between costs and revenue will be linear i.e. all are indicated by
way of straight lines.
6.6 Steps in Preparing Break-even Chart
Following are the steps in preparing break-even chart:
1. There are two sides on a graph which are known as "axis". The horizontal side at the
bottom of the graph is X-axis which shows the volume of output (units, in rupees
value, in percentage etc.). The vertical side is the Y-axis which shows the cost and
sales in rupee value.
2. Preferably the graph should be in the square form. Both the areas are drawn on the
basis of appropriate scale.
3. Production quantity and cost and sales are inserted on X-axis and Y-axis respectively.
4. Fixed cost line is drawn parallel to the X-axis because fixed costs remain the same.
5. The total cost line is drawn above the fixed cost line. For this purpose, the variable
cost is added to the fixed cost.
6. Sales line is drawn beginning at zero and finishing at the last point.
7. The point at which the sales line cuts the total cost line is known as Break-even Point.
When a line is drawn from Break-even Point to X-axis, it indicates Break-even Point
(units) and when a line is drawn from Break-even Point to Y-axis, it indicates Break-
even Point (sales volume).
8. The difference between the sales line and the total cost line to the left of Break-even
Point indicates the loss while to the right of Break-even Point indicates the profit.
6.7 Angle of incidence
Angle of incidence is formed by the intersection of sales line and the total cost line at break-
even point. It shows the rate at which profits are being earned once break-even point has been

104
reached. The wider the angle, the greater is the rate of earning profits and a smaller angle of
incidence indicates that the profits are being made at a lower rate. It is formed to the right of
break-even point and graphical representation of profitability.
Illustration 9
Prepare the break-even chart from the following information:
Fixed Cost Rs. 2,000
Variable Cost per unit Rs. 0.50
Selling Price per unit Rs. 1
Solution
Break-even Chart Table
Output Fixed cost Variable cost Total Cost Sales Profit
(Units) (.Rs.) (Rs.) (Rs.) (Rs.) (Rs.)
Zero 2,000 Zero 2,000 Zero -2,000
2,000 2,000 1,000 3,000 2,000 -1,000
4,000 2,000 2,000 4,000 4,000 Zero
6,000 2,000 3,000 5,000 6,000 1 000
8,000 2,000 4,000 6,000 8,000 2,000
10,000 2,000 5,000 7,000 10,000 3,000
6.8 Types of Break-Even Charts
Following are the important of types of break-even charts:
1. Simple Break-Even Chart: it is a traditional break-even chart which shows direct
cost line, variable cost line and the sales line. This chart is used to determine profit or
loss from a certain level of sales. There are two ways of drawing a break-even chart:
➢ Fixed cost line, total cost line and sales line are drawn.

105
➢ Variable cost line, total cost line and sales line are drawn.
2. Contribution Break-Even Chart: It is an alternate type of break-even chart and
shows the amount of contribution at different levels of output. Under this chart, sales
line and variable cost line are drawn. The difference between sales line and variable
cost line shows the contribution at the different levels of activity. Total cost line is
drawn parallel to the variable cost line. Difference between the variable cost line and
total cost line shows the fixed cost.
3. Analysis Break-Even Chart: It shows the greater details by breaking down fixed
and variable into sub-divisions. Variable costs may be classified into direct material,
direct wages, variable factory overheads, selling and distribution overhead, etc. fixed
costs may be divided into fixed factor overhead and fixed administration, selling and
distribution overhead.
4. Control Break-Even Chart: Such a graph is prepared when budgeting control
system is followed by the enterprise. Budgeted direct costs, budgeted variable costs
and budgeted sales are also plotted on the graph in addition to actual sales. This graph
facilitates the comparison of budgeted and actual profits, break-even point and sales.
5. Profit Volume Chart: It is an improved form of simple break-even chart. The sales
line is drawn horizontally and profit loss line or drawn vertically. The profit line is
plotted on the basis of difference between sales revenue and total cost at each volume.
At break-even point, profit line intersects sales line.
6.9 Advantages of Break-Even Analysis and Chart
The main advantages of break-even analysis and break-even chart are given below
1. It shows the relationship between the cost, volume and profit.
2. Break-even chart is act as a management guide for decision-making as it shows
relationship between cost, volume and profit.
3. It shows the profit for different sales volumes and the sales volume to produce
desired profit.
4. It stresses the importance of optimum capacity utilization for achieving cost
reduction.
5. It is used for forecasting plans and profit.
6. It provides detailed and clear information about the elements of cost, sales and
profit.
7. It may be used for controlling costs and achieving better efficiency.
6.10 Specific Applications Break-Even Chart and Analysis
Following are the more specific applications
1. Operating profit at a given level of sales volume.
2. Sales volume required to produce desired profit.
3. Effect of changes in variable cost or fixed cost or both.
4. Effect of multiple changes i.e. changes in cost, price and volume simultaneously.
5. Effect on operating profits of a given percentage change in sales.
6. Additional sales volume required to compensate reduction in selling price.

106
6.11 Limitations of Break-Even Chart
Following are the Limitations
1. There is an assumption that variable costs will always vary proportionately but it is
not correct always.
2. There is an assumption that fixed costs will always remain constant but it does not
hold good in every business concern and at all levels of production.
3. The assumption that all cost can be clearly separated into fixed and variable
components is not possible to achieve accurately in practice, thereby resulting in
inaccurate break-even analysis.
4. It is assumed that production and sales are synchronized. This is not always so.
Sales may fall short of production or may be capable of increase to match production
only by effecting a reduction in selling prices.
5. Break-even chart does not consider the capital employed, market aspects, effects of
government policy etc. which are very important factors for measuring profitability.
6. Break-even chart represents a static picture of the operations. In real life, business
operations are not static.
6.12 Cost Break-Even Point
Cost break-even point is a point where the costs of operating two alternatives is equal. Cost
break-even point helps the management in identifying which alternative is better to operate at
or a given level of output. Cost break-even point may be calculated as under:
Cost Break-Even Point = Difference in Fixed Costs
Difference in Variable Cost per unit
6.13 Composite Break-Even Point
The composite break-even point shows the break even sales of the company for all its
products taken together. This concept is applicable only in case of a multi-product. The firm
would like to compute the break-even point of the company as a whole.
Formula
Composite Break-Even Point (sales) = Total Fixed Costs / Composite P/v Ratio
Composite P/V Ratio = Total Contribution / Total Sales xl00
6.14 Cash Break-Even Point
It is the level of sales required to recover the entire cash costs. At this level of sales, the total
sales revenue is equal to total cash costs so that there is neither any cash profit nor cash loss.
In other words, it is the level of output where a cash break even i.e. there is "no cash profit
and no cash loss". The fixed costs are divided into cash fixed cost and non-cash fixed cost.
Cash break-even point is used to know the liquidity position of the firm i.e. firm's ability to
meet cash obligations. The management ascertains the level of activity below which there are
chances of insolvency.
Algebraically
Cash Break-Even Point (in units) = Cash Fixed Cost / Contribution per unit

107
Cash Break-Even Point (sales volume) = Cash Fixed Cost / P/V Ratio
Graphically, the cash break-even point is determined at the point of meeting of total
cash cost line and total sales line. The area to the left of point signifies cash losses and
area on the right side indicates cash profits.
Illustration 10
Fixed expenses = 2,25,000
Sales = 7,50,000 and
Earned a profit = 1,50,000 (during the first half year)
loss = 1,25,000(during second half, it suffered a loss)
you are required to find out:
(i) The profit-volume ratio, break-even point and margin of safety for the first half year.
(ii) Expected sales-volume for the second half year assuming that selling price and fixed
expenses remained unchanged during the second half year.
(iii)The break-even point and margin of safety for the whole year.
Solution
(i) In the first half year
Contribution = Fixed Cost + Profit
= 2,25,000 + 1,50,000
=Rs. 3,75,000
P/V Ratio =Contribution / Sales
= 375000 / 750000x 100
= 50%
Break-even Point = Fixed Cost / P/V Ratio
= 2,25,000 / 50% = Rs. 4,50,000
Margin of Safety =Actual Sales - BEP Sales
=750000-450000
= Rs. 3,00,000
(ii) In the Second half year
Contribution = Fixed Cost - Loss
= 2,25,000- 1,25,000
= Rs. 1,00,000
Expected Sales volume =Fixed Cost – Loss
P/V Ratio
= 2,25,000-125000
50%
= Rs. 2,00,000

108
(iii) For the whole year
BEP =Fixed Cost /P/V Ratio
=2,50,000 x 2
50%
= Rs. 9,00,000
Margin of safety = Profit / P/V Ratio
=1,50,000-1,25,000
50%
=Rs. 50,000.
Illustration 11
A company has annual fixed costs of Rs. 14,00,000. In 2007-08 sales amounted to Rs.
60,00,000 as compared with Rs. 45,00,000 in 2006-07 and profit in 2007-08 was Rs.
4,20,000 higher than in 2006-07:
(i) At what level of sales does the company breakeven?
(ii) Determine profit or loss on a precast sales volume of Rs. 80,00,000.
(iii) If there is a reduction in selling price in 2007-08 by 10% and the company desires to
earn the same profit as in 2006-07 what would be the required sales volume?
Solution
Sales in 2007-08 Rs. 60,00,000
Sales in 2006-07 Rs. 45,00,000
Increase in Sales (60,00,000 - 45,00,000) Rs. 15,00,000
Increase in Profit Rs. 4,20,000
PA/ Ratio = Increase in Profit x100
Increase in Sales = 4,20,000 x100 =28%
15,00,000
Fixed Cost = Rs. 14,00,000
(i) Break-even Sales = Fixed Cost / P/V Ratio
= 14,00,000x100
28
= Rs. 50,00,000
Present Sales Volume = Rs. 80,00,000
(ii) Profit on Present Sales Volume = Contribution - Fixed Cost
= Sales x P/V Ratio - Fixed Cost
=80,00,000 x28 -14,00,000
100
= 22,40,000-14,00,000
= Rs. 8,40,000

109
Profit earned in 2007-08 = Sales x PV/ Ratio-Fixed Cost
=60,00,000 x 28-14,00,000
100
= 16,80,000- 14,00,000
= Rs. 2,80,000
In 2007-08 reduction in sales price = 10%
Therefore sales at reduced prices = 60,00,000-6,00,000
= Rs. 54,00,000
Contribution at reduced prices = Contribution at original prices -
Decline in sales)
= 16,80,000-6,00,000
= Rs. 10,80,000
New P/V Ratio = Contributionx100
Sales
= 10,80,000 x100
54,00,000
=20%
Sales to earn profit of 2,80,000 = Fixed Cost+ 2,80,000
P/V Ratio
=14,00,000 + 2,80,000x100 20
=16,80,000x100
20
= Rs. 84,00,000.
6.16 Summary of the chapter
Margin of safety is the difference between total sales and the sales at breakeven,
point. Margin of safety indicates the soundness of the business. Break-even chart is the
graphic of break-even analysis. This chart takes its name from the fact that the point at which
the total cost line and the sales line intersect is the break-even point. It is the presentation of
the relationship between cost, volume and profit. Angle of incidence is formed by the
intersection of sales line and the total cost line at break-even point. It shows the rate at which
profits are being earned once break-even point has been reached. It is formed to the right of
break-even point and graphical representation of profitability. Break-even chart is act as a
management guide for decision-making as it shows relationship between cost, volume and
profit. Break-even chart does not consider the capital employed, market aspects, effects of
government policy etc. which are very important factors for measuring profitability. Cost
break-even point is a point where the costs of operating two alternatives are equal. Cost
break-even point helps the management in identifying which alternative is better to operate at
or a given level of output. The composite break-even point shows the break even sales of the
company for all its products taken together. This concept is applicable only in case of a multi-
product. It is the level of sales required to recover the entire cash costs. At this level of sales,
the total sales revenue is equal to total cash costs so that there is neither any cash profit nor
cash loss.

110
6.17 Exercise
Exercise 1: True or False
True or False
1. Margin of safety can be improved by lowering fixed cost.
2. Break-even chart does not show profit or loss at various levels of sales.
3. In a break-even chart, angle of incidence is formed at the intersection of sales line and
variable cost line.
4. In a break-even chart, on X-axis production or sales may be represented.
5. Angle of incidence is an angle that is formed at the intersection of sales line and total
cost line in a break-even chart.
Answer
1. True 2. False 3. False 4. True 5. True
Exercise 2: Fill in the blanks
1. Break-even point is Rs 10,000, the fixed cost is Rs 3000, P/V ratio
is……………
2. Fixed cost Rs 4000, profit Rs1000, break-even sales Rs 20,000, the P/V ratio
is………..
3. Profit is 10% of sales, margin of safety is 40%, P/V ratio is………
4. When BE point is Rs 20,000 and margin of safety is 20%, actual sales are
Rs…………
5. When Contribution is Rs 15000, P/V ratio 40%,the sales is Rs………..
Answer
1. 30%, 2. 20%, 3. 25%, 4. 25000, 5. Rs 37,500
Exercise 3: Multiple choice Questions
1. On break-even chart, X-axis represents,
a) sales in units/Rs
b) Output in units
c) any of these
2. Margin of safety refers to as:
a) Excess of actual sales over break-even sales
b) Excess of actual sales over fixed expenses
c) excess of actual sales over variable expenses
3. When sales increase from Rs 40,000 to 50,000 and profit increases by Rs. 5000,
the P/V ratio is
a) 50%
b) 10%
c) 20%
4. An increase in fixed cost results in
a) increase in break-even point
b) increase in contribution

111
c) increase in margin of safety.
5. when sales volume increases
a) Total cost increases
b) break-even point increases
c) Total loss increases
Answer
1. c, 2. a, 3. a, 4. a, 5. a
Exercise 4: Short Questions
Q1. What is meant by "Direct Costing" or "Marginal Costing"? Describe the salient
features in practice.
Q2. What are the similar and distinguishing features in Direct and Absorption Cost
Accounting?
Q3. What are the advantages and disadvantages of Direct/Marginal Costing? How does it
help a management in its policy decisions? Q4. What is a "Break-Even-Volume? Q5. What are the assumptions to be made in the calculation of a break-even point?
Q6. Illustrate what is meant by a "Break-Even Chart"? What does it indicate? Is there any
difference between "Break-Even Chart" and "Volume-Cost-Profit " Chart?
Q7. (a) What do you understand by the term "Margin of Safety" with reference to a
volume of production?
(b) How do the following reflect on a break-even volume and on a
profit-volume ratio ?Increase in total fixed costs,
(i) Increase in physical sales,
(ii) Decrease in variable cost per unit,
(iii) Discount on the selling price,
(iv) Unfavourable variation in material prices, and
(v) Adverse fluctuation in wages rates of Direct Labour.
Q8.Explain with illustrative examples the concept of Fixed Cost and Variable Cost.
Q9. Selling Price is Rs. 10 & VC is Rs. 6 Per unit while the FC is Rs. 20,000 find.
1) CPU
2) P V r a t i o
3) BEP
4) BES
5) BEP to earn Rs. 80,000 Profit
6) BES to earn a Profit of Rs. 80,000
Q 10. Sales (100000 units) = Rs. 1L
VC = Rs. 40K
FC = RS. 50K
Find (1) PV Ratio, BEP & MOS
(2)Find the impact of the following on Pv ratio, BEP & MOS
a) 20% increase in sales volume
b) 10% increase in FC
c) 5% Decrease in VC
d) 10% increase in selling Price.
112
LESSON 7
MARGINAL COSTING-II
7.0 Introduction
7.1 Objectives
7.2 Meaning of decision-making
7.2.1 pricing decision
7.2.2 Make or buy decision
7.2.3 Product mix decision
7.3 Key Factor
7.4 Summary of the chapter
7.5 Exercise
7.1 Objectives
After studying this chapter, students would be able to:
• Understand the concept of decision-making
• Explain the Uses of
-pricing decision
-Make or buy decision
-Product mix decision
• Understand the concept of Key Factor
7.2 Decision-Making
Decision making is one of the important aspects which decides the success or failure of any
enterprise. A business has to take the decisions in the different complex situations. Decision
making is the process of selecting the best alternative among the different choices available in
order to attain the desired objectives. According to CIMA, "its special value is in recognizing
cost behavior and, hence, in assisting in decision-making." Marginal costing is a decision-
making technique especially for short-run or tactical decisions.
Following are some of the specific areas where marginal costing is extensively used as a
decision-making technique:
(i) Pricing decision
(ii) Make or buy decision
(iii) Product mix decision.
7.2.1 Pricing Decision
Pricing of a product is the most crucial decision. Price affects sales volume which, in turn,
determines the revenue and profit of the company. There are a quite number of prices which a

113
company can fix. Pricing decision is influenced by a number of factors, some of them are
given as under:
(i) Cost
(ii) Competition
(iii) Objective of the company
(iv) Nature of the product
(v) Nature of the demand for the product
(vi) Government regulations.
Every company will like to maximize its profit. Hence, price of a product has to be more than
its total cost i.e. variable costs plus fixed costs. This is known as "cost plus pricing." Thus
Price = Variable costs + Fixed costs + Profit.
The underlying theory of marginal costing is that the revenue of a product should be more
than its variable cost so that it may contribute towards recovering fixed costs and providing
profits. Once the fixed costs are recovered at a particular level of production, the additional
units of production would contribute towards profit. The marginal cost sets the lower limit to
price fixation. The minimum selling price should not be below marginal cost. Under this
situation, the figure of loss will be equal to the amount of fixed cost. Fixed cost will have to
be incurred irrespective of production or no production.
A company would not like to follow the alternative of suspending the production of the
product. When a company decides to suspend the production of the product, the company
will suffer a loss equal to fixed cost because fixed cost cannot be avoided. Hence, the primary
interest of the company is fix the price equal to or more than the marginal cost.
Thus
Price > Marginal cost
or
Price = Marginal cost.
Sometimes, selling price falls below the marginal cost. In such a case, the company will
suffer a loss more than the amount of fixed cost. Under this situation, a company has an
alternative to stop production so as to reduce the amount of loss upto fixed cost. However,
under following special circumstances, a company may decide to continue production even if
the price is less than marginal cost:
I. When the product is of perishable nature and company wants to avoid total loss by
disposing the product.
II. When the company introduces a new product in the market (because a new
product can be sold at a very low price)
III. When there is a cut-throat competition in the market and company wants to drive
out its competitors.
IV. When the company wants to export the product.
V. When the employees cannot be retrenched.
VI. When the sale of this product at a price below the marginal cost will push up the
sale of other profitable products. (The loss of this product will be made up by
profits other products)

114
VII. When suspension of production and re-opening of production requires a heavy
expenditure.
Students should note that reduction in price leads to reduction in contribution per unit.
Illustration 1
ABC Ltd. manufactures a document reproducing machine which has a variable cost structure
as follows:
Material Rs. 20
Labour Rs. 5
Overhead Rs. 2
Selling price Rs. 45
Sales Rs. 6,75,000
(during the current year are expected to be)
and fixed cost Rs. 70,000.
Under a wage agreement, an increase of 5% is payable to all direct workers from the
beginning of the forthcoming year, whilst material costs are expected to increase by 4% ,
variable overhead costs by 2.5% and fixed overhead costs by 1.5%.
You are required to calculate the new selling price if the current Profit/ Volume Ratio is to be
maintained.
Solution
Computations of New Selling Price
Cost Element Variable cost Increase Variable Cost for
for current forth-coming
year year
Rs. Rs.
Material 20 4% 20.8
Labour 5 5% 5.25
Overhead 2 2.5% 2.05
Total variable cost 27 28.1
Selling price 45
Contribution (45 - 27) 18
Current year's P/V Ratio = Contribution per unit x 100
selling price per unit
= (Rs 18/ Rs 45)x100
= 40%
Thus, the current year's marginal cost is 60% of the selling price of Rs. 45. In order to
maintain the current Profit/Volume ratio of 40% in the forthcoming year, the new selling
price should be:
Rs. 28.10 x 100
60 = Rs. 46.833
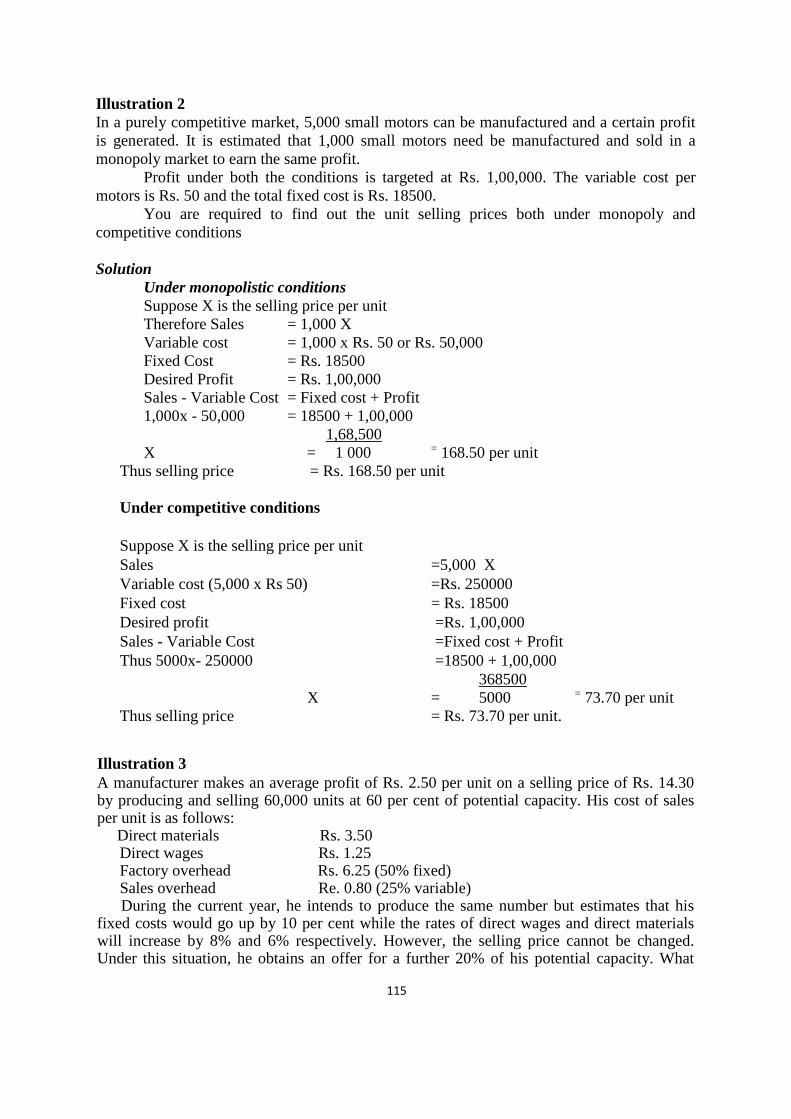
115
Illustration 2
In a purely competitive market, 5,000 small motors can be manufactured and a certain profit
is generated. It is estimated that 1,000 small motors need be manufactured and sold in a
monopoly market to earn the same profit.
Profit under both the conditions is targeted at Rs. 1,00,000. The variable cost per
motors is Rs. 50 and the total fixed cost is Rs. 18500.
You are required to find out the unit selling prices both under monopoly and
competitive conditions
Solution
Under monopolistic conditions
Suppose X is the selling price per unit
Therefore Sales = 1,000 X
Variable cost = 1,000 x Rs. 50 or Rs. 50,000
Fixed Cost = Rs. 18500
Desired Profit = Rs. 1,00,000
Sales - Variable Cost = Fixed cost + Profit
1,000x - 50,000 = 18500 + 1,00,000
1,68,500
X = 1 000 = 168.50 per unit
Thus selling price = Rs. 168.50 per unit
Under competitive conditions
Suppose X is the selling price per unit
Sales =5,000 X
Variable cost (5,000 x Rs 50) =Rs. 250000
Fixed cost = Rs. 18500
Desired profit =Rs. 1,00,000
Sales - Variable Cost =Fixed cost + Profit
Thus 5000x- 250000 =18500 + 1,00,000
368500
X = 5000 = 73.70 per unit
Thus selling price = Rs. 73.70 per unit.
Illustration 3
A manufacturer makes an average profit of Rs. 2.50 per unit on a selling price of Rs. 14.30 by producing and selling 60,000 units at 60 per cent of potential capacity. His cost of sales per unit is as follows: Direct materials Rs. 3.50
Direct wages Rs. 1.25 Factory overhead Rs. 6.25 (50% fixed) Sales overhead Re. 0.80 (25% variable) During the current year, he intends to produce the same number but estimates that his
fixed costs would go up by 10 per cent while the rates of direct wages and direct materials will increase by 8% and 6% respectively. However, the selling price cannot be changed. Under this situation, he obtains an offer for a further 20% of his potential capacity. What

116
minimum price would you recommend for acceptance of the offer to ensure the manufacturer an overall profit of Rs. 1,67,300?
Solution
Statement of Marginal Cost and Profit
Direct materials
Direct wages
Variable overhead -
factory
sales
3.500
1.250
3.125
0.200
2,10,000
75,000
1,87,500
12,000
Per unit Rs.
60,000 units Rs.
Sales (A) 14.300 8,58,000
Marginal cost (B) 8.075 4,84,500
Contribution (C = A - B) 6.225 3,73,500
Fixed overhead -
factory
sales
3.125
0.600
1,87,500
36,000
Total fixed cost (D) 3.725 2,23,500
Profit (C - D) 2.500 1,50,000
Statement of Marginal Cost and Profit
(For current year)
Per unit Rs.
60,000 units Rs.
Sales (A) 14.300 8,58,000
Direct materials
Direct wages
Variable overhead -
Factory
Sales
3.710
1.350
3.125
0.200
2,22,600
81,000
1,87,500
12,000
Marginal cost (B) 8.385 5,03,100
Contribution (C = A - B)
Fixed cost (D) (Rs. 22,3,500 + 10%)
3,54,900
2,45,850
Profit (C - D) 1,09,050

117
Statement of Price (For 20,000 units)
Rs.
Marginal cost (Rs. 8.385 x 20,000 units) 1,67,700
Additional profit required (1,67,300 - 1,09,050) 58,250
Total sales value 2,25,950
Selling price per unit (2,25,950 / 20,000) = Rs. 11.30 (Approx.) 7.2.2 Make or Buy Decision
Marginal costing technique is used to decide whether to manufacture a component used
in the company's assembled product or purchase it from outside. For this, the company will compare the cost of purchase of the component with its own cost of manufacturing. It implies that fixed cost will be entirely ignored on the assumption that fixed cost will not increase with the manufacturing of the component. If the marginal cost of the component is less than the cost of purchase of the component, it is better to make it internally. If the marginal cost of the component is more than the purchase price, it is better to purchase it from the market. However, if the manufacturing of the component increases the fixed cost, the increase in fixed cost will be taken into account.
The above-mentioned treatment is based on the assumption that the company has idle
capacity that can be used to manufacture the component. Thus, there will be no opportunity cost. However, if there is no idle capacity and manufacturing of the component in the factory involves the loss of other work, opportunity cost should be added to marginal cost (variable cost) of production. Here the opportunity cost will be the contribution foregone from the displacement of work. The concept of opportunity cost will be relevant only when company is running at its full capacity.
Following are some non-cost considerations governing make or buy decision:
(i) The company should be assured of uninterrupted supply of the component so as not to suffer the production of main product.
(ii) The supplier should assure the company about the quality of the component. (iii)The component of be bought should be available at the same price at which we are
considering to buy it at present. (iv) If the production of the component is not carried out, labour problems should not
crop up. (v) When component is bought from the outside, secrecy cannot be maintained, and
manufacturing know-how is to be passed on to the supplier of the component. Secrecy can be maintained only when component is manufactured internally.
The company should have the facility of wider choice in case of buy-decision. Illustration 4 Suman Ltd. uses a component "Z651" in its manufacturing process that can be purchased from a supplier for Rs. 90 per unit. The same component is manufactured by Suman Ltd. at the following cost per unit:

118
Rs. Direct Material 30 Direct Labour. 25 Variable Overheads 28 Fixed Overheads (75% of Direct Material) 23 106 Suggest whether to make or buy this component. What would be your suggestion if the offer offers the component at Rs. 80. Solution Statement Showing Comparative Costs of Make or Buy
Particulars Make
cost per unit
Buy
cost per
Rs. Rs.
Direct Materia! 30
Direct Labour 25
Variable Overheads 28
Total Marginal Cost 83
(i) Case I 90
(ii) Case II 80
Case I : The cost of producing the component is Rs. 83. When it is compared with cost of
purchasing the component i.e. Rs. 90, it will be logical to suggest that Suman Ltd. should
continue to manufacture the component.
Case II: When cost of producing the component is compared with cost of purchasing the
component i.e. Rs. 80, it is suggested that Suman Ltd. should buy the component. There is a
saving of Rs. 3 per unit. Further, the capacity released can be profitably employed in some
other activity.
Illustration 5
A company uses three different components (materials) in manufacturing its primary product.
It manufactures two of the components and purchases one (designated as Component I) from
outside suppliers. The company is currently developing the annual profit plan. Sales are
highly seasonal. Component 2 cannot be acquired from outsiders; however Component 3 can
be purchased. The three components have critical specifications. The annual profit plan
provided data for the following computations:
Component 3 unit cost
{At 12,000 units)
Rs.
Material (direct) 1.40
Labour (direct) 2.20
Fixed overhead (apportioned) 0.40
Annual machine rental
(special machine used only for Component 3) 0.50
Variable factory overhead 1.00
Average storage cost per year (fixed) 0.40
Total 5.90

119
Average inventory level 500 units.
The Purchase Manager investigated outside suppliers and found one that would sign a one
year contract to deliver "12,000 top quality units as needed during the year at Rs. 5.20 per
unit". Serious consideration is being given to this alternative. Should the company make or
buy component 3? Explain the relevant factors influencing your decision.,
Solution
Rs.
Material (direct) 1.40
Labour (direct) 2.20
Annual machine rental (special machine used only
for Component 3) 0.50
Variable factory overhead 1.00
Variable cost of manufacturing 5.10
Purchase price 5.20
Since the variable cost of manufacturing the Component 3 is lesser than the purchase price, it
is advisable to make the component. However, there is a very negligible difference of Rs.
0.10 per unit. Suman company may think of purchasing the component from outside if the
manufacturing facilities released by the non-manufacture of the component are put to some
alternative use.
Illustration 6
A machine manufactures 5,000 units of a part at a total cost of Rs. 11 of which Rs. 8 is
variable. This part is readily available in the market at Rs. 9 per unit.
If the part is purchased from the market then the machine can either be utilised to
manufacture a component in same quantity contributing Rs. 1 per component or it can be
hired out at Rs. 11500. Recommend which of the alternatives is profitable?
Solution
Statement Showing Comparative Costs of Make or Buy
Particulars Make cost Buy cost per unit
per unit Rs.
Alternative 1 Rs.
Alternative II Rs.
Variable cost of Manufacturing
(5,000 x 8)
Purchase cost (5,000 x 9)
Less: Contribution from component
made by utilizing the machine (5,000 x 1)
Less: Income from hire of machine
40,000
45,000
-5,000
45,000
-11,5,00
40,000 40,000 33,500
Cost of manufacturing the part and buying cost is same. i.e. Rs 40,000 . if alternative II will
be opted then buying from outside will be considered. Further, existing machine should be
hired out.

120
Illustration 7
Sukanya Ltd. produces a variety of products each having a number of component parts.
Product B takes 5 hours to produce on a particular machine which is working at full capacity.
B has a selling price of Rs. 100 and variable cost of Rs. 60 per unit. A component part X-100
could be made on the same machine in two hours at a variable cost of Rs. 10 per unit. The
supplier's price for the component is Rs. 25 per unit. Advise whether the company should buy
the component X-100. (If necessary make suitable assumptions.) Solution Here, cost of buying the component from outside should be compared with relevant cost of manufacturing which will include opportunity cost i.e. loss of contribution due to non-manufacturing of product B.
Selling price of product B Rs. 100
Less: Variable cost of Product B Rs. 60
Contribution Rs. 40
Contribution per hour (40/5) Rs. 8
Statement Showing Comparative Costs of Make or Buy
Since cost of manufacturing is more than cost of buying, it is advisable to buy the component
part.
Illustration 8
A company wants to manufacture automobile accessories and parts. The following are the
total costs of processing 50,000 units:
Direct material cost Rs.2.5 lakhs
Direct labour cost 4 lakhs
Variable factory overhead 3 lakhs
Fixed factory overhead 2.5 lakhs
The purchase price of the component is Rs. 11. The fixed overhead would continue to be
incurred even when the component is bought from outside, although there would have been
reduction to the extent of Rs. 1,00,000.
Required:
(i) Should the part be made or bought considering that the present facility when
released following a buying decision would remain idle?
(ii) In case the released capacity can be rented out to another manufacturer for
Rs. 75,000 having good demand, what should be the decision?
Particulars Make
cost
Buy cost
per unit per unit
Rs. Rs.
Variable cost of making 10
Opportunity cost (2 Hours, x Rs. 8) 16
Cost of purchase 25
26 25

121
Solution
Statement Showing Costs of Make of Buy
Particulars Make cost Buy cost
per unit per unit
(Rs. in (Rs. in
lakhs) lakhs)
Materials 2.5
Labour 4
Variable overheads 3
Total variable cost 9.5
Case 1
Cost of Purchase 11
Less: Reduction in fixed overhead
(1,00,000/50,000)
-2
Effective Cost of Purchase 9
Case II
Cost of Purchase (Calculated as above) 9
Less: Income from renting the
released(75000/50000)
- 1.5
Capacity 7.5
Case I - Component should be purchased from outside
Case II - Component should be purchased from outside.
7.2.3 Determination of Product Mix
Product mix refers to the proportion in which the different products are produced. This
decision relates to a situation where the firm has the limited resources but the different
products may be produced using the same resources and the facilities. The firm has to select
the most profitable product mix with the use of given limited resources. A profitable product
mix should consist of the products which gives the highest contribution. It means that product
mix should not have the product which is less profitable than others. The products, which
give the maximum contribution, are to be included in the product mix. Thus, the most
profitable product mix is one which yields the largest overall contribution. The profitability
of various product mixes may be evaluated by comparing the P/V ratio and break-even point.
A change in product mix will be favorable if it increases the P/V ratio or reduces the break-
even point. Thus, decision regarding product mix is taken on the basis of P/V Ratio or
contribution.
The selection of profitable product mix is also influenced by key factor or factors.
7.3 Key Factor
In any business, one or the other factor limits the size of activity. It may be the availability of
funds, availability of materials, availability of skilled labour or the sales that can be made in
the market. This factor is known as the key factor or the limiting factor. Following are some
examples of key factors:
(i) Demand in the market
(ii) Restrictions imposed by the government on the use of raw materials

122
(iii) Shortage of power-supply
(iv) Shortage of skilled labour
(v) Shortage of workers
(vi) Shortage of capital and/or space
(vii) Scarcity raw material
Note:- There may be more than one key factor influencing the product-mix of the firm. When
there is a key factor, the profitability of products is measured by the following formula:
Profitability = Contribution per unit / Key factor per unit Key factor is the most important
factor for deciding about the most profitable product-mix. The most profitable product will
be the product which yields the highest contribution per unit in terms of key factor. Illustration 9 Mohan Ltd. submits the following information in respect of its two products:
xyz abc
per unit per unit
Rs. Rs.
Direct Material 100 150
Direct Wages 100 75
Variable Overheads 75 125
Selling Price 375 625
Fixed Overheads Rs. 7,50,00 per annum.
You are required to recommend the management the profitable sales mix from the following
alternatives:
(a) 300 units of xyz only (c) 50 units of xyz and 150 units of abc
(b) 400 units of abc only (d) 150 units of xyz and 100 units of abc
Solution
Statement Showing Profitability of Different Product Mixes
Particulars xyz abc Total
Rs. Rs. Rs.
Direct Material 100 150
Direct Wages 100 75
Variable overheads 75 125
Marginal cost 275 350
Selling Price 375 625
Contribution 100 275
Product Mix (a)
Total contribution 100 x 300
= 30,000 Nil 30,000
Product Mix (b) 400 x 275
Total contribution Nil = 1,10,000 1,10,000
Product Mix (c)
Total contribution 50 x 100 150 x 275
= 5,000 = 41250 46250
Product Mix (d)
Total contribution 150 x 100 100 x 275
= 15,000 = 27500 42500
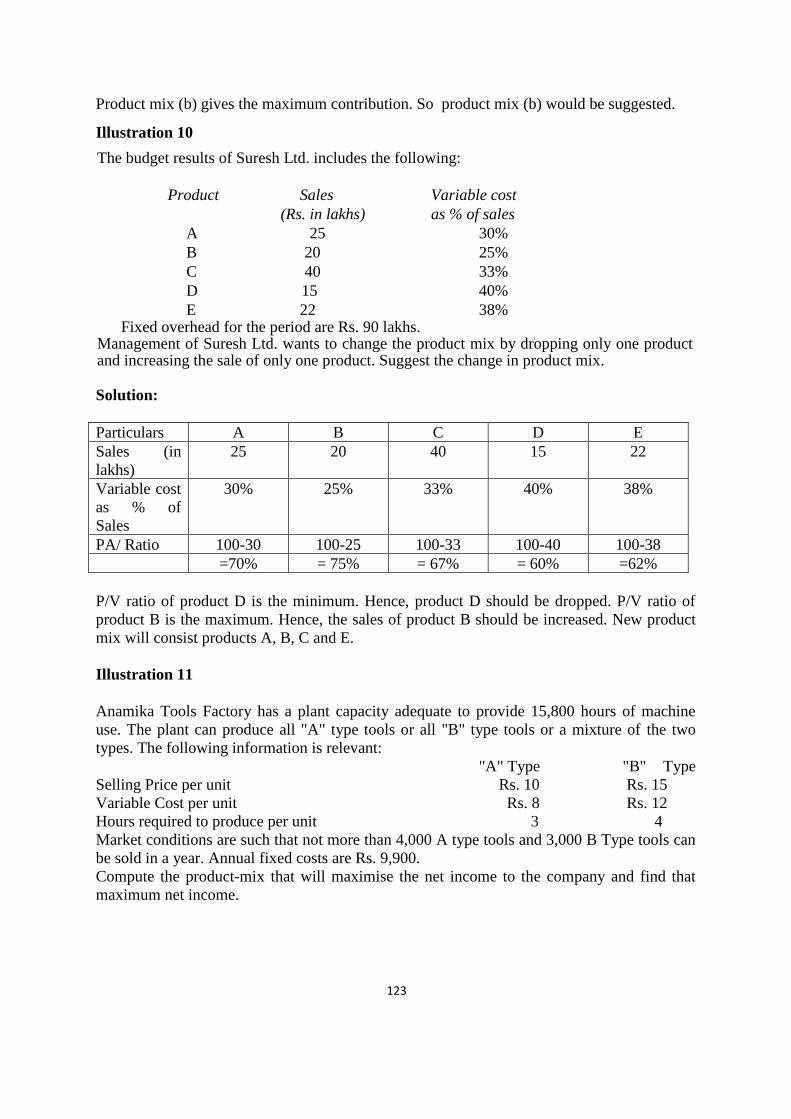
123
Product mix (b) gives the maximum contribution. So product mix (b) would be suggested. Illustration 10 The budget results of Suresh Ltd. includes the following:
Product Sales Variable cost
(Rs. in lakhs) as % of sales
A 25 30%
B 20 25%
C 40 33%
D 15 40%
E 22 38% Fixed overhead for the period are Rs. 90 lakhs.
Management of Suresh Ltd. wants to change the product mix by dropping only one product and increasing the sale of only one product. Suggest the change in product mix.
Solution:
Particulars A B C D E
Sales (in
lakhs)
25 20 40 15 22
Variable cost
as % of
Sales
30% 25% 33% 40% 38%
PA/ Ratio 100-30 100-25 100-33 100-40 100-38
=70% = 75% = 67% = 60% =62%
P/V ratio of product D is the minimum. Hence, product D should be dropped. P/V ratio of
product B is the maximum. Hence, the sales of product B should be increased. New product
mix will consist products A, B, C and E.
Illustration 11
Anamika Tools Factory has a plant capacity adequate to provide 15,800 hours of machine
use. The plant can produce all "A" type tools or all "B" type tools or a mixture of the two
types. The following information is relevant:
"A" Type "B" Type
Selling Price per unit Rs. 10 Rs. 15
Variable Cost per unit Rs. 8 Rs. 12
Hours required to produce per unit 3 4
Market conditions are such that not more than 4,000 A type tools and 3,000 B Type tools can
be sold in a year. Annual fixed costs are Rs. 9,900.
Compute the product-mix that will maximise the net income to the company and find that
maximum net income.

124
Solution:
Statement Showing Comparative Profitability
Particulars Type A Type B
Selling Price per unit Rs. 10 Rs. 15
Variable Cost per unit Rs. 8 Rs. 12
Contribution per unit Rs. 2 Rs. 3
PA/ Ratio = Contribution per unit x 100 (2/10)x 100 (3/15)x100
Selling Price per unit = 20% = 20%
Contribution per machine hour 2/3=.67 =3/4=.75
Rankings II I
Since "B" type tools give higher contribution per machine hour (key factor), they should be
produced to the maximum extent. Remaining machine hours should be utilised for production
of "A" type tools.
Statement of Production
Total machine hours available 19,800
Less: Machine hours for producing 3,000 B type tools (300 x 4) 12,000
Remaining machine hours available to produce A type tools 7,800
Number of A type tools to be produced 7,800
3
= 2,600
Most profitable product mix = A type tools 2,600 + B type tools 3,000
Statement of Maximum Net Income
A Type B Type Total
Number of tools to be produced 2,600 3,000
Contribution per unit Rs. 2 Rs. 3
Contribution (Total) Rs. 5,200 Rs. 9,000 Rs. 14,200
Less: Fixed cost Rs. 9,900
Net Income Rs. 4,300
Illustration 12
ABC LTD company can produce three different materials using same production facilities.
The requisite labour is available in plenty at Rs. 8 per hour for all products. The supply of
raw material, which is imported at Rs. 8 per kg., is limited to 10,400 kg. for the budget
period. The variable overheads are Rs. 5.60 per hour. The fixed overheads are Rs. 50,000.
The selling commission is 10% on sales. From the following information, you are required to
suggest the most suitable sales mix which will maximise the company's profit.
Also, determine the profit that will be earned at that level.
Product Market Selling Labour Raw material
demand per unit per unit required per
units. Rs. unit
X 8,000 30 1 0.7
Y 6,000 40 2 0.4
Z 5,000 50 1.5 1.5

125
Solution
(a) Statement of Marginal Cost and Contribution : Statement of marginal cost and
contribution is shown on the next page
Statement of Marginal Cost and Contribution
Particulars Per unit of Products
X Y Z
Rs. Rs. Rs.
Direct materials @ Rs. 8 per kg. 5.60 3.20 12.00
Direct wages @ Rs. 8 per hr. 8.00 16.00 12.00
Variable overhead @ Rs. 5.60 per hr. 5.60 11.20 8.40
Sales commission @ 10% on S.P. 3.00 4.00 5.00
(A) Marginal Cost 22.20 34.40 37.40
(B) Selling Price 30.00 40.00 50.00
(C) Contribution (B-A) 7.80 5.60 12.60
(D) Raw material per unit (kg.) 0.70 0.40 1.50
(E) Contribution per kg. of raw
material (C + D) Rs. 11.14 14.00 8.40
Ranking II I III
Statement of Sales Mix
Raw materials available (Kgs) 10,400
Less: Raw materials required for product x Y (0.4 x 6,000) 2,400
8,000
Less: Raw materials required for product (0.7 x 8,000) 5,600
Raw materials available for product Z 2,400
Units of product Z to be produced = 2400/1.5 = 1,600 units.
Profitable Sales Mix = X = 8,000,Y = 6,000, Z = 1,600 units
Statement of Profit
X Y Z Total
Rs.
No. of units 8,000 6,000 1,600
Contribution per unit 7.80 5.60 12.60
Total contribution 62,384 33,600 20,160 1,16,144
Less: Fixed cost 50,000
Profit 66,144
7.4 Summary of the chapter
A business has to take the decisions in the different complex situations. Decision
making is the process of selecting the best alternative among the different choices available in
order to attain the desired objectives. Pricing of a product is the most crucial decision. Price
affects sales volume which, in turn, determines the revenue and profit of the company. Every
company will like to maximize its profit. Hence, price of a product has to be more than its

126
total cost i.e. variable costs plus fixed costs. This is known as "cost plus pricing." Thus Price
= Variable costs + Fixed costs + Profit.
Marginal costing technique is used to decide whether to manufacture a component used in the
company's assembled product or purchase it from outside. For this, the company will
compare the cost of purchase of the component with its own cost of manufacturing. It implies
that fixed cost will be entirely ignored on the assumption that fixed cost will not increase
with the manufacturing of the component. Product mix refers to the proportion in which the
different products are produced. This decision relates to a situation where the firm has the
limited resources but the different products may be produced using the same resources and
the facilities. The firm has to select the most profitable product mix with the use of given
limited resources. A profitable product mix should consist of the products which gives the
highest contribution. In any business, one or the other factor limits the size of activity. It may
be the availability of funds, availability of materials, availability of skilled labour or the sales
that can be made in the market. This factor is known as the key factor or the limiting factor.
Key factor is the most important factor for deciding about the most profitable product-mix.
The most profitable product will be the product which yields the highest contribution per unit
in terms of key factor.
7.5 Exercise
Exercise 1: True or False
True or False
1. Management may sell at a price which is even below marginal cost in certain special
circumstances.
2. Export orders should not normally be accepted at a price below total cost.
3. In make or buy decision, it is profitable to buy outside firm when supplier’s price is
below firm’s own total cost.
4. A mix that provides the highest amount of contribution is considered as the most
profitable mix.
5. Cost per unit of key factor is the basis of ranking products on profitability.
Answers
1. True, 2. False, 3. False, 4. True, 5. False
Exercise 2: Fill in the blanks
1. When a ………is operating, selection of the most profitable sales mix is based on
contribution per unit of key factor.
2. When selling price falls below …………, the loss will be more than the amount of
fixed cost.
3. When a company is not able to fully utilize plant capacity by selling at total cost
plus profit basis, in such a case, it may …………
4. Additional orders may be accepted from a foreign market at below normal or below
total cost but above …………..
5. Any change in sales mix also results in the change in …………..

127
Answer
1. Key factor, 2. Variable cost, 3. Explore new markets, 4. Marginal cost,
5. Profit position
Exercise 3: Multiple choice Questions
Q1. Factor, which are largely considered in making or buying decisions is
a) quality of suppliers
b) dependability of suppliers
c) both a and b
Q2. One of the following is not a relevant cost in replacement decision regarding a
machine which can increase production capacity if replaced.
a) Direct Material
b) Variable Manufacturing Overheads
c) Rent of Office Building
Q3. A cost which has no role or doesn’t affect manager’s decision is called
a) Opportunity cost
b) Sunk cost
c) Irrelevant cost
Q4 Which of the following is not limiting factor examples which may include limit
production or sales volume?
a) Shortage of material
b) Shortage of labour
c) Sufficient market demand
Q5 Pricing decision is influenced by a number of factors, some of them are given as
under:
(a) Objective of the company
(b) Competition
(c) a and b
Answer
1. C, 2. C, 3. C, 4. C, 5. C
Long Questions
Q1 What do you mean by make or buy decisions? State the quantitative as well as
qualitative considerations influencing a ‘make’ or ‘buy’ decision.
Q 2 “The technique of marginal costing can be valuable aid to management”. Discuss.
Q3. Explain briefly the circumstances under which selling below marginal cost may be
Justified.
Q4. Do you think a producer can sell his output even below variable cost? If so, mention
these circumstances.
Q5. Indicate any five circumstances under which you will allow to fix a price which is less
than the marginal cost.
128
Short Questions
Q1. Write short notes on “Key-factor”.
……………..……………………………………………………………………………………
………………………………………………………………………………………………..…
………………………………………………………………………………………………..…
Q2. State the factors that the managers must consider in selecting the product mix.
……………..……………………………………………………………………………………
………………………………………………………………………………………………..…
………………………………………………………………………………………………..…
Q3. Identify the major factors that should be considered for determining the selling price of a
Product.
……………..……………………………………………………………………………………
………………………………………………………………………………………………..…
………………………………………………………………………………………………..…
Q4. what factors have to be taken into account in a make or buy decision?
……………..……………………………………………………………………………………
………………………………………………………………………………………………..…
………………………………………………………………………………………………..…
Q5.“Marginal costing is extensively used as a decision-making technique”. Explain
……………..……………………………………………………………………………………
………………………………………………………………………………………………..…
………………………………………………………………………………………………..…