Recommended Parameter Values for INEEL …...PNNL-14742 Recommended Parameter Values for INEEL...
116
PNNL-14742 Recommended Parameter Values for INEEL Subsurface Disposal Area Source Release Modeling R. G. Riley C. A. Lo Presti June 2004 Prepared for the U.S. Department of Energy under Contract DE-AC06-76RL01830
Transcript of Recommended Parameter Values for INEEL …...PNNL-14742 Recommended Parameter Values for INEEL...
PNNL-14742
Recommended Parameter Values for INEEL Subsurface Disposal Area Source Release Modeling R. G. Riley C. A. Lo Presti June 2004 Prepared for the U.S. Department of Energy under Contract DE-AC06-76RL01830
DISCLAIMER This report was prepared as an account of work sponsored by an agency of the United States Government. Neither the United States Government nor any agency thereof, nor Battelle Memorial Institute, nor any of their employees, makes any warranty, express or implied, or assumes any legal liability or responsibility for the accuracy, completeness, or usefulness of any information, apparatus, product, or process disclosed, or represents that its use would not infringe privately owned rights. Reference herein to any specific commercial product, process, or service by trade name, trademark, manufacturer, or otherwise does not necessarily constitute or imply its endorsement, recommendation, or favoring by the United States Government or any agency thereof, or Battelle Memorial Institute. The views and opinions of authors expressed herein do not necessarily state or reflect those of the United States Government or any agency thereof.
PACIFIC NORTHWEST NATIONAL LABORATORY operated by BATTELLE
for the UNITED STATES DEPARTMENT OF ENERGY
under Contract DE-AC06-76RL01830
Printed in the United States of America
Available to DOE and DOE contractors from the Office of Scientific and Technical Information,
P.O. Box 62, Oak Ridge, TN 37831-0062; ph: (865) 576-8401 fax: (865) 576-5728
email: [email protected]
Available to the public from the National Technical Information Service, U.S. Department of Commerce, 5285 Port Royal Rd., Springfield, VA 22161
ph: (800) 553-6847 fax: (703) 605-6900
email: [email protected] online ordering: http://www.ntis.gov/ordering.htm
This document was printed on recycled paper.
PNNL-14742
Recommended Parameter Values for INEEL Subsurface Disposal Area Source Release Modeling R. G. Riley C. A. Lo Presti June 2004 Prepared for the Idaho Completion Project (#23378) and the U.S. Department of Energy under Contract DE-AC06-76RL01830 Pacific Northwest National Laboratory Richland, Washington 99352
Summary
This document summarizes recommended parameter values for use in numerical models to simulate contaminants of potential concern (COPC) release from sources within INEEL’s Subsurface Disposal Area (SDA). In this report, waste in the SDA is assumed to be untreated (base case) or subject to in situ grouting or in situ vitrification. In situ grouting and in situ vitrification are considered promising candidate remedial technologies that can contain or treat COPC-bearing waste inhibiting future COPC migration to groundwater from the SDA. Assessment of the effectiveness of remedial alternatives is required by the U.S. Environmental Protection Agency before decisions on final remedies can be made.
COPC for which recommended parameter values were provided were 25 radionuclides (i.e., actinium-227; americium-241 and -243; carbon-14; chlorine-36; cesium-137; iodine-129; niobium-94; neptunium-237; protactinium-231; Pb (lead)-210; plutonium-238, -239, and-240; radium-226; strontium-90; technetium-99; thorium-229, -230, and -232; and uranium-233, -234, -236, -235, and -238) and 4 chemicals (i.e., carbon tetrachloride, dichloromethane [methylene chloride], tetrachloroethylene [perchloroethylene], and nitrate).
Parameters for numerical release models for which recommended values (i.e., minimum, median, mean and maximum) were provided include effective diffusion coefficients for grouted waste, dissolution rates for vitrified waste, fractional release rates for selected metal waste (i.e., aluminum, beryllium, and stainless steel), partition coefficients and solubility values for unconsolidated waste and diffusion coefficients for Rocky Flats waste. We recommend that single-point “best estimate” (the median) values be used for each parameter where the assessment is constrained by the level of modeling effort to be applied (e.g., limited to single simulation runs). For some parameters, data sets are sufficiently large to allow construction of empirical distributions for design of a suite of simulation runs.
Where possible, recommended parameter values (i.e., diffusion coefficients in grout, dissolution rates in vitrified waste, and fractional release rates for metal waste) were calculated from published experi-mental data. Diffusion coefficient values used in calculations was limited to those obtained using the ANSI/ANS 16.1 standard test procedure. Past assessments applied a single diffusion coefficient value to simulate COPC release from grouted waste. The diffusion coefficient data set provided in this report allows increased discrimination of COPC release from grouted waste and tend to be less conservative (i.e., release rates tend to be slower). The bulk dissolution rate for simulation of COPC release from vitrified glass was calculated by pooling experimental data from laboratory and pilot scale vitrification tests performed at U.S. Department of Energy sites. This rate is approximately 500 times lower than applied in previous assessments suggesting that simulations using these data are likely to show slower COPC release from vitrified SDA waste than previous assessments. Fractional release rates were based on corrosion rates calculated from test results of metals exposed to INEEL soils over a period of three years. Fractional release rates were in the order of beryllium > aluminum > stainless steels. The field results suggest that COPC release from stainless steel or beryllium waste may be an order of magnitude or more slower than previously determined.
Recommended partition coefficients were refinements of previously recommended values. Included in the refinement process were recent partition coefficient results for neptunium and uranium in INEEL
iii
iv
discrete and composited interbed sediments. Solubility values were model-derived based on a pH range of 7 to 8 and based on redox conditions that are anticipated to change from highly reduced in the near term (e.g., first 1,000 years of an assessment simulation) to oxidized in the long term (1,000 to 10,000 years). In considering COPC solubility, we recommend simulations where the SDA is assumed to be under reduced conditions for the first 1,000 years followed by oxidized conditions for the remainder of the assessment (assumed to be 10,000 years). The recommended diffusivity value for simulating carbon tetrachloride, dichloromethane and tetrachloroethylene release from Rocky Flats waste is the recommended value documented in the ancillary basis for risk analysis assessment report.
Sensitivity case structures were developed as an aid to identify the breadth of sensitivity case combinations from which sensitivity cases could be identified for simulation and analysis. For the more complex waste/COPC scenarios, release-vadose zone transport groupings were developed based on model parameter matrices to assist in the conceptualization of the sensitivity case structures. From these structures, 13 test cases were identified for possible simulation. The selection of cases focused on issues of interest (e.g., release of uranium, plutonium and technetium) from SDA waste and subsequent release to groundwater, the performance of specific grouts of interest to INEEL, carbon-14 release from metal waste and carbon tetrachloride release from Rocky Flats waste). Sensitivity cases were designed to examine the impacts of variation associated with applying recommended parameter values from this study (i.e., minimum, mean, maximum) incorporating sensitivity information for parameters in previous assessments.
Acronyms
ABRA Ancillary Baseline Risk Assessment A/V area-to-volume (ratio) BWR boiling water reactor CERCLA Comprehensive Environmental Response, Compensation, and Liability Act COPC contaminants of potential concern CRW cladding removal waste CST crystalline silicotitante EDTA ethylenediaminetetraacetic acid ICP Idaho Completion Project INEEL Idaho National Engineering and Environmental Laboratory IRA Interim Risk Assessment IRPC Indian red pottery clay ISG in situ grouting ISV in situ vitrification MVST Melton Valley Storage Tanks ORNL Oak Ridge National Laboratory PSW phosphate-sulfate waste PWR pressurized water reactor RCRA Resource Conservation and Recovery Act RWMC Radioactive Waste Management Complex SDA Subsurface Disposal Area SVR soil vault row TMI Three Mile Island VOC volatile organic compounds VZ vadose zone
v

Contents
Summary ................................................................................................................................................ iii Acronyms ............................................................................................................................................... v 1.0 Introduction .................................................................................................................................. 1.1 2.0 Approach and Scope .................................................................................................................... 2.1 3.0 Recommended Effective Diffusion Coefficient Values for COPC Release From In Situ Grouted Waste With and Without In Situ Thermal Destruction .................................................. 3.1 3.1 Experimental Data ............................................................................................................... 3.1 3.2 Assessment of Data .............................................................................................................. 3.1 3.3 Factors Affecting COPC Diffusivities in Grouted Waste .................................................... 3.3 3.3.1 Sediment Moisture Content ........................................................................................ 3.3 3.3.2 Carbonation ................................................................................................................ 3.4 3.3.3 Alternative Grout Formulations: Thermosetting and Thermoplastic Grouts ............ 3.4 4.0 Recommended Bulk Dissolution Rate Values for COPC Release from In Situ Vitrified Waste ............................................................................................................................................ 4.1 4.1 Experimental Data ............................................................................................................... 4.1 4.2 Assessment of Data .............................................................................................................. 4.1 5.0 Recommended Parameter Values for COPC Release from Untreated Waste ............................. 5.1 5.1 Fractional Release Rate Values for COPC Release from Activated Metal Waste ............... 5.1 5.1.1 Experimental Data ...................................................................................................... 5.1 5.1.2 Assessment of Data .................................................................................................... 5.1 5.2 Partition Coefficient Values for COPC Release from Unconsolidated Waste ..................... 5.2 5.2.1 Experimental and Estimated Data .............................................................................. 5.2 5.2.2 Assessment of Data .................................................................................................... 5.2 5.3 Solubility Values for COPC Release from Unconsolidated Waste ...................................... 5.3 5.3.1 Data for Solubility Estimates ..................................................................................... 5.3 5.3.2 Assessment of Data .................................................................................................... 5.3 5.4 Diffusivity Values for VOC Release from Rocky Flats Waste ............................................ 5.5 5.4.1 Experimental Data ...................................................................................................... 5.5 5.4.2 Assessment of Data .................................................................................................... 5.5
vii
6.0 Sensitivity Case Structures ........................................................................................................... 6.1 6.1 In Situ Grouted Waste .......................................................................................................... 6.1 6.1.1 Numerical Model ....................................................................................................... 6.1 6.1.2 Parameter Value Analysis .......................................................................................... 6.1 6.1.3 COPC Release/Transport Groupings for In Situ Grout Sensitivity Case Structure ..................................................................................................................... 6.2 6.1.4 In Situ Grout Sensitivity Case Structure .................................................................... 6.3 6.2 In Situ Vitrified Waste ......................................................................................................... 6.4 6.2.1 Numerical Model ....................................................................................................... 6.4 6.2.2 Parameter Value Analysis .......................................................................................... 6.5 6.2.3 COPC Release/Transport Groupings for ISV Sensitivity Case Structure .................. 6.6 6.2.4 ISV Sensitivity Case Structure ................................................................................... 6.6 6.3 Untreated Waste ................................................................................................................... 6.7 6.3.1 Activated Metal Waste ............................................................................................... 6.7 6.3.2 Rocky Flats Waste ...................................................................................................... 6.8 6.3.3 Unconsolidated Waste ................................................................................................ 6.9 7.0 Sensitivity Test Cases .................................................................................................................. 7.1 8.0 Conclusions .................................................................................................................................. 8.1 9.0 References .................................................................................................................................... 9.1 Appendix A – Key Parameter Value Data: Release Model for In Situ Grouting of Subsurface Disposal Area Waste ...................................................................................................... A.1 Appendix B – Key Parameter Value Data: Release Model for In Situ Vitrification Treatment of Subsurface Disposal Area Waste ................................................................................... B.1 Appendix C – Key Parameter Value Data: Release Models for Rocky Flats and Other Unconsolidated Subsurface Disposal Area Waste ......................................................... C.1 Appendix D – Support Data for In Situ Grouting Sensitivity Case Structure Process .......................... D.1 Appendix E – In Situ Grouting Sensitivity Case Sub-Structures ........................................................... E.1 Appendix F – Support Data for In Situ Vitrification Sensitivity Case Structure ................................... F.1 Appendix G – Activated Metal Waste Sensitivity Case Structure ......................................................... G.1 Appendix H – Rocky Flats Waste Sensitivity Case Structure ............................................................... H.1 Appendix I – Support Data for Unconsolidated Waste Sensitivity Case Structure ............................... I.1 Appendix J – Unconsolidated Waste Sensitivity Case Structure ........................................................... J.1 Appendix K – Sensitivity Class ............................................................................................................. K.1
viii
ix
Tables
3.1 Recommended Effective Diffusion Coefficients for COPC in Grouted Waste ........................... 3.2 4.1 Recommended Bulk Dissolution Rates for In Situ Vitrified Waste ............................................. 4.1 5.1 Recommended Fractional Release Rates for COPC Release from Activated Metal Wastes ....... 5.1 5.2 Recommended Partition Coefficient Values for Base Case ......................................................... 5.2 5.3 Recommended COPC Solubility Values for Base Case .............................................................. 5.4 5.4 Recommended COPC Solubility Values for Base Case .............................................................. 5.4 5.5 Recommended Diffusion Coefficients for VOC Release from Rocky Flats Waste ..................... 5.6 6.1 COPC Release/VZ Transport Grouping for ISG Waste ............................................................... 6.3 6.2 COPC Release/VZ Transport Groupings for Activated Metal Waste .......................................... 6.8 6.3 COPC Release/VZ Transport Groupings for Unconsolidated Waste........................................... 6.13 7.1 Sensitivity Test Case Summary ................................................................................................... 7.2
1.0 Introduction
The Subsurface Disposal Area (SDA) is a radioactive waste landfill located at the Idaho National Engineering and Environmental Laboratory (INEEL) Radioactive Waste Management Complex (RWMC) in southeastern Idaho. Contaminants in the landfill include hazardous chemicals, fission and activation products, and transuranic radionuclides. Waste has been disposed of at the SDA in pits, trenches, and soil vaults. During their construction, soil was excavated to basalt and soil underburden was placed before waste was disposed in them.
The nature and extent of contamination associated with the SDA has been recently summarized and used to estimate human health and ecological risk associated with the site (Holdren et al. 2002). Groundwater was identified as a primary medium of concern. Contaminants of potential concern (COPC) identified were 25 radionuclides (i.e., actinium-227; americium-241 and -243; carbon-14; chlorine-36; cesium-137; iodine-129; niobium-94; neptunium-237; protactinium-231; Pb (lead)-210; plutonium-238, -239, and-240; radium-226; strontium-90; technetium-99; thorium-229, -230, and -232; and uranium-233, -234, -236, -235, and -238) and 4 chemicals (carbon tetrachloride, dichloromethane [methylene chloride], tetrachloroethylene [perchloroethylene], and nitrate). When discussed together in this report, carbon tetrachloride, dichloromethane, and tetrachloroethylene are referred to as volatile organic compounds (VOC).
A preliminary evaluation of remedial alternatives has been performed and candidate technologies have been evaluated that can contain or treat COPC-bearing waste inhibiting future COPC migration to groundwater. Two promising candidate technologies identified are in situ grouting (ISG) and in situ vitrification (ISV) of the waste (Zitnik et al. 2002).
ISG involves injection of grout slurry-like mixtures (e.g., G-MENT-12 which is a cementitious grout containing blast-furnace slag), chemical polymer based, or petroleum-based waxes (e.g., WaxfixTM) under high pressure into the waste. The objective is to encapsulate COPC, filling all void space. The monolith formed is denser and significantly less permeable and therefore isolates COPC from the surrounding environment (Zitnik et al. 2002; Holdren et al. 2002). ISG is a candidate technology for wastes in pits, trenches and soil vault rows. It is also a potential candidate technology for application to PAD A waste if a decision is made to place this waste in a pit for permanent disposal. Waste containing high organic content (i.e., where, for example, oil content is >10 to 12 wt%) is a candidate for in situ grouting but only after pretreatment with in situ thermal desorption technology.
ISV is a candidate technology for treatment of transuranic waste in pits and trenches but is not an option for waste that contains high metal content. When present, metallic waste will melt, and because of increased density, sink to the bottom of the melt forming a separate phase below the glass. Because of metal alloy incompatibility, significant lead present may result in the formation of a third separate phase below the other metal phase (Thomas and Treat 2002). Application of ISV technology would remove and destroy organic constituents in the waste and encapsulate most inorganic constituents within a durable, dense, glass-like monolith similar to obsidian that is highly leach-resistant. A modification of the classical approach to implementation of ISV (subsurface planer ISV) is under consideration where melting is conducted entirely below ground under a layer of un-melted soil. This approach is suggested to
1.1
1.2
eliminate many of the hazards associated with traditional ISV, although semi-volatile organic compounds may condense in the soil overburden and remain untreated by the off-gas treatment system (e.g., off gases) (Zitnik et al. 2002). Subsidence occurs when waste is treated with ISV because the volume of the waste is reduced 30 to 70%. Pretreatment of the waste source with in-situ thermal desorption technology is required to remove water and volatile organic compounds which if allowed to remain could result in steam or gas explosions during ISV application (Zitnik et al. 2002).
Assessment of the effectiveness of remedial alternatives is required by the U.S. Environmental Protection Agency before decisions on final remedies can be made. To address this requirement, source release modeling coupled with vadose zone transport modeling is applied to simulate COPC release from SDA waste and release to groundwater as a function of time in the presence and absence of waste treatment (i.e., ISG or ISV treatment versus no action (base case). Critical to this analysis is the application of quality values for key parameters in release models that simulate the mechanism of release of the contaminants from the different types of waste disposed at the SDA. Mechanisms of COPC release have been identified as contaminant partitioning between waste and infiltrating water (surface wash-off model), contaminant migration out of a grouted waste form (diffusion model), contaminant release from a vitrified waste (glass dissolution), radionuclide release from activated metal waste (fractional release based on metal corrosion) and VOC release from Rocky Flats waste (diffusion model).
The purpose of this report is to 1) summarize associated information and values for key release model parameters (i.e., best estimate, minimum and maximum) obtained where possible from published experimental data, 2) identify and apply an approach that can be used to identify sensitivity test cases, and 3) recommend test cases for selected COPC to assess the effectiveness of the remedy against a no-treatment base case.
2.0 Approach and Scope
Data to support the application of complex reaction-based numerical models to simulate COPC release for the range of different treated and untreated SDA waste source scenarios does not exist. Therefore, best estimate, minimum, and maximum values for key parameters are provided for application in simple numerical models that simulate COPC release from treated and untreated SDA waste. These data are summarized in Tables 3.1 through 5.5 in Sections 3.0 through 5.0 of this report. These data were calculated, where possible, from experimental data from the published literature. Sources of experimental data used to provide a statistical basis for calculated parameter values are provided in Appendices A through C. Where appropriate, examples are given to show how parameter values were calculated. Key factors that influence the magnitude of parameter values are also discussed. Such discussions exclude issues considered outside the scope of this effort (e.g., waste form durability).
Key parameter data sets, for which all or a majority of the recommended parameter values are calculated from experimental data (i.e., Tables 3.1, 4.1, and 5.1) or modeling data (Tables 5.3 and 5.4) contain sufficient statistical information to allow some flexibility of application in meeting variations in assessment objectives. If an assessment is constrained by the level of modeling effort to be applied (for example, limited to single simulation runs), then it is our recommendation that single-point “best estimates” expressed as median values be used for each variable, unless noted otherwise in the text. This recommendation includes partition coefficients and VOCs (Tables 5.2 and 5.5) as well. Using medians as “best estimates” is recommended because the various data sets are compilations from many sources and as such likely represent more than one process or population; in these cases the median is the more robust estimate of central tendency.
However, when assessment objectives include estimating impacts of parameter variability or uncertainty, or propagating uncertainty through a system, then these tables provide information believed sufficient to construct rough empirical distributions for those parameters for which the number of data points in the data set are relatively large, thereby allowing suites of simulation runs with randomly sampled inputs (i.e., Monte Carlo simulation). Examples of parameters for which this is especially appropriate are diffusion coefficients for cesium-137, radium-226, strontium-90, technetium-99, and nitrate, which have relatively large data sets.
Sensitivity case structures were developed as an aid to identifying the breadth of sensitivity case combinations from which sensitivity cases could be identified for simulation and analysis (Section 6.0). For the more complex waste/COPC scenarios, release vadose zone (VZ) transport groupings were developed based on model parameter matrices to assist in the conceptualization of the sensitivity case structures. From these structures, 13 test cases were identified for possible simulation (Section 7.0). The selection of cases focused on issues of interest to INEEL (e.g., release of uranium, plutonium, and technetium from SDA waste and subsequent release to groundwater, the performance of grouts of interest to INEEL based on selected COPC, carbon-14 release from activated metal waste, and carbon tetra-chloride release from Rocky Flats waste). Sensitivity case structures allow Idaho Completion Project (ICP) personnel to identify additional sensitivity cases beyond those identified here for possible simulation and analysis.
2.1
3.0 Recommended Effective Diffusion Coefficient (Deff) Values for COPC Release From In Situ Grouted Waste With and Without In Situ Thermal Destruction
In this section, experimental data used to derive recommended effective diffusion coefficient values for simulation of COPC release from in situ grouted SDA waste is described. Assumptions made in arriving at recommended values are discussed. Key factors that could influence the magnitude of COPC diffusion coefficients are also discussed.
3.1 Experimental Data
A search of the available literature for apparent (effective) diffusion coefficient data for COPC in cementitious waste forms was performed. Data acquired was limited to those generated using the ANSI/ANS 16.1 standard test procedure (ANS 1986). Imposing this limitation reduced the amount of uncertainty in the data that results from using different experimental procedures. The data includes diffusion coefficients that were determined during experiments designed to evaluate the effects of waste form composition, curing time and temperature, waste content, contaminant inventory and volume scale-up. Tests included those performed using de-ionized water, groundwater, or simulated groundwater as the influent. A previous study has shown that use of de-ionized water versus groundwater lead to minimal effect on the magnitude of diffusion coefficient results (i.e., results in de-ionized water were 1.7 to 2.5 times larger than those measured in groundwater [Serne et al. 1992]). Experimental diffusion coefficient values used to calculate best estimate, minimum and maximum values for COPC are summarized in Table A.1 of Appendix A.
3.2 Assessment of Data
Table 3.1 summarizes the results of the statistical analysis of experimental diffusion coefficient data in Appendix A, Table A.1. For COPC for which there was experimental data, mean (best estimate), minimum and maximum values were calculated. The size of experimental sets of data based on grout groups ranged from 3 to 69. For some COPC, no experimental data was available (i.e., actinium-227, lead-210, neptunium-237, niobium-94, protactinium-231, and VOC). Best estimate values were assigned to these COPC based on literature cited recommendations (Serne and Wood 1990; Serne et al. 1992). In some cases (e.g., niobium-94), bounds on uncertainty was assigned by using a value that approximated diffusion of water in the cement waste form as the upper bound (maximum) and assuming a log normal distribution to establish a minimum (INEEL 2000). In other cases, the best estimate value assigned was used as a maximum to establish bounds on uncertainty (e.g., neptunium-237). Because of its reactivity in the environment, activity from chlorine-36 would likely manifest itself in the form of chloride ion in the subsurface. Therefore, diffusion coefficient data for chloride ion was used to represent the behavior of chlorine-36 in cementitious waste forms.
3.1
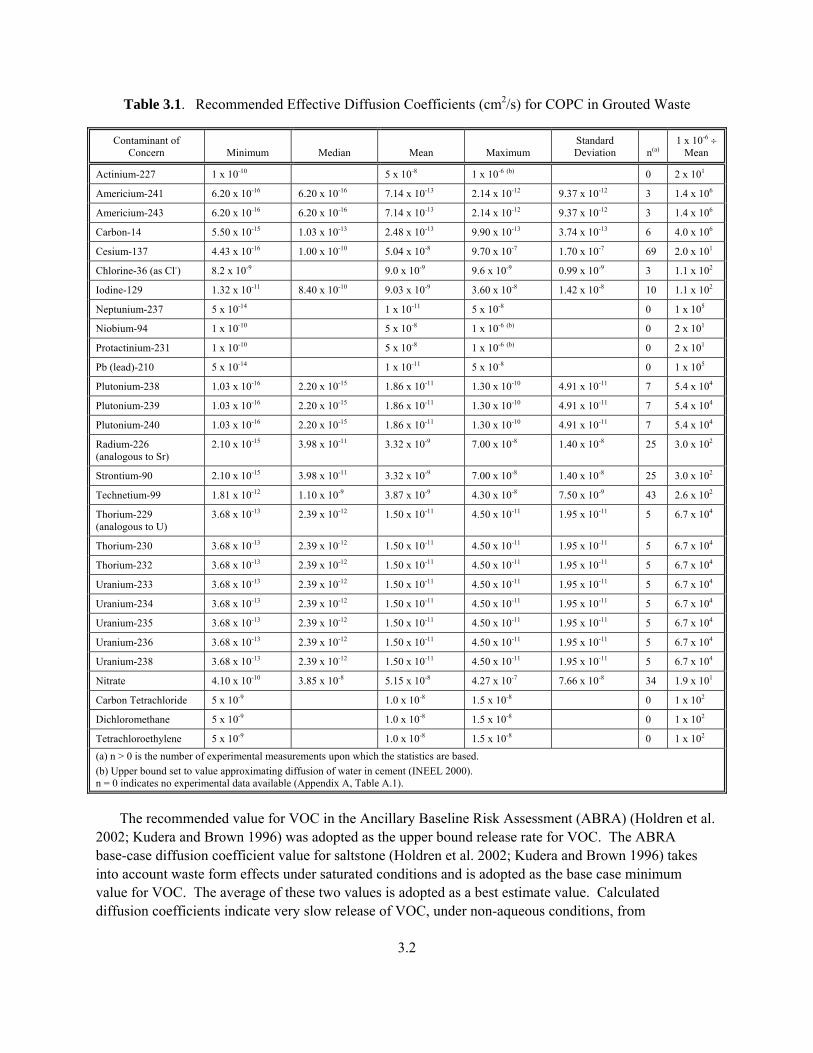
Table 3.1. Recommended Effective Diffusion Coefficients (cm2/s) for COPC in Grouted Waste
Contaminant of Concern Minimum Median Mean Maximum
Standard Deviation n(a)
1 x 10⁻⁶ ÷ Mean
Actinium-227 1 x 10⁻¹⁰ 5 x 10⁻⁸ 1 x 10⁻⁶ (b) 0 2 x 101
Americium-241 6.20 x 10⁻¹⁶ 6.20 x 10⁻¹⁶ 7.14 x 10⁻¹³ 2.14 x 10⁻¹² 9.37 x 10⁻¹² 3 1.4 x 10⁶
Americium-243 6.20 x 10⁻¹⁶ 6.20 x 10⁻¹⁶ 7.14 x 10⁻¹³ 2.14 x 10⁻¹² 9.37 x 10⁻¹² 3 1.4 x 10⁶
Carbon-14 5.50 x 10⁻¹⁵ 1.03 x 10⁻¹³ 2.48 x 10⁻¹³ 9.90 x 10⁻¹³ 3.74 x 10⁻¹³ 6 4.0 x 10⁶
Cesium-137 4.43 x 10⁻¹⁶ 1.00 x 10⁻¹⁰ 5.04 x 10⁻⁸ 9.70 x 10⁻⁷ 1.70 x 10⁻⁷ 69 2.0 x 101
Chlorine-36 (as Cl-) 8.2 x 10⁻⁹ 9.0 x 10⁻⁹ 9.6 x 10⁻⁹ 0.99 x 10⁻⁹ 3 1.1 x 10²
Iodine-129 1.32 x 10⁻¹¹ 8.40 x 10⁻¹⁰ 9.03 x 10⁻⁹ 3.60 x 10⁻⁸ 1.42 x 10⁻⁸ 10 1.1 x 10²
Neptunium-237 5 x 10-14 1 x 10-11 5 x 10⁻⁸ 0 1 x 10⁵
Niobium-94 1 x 10⁻¹⁰ 5 x 10⁻⁸ 1 x 10⁻⁶ (b) 0 2 x 101
Protactinium-231 1 x 10⁻¹⁰ 5 x 10⁻⁸ 1 x 10⁻⁶ (b) 0 2 x 101
Pb (lead)-210 5 x 10-14 1 x 10-11 5 x 10⁻⁸ 0 1 x 10⁵
Plutonium-238 1.03 x 10⁻¹⁶ 2.20 x 10⁻¹⁵ 1.86 x 10⁻¹¹ 1.30 x 10⁻¹⁰ 4.91 x 10⁻¹¹ 7 5.4 x 10⁴
Plutonium-239 1.03 x 10⁻¹⁶ 2.20 x 10⁻¹⁵ 1.86 x 10⁻¹¹ 1.30 x 10⁻¹⁰ 4.91 x 10⁻¹¹ 7 5.4 x 10⁴
Plutonium-240 1.03 x 10⁻¹⁶ 2.20 x 10⁻¹⁵ 1.86 x 10⁻¹¹ 1.30 x 10⁻¹⁰ 4.91 x 10⁻¹¹ 7 5.4 x 10⁴
Radium-226 (analogous to Sr)
2.10 x 10⁻¹⁵ 3.98 x 10⁻¹¹ 3.32 x 10⁻⁹ 7.00 x 10⁻⁸ 1.40 x 10⁻⁸ 25 3.0 x 10²
Strontium-90 2.10 x 10⁻¹⁵ 3.98 x 10⁻¹¹ 3.32 x 10⁻⁹ 7.00 x 10⁻⁸ 1.40 x 10⁻⁸ 25 3.0 x 10²
Technetium-99 1.81 x 10⁻¹² 1.10 x 10⁻⁹ 3.87 x 10⁻⁹ 4.30 x 10⁻⁸ 7.50 x 10⁻⁹ 43 2.6 x 10²
Thorium-229 (analogous to U)
3.68 x 10⁻¹³ 2.39 x 10⁻¹² 1.50 x 10⁻¹¹ 4.50 x 10⁻¹¹ 1.95 x 10⁻¹¹ 5 6.7 x 10⁴
Thorium-230 3.68 x 10⁻¹³ 2.39 x 10⁻¹² 1.50 x 10⁻¹¹ 4.50 x 10⁻¹¹ 1.95 x 10⁻¹¹ 5 6.7 x 10⁴
Thorium-232 3.68 x 10⁻¹³ 2.39 x 10⁻¹² 1.50 x 10⁻¹¹ 4.50 x 10⁻¹¹ 1.95 x 10⁻¹¹ 5 6.7 x 10⁴
Uranium-233 3.68 x 10⁻¹³ 2.39 x 10⁻¹² 1.50 x 10⁻¹¹ 4.50 x 10⁻¹¹ 1.95 x 10⁻¹¹ 5 6.7 x 10⁴
Uranium-234 3.68 x 10⁻¹³ 2.39 x 10⁻¹² 1.50 x 10⁻¹¹ 4.50 x 10⁻¹¹ 1.95 x 10⁻¹¹ 5 6.7 x 10⁴
Uranium-235 3.68 x 10⁻¹³ 2.39 x 10⁻¹² 1.50 x 10⁻¹¹ 4.50 x 10⁻¹¹ 1.95 x 10⁻¹¹ 5 6.7 x 10⁴
Uranium-236 3.68 x 10⁻¹³ 2.39 x 10⁻¹² 1.50 x 10⁻¹¹ 4.50 x 10⁻¹¹ 1.95 x 10⁻¹¹ 5 6.7 x 10⁴
Uranium-238 3.68 x 10⁻¹³ 2.39 x 10⁻¹² 1.50 x 10⁻¹¹ 4.50 x 10⁻¹¹ 1.95 x 10⁻¹¹ 5 6.7 x 10⁴
Nitrate 4.10 x 10⁻¹⁰ 3.85 x 10⁻⁸ 5.15 x 10⁻⁸ 4.27 x 10⁻⁷ 7.66 x 10⁻⁸ 34 1.9 x 101
Carbon Tetrachloride 5 x 10⁻⁹ 1.0 x 10⁻⁸ 1.5 x 10⁻⁸ 0 1 x 10²
Dichloromethane 5 x 10⁻⁹ 1.0 x 10⁻⁸ 1.5 x 10⁻⁸ 0 1 x 10²
Tetrachloroethylene 5 x 10⁻⁹ 1.0 x 10⁻⁸ 1.5 x 10⁻⁸ 0 1 x 10²
(a) n > 0 is the number of experimental measurements upon which the statistics are based. (b) Upper bound set to value approximating diffusion of water in cement (INEEL 2000). n = 0 indicates no experimental data available (Appendix A, Table A.1).
The recommended value for VOC in the Ancillary Baseline Risk Assessment (ABRA) (Holdren et al. 2002; Kudera and Brown 1996) was adopted as the upper bound release rate for VOC. The ABRA base-case diffusion coefficient value for saltstone (Holdren et al. 2002; Kudera and Brown 1996) takes into account waste form effects under saturated conditions and is adopted as the base case minimum value for VOC. The average of these two values is adopted as a best estimate value. Calculated diffusion coefficients indicate very slow release of VOC, under non-aqueous conditions, from
3.2
INEEL grouts of interest (Appendix A, Table A.2). These findings suggest that the value for saltstone adopted as the base case minimum as reasonable.
Isotopes of COPC (i.e., americium, plutonium, thorium, and uranium) were assigned the same diffusion coefficient value. Radium-226 was viewed as analogous to strontium, thus, the diffusion coefficient values for strontium were assigned to radium-226. In a similar fashion, the diffusion coefficient values for uranium were assigned to all the isotopes of thorium (Serne and Wood 1990).
In the past, the process modeled for release of contaminants from ISG waste was assumed to be diffusion to the surface of 0.6-meter diameter columns (Holdren et al. 2002). The effects of cracks between interlocking columns were ignored. Contaminants were released into the infiltrating water (up to their solubility limit) from the grout column surfaces at volumetric rates equal to the infiltration rate times the surface area of the grouted waste contacted by the water. A diffusion coefficient of 1.0 x 10⁻⁶ cm2/s was used for all contaminants released from concrete columns. Mean values of recommended diffusion coefficients in Table 3.1 range from 100 to 4 x 10⁶ times smaller than the value used in the modeling effort.
3.3 Factors Affecting COPC Diffusivities in Grouted Waste
Factors that can influence the magnitude of COPC diffusion coefficients are sediment moisture, content, carbonation, and the physical/chemical properties of grout formations. These factors are discussed based on available experimental data and knowledge of subsurface conditions at the SDA.
3.3.1 Sediment Moisture Content
The ANSI/ANS 16.1 test procedure is performed under saturated conditions. Effective diffusivities of contaminants in cementitious waste forms under saturated conditions likely overestimate diffusion of contaminants out of cementitious waste forms in contact with sediments of low moisture content. The only reported work found in COPC diffusivities in low moisture content sediments was that of Mattigod et al. (2002). In this study, the diffusivity of iodine and technetium was studied in a concrete waste form consisting of Portland cement, a pozzolanic material (Class F fly ash), fine and coarse aggregates, and steel fiber at a water to cement ratio of 0.4 and air content of 6%. Results for the waste form in contact with soil containing 4% and 7% moisture contents is summarized in Appendix A, Table A.4. Iodine showed effective diffusivities on the order of 40 to 100 times lower than those observed for the standard ANSI/ANS-16.1 leach test for a soil with 7% moisture content. Effective diffusivity of iodine in soil with 4% moisture content was up to a factor of ten lower than observed in soil with 7% moisture content. The effect of reduced effective diffusivity was greater for technetium than for iodine by up to an order of magnitude for both 7% and 4% moisture content levels.
Volumetric moisture content of sediments in the SDA has been shown to range from 3 to 32% by volume at depths ranging from the surface to 5.7 meters in depth. Those moisture contents that have been shown to have an effect on diffusion rates (i.e., 3 to 7 %) only reside in the top 0.2 meter of SDA sediment (Davis and Pittman 1990). Thus moisture content is not anticipated to have a significant effect on reducing contaminant diffusion rates out of grouted waste disposed in the SDA.
3.3

3.3.2 Carbonation
Cementious waste forms can undergo a process called carbonation. Carbonation occurs as a result of contact of the highly basic waste form with vadose zone soil gases. Although soil gas composition can be highly variable, increased levels of carbon dioxide (CO2) and reduced levels of oxygen, relative to the atmosphere, are expected because of the presence of microbial activity. Carbon dioxide reacts with the mineral phases of the waste form resulting in the formation of calcium carbonate and releasing water. The water accumulating in the waste form pore spaces prevents extensive migration of CO2 into the interior regions of the waste form, limiting the size of the fully carbonated layer to an exterior rind (Venhuis and Reardon 2001).
Calcium carbonate appears to increase binding capacity for some contaminants (Appendix A, Table A.5-cesium and strontium) and improve the structural properties of the waste form. During the carbonation process, calcium carbonate precipitates in the waste form pore spaces, increasing density, and reducing waste form permeability (Lange et al. 1996a; Lange et al. 1996b). Smith and Walton 1991 showed that release rates of strontium-90 and cobalt-60 from carbonated concrete were 5 orders of magnitude lower than for intact, unweathered concrete and that the thin carbonated zone was a significant sink for those radionuclides. In contrast, nitrate and chloride, appear to diffuse more rapidly in carbonated concrete (Appendix A, Table A.5).
Petrographic analysis of 54-year-old concrete samples from a below-the-ground portion of Hanford Site’s 221-U facility foundation has indicated the presence of paste carbonation to an average depth of 0.5 cm on concrete surfaces with maximum observed in the range of 3.0 to 3.8 cm on outside surfaces of walls. The paste carbonation did not reduce the hardness of the concrete (Baxter 1999). These results were consistent with previous B-Plant structural evaluations (Cruz 1992). Most recently, transport of radionuclide contaminants out of a cementitious nuclear waste repository was modeled and demonstrated to be reduced due to the formation of a self sealing barrier composed of calcite at the rock-repository interface (Pfingsten 2001).
3.3.3 Alternative Grout Formulations: Thermosetting and Thermoplastic Grouts
A number of thermosetting and thermoplastic grouts have been evaluated as alternative barrier materials for containment of contaminants in waste sites (Heiser and Millian 1994; Heiser and Fuhrmann 1997; Soo and Heiser 1996; Milian et al. 1997). Such grouts have the potential for avoiding some of the durability problems encountered in Portland cement-based grouts (e.g., stress cracking). Among the thermoplastic grouts studied were WaxfixTM and Montan wax. WaxfixTM is a low melting plastic molten waxy grout, formulated by Carter Technologies Co., Surgarland, Texas. Montan wax is extracted from lignite coal (Soo and Heiser 1996). INEEL has expressed interest in high-pressure jet injection to stabilize subsurface wastes at the SDA in monoliths of WaxfixTM and Montan wax grouts.
Accelerated leach tests (110°C) have been performed on grouts consisting of a surrogate waste stream containing WaxfixTM, TECT 1 (a two component, high density cementitious grout), and Carbray 100 (a two component elastomer-type epoxy). After curing, Carbray 100 showed measurable leaching of lead and chromium (diffusion coefficients of 2.6 x 10⁻⁹cm2/s and 1.0 x 10⁻⁹cm2/s for lead and chromium,
3.4
3.5
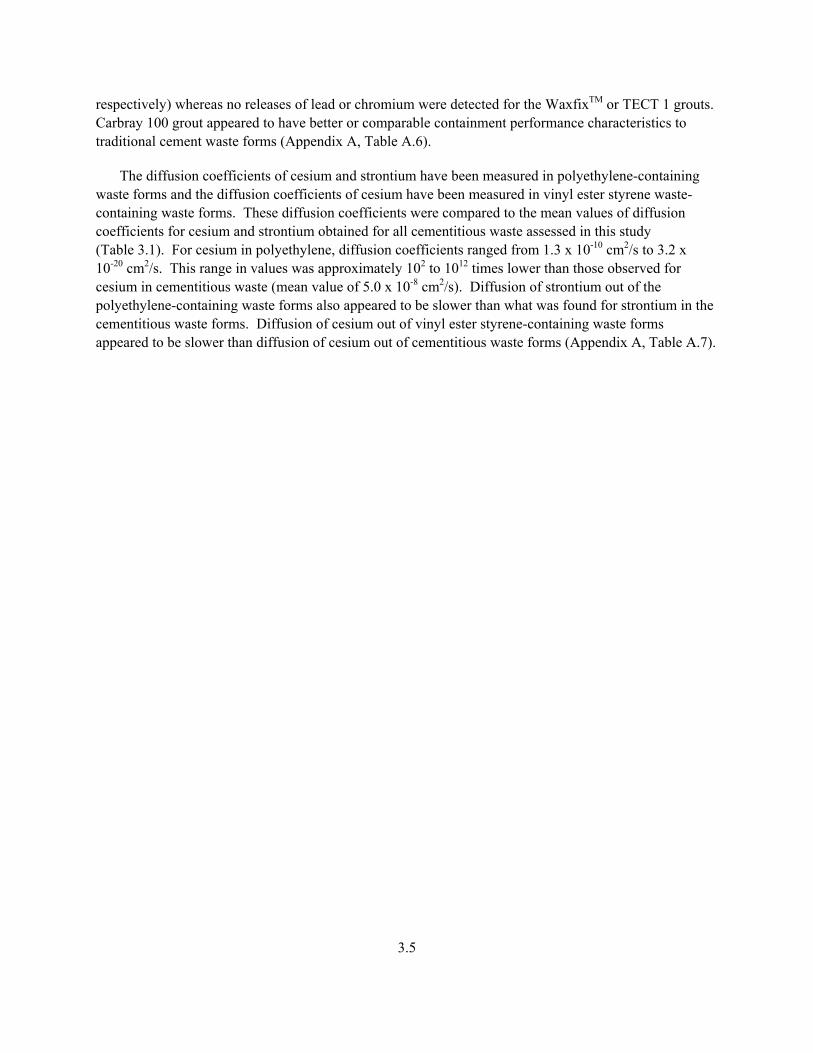
respectively) whereas no releases of lead or chromium were detected for the WaxfixTM or TECT 1 grouts. Carbray 100 grout appeared to have better or comparable containment performance characteristics to traditional cement waste forms (Appendix A, Table A.6).
The diffusion coefficients of cesium and strontium have been measured in polyethylene-containing waste forms and the diffusion coefficients of cesium have been measured in vinyl ester styrene waste-containing waste forms. These diffusion coefficients were compared to the mean values of diffusion coefficients for cesium and strontium obtained for all cementitious waste assessed in this study (Table 3.1). For cesium in polyethylene, diffusion coefficients ranged from 1.3 x 10⁻¹⁰ cm2/s to 3.2 x 10⁻²⁰ cm2/s. This range in values was approximately 102 to 1012 times lower than those observed for cesium in cementitious waste (mean value of 5.0 x 10⁻⁸ cm2/s). Diffusion of strontium out of the polyethylene-containing waste forms also appeared to be slower than what was found for strontium in the cementitious waste forms. Diffusion of cesium out of vinyl ester styrene-containing waste forms appeared to be slower than diffusion of cesium out of cementitious waste forms (Appendix A, Table A.7).
4.0 Recommended Bulk Dissolution Rate Values for COPC Release from In Situ Vitrified Waste
In this section, bulk dissolution rate data derived from laboratory and pilot-scale experiments on ISV samples is discussed. Bulk dissolution rate values are pooled to derive recommended bulk dissolution rate values for use in simulating COPC release for ISV SDA waste.
4.1 Experimental Data
ISV technology has been demonstrated on wastes from several DOE sites over the past 30 years (Callow et al. 1991; Buelt et al. 1987; Campbell and Buelt 1990; Spaulding et al. 1997; Shaw et al. 1993). However, data on the dissolution rates of the waste forms created from these tests is sparse. A corrosion rate for a vitrified DOE Hanford site soil, determined at 99°C has been reported (0.8 x 10⁻⁵ g/cm2-d) and found to be comparable to Pyrex® and was more leach resistant than a commercial high-level waste glass (Timmerman et al. 1983). Callow et al. 1991 reported bulk dissolution rates measured at 100°C on INEEL ISV glass samples that fell in the range of 0.2 x 10⁻⁶ g/cm2-d to 4.8 x 10⁻⁶ g/cm2-d. Soils from Oak Ridge National Laboratory have also been subjected to in situ vitrification. Dissolution rates measured on laboratory and pilot scale treated samples at 90°C were 1.8 x 10⁻⁶ g/cm2-d and 1.3 x 10⁻⁶ g/cm2-d, respectively. These results, corrected to a temperature of 25°C (Whited et al. 1998), along with other bulk vitrified waste dissolution data is summarized in Appendix B, Table B.1. Corrected dissolution rates for all samples were in the range of 8.0 x 10⁻⁸ g/cm2-d to 9.0 x 10⁻¹⁰ g/cm2-d.
4.2 Assessment of Data
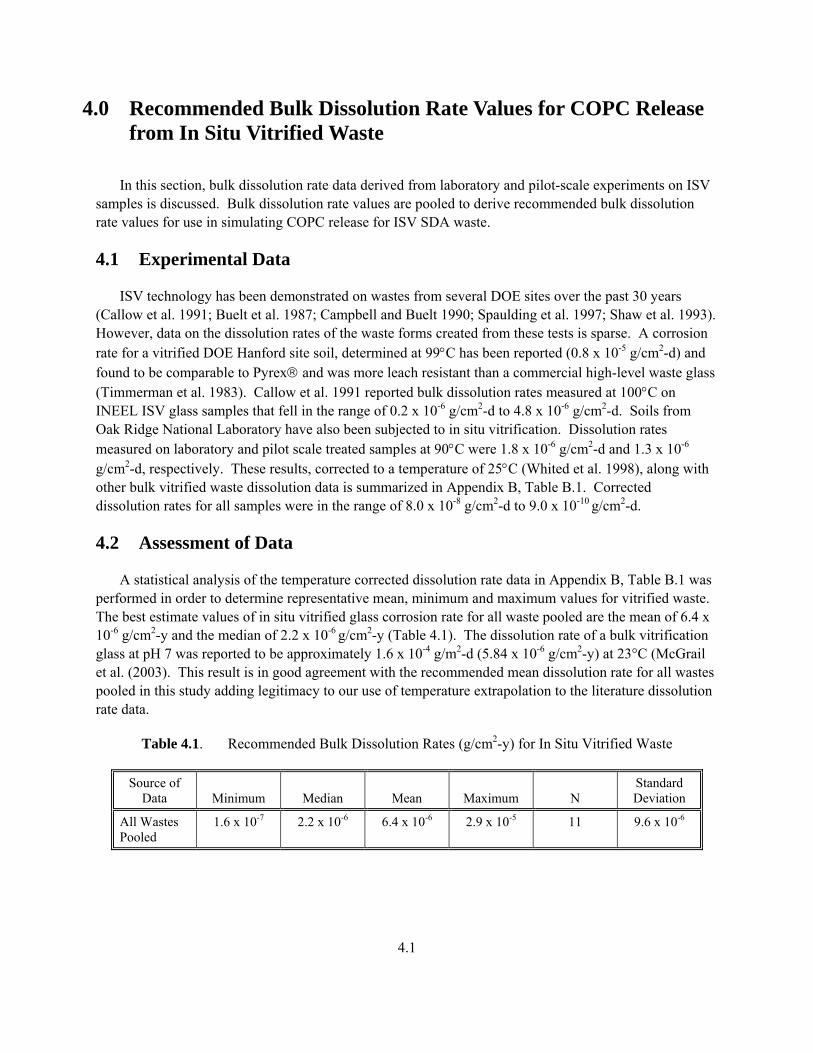
A statistical analysis of the temperature corrected dissolution rate data in Appendix B, Table B.1 was performed in order to determine representative mean, minimum and maximum values for vitrified waste. The best estimate values of in situ vitrified glass corrosion rate for all waste pooled are the mean of 6.4 x 10⁻⁶ g/cm2-y and the median of 2.2 x 10⁻⁶ g/cm2-y (Table 4.1). The dissolution rate of a bulk vitrification glass at pH 7 was reported to be approximately 1.6 x 10⁻⁴ g/m2-d (5.84 x 10⁻⁶ g/cm2-y) at 23°C (McGrail et al. (2003). This result is in good agreement with the recommended mean dissolution rate for all wastes pooled in this study adding legitimacy to our use of temperature extrapolation to the literature dissolution rate data.
Table 4.1. Recommended Bulk Dissolution Rates (g/cm2-y) for In Situ Vitrified Waste
Source of Data Minimum Median Mean Maximum N
Standard Deviation
All Wastes Pooled
1.6 x 10⁻⁷ 2.2 x 10⁻⁶ 6.4 x 10⁻⁶ 2.9 x 10⁻⁵ 11 9.6 x 10⁻⁶
4.1
5.0 Recommended Parameter Values for COPC Release from Untreated Waste (Base Case)
In this section, analysis and assessment of data and identification of recommended parameter values for simulation of COPC release from untreated SDA waste is discussed. Key parameters discussed in this context are fractional release rates for COPC release from activated metal waste, partition coefficients and solubility for COPC release from unconsolidated SDA waste, and diffusion coefficients for VOC release from Rocky Flats Waste.
5.1 Fractional Release Rate Values for COPC Release from Activated Metal Waste
Corrosion rate data for selected metals (beryllium, aluminum, stainless steels) were used to calculate recommended fractional release rates for simulating COPC release from activated metal waste.
5.1.1 Experimental Data
A large portion of the radioactive content of waste disposed at the SDA consists of neutron-irradiated metals, mostly reactor core structural components (i.e., subassemblies, cladding, and other non-fuel reactor core components) composed of stainless steels (i.e., [304 and 316], nickel-based alloys (such as Inconel 718) and other metals (i.e., aluminum, beryllium, and Zircoloy-4 (Nagata and Banaee 1996; Adler Flitton et al. 2001).
The source of experimental data was a study where the above metals were exposed to subsurface soils located adjacent to the SDA for up to 3 years (Adler-Flitton et al. 2001). Corrosion rates and subse-quently, fractional release rates were calculated from measured corrosion rates, the density of each metal, and the surface area of the coupon. Since the metal wastes come in a broad range of shapes and sizes, an area to volume ratio of 0.535 was assumed for all waste in the calculations (see Appendix C, Table C.1).
5.1.2 Assessment of Data
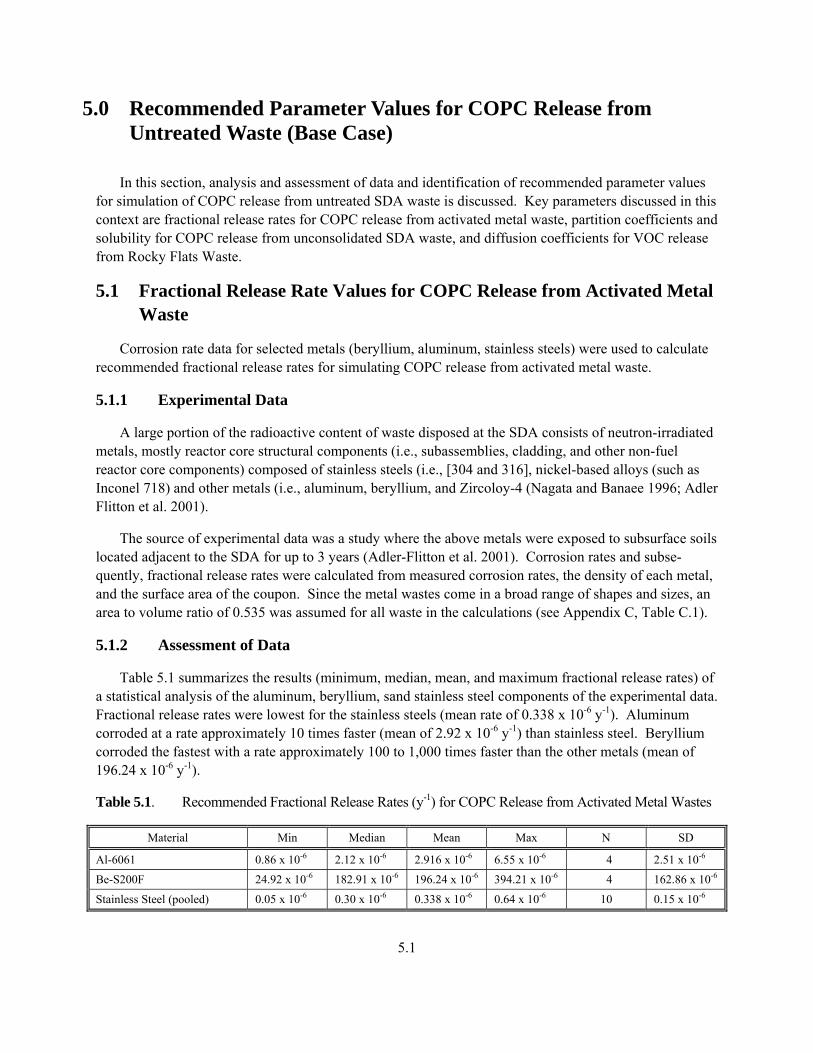
Table 5.1 summarizes the results (minimum, median, mean, and maximum fractional release rates) of a statistical analysis of the aluminum, beryllium, sand stainless steel components of the experimental data. Fractional release rates were lowest for the stainless steels (mean rate of 0.338 x 10⁻⁶ y-1). Aluminum corroded at a rate approximately 10 times faster (mean of 2.92 x 10⁻⁶ y-1) than stainless steel. Beryllium corroded the fastest with a rate approximately 100 to 1,000 times faster than the other metals (mean of 196.24 x 10⁻⁶ y-1).
Table 5.1. Recommended Fractional Release Rates (y-1) for COPC Release from Activated Metal Wastes
Material Min Median Mean Max N SD
Al-6061 0.86 x 10⁻⁶ 2.12 x 10⁻⁶ 2.916 x 10⁻⁶ 6.55 x 10⁻⁶ 4 2.51 x 10⁻⁶
Be-S200F 24.92 x 10⁻⁶ 182.91 x 10⁻⁶ 196.24 x 10⁻⁶ 394.21 x 10⁻⁶ 4 162.86 x 10⁻⁶
Stainless Steel (pooled) 0.05 x 10⁻⁶ 0.30 x 10⁻⁶ 0.338 x 10⁻⁶ 0.64 x 10⁻⁶ 10 0.15 x 10⁻⁶
5.1
5.2 Partition Coefficient Values for COPC Release from Unconsolidated Waste
Recommended partition coefficient values based on the assessment of Dicke (1997) were refined based on more recent experimental work that determined Kds for selected radionuclides (i.e., neptunium, americium, thorium, plutonium, and uranium) in INEEL discrete and composited interbed sediments.
5.2.1 Experimental and Estimated Data
A majority of the recommended partition coefficient values were based on the assessment of Dicke (1997) with refinements made where more recent experimental data was available (Fjeld et al. 2000; Grossman et al. 2001, Appendix C, Table C.2). Dicke placed primary reliance on site-specific experimentally measured Kds (i.e., SDA specific), second, Kd values measured on sediments from other locations on the INEEL, and third, experimental values obtained from the literature. This approach was taken in order to be as consistent as possible with guidance provided by the U.S. Environmental Protection Agency (EPA 1999) that partition coefficient values measured under site-specific conditions are absolutely essential for site-specific assessments.
5.2.2 Assessment of Data
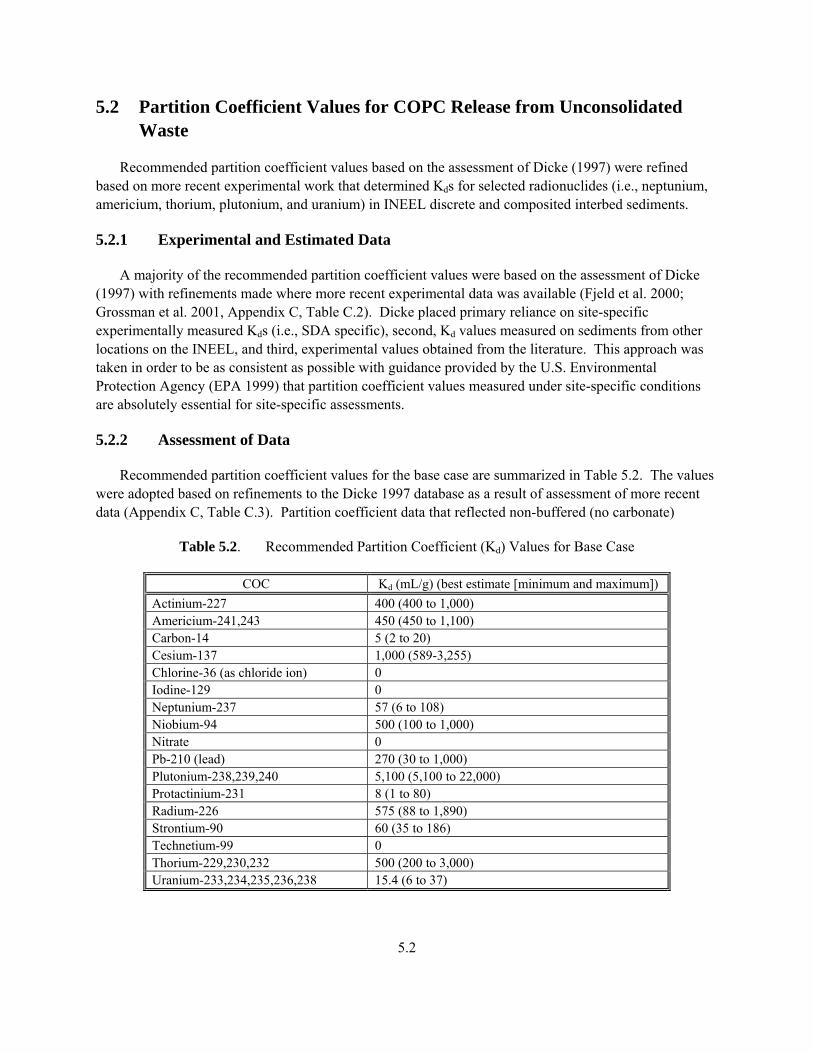
Recommended partition coefficient values for the base case are summarized in Table 5.2. The values were adopted based on refinements to the Dicke 1997 database as a result of assessment of more recent data (Appendix C, Table C.3). Partition coefficient data that reflected non-buffered (no carbonate)
Table 5.2. Recommended Partition Coefficient (Kd) Values for Base Case
COC Kd (mL/g) (best estimate [minimum and maximum]) Actinium-227 400 (400 to 1,000) Americium-241,243 450 (450 to 1,100) Carbon-14 5 (2 to 20) Cesium-137 1,000 (589-3,255) Chlorine-36 (as chloride ion) 0 Iodine-129 0 Neptunium-237 57 (6 to 108) Niobium-94 500 (100 to 1,000) Nitrate 0 Pb-210 (lead) 270 (30 to 1,000) Plutonium-238,239,240 5,100 (5,100 to 22,000) Protactinium-231 8 (1 to 80) Radium-226 575 (88 to 1,890) Strontium-90 60 (35 to 186) Technetium-99 0 Thorium-229,230,232 500 (200 to 3,000) Uranium-233,234,235,236,238 15.4 (6 to 37)
5.2
environment (Appendix C, Table C.2) were not considered because it was assumed that SDA sediment pH would be buffered under natural conditions in the range of 7 to 8. Partition coefficients reflecting the potential effects of EDTA complexation on radionuclide migration (Appendix C, Table C.2) were not considered because EDTA was not a part of Rocky Flats waste disposal at the SDA (personal communi-cation between Danny Anderson of ICP personnel and Bob Riley of PNNL). Partition coefficient values for neptunium and uranium on INEEL-interbed sediments (Grossman et al. 2001) were adopted over those previously recommended by Dicke 1997.
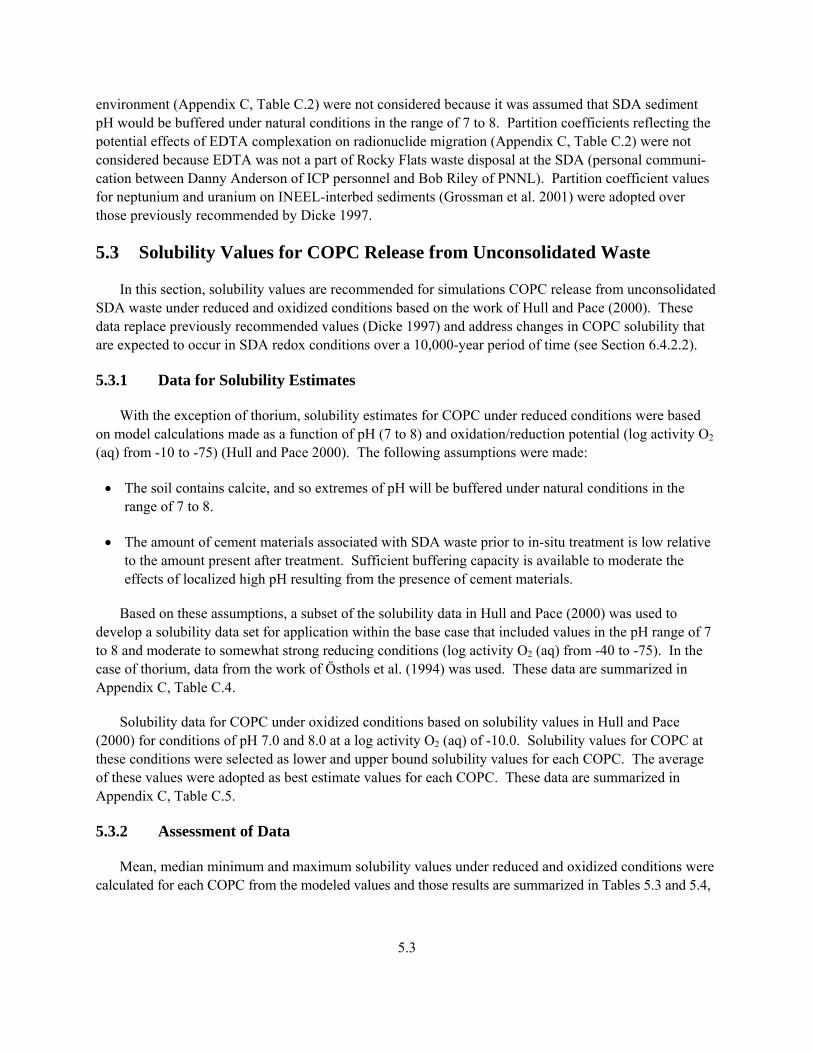
5.3 Solubility Values for COPC Release from Unconsolidated Waste
In this section, solubility values are recommended for simulations COPC release from unconsolidated SDA waste under reduced and oxidized conditions based on the work of Hull and Pace (2000). These data replace previously recommended values (Dicke 1997) and address changes in COPC solubility that are expected to occur in SDA redox conditions over a 10,000-year period of time (see Section 6.4.2.2).
5.3.1 Data for Solubility Estimates
With the exception of thorium, solubility estimates for COPC under reduced conditions were based on model calculations made as a function of pH (7 to 8) and oxidation/reduction potential (log activity O2 (aq) from -10 to -75) (Hull and Pace 2000). The following assumptions were made:
• The soil contains calcite, and so extremes of pH will be buffered under natural conditions in the range of 7 to 8.
• The amount of cement materials associated with SDA waste prior to in-situ treatment is low relative to the amount present after treatment. Sufficient buffering capacity is available to moderate the effects of localized high pH resulting from the presence of cement materials.
Based on these assumptions, a subset of the solubility data in Hull and Pace (2000) was used to develop a solubility data set for application within the base case that included values in the pH range of 7 to 8 and moderate to somewhat strong reducing conditions (log activity O2 (aq) from -40 to -75). In the case of thorium, data from the work of Östhols et al. (1994) was used. These data are summarized in Appendix C, Table C.4.
Solubility data for COPC under oxidized conditions based on solubility values in Hull and Pace (2000) for conditions of pH 7.0 and 8.0 at a log activity O2 (aq) of -10.0. Solubility values for COPC at these conditions were selected as lower and upper bound solubility values for each COPC. The average of these values were adopted as best estimate values for each COPC. These data are summarized in Appendix C, Table C.5.
5.3.2 Assessment of Data
Mean, median minimum and maximum solubility values under reduced and oxidized conditions were calculated for each COPC from the modeled values and those results are summarized in Tables 5.3 and 5.4,
5.3
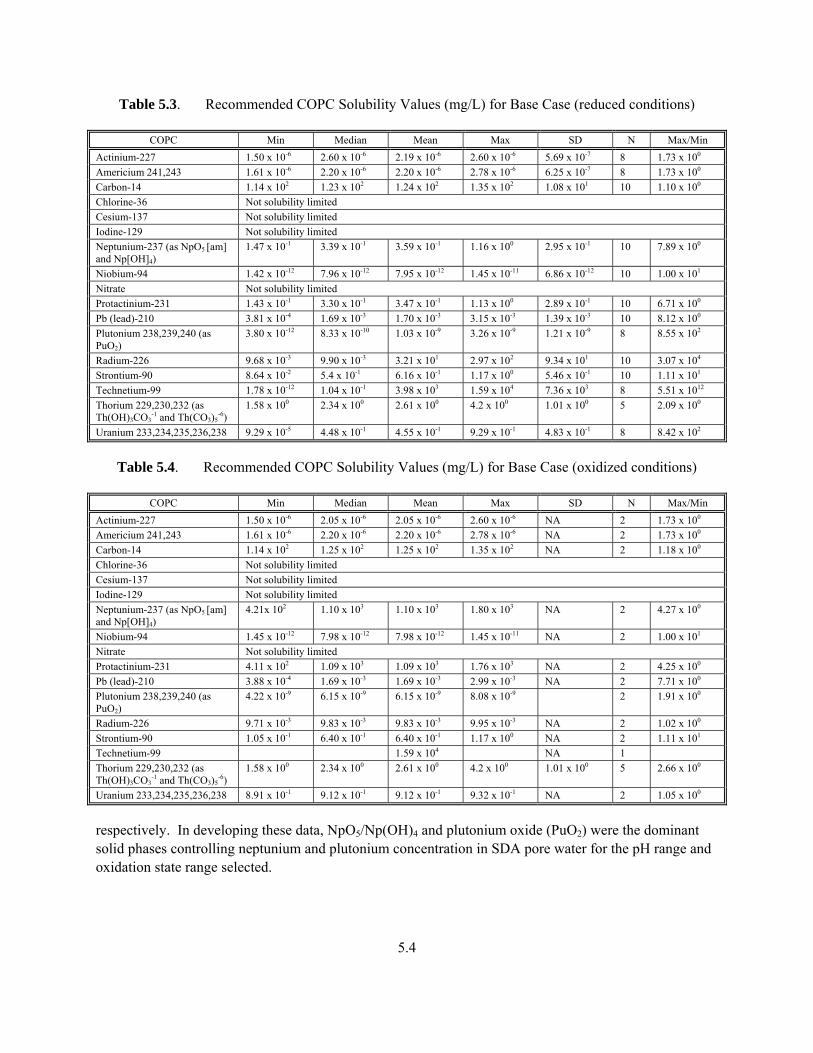
Table 5.3. Recommended COPC Solubility Values (mg/L) for Base Case (reduced conditions)
COPC Min Median Mean Max SD N Max/Min Actinium-227 1.50 x 10⁻⁶ 2.60 x 10⁻⁶ 2.19 x 10⁻⁶ 2.60 x 10⁻⁶ 5.69 x 10⁻⁷ 8 1.73 x 100
Americium 241,243 1.61 x 10⁻⁶ 2.20 x 10⁻⁶ 2.20 x 10⁻⁶ 2.78 x 10⁻⁶ 6.25 x 10⁻⁷ 8 1.73 x 100 Carbon-14 1.14 x 10² 1.23 x 10² 1.24 x 10² 1.35 x 10² 1.08 x 101 10 1.10 x 100 Chlorine-36 Not solubility limited Cesium-137 Not solubility limited Iodine-129 Not solubility limited Neptunium-237 (as NpO5 [am] and Np[OH]4)
1.47 x 10⁻¹ 3.39 x 10⁻¹ 3.59 x 10⁻¹ 1.16 x 100 2.95 x 10⁻¹ 10 7.89 x 100
Niobium-94 1.42 x 10⁻¹² 7.96 x 10⁻¹² 7.95 x 10⁻¹² 1.45 x 10⁻¹¹ 6.86 x 10⁻¹² 10 1.00 x 101 Nitrate Not solubility limited Protactinium-231 1.43 x 10⁻¹ 3.30 x 10⁻¹ 3.47 x 10⁻¹ 1.13 x 100 2.89 x 10⁻¹ 10 6.71 x 100 Pb (lead)-210 3.81 x 10⁻⁴ 1.69 x 10⁻³ 1.70 x 10⁻³ 3.15 x 10⁻³ 1.39 x 10⁻³ 10 8.12 x 100 Plutonium 238,239,240 (as PuO2)
3.80 x 10⁻¹² 8.33 x 10⁻¹⁰ 1.03 x 10⁻⁹ 3.26 x 10⁻⁹ 1.21 x 10⁻⁹ 8 8.55 x 10²
Radium-226 9.68 x 10⁻³ 9.90 x 10⁻³ 3.21 x 101 2.97 x 10² 9.34 x 101 10 3.07 x 10⁴ Strontium-90 8.64 x 10⁻² 5.4 x 10⁻¹ 6.16 x 10⁻¹ 1.17 x 100 5.46 x 10⁻¹ 10 1.11 x 101 Technetium-99 1.78 x 10⁻¹² 1.04 x 10⁻¹ 3.98 x 10³ 1.59 x 10⁴ 7.36 x 10³ 8 5.51 x 10¹² Thorium 229,230,232 (as Th(OH)3CO3
-1 and Th(CO3)5-6)
1.58 x 100 2.34 x 100 2.61 x 100 4.2 x 100 1.01 x 100 5 2.09 x 100
Uranium 233,234,235,236,238 9.29 x 10⁻⁵ 4.48 x 10⁻¹ 4.55 x 10⁻¹ 9.29 x 10⁻¹ 4.83 x 10⁻¹ 8 8.42 x 10²
Table 5.4. Recommended COPC Solubility Values (mg/L) for Base Case (oxidized conditions)
COPC Min Median Mean Max SD N Max/Min Actinium-227 1.50 x 10⁻⁶ 2.05 x 10⁻⁶ 2.05 x 10⁻⁶ 2.60 x 10⁻⁶ NA 2 1.73 x 100
Americium 241,243 1.61 x 10⁻⁶ 2.20 x 10⁻⁶ 2.20 x 10⁻⁶ 2.78 x 10⁻⁶ NA 2 1.73 x 100
Carbon-14 1.14 x 10² 1.25 x 10² 1.25 x 10² 1.35 x 10² NA 2 1.18 x 100
Chlorine-36 Not solubility limited Cesium-137 Not solubility limited Iodine-129 Not solubility limited Neptunium-237 (as NpO5 [am] and Np[OH]4)
4.21x 10² 1.10 x 10³ 1.10 x 10³ 1.80 x 10³ NA 2 4.27 x 100
Niobium-94 1.45 x 10⁻¹² 7.98 x 10⁻¹² 7.98 x 10⁻¹² 1.45 x 10⁻¹¹ NA 2 1.00 x 101
Nitrate Not solubility limited Protactinium-231 4.11 x 10² 1.09 x 10³ 1.09 x 10³ 1.76 x 10³ NA 2 4.25 x 100
Pb (lead)-210 3.88 x 10⁻⁴ 1.69 x 10⁻³ 1.69 x 10⁻³ 2.99 x 10⁻³ NA 2 7.71 x 100
Plutonium 238,239,240 (as PuO2)
4.22 x 10⁻⁹ 6.15 x 10⁻⁹ 6.15 x 10⁻⁹ 8.08 x 10⁻⁹ 2 1.91 x 100
Radium-226 9.71 x 10⁻³ 9.83 x 10⁻³ 9.83 x 10⁻³ 9.95 x 10⁻³ NA 2 1.02 x 100
Strontium-90 1.05 x 10⁻¹ 6.40 x 10⁻¹ 6.40 x 10⁻¹ 1.17 x 100 NA 2 1.11 x 101
Technetium-99 1.59 x 10⁴ NA 1 Thorium 229,230,232 (as Th(OH)3CO3
-1 and Th(CO3)5-6)
1.58 x 100 2.34 x 100 2.61 x 100 4.2 x 100 1.01 x 100 5 2.66 x 100
Uranium 233,234,235,236,238 8.91 x 10⁻¹ 9.12 x 10⁻¹ 9.12 x 10⁻¹ 9.32 x 10⁻¹ NA 2 1.05 x 100
respectively. In developing these data, NpO5/Np(OH)4 and plutonium oxide (PuO2) were the dominant solid phases controlling neptunium and plutonium concentration in SDA pore water for the pH range and oxidation state range selected.
5.4
Mean, minimum, and maximum solubility values for each COPC in Tables 5.3 and 5.4 were compared to the solubility values reported in Dicke 1997 (Appendix C, Table C.6, column 2). Solubility values in Dicke 1997 are not specific to the INEEL site whereas the solubility values from Hull and Pace (2000) as shown here in Tables 5.3 and 5.4 are specific to conditions at the INEEL SDA site. Thus, solubility values from Hull and Pace (2000) are recommended for base case release modeling.
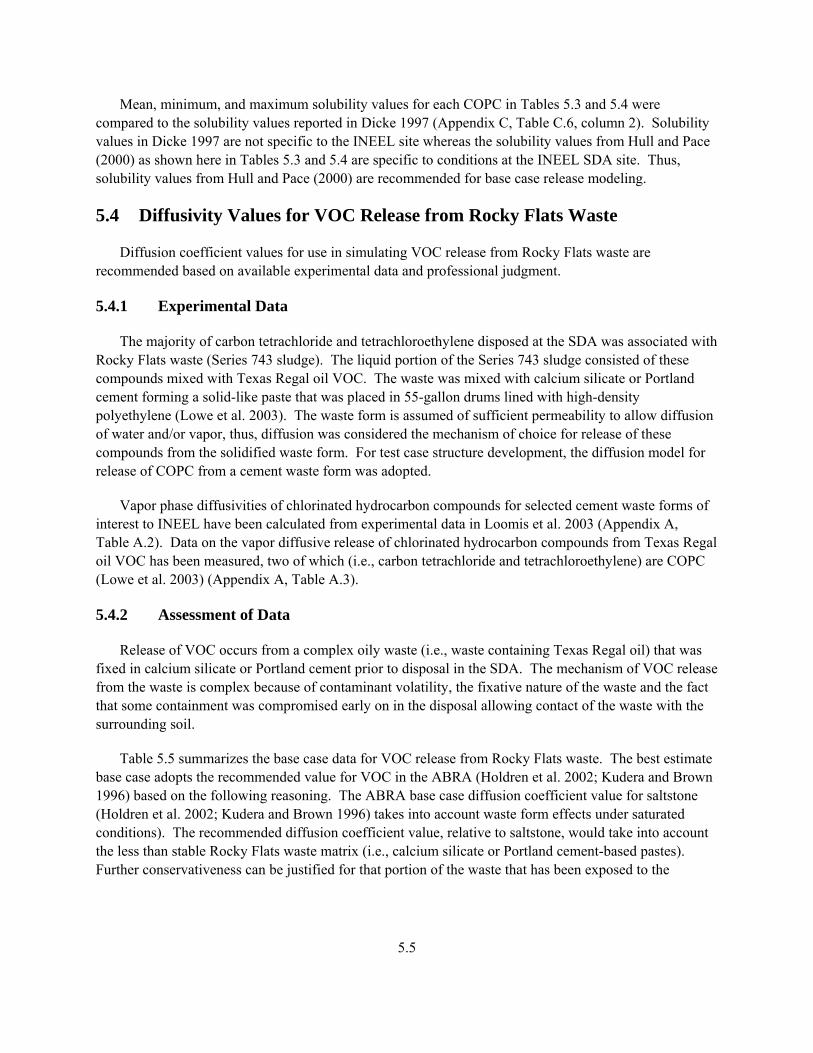
5.4 Diffusivity Values for VOC Release from Rocky Flats Waste
Diffusion coefficient values for use in simulating VOC release from Rocky Flats waste are recommended based on available experimental data and professional judgment.
5.4.1 Experimental Data
The majority of carbon tetrachloride and tetrachloroethylene disposed at the SDA was associated with Rocky Flats waste (Series 743 sludge). The liquid portion of the Series 743 sludge consisted of these compounds mixed with Texas Regal oil VOC. The waste was mixed with calcium silicate or Portland cement forming a solid-like paste that was placed in 55-gallon drums lined with high-density polyethylene (Lowe et al. 2003). The waste form is assumed of sufficient permeability to allow diffusion of water and/or vapor, thus, diffusion was considered the mechanism of choice for release of these compounds from the solidified waste form. For test case structure development, the diffusion model for release of COPC from a cement waste form was adopted.
Vapor phase diffusivities of chlorinated hydrocarbon compounds for selected cement waste forms of interest to INEEL have been calculated from experimental data in Loomis et al. 2003 (Appendix A, Table A.2). Data on the vapor diffusive release of chlorinated hydrocarbon compounds from Texas Regal oil VOC has been measured, two of which (i.e., carbon tetrachloride and tetrachloroethylene) are COPC (Lowe et al. 2003) (Appendix A, Table A.3).
5.4.2 Assessment of Data
Release of VOC occurs from a complex oily waste (i.e., waste containing Texas Regal oil) that was fixed in calcium silicate or Portland cement prior to disposal in the SDA. The mechanism of VOC release from the waste is complex because of contaminant volatility, the fixative nature of the waste and the fact that some containment was compromised early on in the disposal allowing contact of the waste with the surrounding soil.
Table 5.5 summarizes the base case data for VOC release from Rocky Flats waste. The best estimate base case adopts the recommended value for VOC in the ABRA (Holdren et al. 2002; Kudera and Brown 1996) based on the following reasoning. The ABRA base case diffusion coefficient value for saltstone (Holdren et al. 2002; Kudera and Brown 1996) takes into account waste form effects under saturated conditions). The recommended diffusion coefficient value, relative to saltstone, would take into account the less than stable Rocky Flats waste matrix (i.e., calcium silicate or Portland cement-based pastes). Further conservativeness can be justified for that portion of the waste that has been exposed to the
5.5
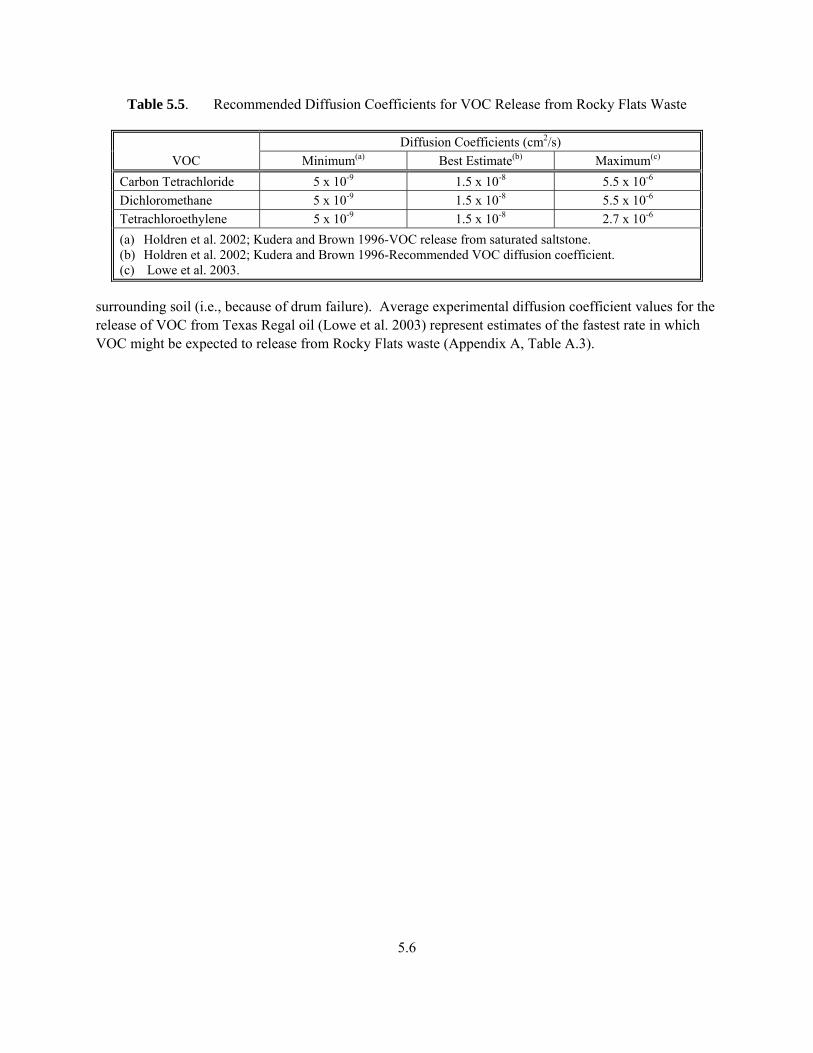
5.6
Table 5.5. Recommended Diffusion Coefficients for VOC Release from Rocky Flats Waste
VOC Diffusion Coefficients (cm2/s)
Minimum(a) Best Estimate(b) Maximum(c)
Carbon Tetrachloride 5 x 10⁻⁹ 1.5 x 10⁻⁸ 5.5 x 10⁻⁶ Dichloromethane 5 x 10⁻⁹ 1.5 x 10⁻⁸ 5.5 x 10⁻⁶ Tetrachloroethylene 5 x 10⁻⁹ 1.5 x 10⁻⁸ 2.7 x 10⁻⁶ (a) Holdren et al. 2002; Kudera and Brown 1996-VOC release from saturated saltstone. (b) Holdren et al. 2002; Kudera and Brown 1996-Recommended VOC diffusion coefficient. (c) Lowe et al. 2003.
surrounding soil (i.e., because of drum failure). Average experimental diffusion coefficient values for the release of VOC from Texas Regal oil (Lowe et al. 2003) represent estimates of the fastest rate in which VOC might be expected to release from Rocky Flats waste (Appendix A, Table A.3).
6.0 Sensitivity Case Structures
The effect of key model parameters values on the simulated release of individual COPC from SDA waste sites as well as their release to groundwater over time is not a simple matter to discern. Sensitivity case structures have been developed to simplify the process of identification of sensitivity cases for analysis. These structures are defined below in the context of treated and untreated SDA waste sources, numerical models that simulate COPC release from these sources, key model parameters and COPC release/VZ transport groupings. The groups help define sensitivity case structures.
6.1 In Situ Grouted Waste
A sensitivity case structure is developed for identifying sensitivity test cases for COPC release from ISG SDA waste. Structure development is aided by a COPC release-transport grouping based on diffusion coefficient and transport Kd parameters and area-to-volume (A/V) ratios for the various waste sources of interest (i.e., pits, trenches, and soil vault rows).
6.1.1 Numerical Model
Key parameters in the numerical model of COPC release from grouted SDA waste are effective diffusivity (Deff), waste source dimension in the form of a source external surface A/V ratio and the inventory of COPC associated with each waste source. Each of these parameters has an effect on the rate at which an individual COPC is released from the grouted waste source. The higher the value of diffusivity, A/V ratio, and COPC inventory the higher the rate of COPC release from a waste source. The effect that waste dimensions has on COPC release rate can be assessed by making relative comparisons of A/V ratios among the various waste source types (i.e., pits versus trenches versus PAD A versus soil vault rows). Average A/V ratios were assigned to the different waste source types with the exception of two waste sources that deviated significantly from waste source averages. A/V ratios are held constant for all proposed test cases. The model assumes that the grouted waste source does not degrade over the course of release of COPC waste inventories (i.e., A/V ratio remains constant). The higher the inventory of a COPC, the higher the COPC release rate from the grouted waste source.
6.1.2 Parameter Value Analysis
Key parameters and parameter values associated with the numerical model are discussed.
6.1.2.1 COPC Diffusivities in Grouted Waste
Best estimate, minimum, and maximum diffusion coefficient values were identified for simulating release of 20 COPC (29 when considering isotopes) from grouted waste (Table 3.1). A majority of the recommended values were based on statistical analysis of a broad range of ANS/ANSI 16.1 experimental diffusion coefficient data, providing a baseline set of parameter data that is more technically defensible when used in release modeling. Experimentally based diffusivities were not available for some COPC.
6.1
In these cases, similarity to other COPC and/or professional judgment was used as the basis for assigning values. Table 3.1 data were applied in the development of the in situ grout sensitivity case structure (Section 6.1.3).
6.1.2.2 Waste Source Surface Area to Volume Ratios (A/V)
Waste source A/V ratios were calculated for the three waste source types (pits, trenches, and soil vault rows) in the SDA subject to potential in situ grouting. Waste stored on PAD A was also considered assuming that the waste was retrieved and disposed in a pit and subjected to grouting (Appendix D, Tables D.1 and D.2). Dimensional data was obtained from available INEEL site documents. Area to volume ratios for pits, trenches and soil vault rows averaged 1.01 x 10⁻² cm-1, 0.92 x 10⁻³ cm-1, and 3.08 x 10⁻² cm-1, respectively. The area to volume ratio for PAD A is 2.62 x 10⁻² cm-1. Pit 11, Trench 9, and soil vault row 21 were outside the average A/V ratios for their waste group types and were not included in these averages. These data suggest that, for the most part, application of waste source specific A/V will have minimal affect on the magnitude and uncertainty of release model outputs within waste source types. The average A/V ratios for pits, soil vault rows, and PAD A waste sources will contribute faster releases of COPC relative to trenches by a factor of ten or more. Of the three waste sources that were excluded from the averaging process, Soil Vault Row (SVR) 21 was greatest in its deviation from the average by a factor of 74.
6.1.2.3 COPC Inventories
COPC inventories are identified by and allocated among the various source terms by Idaho Completion project personnel.
6.1.3 COPC Release/Transport Groupings for In Situ Grout Sensitivity Case Structure
The rate of release of COPC from SDA grouted waste and to groundwater involves the coupling of COPC release outputs from each waste source type with the mobility behavior of each COPC in the vadose zone. To simplify the process of selection of a subset of test cases to be performed, COPC were classified into four release-mobility groupings (fast release-fast VZ transport; fast release-slow VZ transport; slow release-fast/VZ transport; slow release-slow VZ transport) based on the magnitude of COPC diffusivities in grout and the magnitude of COPC partitioning between VZ sediments and sediment pore water (Kd). Within each grouping, COPC can be selected for test case analysis based on their transport behavior and the magnitude of their inventory in the grouted waste.
Contaminants of potential concern best estimate sediment partition coefficients (Table 5.2, column 4) were plotted against their associated best estimate diffusion coefficients (Table 3.1) and assigned into the previously described four groupings. These groupings and associated parameter ranges for those groupings are summarized in Table 6.1. Based on the inherent value of Kd on COPC sorption behavior, COPC with partition coefficients below 100 mL/g were assigned to the fast VZ transport grouping whereas COPC with partition coefficients above 100 mL/g were assigned to the slow VZ transport grouping (Dicke 1997). This criteria was applied to other COPC release/transport groupings where Kd was a relevant parameter.
6.2
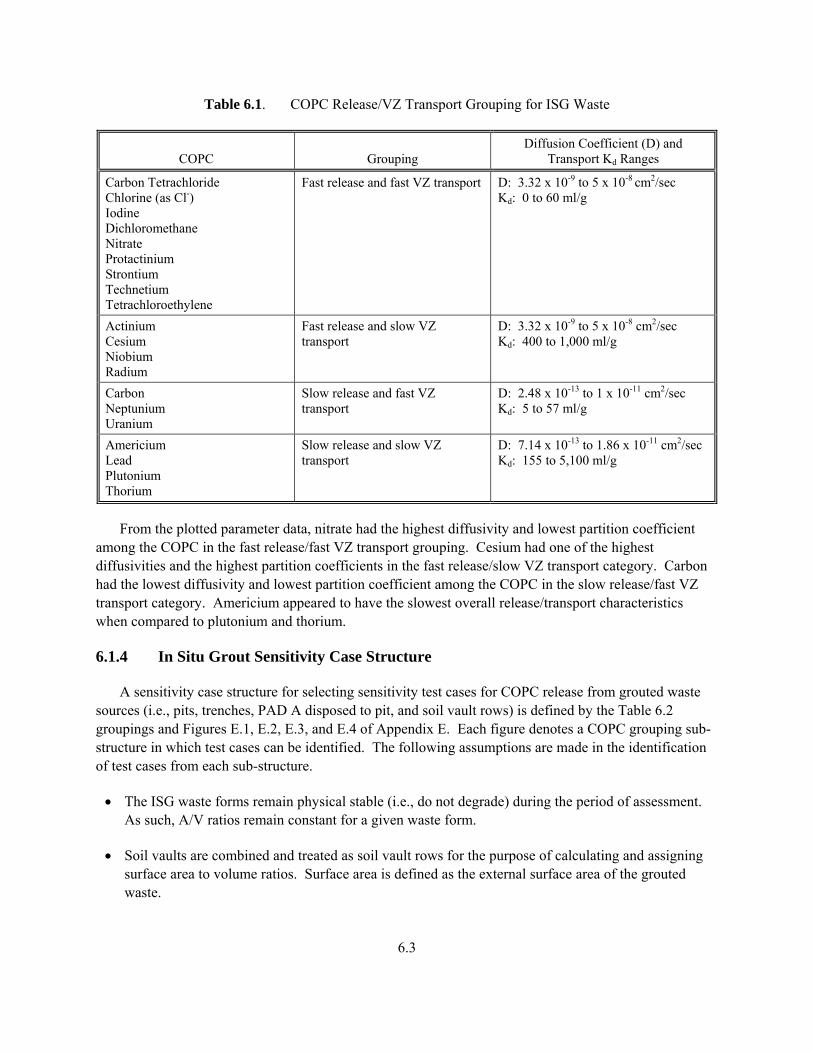
Table 6.1. COPC Release/VZ Transport Grouping for ISG Waste
COPC Grouping Diffusion Coefficient (D) and
Transport Kd Ranges
Carbon Tetrachloride Chlorine (as Cl-) Iodine Dichloromethane Nitrate Protactinium Strontium Technetium Tetrachloroethylene
Fast release and fast VZ transport D: 3.32 x 10⁻⁹ to 5 x 10⁻⁸ cm2/sec Kd: 0 to 60 ml/g
Actinium Cesium Niobium Radium
Fast release and slow VZ transport
D: 3.32 x 10⁻⁹ to 5 x 10⁻⁸ cm2/sec Kd: 400 to 1,000 ml/g
Carbon Neptunium Uranium
Slow release and fast VZ transport
D: 2.48 x 10⁻¹³ to 1 x 10-11 cm2/sec Kd: 5 to 57 ml/g
Americium Lead Plutonium Thorium
Slow release and slow VZ transport
D: 7.14 x 10⁻¹³ to 1.86 x 10⁻¹¹ cm2/sec Kd: 155 to 5,100 ml/g
From the plotted parameter data, nitrate had the highest diffusivity and lowest partition coefficient among the COPC in the fast release/fast VZ transport grouping. Cesium had one of the highest diffusivities and the highest partition coefficients in the fast release/slow VZ transport category. Carbon had the lowest diffusivity and lowest partition coefficient among the COPC in the slow release/fast VZ transport category. Americium appeared to have the slowest overall release/transport characteristics when compared to plutonium and thorium.
6.1.4 In Situ Grout Sensitivity Case Structure
A sensitivity case structure for selecting sensitivity test cases for COPC release from grouted waste sources (i.e., pits, trenches, PAD A disposed to pit, and soil vault rows) is defined by the Table 6.2 groupings and Figures E.1, E.2, E.3, and E.4 of Appendix E. Each figure denotes a COPC grouping sub-structure in which test cases can be identified. The following assumptions are made in the identification of test cases from each sub-structure.
• The ISG waste forms remain physical stable (i.e., do not degrade) during the period of assessment. As such, A/V ratios remain constant for a given waste form.
• Soil vaults are combined and treated as soil vault rows for the purpose of calculating and assigning surface area to volume ratios. Surface area is defined as the external surface area of the grouted waste.
6.3
• The surface area to volume ratio (A/V) for all pits (except pit 9) and soil vault rows (except SVR 21) are assigned average constant values of 1.01 x 10⁻² cm-1 and 3.08 x 10⁻² cm-1, respectively.
• The surface area to volume ratio (A/V) for all trench waste sources (except trench 9) is assigned an average constant value of 0.92 x 10⁻³ cm-1. PAD A, Pit 11 and Trench 9 are assigned individual A/V ratios of 2.62 x 10⁻² cm-1, 1.50 x 10⁻² cm-1, and 2.29 x 10 cm-1, respectively. 0
For substructure 1 (Appendix E, Figure E.1), waste source release outputs and VZ release outputs to groundwater for the fast release-fast VZ transport grouping are defined. The parameter that is varied is diffusion coefficient while other parameters are fixed (i.e., A/V ratios and COPC inventories). Test cases can be identified that compare outputs (i.e., COPC release from SDA or release to groundwater) using any combinations of COPC baseline diffusion coefficient data (Table 3.1), ABRA base case data and data from INEEL grouts of interest (Appendix D, Table D.3). Substructures 2, 3, and 4 are defined in a similar fashion to substructure 1.
6.2 In Situ Vitrified Waste
A sensitivity case structure is developed for identifying sensitivity test cases for COPC release from ISV SDA waste. The COPC release-transport grouping for ISV waste is simple and depicts slow COPC release with either slow or fast VZ transport.
6.2.1 Numerical Model
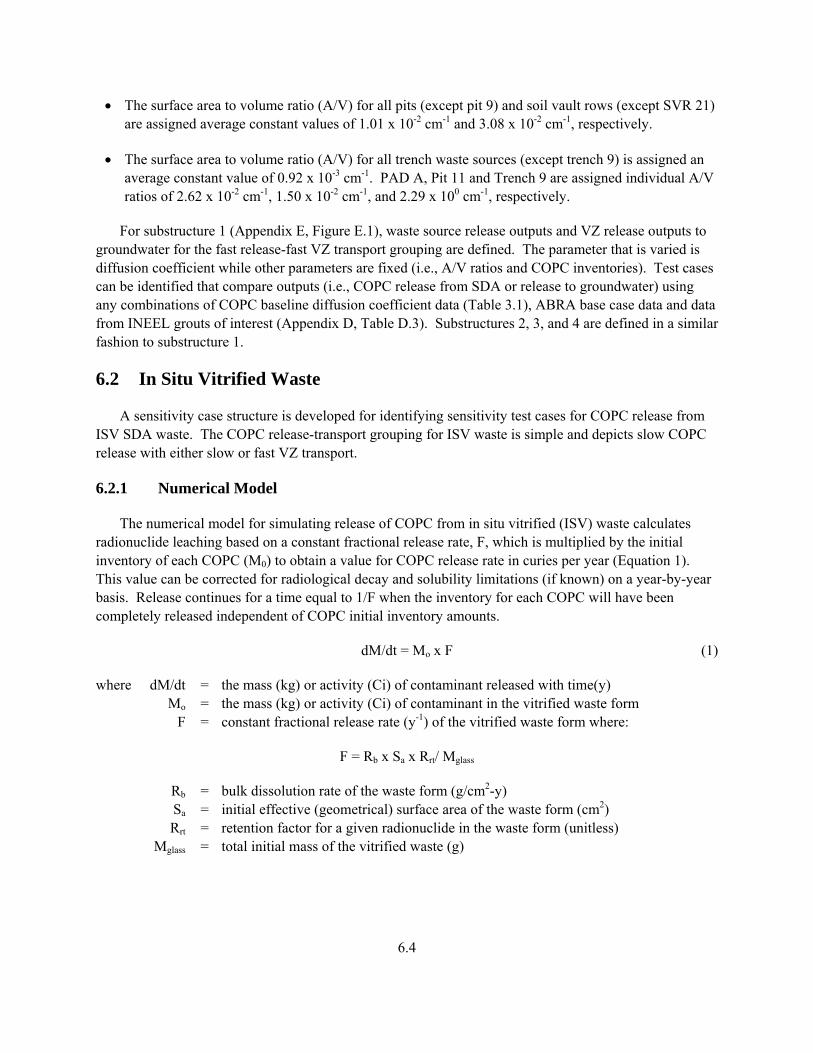
The numerical model for simulating release of COPC from in situ vitrified (ISV) waste calculates radionuclide leaching based on a constant fractional release rate, F, which is multiplied by the initial inventory of each COPC (M0) to obtain a value for COPC release rate in curies per year (Equation 1). This value can be corrected for radiological decay and solubility limitations (if known) on a year-by-year basis. Release continues for a time equal to 1/F when the inventory for each COPC will have been completely released independent of COPC initial inventory amounts.
dM/dt = Mo x F (1)
where dM/dt = the mass (kg) or activity (Ci) of contaminant released with time(y) Mo = the mass (kg) or activity (Ci) of contaminant in the vitrified waste form F = constant fractional release rate (y-1) of the vitrified waste form where:
F = Rb x Sa x Rrt/ Mglass
Rb = bulk dissolution rate of the waste form (g/cm2-y) Sa = initial effective (geometrical) surface area of the waste form (cm2) Rrt = retention factor for a given radionuclide in the waste form (unitless) Mglass = total initial mass of the vitrified waste (g)
6.4
6.2.2 Parameter Value Analysis
Key parameters and parameter values associated with the numerical model are discussed.
6.2.2.1 Source of Inventory Values
COPC inventories are identified by and allocated among the various source terms by Idaho completion project personnel.
6.2.2.2 ISV Waste Dissolution Rate (Rb)
The bulk dissolution rate of the vitrified waste is based on glass constituents that mimic the dissolution behavior of the bulk glass. For example, dissolution rates for borosilicate glasses are based on the release of boron which is among the most soluble glass components. Boron does not tend to saturate in solution or form precipitated phases. Other glass constituent used to quantify bulk dissolution rates has included sodium, potassium and silicon.
Statistical analysis of experimental bulk dissolution rate data (lab and field tests at different DOE sites) for ISV waste (this study) resulted in a calculated mean (best estimate) dissolution rate of 6.4 x 10⁻⁶ g/cm2-y. Upper (max) and lower (min) bound dissolution rates were calculated to be 2.9 x 10⁻⁵ g/cm2-y and 1.6 x 10⁻⁷ g/cm2-y, respectively. The dispersion between upper and lower bound values is approximately a factor of 200 (Table 4.1).
Past risk modeling involving the release of contaminants from INEEL ISV waste (Zitnik et al. 2002) assumed a dissolution rate of 1 x 10⁻⁵ g/cm2-d (3.65 x 10⁻³ g/cm2-y) based on the results of an ISV demonstration conducted at INEEL in 1990 (Callow et al. 1991). This rate was considered conservative (i.e., the true rate was expected to be lower than indicated by the demonstration). No upper or lower bound values on the dissolution rate were reported. The dissolution rate value from past risk modeling is a factor of 570 times faster than the mean dissolution rate calculated by this study and outside the upper bound of uncertainty of the results of this study by a factor of 125.
6.2.2.3 Estimates of ISV Waste Mass (Mglass) and Surface Area (Sa) of SDA Transuranic Pits and Trenches
The ISV alternative is focused on the SDA transuranic pits and trenches (Zitnik et al. 2002, p. 3-8). Volumes associated with transuranic waste and transuranic contaminated soils for ISV relevant SDA sites are summarized in column 2 of Table F.1 of Appendix F. Uncertainty associated with these waste volumes is not reported. Waste volumes in column 2 are used to calculate ISV waste surface areas and masses for application in test cases. Waste volume reductions of 30% to 70% have been observed following the formation of ISV waste. An average 50% reduction in volume was selected for calculation of ISV waste volume (column 3) from column 2 data. Depth and width of ISV waste is assumed fixed to the average depths and widths of the pits and trenches (see Table F.1, footnote 3). The depth and width data for each pit or trench along with its estimated waste volume (Table 4.1, column 3) is used to calculate waste lengths (column 4). The length, width, and depth dimensions are then used to calculate waste surface areas for each transuranic waste source (column 5). The surface area is assumed to be the
6.5
geometric dimensions of the vitrified waste form and assumes no contribution from internal ISV waste surface area. The frequency of cracks in ISV glass has been indicated to be small as a result of the low thermal stresses induced by the very low rate of cooling that occurs underground (Thomas and Treat 2002). Mathematical modeling has indicated that the overall effect of fracturing on ISV waste surface area and, thus, the potential increase in fractional contaminant release would be insignificant (Spalding et al. 1997). The estimated waste volume after ISV (column 3) is used to calculate a waste mass for each transuranic pit and trench based on an experimentally determined ISV glass density. Use of this value assumes that vitrification into glass is less than complete within the melt.
With the exception of lead (Pb-210), it has been stated that other COPC in ISV waste and identified with the ISV scenario (i.e., Ac-227, Am-241, Am-243, Np-237, Pa-231, Pu-238, Pu-239, Pu-240, Ra-226, Th-229, Th-230, Th-232, U-233, U-234, U-235, U-236, U-238) remain with the melt/glass (Farnsworth et al. 1999, Table 4). This would be consistent with the findings of Buelt et al. 1987 that contaminants uniformly distribute in the melt by convective mixing. Contaminant concentrations at the edges of the vitrification zone fell off to natural soil concentration levels indicating no migration of contaminants outside of the ISV waste had occurred.
6.2.2.4 Retention Factor (Rrt)
Some radionuclides (e.g., uranium) have low solubility in solution and are often released at rates far less than indicated by bulk glass dissolution. This phenomenon is quantified by a retention factor (Rrt) for a given element. Values of Rrt for different elements are not known. Therefore, we recommend setting Rrt to a value of 1 for all radionuclides (i.e., no reaction of the radionuclides with the glass matrix giving stoichiometric release of each radionuclide with the glass matrix).
6.2.3 COPC Release/Transport Groupings for ISV Sensitivity Case Structure
The value of the key parameter (i.e., bulk dissolution rate) is the same for release of all COPC from ISV waste. COPC fractional release rates from ISV SDA based on this value ranges from 2.34 x 10⁻⁸ y-1 to 25.4 x 10⁻⁸ y-1 (Appendix F, Table F.2). An ISV SDA waste source containing 100 Ci of a radionuclide encapsulated in the glass would release radionuclide at an annual rate in the range of 2.34 to 25.4 µCi/y. Based on these data, release rates of COPC based on ISV treatment and the dissolution mechanism is assumed to lead to slow release. This leads to a simple release/transport grouping that is slow release with either slow or fast VZ transport.
6.2.4 ISV Sensitivity Case Structure
A sensitivity case structure for selecting sensitivity test cases for COPC release from ISV waste sources is defined by Figure F.1 of Appendix F. Waste source release outputs and VZ release outputs to groundwater are depicted for slow release-slow VZ transport and slow release-fast VZ transport pathways. ABRA base case and ISV baseline dissolution rates are compared for their impact on COPC release from SDA waste sources and COPC release to groundwater.
6.6
6.3 Untreated Waste
Sensitivity case structures are developed for identifying sensitivity test cases for COPC release from activated metal waste, unconsolidated waste, and Rocky Flats waste.
6.3.1 Activated Metal Waste
The release-transport grouping for COPC release from activated metal waste indicates a relatively simple sensitivity case structure where COPC are released at slow, moderately fast, and fast rates depending on the activated metal considered. Transport rates are either fast or slow.
6.3.1.1 Numerical Model
The analytical solution for simulating COPC release from activated metal wastes is depicted in Equation (2).
ΔM = F x M (2)
where ΔM = change in COPC mass released over time (g/y) M = initial COPC mass in waste source (g) F = fraction of COPC mass released with time (y-1)
6.3.1.2 Parameter Value Analysis
COPC inventories are identified by and allocated among the various source terms by Idaho Completion project personnel. Best estimate, minimum and maximum value fractional release rates were calculated from corrosion rates for activated metal wastes known to be disposed in SDA waste sources (i.e., stainless steels, alloys, aluminum, and beryllium). These data are summarized in Table 5.1.
6.3.1.3 Release/Transport Grouping for Activated Metal Sensitivity Case Structure
Contaminants of concern best estimate sediment partition coefficient values (Table 5.2, column 4) were evaluated against best estimate fractional release rate values for the different activated metal wastes (Table 5.1). COPC were assigned into six release/transport groupings (fast release-fast VZ transport; fast release-slow VZ transport, moderately fast release-fast VZ transport, moderately fast release-slow VZ transport, slow release-fast VZ transport, slow release-slow VZ transport). These groupings and associated parameter ranges for those groupings are summarized in Table 6.2. Beryllium has the fastest fractional release rate of the activated metals and would generate the fastest releases of inventory for COPC in activated metal. Relative to beryllium, aluminum had the next fastest fractional release rate. Stainless steel and the alloys had the lowest release rates and would release COPC inventory the slowest.
6.7
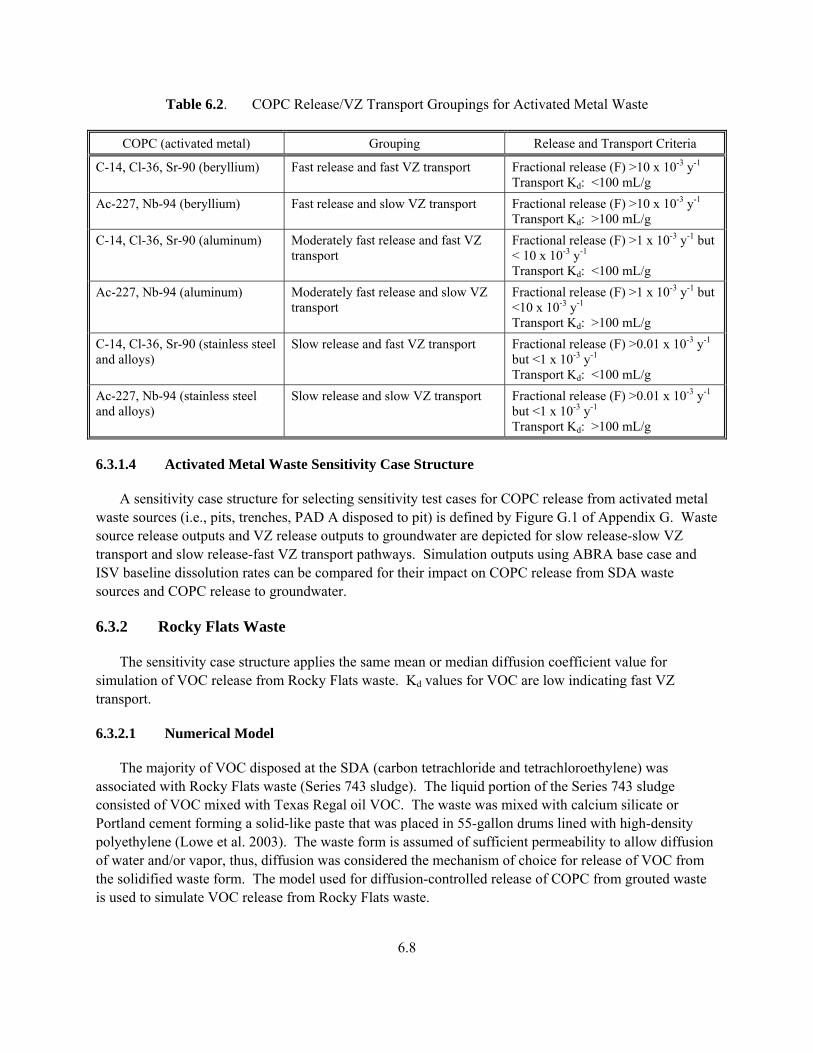
Table 6.2. COPC Release/VZ Transport Groupings for Activated Metal Waste
COPC (activated metal) Grouping Release and Transport Criteria
C-14, Cl-36, Sr-90 (beryllium) Fast release and fast VZ transport Fractional release (F) >10 x 10-3 y-1 Transport Kd: <100 mL/g
Ac-227, Nb-94 (beryllium) Fast release and slow VZ transport Fractional release (F) >10 x 10-3 y-1 Transport Kd: >100 mL/g
C-14, Cl-36, Sr-90 (aluminum) Moderately fast release and fast VZ transport
Fractional release (F) >1 x 10⁻³ y-1 but < 10 x 10-3 y-1
Transport Kd: <100 mL/g Ac-227, Nb-94 (aluminum) Moderately fast release and slow VZ
transport Fractional release (F) >1 x 10⁻³ y-1 but <10 x 10-3 y-1 Transport Kd: >100 mL/g
C-14, Cl-36, Sr-90 (stainless steel and alloys)
Slow release and fast VZ transport Fractional release (F) >0.01 x 10⁻³ y-1 but <1 x 10⁻³ y-1
Transport Kd: <100 mL/g Ac-227, Nb-94 (stainless steel and alloys)
Slow release and slow VZ transport Fractional release (F) >0.01 x 10⁻³ y-1 but <1 x 10⁻³ y-1 Transport Kd: >100 mL/g
6.3.1.4 Activated Metal Waste Sensitivity Case Structure
A sensitivity case structure for selecting sensitivity test cases for COPC release from activated metal waste sources (i.e., pits, trenches, PAD A disposed to pit) is defined by Figure G.1 of Appendix G. Waste source release outputs and VZ release outputs to groundwater are depicted for slow release-slow VZ transport and slow release-fast VZ transport pathways. Simulation outputs using ABRA base case and ISV baseline dissolution rates can be compared for their impact on COPC release from SDA waste sources and COPC release to groundwater.
6.3.2 Rocky Flats Waste
The sensitivity case structure applies the same mean or median diffusion coefficient value for simulation of VOC release from Rocky Flats waste. Kd values for VOC are low indicating fast VZ transport.
6.3.2.1 Numerical Model
The majority of VOC disposed at the SDA (carbon tetrachloride and tetrachloroethylene) was associated with Rocky Flats waste (Series 743 sludge). The liquid portion of the Series 743 sludge consisted of VOC mixed with Texas Regal oil VOC. The waste was mixed with calcium silicate or Portland cement forming a solid-like paste that was placed in 55-gallon drums lined with high-density polyethylene (Lowe et al. 2003). The waste form is assumed of sufficient permeability to allow diffusion of water and/or vapor, thus, diffusion was considered the mechanism of choice for release of VOC from the solidified waste form. The model used for diffusion-controlled release of COPC from grouted waste is used to simulate VOC release from Rocky Flats waste.
6.8
6.3.2.2 Parameter Value Analysis
Best estimate, minimum, and maximum diffusion coefficient values for release of carbon tetrachloride, tetrachloroethylene and dichloromethane from Rocky flats waste are summarized in Table 5.5. These data are a compilation of data from several sources that attempts to provide a best estimate and associated uncertainty for VOC release from a complex waste source.
6.3.2.3 Release/Transport Grouping
Best estimate, minimum, and maximum values of the key parameter (i.e., diffusion coefficient) are virtually the same for VOC release from Rocky Flats waste. This leads to a simple release/transport grouping that assigns the same release rate and fast VZ transport rate for VOC.
6.3.2.4 Rocky Flats Waste Sensitivity Case Structure
A sensitivity case structure for selecting sensitivity test cases for VOC release from Rocky Flats waste sources is defined by Figure H.1 of Appendix H. Waste source release outputs and VZ release outputs to groundwater are depicted for release and fast VZ transport pathway. Simulation outputs based on ABRA base case and Interim Risk Assessment (IRA) generic diffusion coefficients can be compared to values of base case diffusion coefficients for their impact on VOC release from Rocky Flats waste sources and VOC release to groundwater.
6.3.3 Unconsolidated Waste
A sensitivity case structure is developed for identifying sensitivity test cases for COPC release from unconsolidated SDA waste. Structure development is aided by a COPC release-transport grouping based on partition coefficient and solubility parameters. Solubility values are considered in the context of changing redox conditions within the SDA over the length of an assessment (i.e., 10,000 years). Infiltration rates influenced by variation in climatic conditions and covers are also examined for their influence on COPC release rates.
6.3.3.1 Numerical Model
Release of non-volatile COPC from unconsolidated waste in pits, trenches and soil vault rows is dependent on a number of factors including water infiltration, the physical properties of the waste and waste source and the physicochemical properties of the COPC. Release of COPC sorbed to unconsolidated waste is modeled using the surface wash-off model. The analytical solution to the surface wash-off model contains COPC mass and partition coefficient (Kd) parameters but no terms for infiltration rate, COPC solubility and waste source dimensionality (i.e., waste source thickness). However, the missing parameters are recognized within the DUST-MS code and are assumed linked to the surface wash-off analytical solution. The justification for this assumption is that a first order leach formulation (Equation 3) has been used to validate the surface wash-off model (Becker 1997). The first order leach model contains those key parameters contained within the surface wash-off model as well as the missing parameters. The first order leach model has been adopted for development of the test case
6.9
structure involving the surface wash-off model. It is assumed that the test case structure can be used to populate parameters in DUST-MS necessary for exercising the surface wash-off model.
ΔM = λL x M (3)
where ΔM = change in COPC mass released over time (g/y) M = initial COPC mass in waste source λL = leach rate constant (y-1) = Qw ÷[θ R T) Qw = infiltration rate (cm/y) θ = soil moisture content R = retardation coefficient = 1 + [ρ Kd] ÷ θ T = source thickness (cm) ρ = soil bulk density (g/cm3) Kd = soil/water partition coefficient (cm3/g)
For those radionuclides with potential mobility limitations due to solubility, the release mechanism (i.e., Kd versus solubility) will be dependent on whether COPC inventory results in a COPC concentration that is less than or exceeds the solubility limit based on COPC Kd. The maximum COPC mass allowed in a waste source while not exceeding a COPC aqueous solubility limit can be calculated using the following equation:
Mmax = θ x R x Csol x A x T (4)
where Csol = the COPC solubility limit in the infiltrating water A = cross sectional area of the waste source
Each COPC was assigned best estimate, minimum and maximum sediment partition coefficient and solubility values based on data from the literature, with an emphasis on those values that are relevant to the subsurface disposal site. Waste source dimension data (length, width, and thickness for pits, trenches, and soil vault rows) was obtained from available site data.
6.3.3.2 Parameter Value Analysis
Parameter and parameter values (partition coefficient, solubility, and infiltration rate) key to the surface wash off model and DUST-MS code are discussed.
6.3.3.2.1 Partition Coefficient
Best estimate, minimum, and maximum partition coefficient values (Table 5.2) were identified for simulating release of 17 COPC from unconsolidated waste and application in test cases. A majority of the recommended values were based on the work of Dicke (1997) with refinements made where more recent experimental data was available (Fjeld 2000; Grossman et al. 2001).
6.10
6.3.3.2.2 Solubility
The solubility of COPC will depend on the SDA conditions conceptual model assumed as the basis for simulation. We propose three possible conceptual models for consideration in a 10,000-year assessment:
• Assume reduced conditions for the entire 10,000-year period of assessment
• Assume oxidized conditions for the entire 10,000-year period of assessment
• Assume reduced conditions for the first 1,000 years and oxidized conditions for the remainder of the assessment
Site data as well as experimental data on COPC solubility under conditions that simulate subsurface conditions at the SDA serve as a basis for assessing the legitimacy of each conceptual model.
Reduced conditions currently exist at the SDA but are likely to become more oxidizing over time. Chemical analysis of porewater in soils of the radioactive waste management complex showed a mean pH of 7.68 with minimum and maximum values of 7.09 and 8.36, respectively (Dicke 1997). Median bicarbonate concentration was reported as 0.00832 M with minimum and maximum values of 0.0017M and 0.0292M, respectively. Hull and Pace (2000) reported a median bicarbonate value of 0.0077M (647 mg/L). These data suggest buffering of pH by CO2 in the range of 7 to 8. Additional gas measurements in the SDA have revealed the presence of methane and hydrogen and chemical analysis has shown the presence of chloroform. Chloroform is not an original SDA waste contaminant but is formed from reductive dechlorination of carbon tetrachloride (Vogel et al. 1987). The presence of these constituents is further evidence of reduced conditions in the buried waste of the SDA.
Degradation of drums holding SDA waste has been observed (Martian and Sondrup 1995). In addition, very high levels of CO2 have been reported in the SDA consistent with ongoing microbial degradation in the waste (Hull and Bishop 2003). As corrosion of metal drums and degradation of organic wastes draws to completion, redox potentials will rise and the SDA subsurface will become aerobic. The period of time required for aerobic conditions to occur is not known. However, a number of the COPC with long half lives (i.e., actinides) will be present when aerobic conditions occur.
Solubility values for COPC in SDA infiltrating water (best estimates, minimums, and maximums) in a pH range of 7 to 8 under both reduced and oxidized conditions are provided (Tables 5.3 and 5.4) to support the above conceptual model concepts and SDA redox condition rationales.
6.3.3.2.3 Infiltration Rate
The rate of release of COPC from waste sources is directly affected by the rate of infiltrating water when using the surface wash-off model (Section 4.5.1). Thus, changes in climatic conditions (i.e., precipitation) over the time of an assessment (e.g., 1,000 to 10,000 years) is needed in order to account for differences in infiltration rate that will influence COPC release rate during the period of assessment. In a previous assessment of Hanford impact performed with the system assessment capability (initial
6.11
assessment), the recorded climate since startup of Hanford site operations was used to simulate the period from 1944 to present. The climate record from 1961 to 1990 was used to represent the future climate (Bryce et al. 2002). Net infiltration rates at the SDA based on six years of climactic data ranged from 0.3 cm/y to 49.4 cm/y. These data were used to assign infiltration rates to 13 source areas in the SDA for conduct of the ABRA (Holdren et al. 2002). Average infiltration rates ranged from 0.6 cm/y to 11.7 cm/y.
The application of surface barriers significantly reduces infiltration rates. As a result, COPC release rates based on application of the surface wash-off model will be reduced proportionately. The predominant barrier selected for application at Hanford is the Modified Subtitle C Barrier with an anticipated design life of 500 years. An infiltration rate of 0.1 mm/y (0.01 cm/y) was applied for the first 500 years of the initial assessment. After 500 years, the cover performance was assumed to degrade to natural conditions. Natural conditions were understood to vary between 0.09 cm/y and 0.4 cm/y depending on Hanford site location (Bryce et al. 2002).
An INEEL-specific surface barrier design (INEEL Comprehensive Environmental Response, Compensation, and Liability Act [CERCLA] Disposal Facility Cover) has been developed and is a remediation strategy under consideration in the waste area group 7 operable unit 13/14 comprehensive remedial investigation/feasibility study process (Zitnik et al. 2002). The barrier has an anticipated 1,000-year design life (Crouse 2002) comparable to the Hanford site’s long-term composite cover design. Model simulations showed a maximum infiltration rate of 0.49 mm/y (0.049 cm/y). The barrier is con-sidered as an option for untreated waste sources or for SDA full containment. Application of Modified RCRA Subtitle C caps are proposed as covers for sites that undergo in situ grout or vitrification treatment (Zitnik et al. 2002). Past risk modeling of the surface barrier and Modified Resource Conservation and Recovery Act (RCRA) Subtitle C caps assumed water to infiltrate the systems at a rate of 0.114 cm/y (Zitnik et al. 2002).
6.3.3.3 Release/Transport Grouping
Contaminants of potential concern best estimate sediment partition coefficient values (Appendix A, Table A.1) were evaluated against their associated best estimate solubility values (Appendix A, Table A.2) and assigned into three release/transport groupings (fast release-fast VZ transport; slow release-fast VZ transport; slow release-slow VZ transport). These groupings and associated parameter ranges for those groupings are summarized in Table 6.3.
For COPC that were not solubility limited (i.e., cesium, iodine, and nitrate), release and transport was assigned based on the 100 mL/g Kd value as the criteria. Based on this, iodine and nitrate fell in the fast release-fast VZ transport grouping and cesium fell in the slow release-slow VZ transport category.
For those radionuclides with potential mobility limitations due to solubility, the release mechanism (i.e., Kd versus solubility) will be dependent on whether COPC inventory results in a COPC concentration that is less than or exceeds the solubility limit based on COPC Kd. For the former situation, the COPC is
6.12
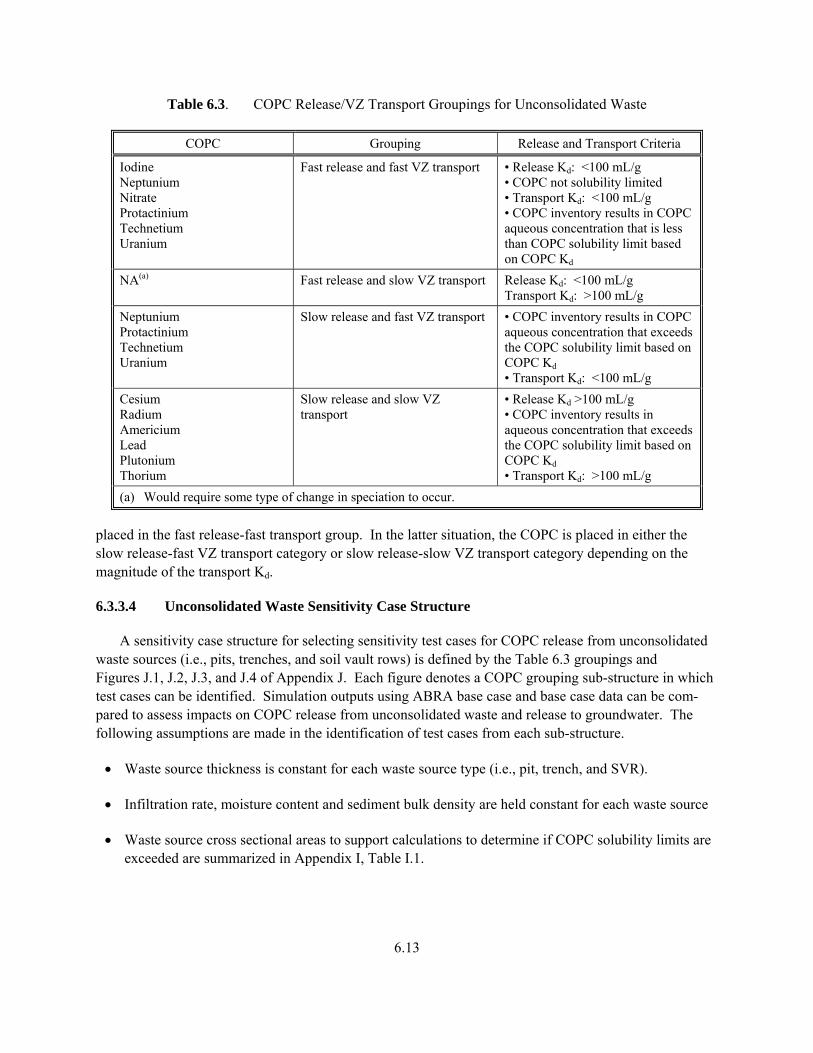
6.13
Table 6.3. COPC Release/VZ Transport Groupings for Unconsolidated Waste
COPC Grouping Release and Transport Criteria
Iodine Neptunium Nitrate Protactinium Technetium Uranium
Fast release and fast VZ transport • Release Kd: <100 mL/g • COPC not solubility limited • Transport Kd: <100 mL/g • COPC inventory results in COPC aqueous concentration that is less than COPC solubility limit based on COPC Kd
NA(a) Fast release and slow VZ transport Release Kd: <100 mL/g Transport Kd: >100 mL/g
Neptunium Protactinium Technetium Uranium
Slow release and fast VZ transport • COPC inventory results in COPC aqueous concentration that exceeds the COPC solubility limit based on COPC Kd • Transport Kd: <100 mL/g
Cesium Radium Americium Lead Plutonium Thorium
Slow release and slow VZ transport
• Release Kd >100 mL/g • COPC inventory results in aqueous concentration that exceeds the COPC solubility limit based on COPC Kd • Transport Kd: >100 mL/g
(a) Would require some type of change in speciation to occur.
placed in the fast release-fast transport group. In the latter situation, the COPC is placed in either the slow release-fast VZ transport category or slow release-slow VZ transport category depending on the magnitude of the transport Kd.
6.3.3.4 Unconsolidated Waste Sensitivity Case Structure
A sensitivity case structure for selecting sensitivity test cases for COPC release from unconsolidated waste sources (i.e., pits, trenches, and soil vault rows) is defined by the Table 6.3 groupings and Figures J.1, J.2, J.3, and J.4 of Appendix J. Each figure denotes a COPC grouping sub-structure in which test cases can be identified. Simulation outputs using ABRA base case and base case data can be com-pared to assess impacts on COPC release from unconsolidated waste and release to groundwater. The following assumptions are made in the identification of test cases from each sub-structure.
• Waste source thickness is constant for each waste source type (i.e., pit, trench, and SVR).
• Infiltration rate, moisture content and sediment bulk density are held constant for each waste source
• Waste source cross sectional areas to support calculations to determine if COPC solubility limits are exceeded are summarized in Appendix I, Table I.1.
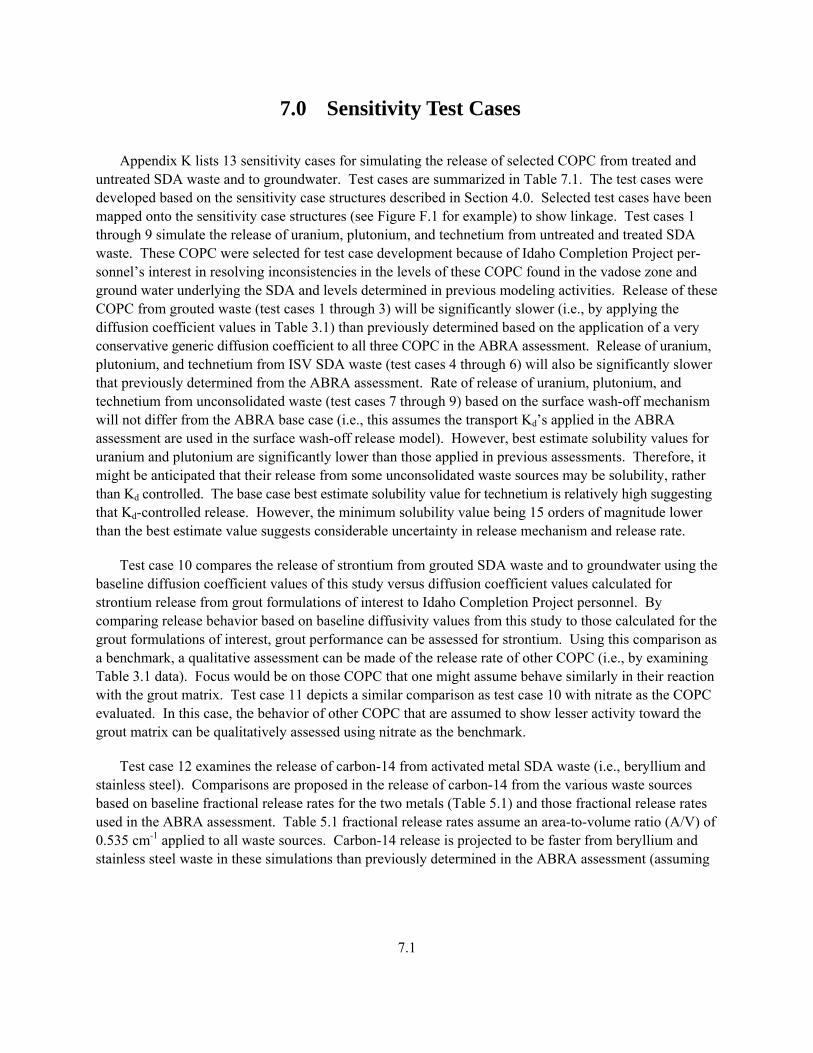
7.0 Sensitivity Test Cases
Appendix K lists 13 sensitivity cases for simulating the release of selected COPC from treated and untreated SDA waste and to groundwater. Test cases are summarized in Table 7.1. The test cases were developed based on the sensitivity case structures described in Section 4.0. Selected test cases have been mapped onto the sensitivity case structures (see Figure F.1 for example) to show linkage. Test cases 1 through 9 simulate the release of uranium, plutonium, and technetium from untreated and treated SDA waste. These COPC were selected for test case development because of Idaho Completion Project per-sonnel’s interest in resolving inconsistencies in the levels of these COPC found in the vadose zone and ground water underlying the SDA and levels determined in previous modeling activities. Release of these COPC from grouted waste (test cases 1 through 3) will be significantly slower (i.e., by applying the diffusion coefficient values in Table 3.1) than previously determined based on the application of a very conservative generic diffusion coefficient to all three COPC in the ABRA assessment. Release of uranium, plutonium, and technetium from ISV SDA waste (test cases 4 through 6) will also be significantly slower that previously determined from the ABRA assessment. Rate of release of uranium, plutonium, and technetium from unconsolidated waste (test cases 7 through 9) based on the surface wash-off mechanism will not differ from the ABRA base case (i.e., this assumes the transport Kd’s applied in the ABRA assessment are used in the surface wash-off release model). However, best estimate solubility values for uranium and plutonium are significantly lower than those applied in previous assessments. Therefore, it might be anticipated that their release from some unconsolidated waste sources may be solubility, rather than Kd controlled. The base case best estimate solubility value for technetium is relatively high suggesting that Kd-controlled release. However, the minimum solubility value being 15 orders of magnitude lower than the best estimate value suggests considerable uncertainty in release mechanism and release rate.
Test case 10 compares the release of strontium from grouted SDA waste and to groundwater using the baseline diffusion coefficient values of this study versus diffusion coefficient values calculated for strontium release from grout formulations of interest to Idaho Completion Project personnel. By comparing release behavior based on baseline diffusivity values from this study to those calculated for the grout formulations of interest, grout performance can be assessed for strontium. Using this comparison as a benchmark, a qualitative assessment can be made of the release rate of other COPC (i.e., by examining Table 3.1 data). Focus would be on those COPC that one might assume behave similarly in their reaction with the grout matrix. Test case 11 depicts a similar comparison as test case 10 with nitrate as the COPC evaluated. In this case, the behavior of other COPC that are assumed to show lesser activity toward the grout matrix can be qualitatively assessed using nitrate as the benchmark.
Test case 12 examines the release of carbon-14 from activated metal SDA waste (i.e., beryllium and stainless steel). Comparisons are proposed in the release of carbon-14 from the various waste sources based on baseline fractional release rates for the two metals (Table 5.1) and those fractional release rates used in the ABRA assessment. Table 5.1 fractional release rates assume an area-to-volume ratio (A/V) of 0.535 cm-1 applied to all waste sources. Carbon-14 release is projected to be faster from beryllium and stainless steel waste in these simulations than previously determined in the ABRA assessment (assuming
7.1
Table 7.1. Sensitivity Test Case Summary (see Appendix K for case details)
Test Case COPC Technology/Scenario Comments
1 Uranium COPC release from ISG waste (diffusion mechanism)
Compare uranium release based on Table 3.1 diffusion coefficient values vs. ABRA base case
2 Plutonium COPC release from ISG waste (diffusion mechanism)
Compare plutonium release based on Table 3.1 diffusion coefficient values vs. ABRA base case
3 Technetium COPC release from ISG waste (diffusion mechanism)
Compare technetium release based on Table 3.1 diffusion coefficient values vs. ABRA base case
4 Uranium COPC release from ISV waste (dissolution mechanism
Compare uranium release based on Table 4.1 dissolution rate values vs. ABRA base case
5 Plutonium COPC release from ISV waste (dissolution mechanism
Compare plutonium release based on Table 4.1 dissolution rate values vs. ABRA base case
6 Technetium COPC release from ISV waste (dissolution mechanism
Compare technetium release based on Table 4.1 dissolution rate values vs. ABRA base case
7 Uranium COPC release from unconsolidated waste (surface washoff mechanism)
Compare uranium release based on Table 5.2 (Kd values), and Tables 5.3 and 5.4 (solubility values) vs. ABRA base case.
8 Plutonium COPC release from unconsolidated waste (surface washoff mechanism)
Compare plutonium release based on Table 5.2 (Kd values), and Tables 5.3 and 5.4 (solubility values) vs. ABRA base case.
9 Technetium COPC release from unconsolidated waste (surface washoff mechanism)
Compare technetium release based on Table 5.2 (Kd values), and Tables 5.3 and 5.4 (solubility values) vs. ABRA base case.
10 Strontium COPC release from INEEL grouts of interest (diffusion mechanism)
Compare strontium release based on Table 3.1 diffusion coefficient values and diffusion coefficient values for INEEL grouts of interest (Appendix D, Table D.3)
11 Nitrate COPC release from INEEL grouts of interest (diffusion mechanism)
Compare nitrate release based on Table 3.1 diffusion coefficient values and diffusion coefficient values for INEEL grouts of interest (Appendix D, Table D.3)
12 Carbon-14 COPC release from metal waste (corrosion mechanism)
Compare carbon-14 release based on Table 5.1 data and ABRA base case.
13 Carbon tetrachloride
COPC release from Rocky Flats waste (diffusion mechanism)
Compare carbon tetrachloride release based on Table 5.5 data and ABRA base case.
A/V of 0.535 cm-1). Simulations based on an A/V ratio of 1.2 x 10⁻² cm-1 are also recommended. This ratio is more consistent with the dimensionality of SDA waste sources (Appendix D, Table D.1). Application of the smaller A/V ratio would result in slower release rates for carbon-14 from both metals.
7.2
7.3
Test case 13 addresses carbon tetrachloride release from Rocky Flats waste and release to groundwater with diffusion as the mechanism of release. Release behavior based on baseline diffusion coefficient values (Table 5.4) is compared to other diffusion coefficient values used in the ABRA and interim risk assessments.
8.0 Conclusions
Best estimate, minimum, and maximum diffusion coefficient values were identified for 20 COPC (29 when considering isotopes) for simulation of release of COPC from in situ grout treatment of SDA waste. Where possible, values were calculated from a broad range of experimental data based on the ANSI/ANS 16.1 (ANS 1986) standard test procedure. Limiting the source of experimental data to those produced by the standard procedure provided technical credibility to the data. We adopted the recommended value for VOC in the ABRA (Kudera and Brown 1996) as the upper bound diffusivity release rate for VOC. The ABRA base case diffusion coefficient value for saltstone (Kudera and Brown 1996) takes into account waste form effects under saturated conditions and is adopted as the base case minimum value for VOC. The average of these two values is adopted as a best estimate value. For COPC where experimental data was not available, data were assigned based on professional judgment (e.g., literature cited recommendations).
Best estimate values can be represented by either median or mean values. Recommended mean values ranged from 100 to 4.0 x 10⁶ times lower than the value used in modeling contaminant release from grouted waste in the interim risk assessment (Becker 1998). Median values of diffusion coefficients were generally lower for all COPC. These results suggest that contaminants are likely to be released from grouted waste more slowly than previously determined and at variable rates. Carbonation of concrete has been observed in the buried portions of building foundations in a climate similar to that of the SDA. Therefore, the rate of release of COPC from grouted waste may be further diminished by carbonation of the outer surfaces of grouted waste over time. Some COPC (e.g., nitrate) may be released more rapidly as a result of the presence of waste form carbonation. An assessment should be made of what is known about carbonation of cementitious materials in SDA soils before consideration of inclusion of its impacts in modeling COPC release from grouted SDA waste. Rate of release of COPC from grouted waste is not likely to be restricted by the level of soil moisture content in the SDA. No data was found on the leaching of thermoplastic grouts (e.g., WaxfixTM) or organic polymer-based grouts using the ANSI/ANS 16.1 test procedure. Based on data from other leaching procedures, these grouts, in general, appear to have lower diffusivities than cement-based grouts. Assuming all else equal, such grouts may be better for encapsulating buried waste at the SDA than traditional cement-based grouts.
With a couple of exceptions, it is concluded that COPC identified with the ISV scenario (i.e., Ac-227, Am-241, Am-243, Np-237, Pa-231, Pu-238, Pu-239, Pu-240, Ra-226, Th-229, Th-230, Th-232, U-233, U-234, U-235, U-236, U-238) will remain in the melt/glass phase with dissolution being the controlling release mechanism. The exceptions become an issue of inventory. It is postulated that during ISV some lead will be lost through volatilization while other amounts will be encapsulated within the glass or as a separate metal phase (Farnsworth et al. 1999). In the absence of data to close this technical gap, one option might be to apportion the non-volatile component of lead inventory between the melt/glass phase and a metal phase when simulating lead release in the ISV scenario. Inventory assigned to the melt glass phase would be released according to the bulk glass dissolution mechanism. Lead in the metal phase would release according to the surface wash-off mechanism with the likelihood of solubility control. If the waste source subject to ISV contains activated metal waste, that inventory would need to be assigned to a discrete metal phase where corrosion would be the governing mechanism of release.
8.1
Application of kinetic theory has been proposed to simulate long-term contaminant release from ISV waste to account for the fact that the glass matrix and other material phases are likely to have consid-erably different dissolution behaviors (McGrail and Olson 1992). However, application of a release model to ISV waste based on such theory is not practical at this time (McGrail et al. 2003). A simple analytical solution based on a bulk dissolution rate appears at this time to be the most reasonable approach where assessments are traditionally limited to timeframes of 10,000 years or less. Based on experimental bulk dissolution rate data from the literature, a best estimate (mean) bulk dissolution rate value of 6.4 x 10⁻⁶ g/cm2-y is recommended. Minimum and maximum values are estimated to be 1.6 x 10⁻⁷ g/cm2-y and 2.9 x 10⁻⁵ g/cm2-y, respectively.
Past modeling of the release of contaminants from SDA ISV waste assumed dissolution from the surface of the glass waste form (Zitnik et al. 2002). A rate of dissolution equivalent to one established for high-level waste (3.65 x 10⁻³ gm/cm2-y) was used based on the results of an ISV demonstration conducted at INEEL in 1990 (Callow 1991). The previous value used in modeling contaminant release from in situ vitrified glass is approximately 500 times greater than the recommended best estimate value calculated in this study. This suggests that contaminants are likely to be released more slowly from ISV SDA waste than previously determined.
Recommended release rates of radionuclides based on field corrosion data (Adler-Flitton et al. 2001) varied significantly among the different activated metal wastes. The pooled fractional release rate was lowest for stainless steels (0.388 x 10⁻⁶ y-1). Aluminum corroded at a rate approximately 10 times faster (mean of 2.92 x 10⁻⁶ y-1) than the stainless steels. Beryllium corroded the fastest with a rate approximately 100 to 1,000 times faster than the other metals (mean of 196.24 x 10⁻⁶ y-1). Previous source term modeling used fractional release rate values of 1.19 x 10⁻⁵ y-1 and 2.65 x 10⁻³ y-1 for corrosion of stainless steel and beryllium, respectively (Holdren et al. 2002). The recent field results on corrosion of these materials in SDA sediments suggest that release of radionuclides from activated stainless steel or beryllium SDA wastes may be an order of magnitude or more slower than previously determined. A previous assessment (Nagata and Banaee 1996) based on non-INEEL data recommended a corrosion rate of 1 mm of metal per 36,900 years (2.71 x 10⁻⁶ cm/y) for 304 stainless steel. Assuming an area to volume ratio for the waste of 0.535 cm-1 (Holdren et al. 2002), this rate corresponds to a fractional release rate of 1.45 x 10⁻⁶ y-1 or approximately 4 times faster than calculated for stainless steels (0.338 x 10⁻⁶ y-1) from INEEL experimental field corrosion rate data (Adler-Flitton et al. 2001).
Partition coefficients for the base case consisted of refinements and additions to Kd estimates proposed by Dicke 1997. Refinements and additions included:
• The Kd values for neptunium on SDA interbed sediments should be included; (Grossman et al. 2001) data in Dicke (1997) used non-INEEL data.
• The results of Grossman et al. 2001 were adopted over those previously reported. Their results suggest uranium to be slightly less mobile in SDA sediments than previously indicated.
Base case values of solubility for COPC were determined for both reduced and oxidized conditions based on the work of Hull and Pace (2000). These values replaced those that were previously reported in Dicke (1997) because they were calculated based on the SDA subsurface setting. Three conceptual model
8.2
options for assessment simulations that included solubility were considered: reduced conditions for 10,000 years, oxidized conditions for 10,000 years, and reduced conditions for 1,000 years followed by oxidized conditions for the remainder of the assessment (assumed to be 10,000 years). We recommend the third option recognizing that selection of 1,000 years as the point in time that SDA subsurface conditions become aerobic is arbitrary. In defense of this recommendation, assessment simulations assuming reduced conditions only are likely to underestimate release rates while assumption of oxidized conditions is likely to overestimate release rates for some radionuclides where solubility varies significantly between reduced and oxidized conditions (e.g., actinides).
Four of the COPC (chlorine-36, cesium-137, iodine-129, and nitrate) are not solubility limited under oxidized or reduced conditions. Release of these COPC in the base case will be governed by contaminant partitioning. Solubility values under reduced conditions based on a subset of those from the work of Hull and Pace are lower than those of Dicke for eight of the COPC (actinium, americium, neptunium, Niobium, lead, plutonium, strontium, and uranium). The difference in mean values ranged from approximately a factor of 10 for strontium to approximately 10 orders of magnitude for plutonium.
The range in solubility values under reduced conditions was assessed for each COPC. Technetium, radium, and possibly neptunium showed broad (several orders of magnitude) solubility ranges. Such uncertainty could result in greater variation in the mechanism of release (sorption versus solubility control) simulated by the numerical model from the beginning and through completion of model runs and variation observed among simulation runs.
The affect of climactic conditions and cover performance on infiltration rates was assessed based on SDA information and a recent assessment performed at the Hanford Site. Hanford’s solution to the climactic condition issue was to use available recorded climate data to represent future climate. INEEL’s approach to applying average infiltration rates to specific waste source areas within the SDA based on six years of climatic data appears to be consistent with this approach. Past SDA risk modeling of the surface barrier and Modified RCRA Subtitle C caps assumed water to infiltrate the systems at a rate of 0.114 cm/y. This value is a factor of 2 higher than determined from model simulations and a factor of 10 higher than the value used in a recent Hanford assessment.
The best estimate diffusion coefficient value for VOC in Rocky Flats waste is that recommended in the ABRA assessment. The average diffusion rate of VOC in Texas Regal oil is recommended as upper bound limit for use in simulating release of these compounds from this waste type. A value for the lower bound limit was based on diffusion-controlled release from saturated saltstone. The lower bound limit closely approximates previous best estimate values used in assessments.
Sensitivity case structures were developed as an aid to identifying the breadth of sensitivity case combinations from which sensitivity cases could be identified for simulation and analysis. For the more complex waste/COPC scenarios, release/VZ transport groupings were developed based on model parameter matrices to assist in the conceptualization of the sensitivity case structures. From these structures, 13 test cases were identified for possible simulation. The selection of cases focused on issues of interest to INEEL (e.g., release of uranium, plutonium, and technetium from SDA waste and subsequent release to groundwater, the performance of grouts of interest to INEEL based on selected COPC, carbon-14 release from activated metal waste and carbon tetrachloride release from Rocky Flats
8.3
8.4
waste). Sensitivity case structures allow Idaho Completion Project personnel to identify additional sensitivity cases beyond those identified here for possible simulation and analysis.
9.0 References
Adler-Flitton MK May, CW Bishop, RE Mizia, LL Torres, and RD Rogers. 2001. Long-Term Corrosion/Degradation Test Third-Year Results. INEEL/EXT-01-00036, Rev. 0, Idaho National Engineering and Environmental Laboratory, Bechtel BWXT Idaho, LLC, Idaho Falls, Idaho.
Akers DW, J McConnel, and N Morcos. 1992. Characteristic of Low-level Radioactive Contamination Waste. NUREG/CR-5672, Vol. 3, Idaho National Engineering Laboratory, Idaho Falls, Idaho.
Akers DW, NC Kraft, and JW Mandler. 1994a. Release of Radionuclides and Chelating Agents from Cement-Solidified Decontamination Low-Level Radioactive Waste Collected from the Peach-Bottom Atomic Power Station Unit 3. EGG-2722, Idaho National Engineering Laboratory, EG&G Idaho, Inc., Idaho Falls, Idaho.
Akers DW, NC Kraft, and JW Mandler. 1994b. Compression and Immersion Tests and Leaching of Radionuclides, Stable Metals, and Chelating Agents from Cement Solidified Decontamination Waste Collected from Nuclear Power Stations. NUREG/CR-6201, EGG-2736, Idaho National Engineering Laboratory, Idaho, Falls, Idaho.
American Nuclear Society (ANS). 1986. Measurement of the Leachability of Solidified Low-Level Radioactive Wastes by a Short-Term Test Procedure. ANSI/ANS-16.1-1986, American Nuclear Society, La Grange Park, Illinois.
Baes CF, Jr. and RE Messmer. 1976. The Hydrolysis of Cations. John Wiley and Sons, New York, 489p.
Bargelt RJ, CA Dicke, JM Hubbel, M Paarman, D Ryan, RW Smith, and TR Wood. 1992. Summary of RWMC Investigations Report. EGG-WM-9708, Rev. 0, EG&G Idaho Inc., Idaho Falls, Idaho.
Barnes MW, CA Langton, and DM Roy. 1984. Leaching of Saltstone. DP-MS-84-111, E.I. Dupont de Nemours and Company, Aiken, South Carolina.
Baxter JT. 1999. 221-U Facility Concrete and Reinforcing Steel Evaluations, Canyon Disposition Initiative (CDI). HNF-3915, Rev. 0, Fluor Daniel Northwest, Inc., Richland, Washington.
Becker BH. 1997. Selection and Development of Models Used in the Waste Area Group 7 Baseline Risk Assessment. INEEL/EXT-97-00391, Lockheed Martin Idaho Technologies Company, Idaho Falls, Idaho.
Becker BH, JD Burgess, KJ Holdren, DK Jorgensen, SO Magnuson, and AJ Sondrup. 1998. Interim Risk Assessment and Contaminant Screening for the Waste Area Group 7 Remedial Investigation. DOE/ID-10569, U.S. Department of Energy, Idaho Operations Office, Idaho Falls, Idaho.
Bryce RW, CT Kincaid, PW Eslinger, and LF Morasch (eds.). 2002. An Initial Assessment of Hanford Impact Performed with the System Assessment Capability. PNNL-14027, Pacific Northwest National Laboratory, Richland, Washington.
9.1
Buck JW, LM Bagaasen, MP Bergeron, GP Streile, LH Staven, KJ Castleton, GM Gelston, DL Strenge, KM Krupka, and RJ Serne. 1996. Long-Term-Consequence Analysis of No-Action Alternative 2. Support Information for the Waste Isolation Pilot Plant Disposal-Phase Supplemental Environmental Impact Statement. PNNL-11252, Pacific Northwest National Laboratory, Richland, Washington.
Buelt JL, CL Timmerman, KH Oma, VF Fitzpatrick, and JG Carter. 1987. In-Situ Vitrification of Transuranic Wastes: An Updated Systems Evaluation and Applications Assessment. PNL-4800, Supp. 1, Pacific Northwest Laboratory, Richland, Washington.
Callow RA, LE Thompson, JR Weidner, CA Loehr, BP McGrail, and SO Bates. 1991. In-Situ Vitrification Application to Buried Waste: Final Report of Intermediate Field Test at Idaho National Engineering Laboratory. EGG-WTD-9807, Idaho National Engineering and Environmental Laboratory, Idaho Falls, Idaho.
Campbell BE and JL Buelt. 1990. In-Situ Vitrification of Soil the Savannah River Site. PNL-7421, Pacific Northwest Laboratory, Richland, Washington.
Carter JG, SO Bates, and GD Maupin. 1987. In Situ Vitrification of Oak Ridge National Laboratory Soil and Limestone. PNL-6174, Pacific Northwest Laboratory, Richland, Washington.
CERCLA – Comprehensive Environmental Response, Compensation, and Liability Act. 1980. Public Law 96-150, as amended, 94 Stat. 2767, 42 USC 9601 et seq.
Crouse P. 2002. Liner and Final Cover Long-Term Performance Evaluation and Final Cover Life Cycle Expectation. EDF-ER-281, Rev. 1, Idaho National Engineering and Environmental Laboratory, Idaho Falls, Idaho.
Cruz CR. 1992. Material Strength Properties of B-Plant. WHC-SD-WM-TRP-040, Rev. 0-A, Westinghouse Hanford Company, Richland, Washington.
Davis LC and JR Pittman. 1990. Hydrological, Meteorological, and Geohydrological Data for an Unsaturated Zone Study Near the Radioactive Waste Management Complex, Idaho National Engineering Laboratory, Idaho—1987. DOE/ID 22086, U.S. Department of Energy, Idaho Falls, Idaho.
Dicke CA. 1997. Distribution Coefficients and Contaminant Solubilities for the Waste Area Group 7 Baseline Risk Assessment. INEL/EXT-97-00201, Lockheed Martin Idaho Technologies Company, Idaho Falls, Idaho.
DOE. 1993. Technical Area Status Report for Low-Level Mixed Waste Final Waste Forms, Vol. 1. DOE/MWIP-3, Office of Technology Development, U.S. Department of Energy, Washington, D.C.
EPA. 1999. Understanding Variation in Partition Coefficient, Kd Values. EPA 402-R-99-004A&B, Office of Radiation and Indoor Air, U.S. Environmental Protection Agency.
Ewart FT, HP Smith-Briggs, HP Thomason, and SJ Williams. 1992. “The Solubility of Actinides in a Cementitious Near-Field Environment.” Waste Management 12:241-252.
9.2
Farnsworth RK, DJ Hennkson, RA Hyde, DK Jorgenson, JK McDonald, DF Nickelson, MC Pfeifer, PA Sload, and JR Weidner. 1999. Operable Unit 7-13/14. In Situ Vitrification Treatability Study Work Plan. DOE/ID-10667, Rev. 00, U.S. Department of Energy, Idaho Operations Office, Idaho Falls, Idaho.
Fjeld RJ, JT Coats, and AW Elzerman. 2000. Final Report: Column Tests to Study the Transport of Plutonium and Other Radionuclides in Sedimentary Interbed at INEEL. INEEL/EXT-01-00763, Rev. 0, Idaho National Engineering and Environmental Laboratory, Idaho Falls, Idaho.
Gilliam TM, RD Spence, BS Evans-Brown, IL Morgan, JL Shoemaker, and WD Bostick. 1988. “Performance Testing of Blast Furnace Slag for Immobilization of Technetium in Grout.” Nuclear and Hazardous Waste Management Spectrum 88, American Nuclear Society, LaGrange Park, Illinois.
Grant DC, EE Smeltzer, MC Skriba, JC Cwynar, and LR Eisenstatt. 1985. Leachability of Cement Encapsulated West Valley Radwaste Streams. Research Society Symposium Proceedings, Vol. 44, pp. 876-882.
Grossman CJ, RA Fjeld, JT Coats, and AW Elzerman. 2001. The Sorption of Selected Radionuclides in Sedimentary Interbed Soils from the Snake River Plain. INEEL/EXT-01-01106, Rev. 0, Idaho National Engineering and Environmental Laboratory, Idaho Falls, Idaho.
Heiser JH and LW Millian. 1994. Laboratory Evaluation of Performance and Durability of Polymer Grouts for Subsurface Hydraulic/Diffusion Barriers. BNL-61292, Brookhaven National Laboratory, Upton, New York.
Heiser J and M Fuhrmann. 1997. Materials Testing for In Situ Stabilization Treatability Study of INEEL Mixed Waste Soils. BNL-64932, Brookhaven National Laboratory, Upton, New York.
Holdren KJ, BH Becker, NL Hampton, LD Koeppen, SO Magnuson, TJ Meyer, GL Olsen, and AJ Sondrup. 2002. Ancillary Basis for Risk Analysis of the Subsurface Disposal Area. INEEL/EXT-02-01125, Idaho National Engineering and Environmental Laboratory, Bechtel BWXT Idaho, LLC, Idaho Falls, Idaho.
Huang FH, DE Mitchell, and JM Conner. 1994. “Low-Level Radioactive Hanford Wastes Immobilized by Cement-Based Grouts.” Nuclear Technology 107:254-271.
Hull L and MN Pace. 2000. Solubility Calculations for Contaminants of Potential Concern. OU7-13/14. INEEL/EXT-2000-00465, Rev. 0, Bechtel BWXT Idaho, LLC, Idaho Falls, Idaho.
Hull L. 2001. Interoffice Memorandum to Theodore J. Meyer, Doug Burns, Swen Magnuson, and James McCarthy. Approach to Simulation of Actinides for the OU7-13/14 Baseline Risk Assessment. Idaho National Engineering and Environmental Laboratory, Bechtel BWXT Idaho, LLC, Idaho Falls, Idaho, LCH-04-01, April 4, 2001.
Hull LC and CW Bishop. 2003. Fate of Magnesium Chloride Brine Applied to Unpaved Roads to Suppress Dust at the INEEL Subsurface Disposal Area. INEEL/EXT-01-01173, Idaho National Engineering and Environmental Laboratory, Bechtel BWXT Idaho, LLC, Idaho Falls, Idaho.
9.3
INEEL. 2000. Biodegradation of Grout, Contaminant Diffusion, Solubility, and Technical Review of the In Situ Grout Treatability Study. INEEL/EXT-2000-00511, Bechtel BWXT Idaho, LLC, Idaho Falls, Idaho.
Kincaid CT, MP Bergeron, CR Cole, MD Freshley, NL Hassig, VG Johnson, DI Kaplan, RJ Serne, GP Streile, DL Strenge, PD Thorne, LW Vail, GA Whyatt, and SK Wurstner. 1998. Composite Analysis for Low-Level Waste Disposal in the 200 Area Plateau of the Hanford Site. PNNL-11800, Pacific Northwest National Laboratory, Richland, Washington.
Kudera DE and BW Brown. 1996. Volatile Organic Compounds Disposed of from 1952 Through 1983 at the Radioactive Waste Management Complex: Quantities, Forms, Release Mechanisms, and Rates. ER-WAG7-90, Idaho National Engineering and Environmental Laboratory, Lockheed Martin Idaho Technologies Company, Idaho Falls, Idaho.
Lange LC, CD Hills, and AB Poole. 1996a. “The Effect of Accelerated Carbonation on the Properties of Cement-Solidified Waste Forms.” Waste Management 16:757-763.
Lange LC, CD Hills, and AB Poole. 1996b. “Preliminary Investigation into the Effects of Carbonation on Cement-Solidified Hazardous Wastes.” Environmental Science and Technology 30:25-30.
Lokken RO, LM Bagaasen, RO Mattin, SE Palmer, and CM Anderson. 1993. Characterization Results for 106-AN Grout Produced in a Pilot Scale Test. PNL-8655, Pacific Northwest Laboratory, Richland, Washington.
Loomis GG, JJ Jessmore, JR Weidner, CM Miller, and AL Sehn. 2003b. Final Results Report, In Situ Grouting Technology for Application in Buried Transuranic Waste Sites. Volume 1, Technology Description and Treatability Study Results for Operable Unit 7-13/14, INEEL/EXT-02-00233, Rev. 1, Bechtel BWXT Idaho, LLC, Idaho Falls, Idaho.
Lowe D, W Downs, S Smith, and WV Wilding. 2003. Mass Release of Chlorinated Solvents Through Oil, Adsorbent, and Polyethylene Bagging at the RWMC. ICP/EXT-03-00057, Rev. 0, Bechtel BWXT Idaho, LLC, Idaho Falls, Idaho.
Martian P and AJ Sondrup. 1995. “SDA Buried Drum Failure Rate Data Compilation.” Engineering Design File ER-WAG7-68, INEL-95/126, May.
Martin PFC and RO Lokken. 1992. Characterization of a Low-Level Radioactive Waste Grout: Sampling and Test Results. PNL-8067, Pacific Northwest Laboratory, Richland, Washington.
Martin PFC and RO Lokken. 1993. Characterization of Phosphate/Sulfate Waste Grout Cores. PNL-8620, Pacific Northwest Laboratory, Richland, Washington.
Mattigod SV, GA Whyatt, RJ Serne, PF Martin, KE Schwab, and MI Wood. 2001. Diffusion and Leaching of Selected Radionuclides (Iodine-129, Technetium-99, and Uranium) Through Category 3 Waste Encasement Concrete and Soil Fill Material. PNNL-13639, Pacific Northwest National Laboratory, Richland, Washington.
9.4
McConnell JW, Jr., RM Nielson, Jr., and RD Rogers. 1986. “Testing Waste Forms Containing High Radionuclide Loadings.” Waste Management ’86, pp. 259-266. Tucson Arizona, March 2-6, 1986.
McGrail BP and KM Olson. 1992. Evaluating Long-Term Performance of In-Situ Vitrified Waste Forms: Methodology and Results. PNL-8358, Pacific Northwest Laboratory, Richland, Washington.
McGrail BP, EM Pierce, HT Schaef, EA Rodriquez, JL Steele, AT Owen, and DM Wellman. 2003. Laboratory Testing of Bulk Vitrified and Steam Reformed Low-Activity Waste Forms to Support a Preliminary Risk Assessment for an Integrated Disposal Facility. PNNL-14414, Pacific Northwest National Laboratory, Richland, Washington.
Miller EC and SD Smith. 2003. Final Results Report, In Situ Grouting Technology for Application in Buried Transuranic Waste Sites. Volume 2, Evaluation of Proposed In Situ Grouting of Operable Unit 7-13/14 Waste Against Limited Feasibility Study Criteria. INEEL/EXT-02-00233, Rev. 1, Bechtel BWXT Idaho, LLC, Idaho Falls, Idaho.
Millian LW, JH Heiser, JW Adams, and SP Rutenkroeger. 1997. In-Situ Stabilization of TRU/Mixed Waste Project at the INEEL. BNL-64958, Brookhaven National Laboratory, Upton, New York.
Nagata PK and J Banaee. 1996. Estimation of the Underground Corrosion Rates for Low-Carbon Steels: Types 304 and 316 Steels; and Inconel 600, 601, and 718 Alloys at the Radioactive Waste Management Complex. INEL-096/098, Idaho National Engineering and Environmental Laboratory, Idaho Falls, Idaho.
Östhols E, J Bruno, and I Grenthe. 1994. “On the Influence of Carbonate on Mineral Dissolution: III. The Solubility of Microcrystalline ThO2 in CO2-H2O Media.” Geochimica Cosmochimica Acta 58:613-623.
Pendlebury LS. 1983. “Soil Vaults,” Section 3.3 in RWMC Facility Design Description. DRR-WM-539, Rev. 1, Idaho National Engineering Laboratory, Idaho Falls, Idaho
Pfingsten W. 2001. “Experimental and Modeling Indications for Self-Sealing of a Cementitious Low- and Intermediate-Level Waste Repository by Calcite Precipitation.” Nuclear Technology 140:63-82.
RCRA – Resource Conservation and Recovery Act. 1976. Public Law 94-580, as amended, 90 Stat. 2795, 42 USC 6901 et seq.
Serne RJ, WJ Martin, SB McLaurine, SP Airhart, VL LeGore, and RL Treat. 1987. Laboratory Leach Tests of Phosphate/Sulfate Waste Grout and Leachate Adsorption Tests Using Hanford Sediment. PNL-6019, Pacific Northwest Laboratory, Richland Washington.
Serne RJ, WJ Martin, RO Lokken, VL LeGore, CW Lindenmeier, and PFC Martin. 1989a. Leach and EP Toxicity Tests on Grouted Waste from Tank 106-AN. PNL-6960, Pacific Northwest Laboratory, Richland, Washington.
9.5
Serne RJ, WJ Martin, VL LeGore, CW Lindenmeier, SB McLaurine, PFC Martin, and RO Lokken. 1989b. Leach Tests on Grouts Made with Actual and Trace Metal-Spiked Synthetic Phosphate/Sulfate Waste. PNL-7121, Pacific Northwest Laboratory, Richland, Washington.
Serne RJ and MI Wood. 1990. Hanford Waste Form Release and Sediment Interaction: A Status Report with Rationale and Recommendations for Additional Studies. PNL-7297, Pacific Northwest Laboratory, Richland, Washington.
Serne RJ, RO Lokken, and LJ Criscenti. 1992. “Characterization of Grouted Low-Level-Waste to Support Performance Assessment.” Waste Management 12:271-287.
Tallent OK, EW McDaniel, GD Del Cul, KE Dodson, and DR Trotter. 1988. “Immobilization of Technetium and Nitrate in Cement-Based Materials.” Materials Research Society Symposium Proceedings, Vol. 112, Materials Research Society, Pittsburgh, Pennsylvania.
Serne RJ, WJ Martin, and VL LeGore. 1995. Hanford Grout Technology Program: Leach Test of Cladding Removal Waste Grout Using Hanford Groundwater. PNL-10745, Pacific Northwest Laboratory, Richland, Washington.
Shaw P, B Anderson, and D Davis. 1993. Laboratory Scale Vitrification of Low-Level Radioactive Nitrate Salts and Soils from the Idaho National Engineering Laboratory. EGG-WTD-10640, Idaho National Engineering Laboratory, EG&G Idaho, Inc., Idaho Falls, Idaho.
Smith RW and JC Walton. 1991. The Effects of Calcite Solid Solution Formation on the Transient Release of Radionuclides from Concrete Barriers. Materials Research Society Symposium Proceedings, Vol. 212, Materials Research Society, Pittsburgh, Pennsylvania.
Soo P and J Heiser. 1996. Gamma Irradiation Testing of Montan Wax Barrier Materials for In Situ Waste Containment. BNL-62901, Brookhaven National Laboratory, Upton, New York.
Spaulding BP, JS Tixier, MT Nancy, SR Cline, and MA Bogle. 1997. In Situ Vitrification Demonstration at Pit 1, Oak Ridge National Laboratory. Volume 1. Results of Treatability Study. ORNL/ER-425/V1, Oak Ridge National Laboratory, Oak Ridge, Tennessee.
Spence RD and JL Kauschinger. 1997. Grout Performance in Support of In Situ Stabilization/ Solidification of the GAAT Tank Sludges. ORNL/TM-13389, Lockheed Martin Energy Research Corporation, Oak Ridge, Tennessee.
Spence RD. 1998. Effect of Selective Sorptive Agents on Leachability of 137Cs and 90Sr. ORNL/CP-98158, Lockheed Martin Energy Research Corporation, Oak Ridge, Tennessee.
Tallent OK, EW McDaniel, GD Del Cul, KE Dodson, and DR Trotter. 1988. “Immobilization of Technetium and Nitrate in Cement-Based Materials.” Materials Research Symposium Proceedings, Vol. 112:23-32, Materials Research Society.
9.6

9.7
Thomas TN and RL Treat. 2002. Evaluation of In Situ Vitrification for Operable Unit 7-13/14. INEEL/EXT-01-00279, Rev. 0, Bechtel BWXT Idaho, LLC, Idaho Falls, Idaho.
Timmerman CL, RA Brouns, JL Buelt, and KH Oma. 1983. “In-Situ Vitrification: Pilot-Scale Development.” Nuclear and Chemical Waste Management 4:267-276.
Truex MJ, CJ Murray, CR Cole, RJ Cameron, MD Johnson, RS Skeen, and CD Johnson. 2001. Assessment of Carbon Tetrachloride Groundwater Transport in Support of the Hanford Carbon Tetrachloride Innovative Technology Demonstration Program. PNNL-13560, Pacific Northwest National Laboratory, Richland, Washington.
Venhuis MA and EJ Reardon. 2001. “Vacuum Method for Carbonation of Cementitious Waste Forms.” Environmental Science and Technology 35:4120-4126.
Vogel TM, CS Criddle, and PL McCarty. 1987. “Transformations of Halogenated Aliphatic Compounds.” Environmental Science and Technology 21:722-736.
Walton JC, S Bin-Shafique, RW Smith, N Gutierrez, and A Tarquin. 1997. “Role of Carbonation in Transient Leaching of Cementitious Waste Forms.” Environmental Science and Technology 31:2345-2349.
Whited AR, RA Field, and JR Cook. 1998. “Vitrified Waste Form Performance Modeling Applied to the Treatment and Disposal of a Mixed-Waste Sludge at the Savannah River Site.” Nuclear Technology 123:304-318.
Yokuda E. 1992. Locations of Pits, Trenches, and Soil Vault Rows. ERP-WAG7-05, Rev. 2, EG&G Idaho, Inc., Idaho Falls, Idaho.
Zitnik JF, AT Armstrong, BK Corb, MH Edens, DB Holsten, PM O’Flaherty, J Rodriquez, TN Thomas, RL Treat, W Schofield, and KL Sykes. 2002. Preliminary Evaluation of Remedial Alternatives for the Subsurface Disposal Area. INEEL/EXT-02-01258, Rev. 0., Idaho National Engineering and Environmental Laboratory, Bechtel BWXT Idaho, LLC, Idaho Falls, Idaho.
Appendix A
Key Parameter Value Data: Release Model for In Situ Grouting of Subsurface Disposal Area Waste
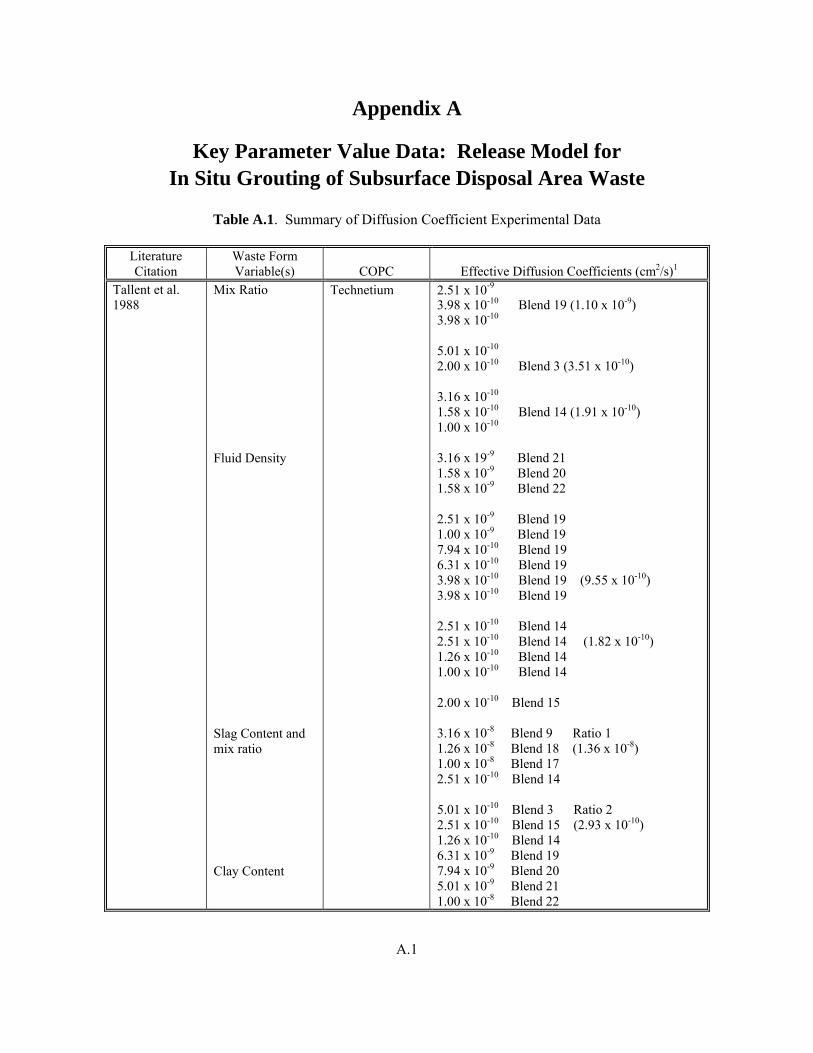
Appendix A
Key Parameter Value Data: Release Model for In Situ Grouting of Subsurface Disposal Area Waste
Table A.1. Summary of Diffusion Coefficient Experimental Data
Literature Citation
Waste Form Variable(s) COPC Effective Diffusion Coefficients (cm2/s)1
Tallent et al. 1988
Mix Ratio Fluid Density Slag Content and mix ratio Clay Content
Technetium
2.51 x 10⁻⁹ 3.98 x 10⁻¹⁰ Blend 19 (1.10 x 10⁻⁹) 3.98 x 10⁻¹⁰ 5.01 x 10⁻¹⁰ 2.00 x 10⁻¹⁰ Blend 3 (3.51 x 10⁻¹⁰) 3.16 x 10⁻¹⁰ 1.58 x 10⁻¹⁰ Blend 14 (1.91 x 10⁻¹⁰) 1.00 x 10⁻¹⁰ 3.16 x 19-9 Blend 21 1.58 x 10⁻⁹ Blend 20 1.58 x 10⁻⁹ Blend 22 2.51 x 10⁻⁹ Blend 19 1.00 x 10⁻⁹ Blend 19 7.94 x 10⁻¹⁰ Blend 19 6.31 x 10⁻¹⁰ Blend 19 3.98 x 10⁻¹⁰ Blend 19 (9.55 x 10⁻¹⁰)
3.98 x 10⁻¹⁰ Blend 19 2.51 x 10⁻¹⁰ Blend 14 2.51 x 10⁻¹⁰ Blend 14 (1.82 x 10⁻¹⁰) 1.26 x 10⁻¹⁰ Blend 14 1.00 x 10⁻¹⁰ Blend 14 2.00 x 10⁻¹⁰ Blend 15 3.16 x 10⁻⁸ Blend 9 Ratio 1 1.26 x 10⁻⁸ Blend 18 (1.36 x 10⁻⁸) 1.00 x 10⁻⁸ Blend 17 2.51 x 10⁻¹⁰ Blend 14 5.01 x 10⁻¹⁰ Blend 3 Ratio 2 2.51 x 10⁻¹⁰ Blend 15 (2.93 x 10⁻¹⁰) 1.26 x 10⁻¹⁰ Blend 14 6.31 x 10⁻⁹ Blend 19 7.94 x 10⁻⁹ Blend 20 5.01 x 10⁻⁹ Blend 21 1.00 x 10⁻⁸ Blend 22
A.1
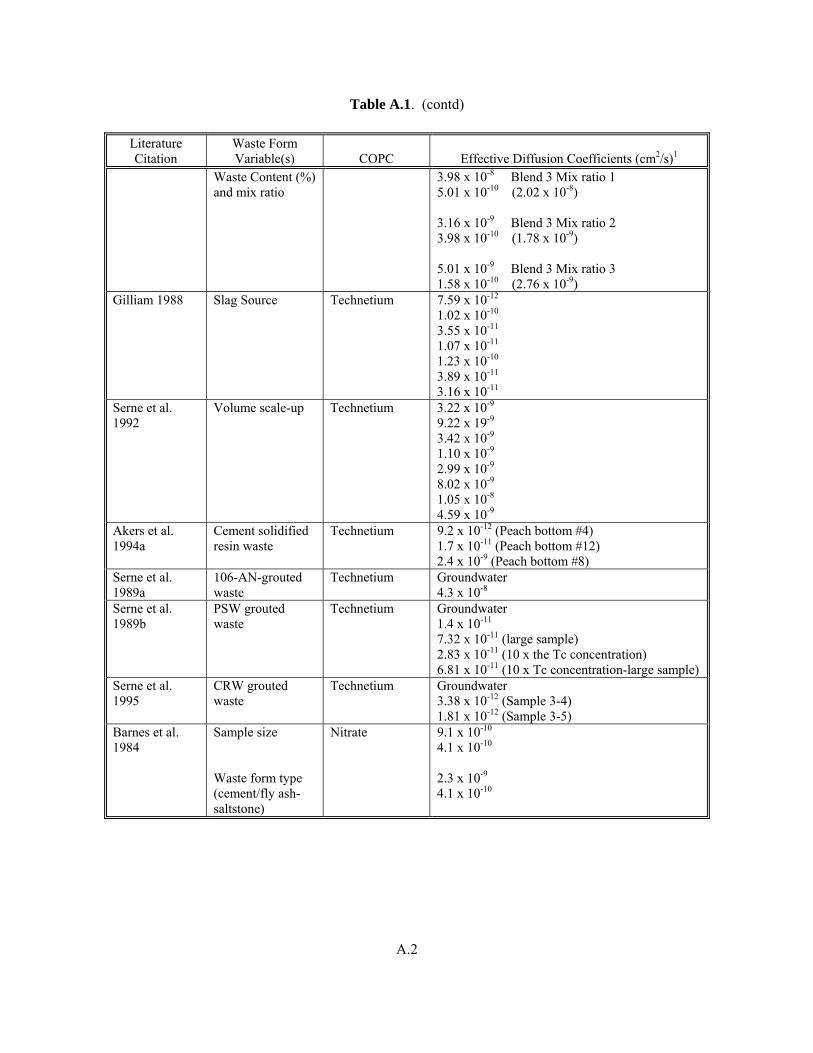
Table A.1. (contd)
Literature Citation
Waste Form Variable(s) COPC Effective Diffusion Coefficients (cm2/s)1
Waste Content (%) and mix ratio
3.98 x 10⁻⁸ Blend 3 Mix ratio 1 5.01 x 10⁻¹⁰ (2.02 x 10⁻⁸) 3.16 x 10⁻⁹ Blend 3 Mix ratio 2 3.98 x 10⁻¹⁰ (1.78 x 10⁻⁹) 5.01 x 10⁻⁹ Blend 3 Mix ratio 3 1.58 x 10⁻¹⁰ (2.76 x 10⁻⁹)
Gilliam 1988 Slag Source Technetium 7.59 x 10⁻¹² 1.02 x 10⁻¹⁰ 3.55 x 10⁻¹¹ 1.07 x 10⁻¹¹ 1.23 x 10⁻¹⁰ 3.89 x 10⁻¹¹ 3.16 x 10⁻¹¹
Serne et al. 1992
Volume scale-up Technetium 3.22 x 10⁻⁹ 9.22 x 19-9 3.42 x 10⁻⁹ 1.10 x 10⁻⁹ 2.99 x 10⁻⁹ 8.02 x 10⁻⁹ 1.05 x 10⁻⁸ 4.59 x 10⁻⁹
Akers et al. 1994a
Cement solidified resin waste
Technetium 9.2 x 10⁻¹² (Peach bottom #4) 1.7 x 10⁻¹¹ (Peach bottom #12) 2.4 x 10⁻⁹ (Peach bottom #8)
Serne et al. 1989a
106-AN-grouted waste
Technetium Groundwater 4.3 x 10⁻⁸
Serne et al. 1989b
PSW grouted waste
Technetium Groundwater 1.4 x 10⁻¹¹ 7.32 x 10⁻¹¹ (large sample) 2.83 x 10⁻¹¹ (10 x the Tc concentration) 6.81 x 10⁻¹¹ (10 x Tc concentration-large sample)
Serne et al. 1995
CRW grouted waste
Technetium Groundwater 3.38 x 10⁻¹² (Sample 3-4) 1.81 x 10⁻¹² (Sample 3-5)
Barnes et al. 1984
Sample size Waste form type (cement/fly ash-saltstone)
Nitrate 9.1 x 10⁻¹⁰ 4.1 x 10⁻¹⁰
2.3 x 10⁻⁹ 4.1 x 10⁻¹⁰
A.2
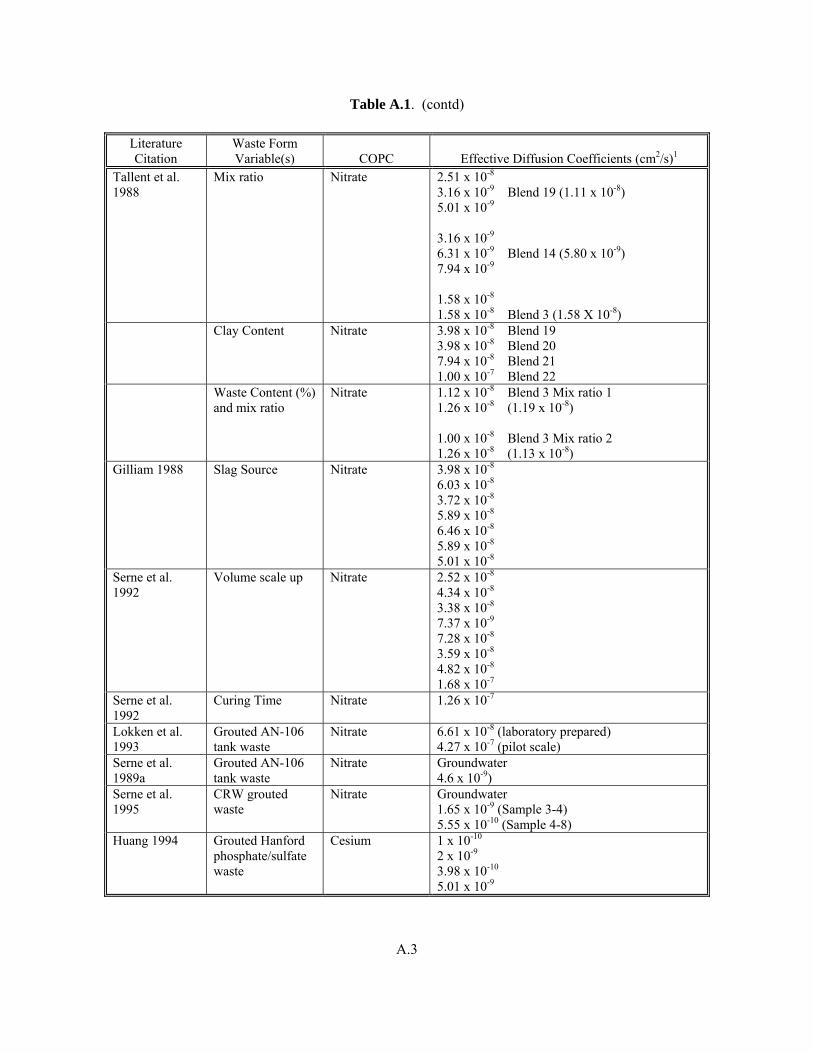
Table A.1. (contd)
Literature Citation
Waste Form Variable(s) COPC Effective Diffusion Coefficients (cm2/s)1
Tallent et al. 1988
Mix ratio Nitrate 2.51 x 10⁻⁸ 3.16 x 10⁻⁹ Blend 19 (1.11 x 10⁻⁸) 5.01 x 10⁻⁹ 3.16 x 10⁻⁹ 6.31 x 10⁻⁹ Blend 14 (5.80 x 10⁻⁹) 7.94 x 10⁻⁹ 1.58 x 10⁻⁸ 1.58 x 10⁻⁸ Blend 3 (1.58 X 10⁻⁸)
Clay Content Nitrate 3.98 x 10⁻⁸ Blend 19 3.98 x 10⁻⁸ Blend 20 7.94 x 10⁻⁸ Blend 21 1.00 x 10⁻⁷ Blend 22
Waste Content (%) and mix ratio
Nitrate 1.12 x 10⁻⁸ Blend 3 Mix ratio 1 1.26 x 10⁻⁸ (1.19 x 10⁻⁸) 1.00 x 10⁻⁸ Blend 3 Mix ratio 2 1.26 x 10⁻⁸ (1.13 x 10⁻⁸)
Gilliam 1988 Slag Source Nitrate 3.98 x 10⁻⁸ 6.03 x 10⁻⁸ 3.72 x 10⁻⁸ 5.89 x 10⁻⁸ 6.46 x 10⁻⁸ 5.89 x 10⁻⁸ 5.01 x 10⁻⁸
Serne et al. 1992
Volume scale up Nitrate 2.52 x 10⁻⁸ 4.34 x 10⁻⁸ 3.38 x 10⁻⁸ 7.37 x 10⁻⁹ 7.28 x 10⁻⁸ 3.59 x 10⁻⁸ 4.82 x 10⁻⁸ 1.68 x 10⁻⁷
Serne et al. 1992
Curing Time Nitrate 1.26 x 10⁻⁷
Lokken et al. 1993
Grouted AN-106 tank waste
Nitrate 6.61 x 10⁻⁸ (laboratory prepared) 4.27 x 10⁻⁷ (pilot scale)
Serne et al. 1989a
Grouted AN-106 tank waste
Nitrate Groundwater 4.6 x 10⁻⁹)
Serne et al. 1995
CRW grouted waste
Nitrate Groundwater 1.65 x 10⁻⁹ (Sample 3-4) 5.55 x 10⁻¹⁰ (Sample 4-8)
Huang 1994 Grouted Hanford phosphate/sulfate waste
Cesium 1 x 10⁻¹⁰ 2 x 10⁻⁹ 3.98 x 10⁻¹⁰ 5.01 x 10⁻⁹
A.3
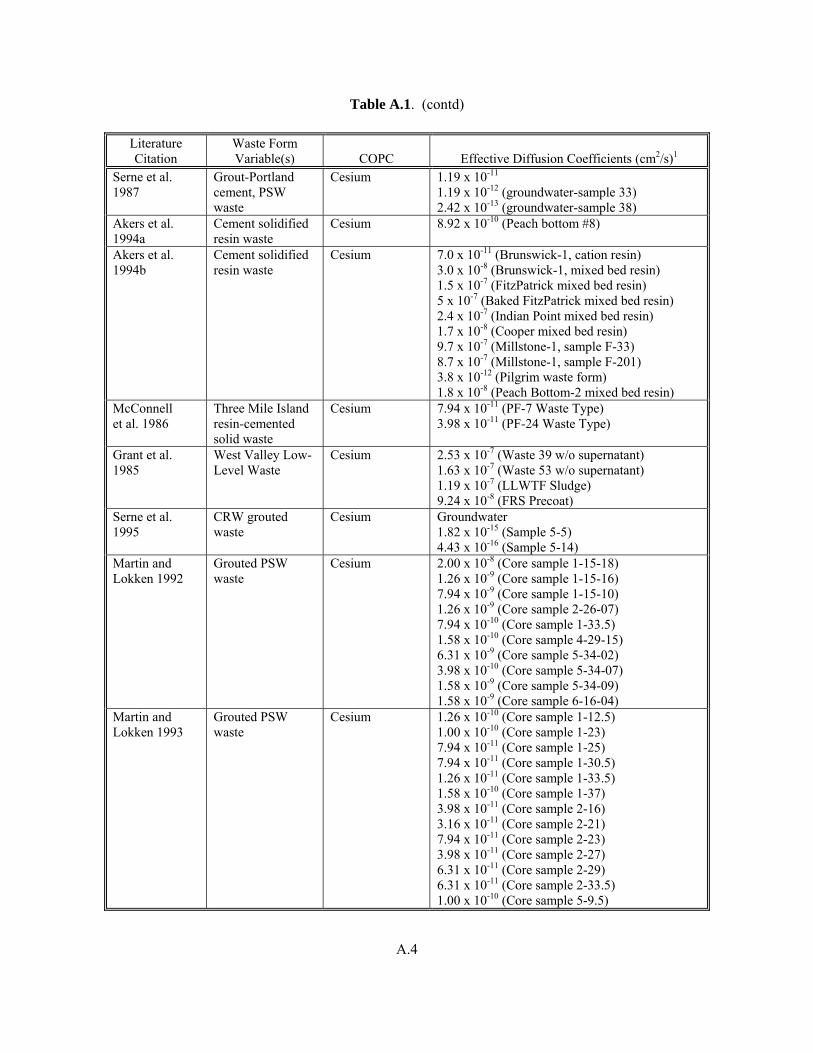
Table A.1. (contd)
Literature Citation
Waste Form Variable(s) COPC Effective Diffusion Coefficients (cm2/s)1
Serne et al. 1987
Grout-Portland cement, PSW waste
Cesium 1.19 x 10⁻¹¹ 1.19 x 10⁻¹² (groundwater-sample 33) 2.42 x 10⁻¹³ (groundwater-sample 38)
Akers et al. 1994a
Cement solidified resin waste
Cesium 8.92 x 10⁻¹⁰ (Peach bottom #8)
Akers et al. 1994b
Cement solidified resin waste
Cesium 7.0 x 10⁻¹¹ (Brunswick-1, cation resin) 3.0 x 10⁻⁸ (Brunswick-1, mixed bed resin) 1.5 x 10⁻⁷ (FitzPatrick mixed bed resin) 5 x 10⁻⁷ (Baked FitzPatrick mixed bed resin) 2.4 x 10⁻⁷ (Indian Point mixed bed resin) 1.7 x 10⁻⁸ (Cooper mixed bed resin) 9.7 x 10⁻⁷ (Millstone-1, sample F-33) 8.7 x 10⁻⁷ (Millstone-1, sample F-201) 3.8 x 10⁻¹² (Pilgrim waste form) 1.8 x 10⁻⁸ (Peach Bottom-2 mixed bed resin)
McConnell et al. 1986
Three Mile Island resin-cemented solid waste
Cesium 7.94 x 10⁻¹¹ (PF-7 Waste Type) 3.98 x 10⁻¹¹ (PF-24 Waste Type)
Grant et al. 1985
West Valley Low-Level Waste
Cesium 2.53 x 10⁻⁷ (Waste 39 w/o supernatant) 1.63 x 10⁻⁷ (Waste 53 w/o supernatant) 1.19 x 10⁻⁷ (LLWTF Sludge) 9.24 x 10⁻⁸ (FRS Precoat)
Serne et al. 1995
CRW grouted waste
Cesium Groundwater 1.82 x 10⁻¹⁵ (Sample 5-5) 4.43 x 10⁻¹⁶ (Sample 5-14)
Martin and Lokken 1992
Grouted PSW waste
Cesium 2.00 x 10⁻⁸ (Core sample 1-15-18) 1.26 x 10⁻⁹ (Core sample 1-15-16) 7.94 x 10⁻⁹ (Core sample 1-15-10) 1.26 x 10⁻⁹ (Core sample 2-26-07) 7.94 x 10⁻¹⁰ (Core sample 1-33.5) 1.58 x 10⁻¹⁰ (Core sample 4-29-15) 6.31 x 10⁻⁹ (Core sample 5-34-02) 3.98 x 10⁻¹⁰ (Core sample 5-34-07) 1.58 x 10⁻⁹ (Core sample 5-34-09) 1.58 x 10⁻⁹ (Core sample 6-16-04)
Martin and Lokken 1993
Grouted PSW waste
Cesium 1.26 x 10⁻¹⁰ (Core sample 1-12.5) 1.00 x 10⁻¹⁰ (Core sample 1-23) 7.94 x 10⁻¹¹ (Core sample 1-25) 7.94 x 10⁻¹¹ (Core sample 1-30.5) 1.26 x 10⁻¹¹ (Core sample 1-33.5) 1.58 x 10⁻¹⁰ (Core sample 1-37) 3.98 x 10⁻¹¹ (Core sample 2-16) 3.16 x 10⁻¹¹ (Core sample 2-21) 7.94 x 10⁻¹¹ (Core sample 2-23) 3.98 x 10⁻¹¹ (Core sample 2-27) 6.31 x 10⁻¹¹ (Core sample 2-29) 6.31 x 10⁻¹¹ (Core sample 2-33.5) 1.00 x 10⁻¹⁰ (Core sample 5-9.5)
A.4
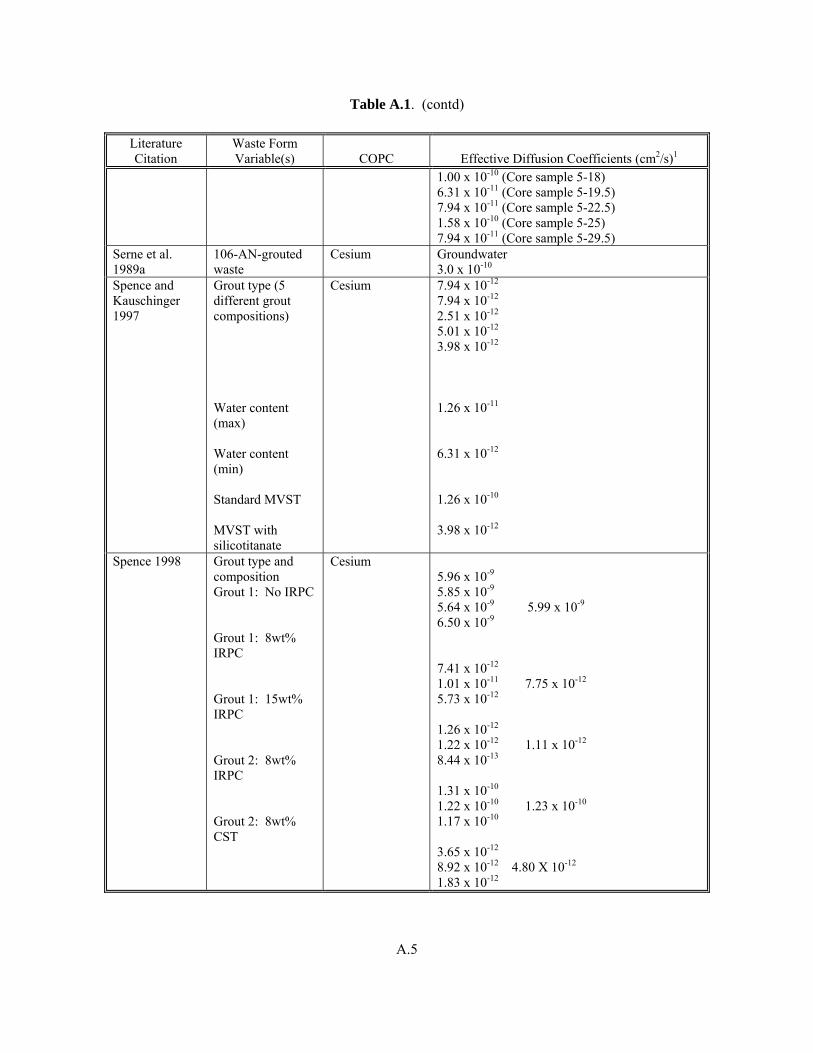
Table A.1. (contd)
Literature Citation
Waste Form Variable(s) COPC Effective Diffusion Coefficients (cm2/s)1
1.00 x 10⁻¹⁰ (Core sample 5-18) 6.31 x 10⁻¹¹ (Core sample 5-19.5) 7.94 x 10⁻¹¹ (Core sample 5-22.5) 1.58 x 10⁻¹⁰ (Core sample 5-25) 7.94 x 10⁻¹¹ (Core sample 5-29.5)
Serne et al. 1989a
106-AN-grouted waste
Cesium Groundwater 3.0 x 10⁻¹⁰
Spence and Kauschinger 1997
Grout type (5 different grout compositions) Water content (max) Water content (min) Standard MVST MVST with silicotitanate
Cesium 7.94 x 10⁻¹²
7.94 x 10⁻¹²
2.51 x 10⁻¹² 5.01 x 10⁻¹²
3.98 x 10⁻¹²
1.26 x 10⁻¹¹ 6.31 x 10⁻¹² 1.26 x 10⁻¹⁰ 3.98 x 10⁻¹²
Spence 1998 Grout type and
composition Grout 1: No IRPC Grout 1: 8wt% IRPC Grout 1: 15wt% IRPC Grout 2: 8wt% IRPC Grout 2: 8wt% CST
Cesium 5.96 x 10⁻⁹ 5.85 x 10⁻⁹ 5.64 x 10⁻⁹ 5.99 x 10⁻⁹ 6.50 x 10⁻⁹ 7.41 x 10⁻¹² 1.01 x 10⁻¹¹ 7.75 x 10⁻¹² 5.73 x 10⁻¹² 1.26 x 10⁻¹² 1.22 x 10⁻¹² 1.11 x 10⁻¹² 8.44 x 10⁻¹³ 1.31 x 10⁻¹⁰ 1.22 x 10⁻¹⁰ 1.23 x 10⁻¹⁰ 1.17 x 10⁻¹⁰ 3.65 x 10⁻¹² 8.92 x 10⁻¹² 4.80 X 10⁻¹² 1.83 x 10⁻¹²
A.5
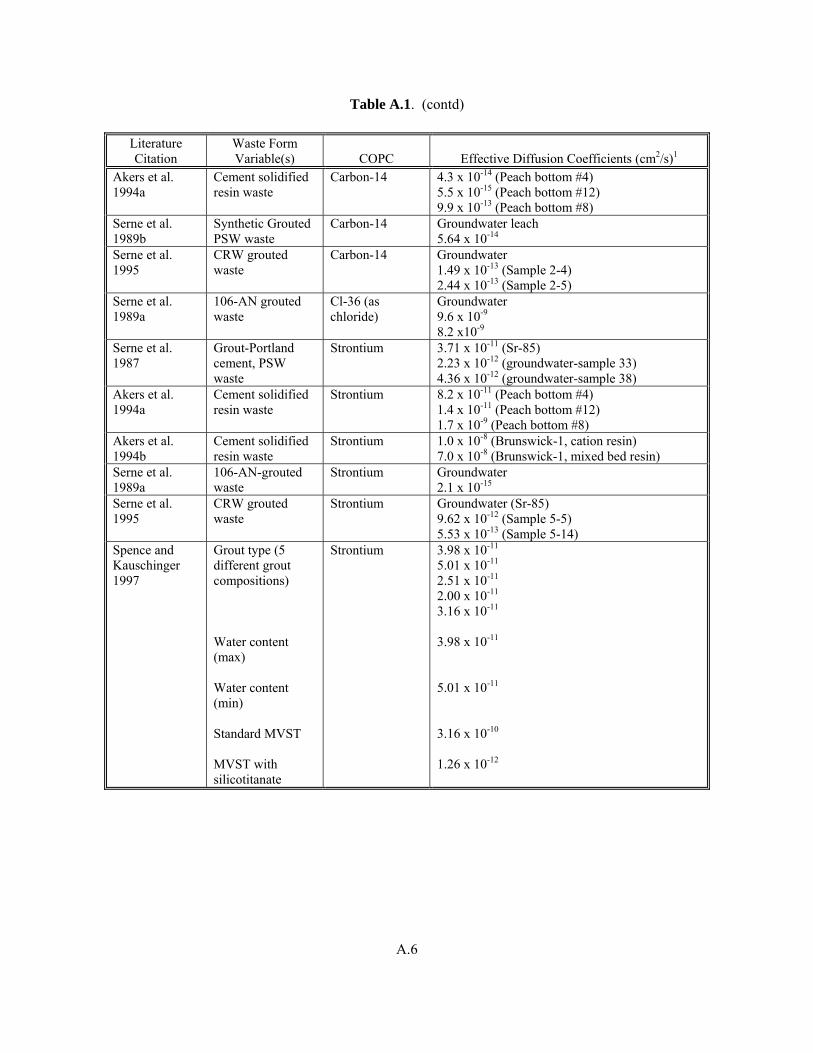
Table A.1. (contd)
Literature Citation
Waste Form Variable(s) COPC Effective Diffusion Coefficients (cm2/s)1
Akers et al. 1994a
Cement solidified resin waste
Carbon-14 4.3 x 10⁻¹⁴ (Peach bottom #4) 5.5 x 10⁻¹⁵ (Peach bottom #12) 9.9 x 10⁻¹³ (Peach bottom #8)
Serne et al. 1989b
Synthetic Grouted PSW waste
Carbon-14 Groundwater leach 5.64 x 10⁻¹⁴
Serne et al. 1995
CRW grouted waste
Carbon-14 Groundwater 1.49 x 10⁻¹³ (Sample 2-4) 2.44 x 10⁻¹³ (Sample 2-5)
Serne et al. 1989a
106-AN grouted waste
Cl-36 (as chloride)
Groundwater 9.6 x 10⁻⁹ 8.2 x10⁻⁹
Serne et al. 1987
Grout-Portland cement, PSW waste
Strontium 3.71 x 10⁻¹¹ (Sr-85) 2.23 x 10⁻¹² (groundwater-sample 33) 4.36 x 10⁻¹² (groundwater-sample 38)
Akers et al. 1994a
Cement solidified resin waste
Strontium 8.2 x 10⁻¹¹ (Peach bottom #4) 1.4 x 10⁻¹¹ (Peach bottom #12) 1.7 x 10⁻⁹ (Peach bottom #8)
Akers et al. 1994b
Cement solidified resin waste
Strontium 1.0 x 10⁻⁸ (Brunswick-1, cation resin) 7.0 x 10⁻⁸ (Brunswick-1, mixed bed resin)
Serne et al. 1989a
106-AN-grouted waste
Strontium Groundwater 2.1 x 10⁻¹⁵
Serne et al. 1995
CRW grouted waste
Strontium Groundwater (Sr-85) 9.62 x 10⁻¹² (Sample 5-5) 5.53 x 10⁻¹³ (Sample 5-14)
Spence and Kauschinger 1997
Grout type (5 different grout compositions) Water content (max) Water content (min) Standard MVST MVST with silicotitanate
Strontium 3.98 x 10⁻¹¹
5.01 x 10⁻¹¹
2.51 x 10⁻¹¹
2.00 x 10⁻¹¹
3.16 x 10⁻¹¹
3.98 x 10⁻¹¹ 5.01 x 10⁻¹¹ 3.16 x 10⁻¹⁰ 1.26 x 10⁻¹²
A.6
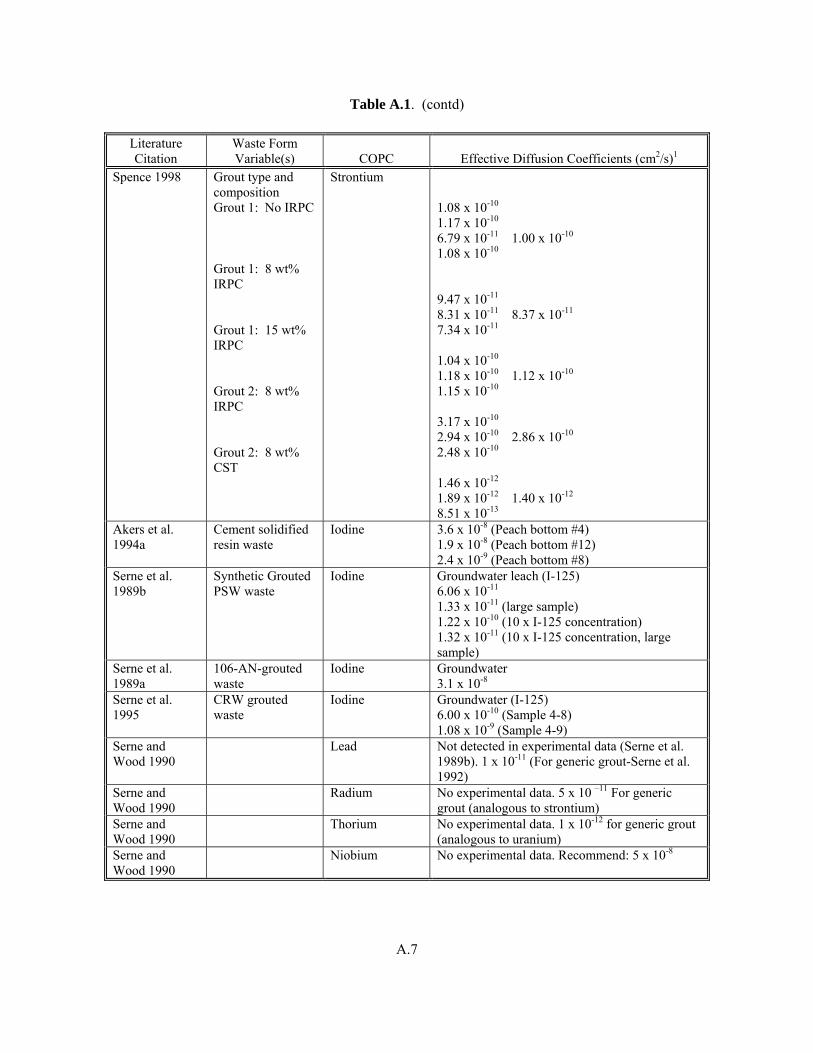
Table A.1. (contd)
Literature Citation
Waste Form Variable(s) COPC Effective Diffusion Coefficients (cm2/s)1
Spence 1998 Grout type and composition Grout 1: No IRPC Grout 1: 8 wt% IRPC Grout 1: 15 wt% IRPC Grout 2: 8 wt% IRPC Grout 2: 8 wt% CST
Strontium 1.08 x 10⁻¹⁰ 1.17 x 10⁻¹⁰ 6.79 x 10⁻¹¹ 1.00 x 10⁻¹⁰ 1.08 x 10⁻¹⁰ 9.47 x 10⁻¹¹ 8.31 x 10⁻¹¹ 8.37 x 10⁻¹¹ 7.34 x 10⁻¹¹ 1.04 x 10⁻¹⁰ 1.18 x 10⁻¹⁰ 1.12 x 10⁻¹⁰ 1.15 x 10⁻¹⁰ 3.17 x 10⁻¹⁰ 2.94 x 10⁻¹⁰ 2.86 x 10⁻¹⁰ 2.48 x 10⁻¹⁰ 1.46 x 10⁻¹² 1.89 x 10⁻¹² 1.40 x 10⁻¹² 8.51 x 10⁻¹³
Akers et al. 1994a
Cement solidified resin waste
Iodine 3.6 x 10⁻⁸ (Peach bottom #4) 1.9 x 10⁻⁸ (Peach bottom #12) 2.4 x 10⁻⁹ (Peach bottom #8)
Serne et al. 1989b
Synthetic Grouted PSW waste
Iodine Groundwater leach (I-125) 6.06 x 10⁻¹¹ 1.33 x 10⁻¹¹ (large sample) 1.22 x 10⁻¹⁰ (10 x I-125 concentration) 1.32 x 10⁻¹¹ (10 x I-125 concentration, large sample)
Serne et al. 1989a
106-AN-grouted waste
Iodine Groundwater 3.1 x 10⁻⁸
Serne et al. 1995
CRW grouted waste
Iodine Groundwater (I-125) 6.00 x 10⁻¹⁰ (Sample 4-8) 1.08 x 10⁻⁹ (Sample 4-9)
Serne and Wood 1990
Lead Not detected in experimental data (Serne et al. 1989b). 1 x 10-11 (For generic grout-Serne et al. 1992)
Serne and Wood 1990
Radium No experimental data. 5 x 10 –11 For generic grout (analogous to strontium)
Serne and Wood 1990
Thorium No experimental data. 1 x 10-12 for generic grout (analogous to uranium)
Serne and Wood 1990
Niobium No experimental data. Recommend: 5 x 10⁻⁸
A.7
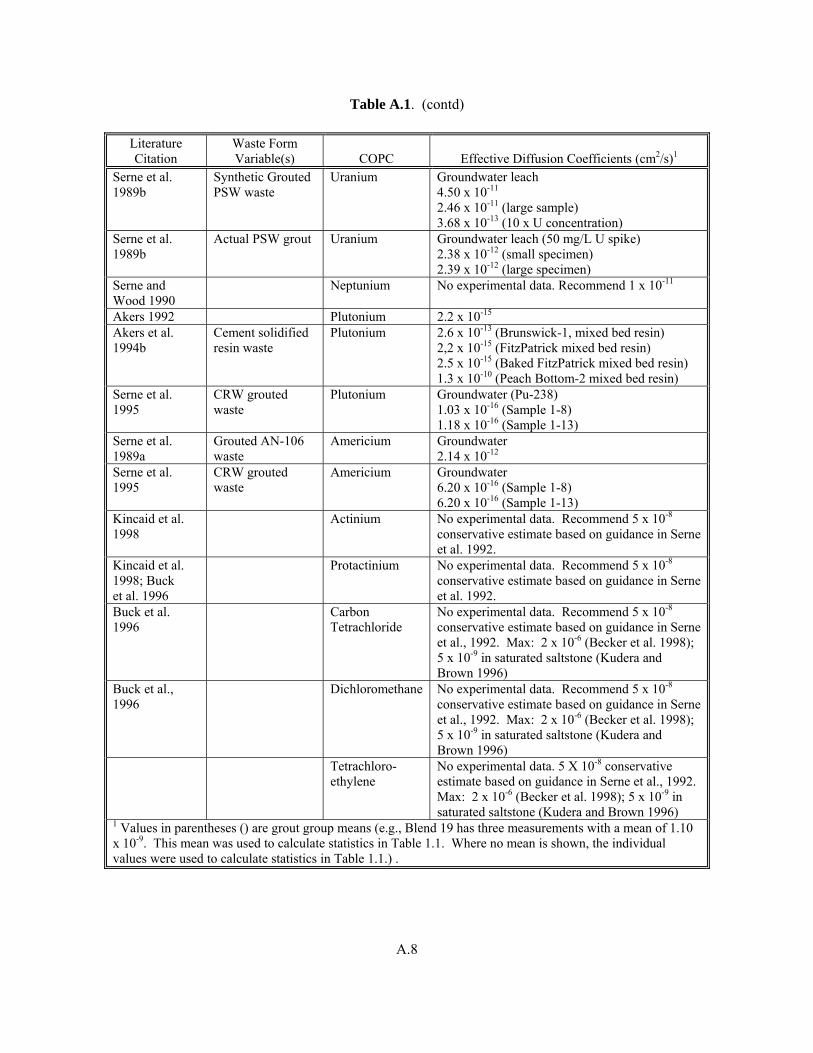
Table A.1. (contd)
Literature Citation
Waste Form Variable(s) COPC Effective Diffusion Coefficients (cm2/s)1
Serne et al. 1989b
Synthetic Grouted PSW waste
Uranium Groundwater leach 4.50 x 10⁻¹¹ 2.46 x 10⁻¹¹ (large sample) 3.68 x 10⁻¹³ (10 x U concentration)
Serne et al. 1989b
Actual PSW grout Uranium Groundwater leach (50 mg/L U spike) 2.38 x 10⁻¹² (small specimen) 2.39 x 10⁻¹² (large specimen)
Serne and Wood 1990
Neptunium No experimental data. Recommend 1 x 10-11
Akers 1992 Plutonium 2.2 x 10⁻¹⁵ Akers et al. 1994b
Cement solidified resin waste
Plutonium 2.6 x 10⁻¹³ (Brunswick-1, mixed bed resin) 2,2 x 10⁻¹⁵ (FitzPatrick mixed bed resin) 2.5 x 10⁻¹⁵ (Baked FitzPatrick mixed bed resin) 1.3 x 10⁻¹⁰ (Peach Bottom-2 mixed bed resin)
Serne et al. 1995
CRW grouted waste
Plutonium Groundwater (Pu-238) 1.03 x 10⁻¹⁶ (Sample 1-8) 1.18 x 10⁻¹⁶ (Sample 1-13)
Serne et al. 1989a
Grouted AN-106 waste
Americium Groundwater 2.14 x 10⁻¹²
Serne et al. 1995
CRW grouted waste
Americium Groundwater 6.20 x 10⁻¹⁶ (Sample 1-8) 6.20 x 10⁻¹⁶ (Sample 1-13)
Kincaid et al. 1998
Actinium No experimental data. Recommend 5 x 10⁻⁸ conservative estimate based on guidance in Serne et al. 1992.
Kincaid et al. 1998; Buck et al. 1996
Protactinium No experimental data. Recommend 5 x 10⁻⁸ conservative estimate based on guidance in Serne et al. 1992.
Buck et al. 1996
Carbon Tetrachloride
No experimental data. Recommend 5 x 10⁻⁸ conservative estimate based on guidance in Serne et al., 1992. Max: 2 x 10⁻⁶ (Becker et al. 1998); 5 x 10⁻⁹ in saturated saltstone (Kudera and Brown 1996)
Buck et al., 1996
Dichloromethane No experimental data. Recommend 5 x 10⁻⁸ conservative estimate based on guidance in Serne et al., 1992. Max: 2 x 10⁻⁶ (Becker et al. 1998); 5 x 10⁻⁹ in saturated saltstone (Kudera and Brown 1996)
Tetrachloro- ethylene
No experimental data. 5 X 10⁻⁸ conservative estimate based on guidance in Serne et al., 1992. Max: 2 x 10⁻⁶ (Becker et al. 1998); 5 x 10⁻⁹ in saturated saltstone (Kudera and Brown 1996)
1 Values in parentheses () are grout group means (e.g., Blend 19 has three measurements with a mean of 1.10 x 10⁻⁹. This mean was used to calculate statistics in Table 1.1. Where no mean is shown, the individual values were used to calculate statistics in Table 1.1.) .
A.8
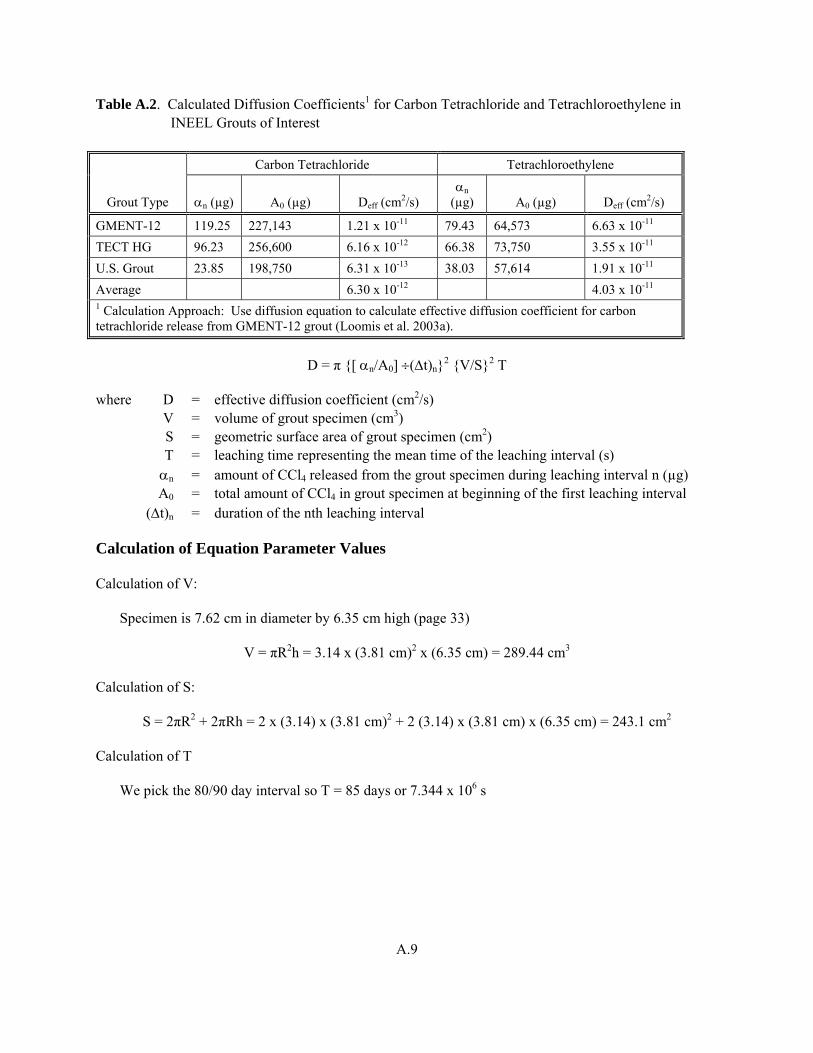
Table A.2. Calculated Diffusion Coefficients1 for Carbon Tetrachloride and Tetrachloroethylene in INEEL Grouts of Interest
Grout Type
Carbon Tetrachloride Tetrachloroethylene
αn (µg) A0 (µg) Deff (cm2/s) αn
(µg) A0 (µg) Deff (cm2/s)
GMENT-12 119.25 227,143 1.21 x 10⁻¹¹ 79.43 64,573 6.63 x 10⁻¹¹
TECT HG 96.23 256,600 6.16 x 10⁻¹² 66.38 73,750 3.55 x 10⁻¹¹ U.S. Grout 23.85 198,750 6.31 x 10⁻¹³ 38.03 57,614 1.91 x 10⁻¹¹
Average 6.30 x 10⁻¹² 4.03 x 10⁻¹¹
1 Calculation Approach: Use diffusion equation to calculate effective diffusion coefficient for carbon tetrachloride release from GMENT-12 grout (Loomis et al. 2003a).
D = π {[ αn/A0] ÷(Δt)n}2 {V/S}2 T
where D = effective diffusion coefficient (cm2/s) V = volume of grout specimen (cm3) S = geometric surface area of grout specimen (cm2) T = leaching time representing the mean time of the leaching interval (s) αn = amount of CCl4 released from the grout specimen during leaching interval n (µg) A0 = total amount of CCl4 in grout specimen at beginning of the first leaching interval (Δt)n = duration of the nth leaching interval
Calculation of Equation Parameter Values
Calculation of V:
Specimen is 7.62 cm in diameter by 6.35 cm high (page 33)
V = πR2h = 3.14 x (3.81 cm)2 x (6.35 cm) = 289.44 cm3
Calculation of S:
S = 2πR2 + 2πRh = 2 x (3.14) x (3.81 cm)2 + 2 (3.14) x (3.81 cm) x (6.35 cm) = 243.1 cm2
Calculation of T
We pick the 80/90 day interval so T = 85 days or 7.344 x 10⁶ s
A.9
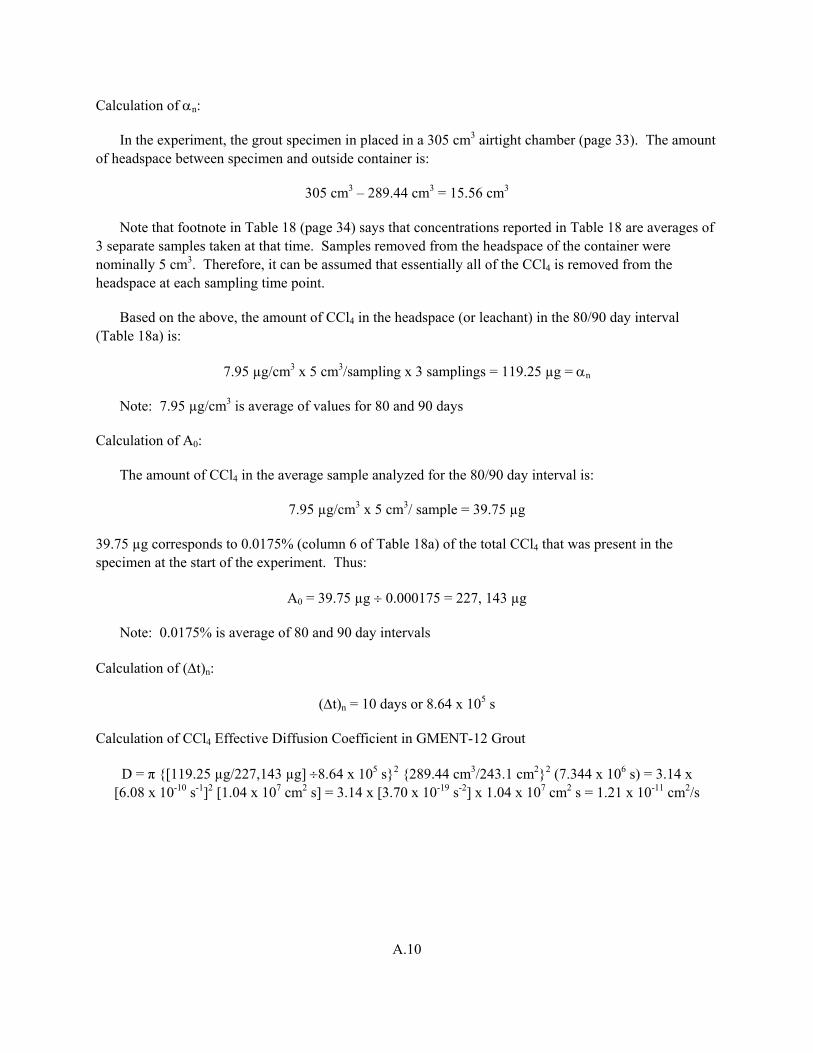
Calculation of αn:
In the experiment, the grout specimen in placed in a 305 cm3 airtight chamber (page 33). The amount of headspace between specimen and outside container is:
305 cm3 – 289.44 cm3 = 15.56 cm3
Note that footnote in Table 18 (page 34) says that concentrations reported in Table 18 are averages of 3 separate samples taken at that time. Samples removed from the headspace of the container were nominally 5 cm3. Therefore, it can be assumed that essentially all of the CCl4 is removed from the headspace at each sampling time point.
Based on the above, the amount of CCl4 in the headspace (or leachant) in the 80/90 day interval (Table 18a) is:
7.95 µg/cm3 x 5 cm3/sampling x 3 samplings = 119.25 µg = αn
Note: 7.95 µg/cm3 is average of values for 80 and 90 days
Calculation of A0:
The amount of CCl4 in the average sample analyzed for the 80/90 day interval is:
7.95 µg/cm3 x 5 cm3/ sample = 39.75 µg
39.75 µg corresponds to 0.0175% (column 6 of Table 18a) of the total CCl4 that was present in the specimen at the start of the experiment. Thus:
A0 = 39.75 µg ÷ 0.000175 = 227, 143 µg
Note: 0.0175% is average of 80 and 90 day intervals
Calculation of (Δt)n:
(Δt)n = 10 days or 8.64 x 10⁵ s
Calculation of CCl4 Effective Diffusion Coefficient in GMENT-12 Grout
D = π {[119.25 µg/227,143 µg] ÷8.64 x 10⁵ s}2 {289.44 cm3/243.1 cm2}2 (7.344 x 10⁶ s) = 3.14 x [6.08 x 10-10 s-1]2 [1.04 x 107 cm2 s] = 3.14 x [3.70 x 10-19 s-2] x 1.04 x 107 cm2 s = 1.21 x 10⁻¹¹ cm2/s
A.10
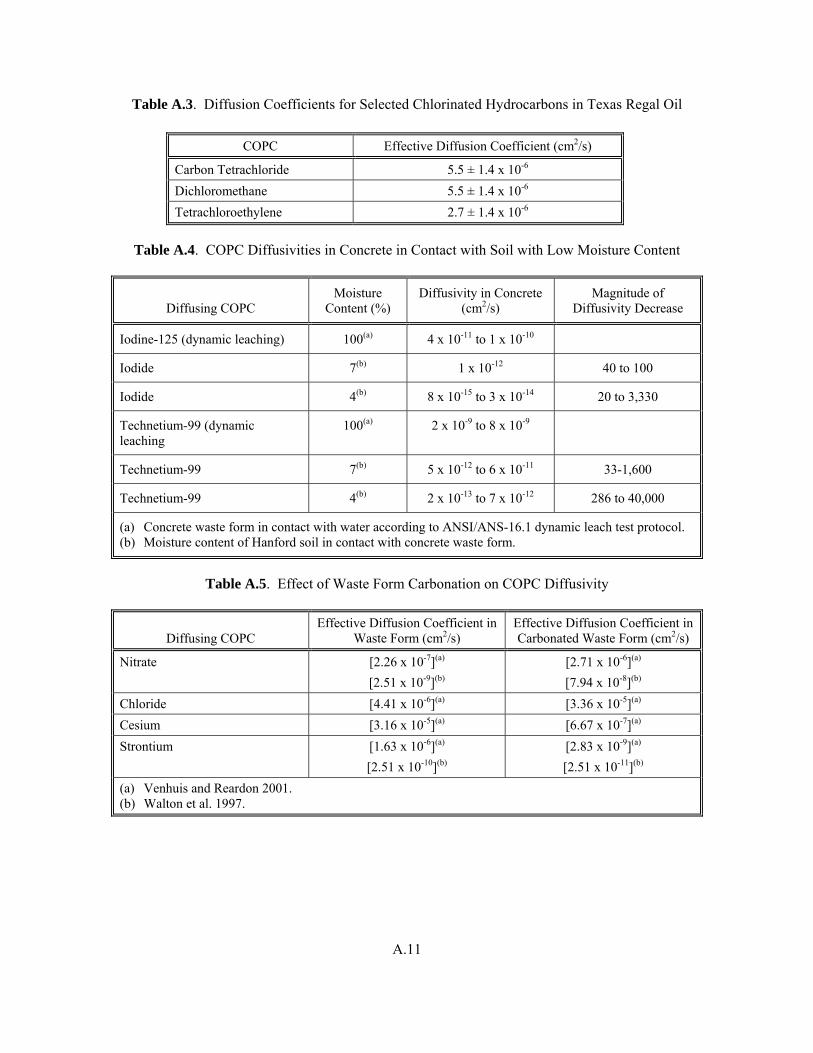
Table A.3. Diffusion Coefficients for Selected Chlorinated Hydrocarbons in Texas Regal Oil
COPC Effective Diffusion Coefficient (cm2/s)
Carbon Tetrachloride 5.5 ± 1.4 x 10⁻⁶
Dichloromethane 5.5 ± 1.4 x 10⁻⁶
Tetrachloroethylene 2.7 ± 1.4 x 10⁻⁶
Table A.4. COPC Diffusivities in Concrete in Contact with Soil with Low Moisture Content
Diffusing COPC Moisture
Content (%) Diffusivity in Concrete
(cm2/s) Magnitude of
Diffusivity Decrease
Iodine-125 (dynamic leaching) 100(a) 4 x 10-11 to 1 x 10⁻¹⁰
Iodide 7(b) 1 x 10-12 40 to 100
Iodide 4(b) 8 x 10-15 to 3 x 10-14 20 to 3,330
Technetium-99 (dynamic leaching
100(a) 2 x 10⁻⁹ to 8 x 10⁻⁹
Technetium-99 7(b) 5 x 10-12 to 6 x 10-11 33-1,600
Technetium-99 4(b) 2 x 10-13 to 7 x 10-12 286 to 40,000
(a) Concrete waste form in contact with water according to ANSI/ANS-16.1 dynamic leach test protocol. (b) Moisture content of Hanford soil in contact with concrete waste form.
Table A.5. Effect of Waste Form Carbonation on COPC Diffusivity
Diffusing COPC Effective Diffusion Coefficient in
Waste Form (cm2/s) Effective Diffusion Coefficient in Carbonated Waste Form (cm2/s)
Nitrate [2.26 x 10⁻⁷](a) [2.51 x 10⁻⁹](b)
[2.71 x 10⁻⁶](a) [7.94 x 10⁻⁸](b)
Chloride [4.41 x 10⁻⁶](a) [3.36 x 10⁻⁵](a)
Cesium [3.16 x 10⁻⁵](a) [6.67 x 10⁻⁷](a)
Strontium [1.63 x 10⁻⁶](a) [2.51 x 10⁻¹⁰](b)
[2.83 x 10⁻⁹](a) [2.51 x 10⁻¹¹](b)
(a) Venhuis and Reardon 2001. (b) Walton et al. 1997.
A.11
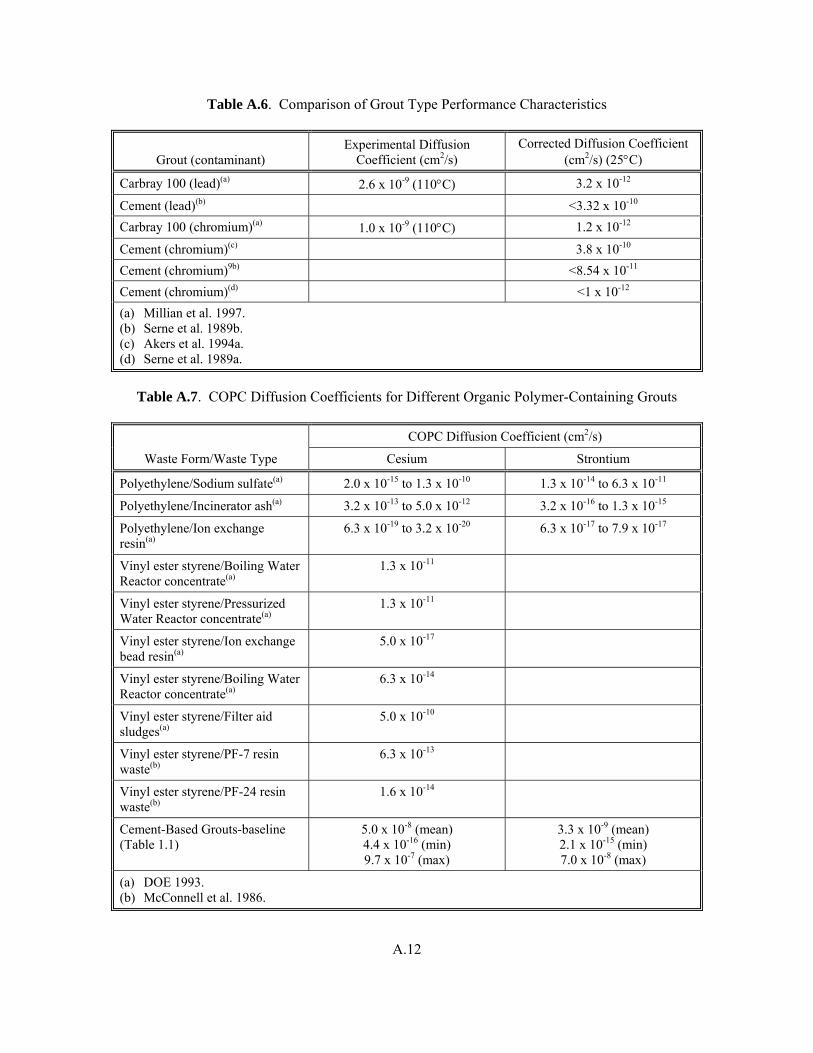
Table A.6. Comparison of Grout Type Performance Characteristics
Grout (contaminant) Experimental Diffusion
Coefficient (cm2/s) Corrected Diffusion Coefficient
(cm2/s) (25°C)
Carbray 100 (lead)(a) 2.6 x 10⁻⁹ (110°C) 3.2 x 10⁻¹²
Cement (lead)(b) <3.32 x 10⁻¹⁰
Carbray 100 (chromium)(a) 1.0 x 10⁻⁹ (110°C) 1.2 x 10⁻¹²
Cement (chromium)(c) 3.8 x 10⁻¹⁰
Cement (chromium)9b) <8.54 x 10⁻¹¹
Cement (chromium)(d) <1 x 10-12
(a) Millian et al. 1997. (b) Serne et al. 1989b. (c) Akers et al. 1994a. (d) Serne et al. 1989a.
Table A.7. COPC Diffusion Coefficients for Different Organic Polymer-Containing Grouts
Waste Form/Waste Type
COPC Diffusion Coefficient (cm2/s)
Cesium Strontium
Polyethylene/Sodium sulfate(a) 2.0 x 10⁻¹⁵ to 1.3 x 10⁻¹⁰ 1.3 x 10⁻¹⁴ to 6.3 x 10⁻¹¹
Polyethylene/Incinerator ash(a) 3.2 x 10⁻¹³ to 5.0 x 10⁻¹² 3.2 x 10⁻¹⁶ to 1.3 x 10⁻¹⁵
Polyethylene/Ion exchange resin(a)
6.3 x 10⁻¹⁹ to 3.2 x 10⁻²⁰ 6.3 x 10⁻¹⁷ to 7.9 x 10⁻¹⁷
Vinyl ester styrene/Boiling Water Reactor concentrate(a)
1.3 x 10⁻¹¹
Vinyl ester styrene/Pressurized Water Reactor concentrate(a)
1.3 x 10⁻¹¹
Vinyl ester styrene/Ion exchange bead resin(a)
5.0 x 10⁻¹⁷
Vinyl ester styrene/Boiling Water Reactor concentrate(a)
6.3 x 10⁻¹⁴
Vinyl ester styrene/Filter aid sludges(a)
5.0 x 10⁻¹⁰
Vinyl ester styrene/PF-7 resin waste(b)
6.3 x 10⁻¹³
Vinyl ester styrene/PF-24 resin waste(b)
1.6 x 10⁻¹⁴
Cement-Based Grouts-baseline (Table 1.1)
5.0 x 10⁻⁸ (mean) 4.4 x 10⁻¹⁶ (min) 9.7 x 10⁻⁷ (max)
3.3 x 10⁻⁹ (mean) 2.1 x 10⁻¹⁵ (min) 7.0 x 10⁻⁸ (max)
(a) DOE 1993. (b) McConnell et al. 1986.
A.12
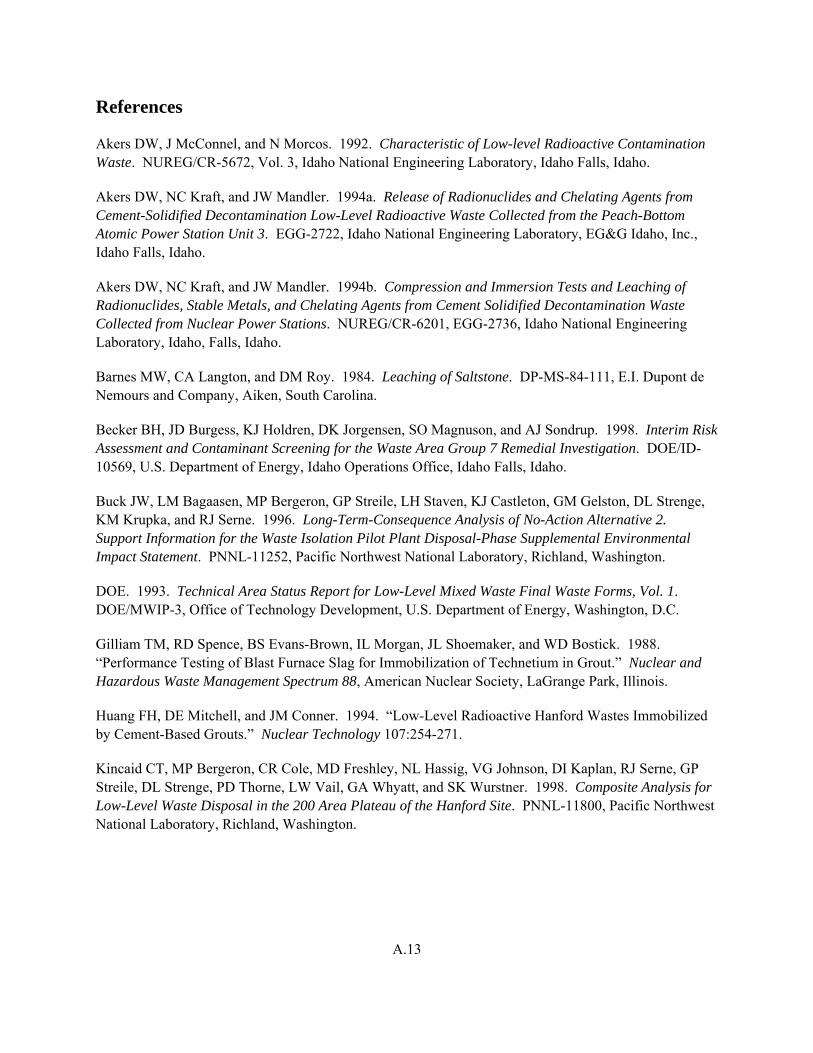
References
Akers DW, J McConnel, and N Morcos. 1992. Characteristic of Low-level Radioactive Contamination Waste. NUREG/CR-5672, Vol. 3, Idaho National Engineering Laboratory, Idaho Falls, Idaho.
Akers DW, NC Kraft, and JW Mandler. 1994a. Release of Radionuclides and Chelating Agents from Cement-Solidified Decontamination Low-Level Radioactive Waste Collected from the Peach-Bottom Atomic Power Station Unit 3. EGG-2722, Idaho National Engineering Laboratory, EG&G Idaho, Inc., Idaho Falls, Idaho.
Akers DW, NC Kraft, and JW Mandler. 1994b. Compression and Immersion Tests and Leaching of Radionuclides, Stable Metals, and Chelating Agents from Cement Solidified Decontamination Waste Collected from Nuclear Power Stations. NUREG/CR-6201, EGG-2736, Idaho National Engineering Laboratory, Idaho, Falls, Idaho.
Barnes MW, CA Langton, and DM Roy. 1984. Leaching of Saltstone. DP-MS-84-111, E.I. Dupont de Nemours and Company, Aiken, South Carolina.
Becker BH, JD Burgess, KJ Holdren, DK Jorgensen, SO Magnuson, and AJ Sondrup. 1998. Interim Risk Assessment and Contaminant Screening for the Waste Area Group 7 Remedial Investigation. DOE/ID-10569, U.S. Department of Energy, Idaho Operations Office, Idaho Falls, Idaho.
Buck JW, LM Bagaasen, MP Bergeron, GP Streile, LH Staven, KJ Castleton, GM Gelston, DL Strenge, KM Krupka, and RJ Serne. 1996. Long-Term-Consequence Analysis of No-Action Alternative 2. Support Information for the Waste Isolation Pilot Plant Disposal-Phase Supplemental Environmental Impact Statement. PNNL-11252, Pacific Northwest National Laboratory, Richland, Washington.
DOE. 1993. Technical Area Status Report for Low-Level Mixed Waste Final Waste Forms, Vol. 1. DOE/MWIP-3, Office of Technology Development, U.S. Department of Energy, Washington, D.C.
Gilliam TM, RD Spence, BS Evans-Brown, IL Morgan, JL Shoemaker, and WD Bostick. 1988. “Performance Testing of Blast Furnace Slag for Immobilization of Technetium in Grout.” Nuclear and Hazardous Waste Management Spectrum 88, American Nuclear Society, LaGrange Park, Illinois.
Huang FH, DE Mitchell, and JM Conner. 1994. “Low-Level Radioactive Hanford Wastes Immobilized by Cement-Based Grouts.” Nuclear Technology 107:254-271.
Kincaid CT, MP Bergeron, CR Cole, MD Freshley, NL Hassig, VG Johnson, DI Kaplan, RJ Serne, GP Streile, DL Strenge, PD Thorne, LW Vail, GA Whyatt, and SK Wurstner. 1998. Composite Analysis for Low-Level Waste Disposal in the 200 Area Plateau of the Hanford Site. PNNL-11800, Pacific Northwest National Laboratory, Richland, Washington.
A.13
Kudera DE and BW Brown. 1996. Volatile Organic Compounds Disposed of from 1952 Through 1983 at the Radioactive Waste Management Complex: Quantities, Forms, Release Mechanisms, and Rates. ER-WAG7-90, Idaho National Engineering and Environmental Laboratory, Lockheed Martin Idaho Technologies Company, Idaho Falls, Idaho.
Lokken RO, LM Bagaasen, RO Mattin, SE Palmer, and CM Anderson. 1993. Characterization Results for 106-AN Grout Produced in a Pilot Scale Test. PNL-8655, Pacific Northwest Laboratory, Richland, Washington.
Martin PFC and RO Lokken. 1992. Characterization of a Low-Level Radioactive Waste Grout: Sampling and Test Results. PNL-8067, Pacific Northwest Laboratory, Richland, Washington.
Martin PFC and RO Lokken. 1993. Characterization of Phosphate/Sulfate Waste Grout Cores. PNL-8620, Pacific Northwest Laboratory, Richland, Washington.
McConnell JW, Jr., RM Nielson, Jr., and RD Rogers. 1986. “Testing Waste Forms Containing High Radionuclide Loadings.” Waste Management ’86, pp. 259-266. Tucson Arizona, March 2-6, 1986.
Millian LW, JH Heiser, JW Adams, and SP Rutenkroeger. 1997. In-Situ Stabilization of TRU/Mixed Waste Project at the INEEL. BNL-64958, Brookhaven National Laboratory, Upton, New York.
Serne RJ, WJ Martin, SB McLaurine, SP Airhart, VL LeGore, and RL Treat. 1987. Laboratory Leach Tests of Phosphate/Sulfate Waste Grout and Leachate Adsorption Tests Using Hanford Sediment. PNL-6019, Pacific Northwest Laboratory, Richland Washington.
Serne RJ, WJ Martin, RO Lokken, VL LeGore, CW Lindenmeier, and PFC Martin. 1989a. Leach and EP Toxicity Tests on Grouted Waste from Tank 106-AN. PNL-6960, Pacific Northwest Laboratory, Richland, Washington.
Serne RJ, WJ Martin, VL LeGore, CW Lindenmeier, SB McLaurine, PFC Martin, and RO Lokken. 1989b. Leach Tests on Grouts Made with Actual and Trace Metal-Spiked Synthetic Phosphate/Sulfate Waste. PNL-7121, Pacific Northwest Laboratory, Richland, Washington.
Serne RJ and MI Wood. 1990. Hanford Waste Form Release and Sediment Interaction: A Status Report with Rationale and Recommendations for Additional Studies. PNL-7297, Pacific Northwest Laboratory, Richland, Washington.
Serne RJ, RO Lokken, and LJ Criscenti. 1992. “Characterization of Grouted Low-Level-Waste to Support Performance Assessment.” Waste Management 12:271-287.
Tallent OK, EW McDaniel, GD Del Cul, KE Dodson, and DR Trotter. 1988. “Immobilization of Technetium and Nitrate in Cement-Based Materials.” Materials Research Society Symposium Proceedings, Vol. 112, Materials Research Society, Pittsburgh, Pennsylvania.
A.14
A.15
Serne RJ, WJ Martin, and VL LeGore. 1995. Hanford Grout Technology Program: Leach Test of Cladding Removal Waste Grout Using Hanford Groundwater. PNL-10745, Pacific Northwest Laboratory, Richland, Washington.
Spence RD and JL Kauschinger. 1997. Grout Performance in Support of In Situ Stabilization/ Solidification of the GAAT Tank Sludges. ORNL/TM-13389, Lockheed Martin Energy Research Corporation, Oak Ridge, Tennessee.
Spence RD. 1998. Effect of Selective Sorptive Agents on Leachability of 137Cs and 90Sr. ORNL/CP-98158, Lockheed Martin Energy Research Corporation, Oak Ridge, Tennessee.
Tallent OK, EW McDaniel, GD Del Cul, KE Dodson, and DR Trotter. 1988. “Immobilization of Technetium and Nitrate in Cement-Based Materials.” Materials Research Symposium Proceedings, Vol. 112:23-32, Materials Research Society.
Venhuis MA and EJ Reardon. 2001. “Vacuum Method for Carbonation of Cementitious Waste Forms.” Environmental Science and Technology 35:4120-4126.
Walton JC, S Bin-Shafique, RW Smith, N Gutierrez, and A Tarquin. 1997. “Role of Carbonation in Transient Leaching of Cementitious Waste Forms.” Environmental Science and Technology 31:2345-2349.
Appendix B
Key Parameter Value Data: Release Model for In Situ Vitrification Treatment of Subsurface Disposal Area Waste
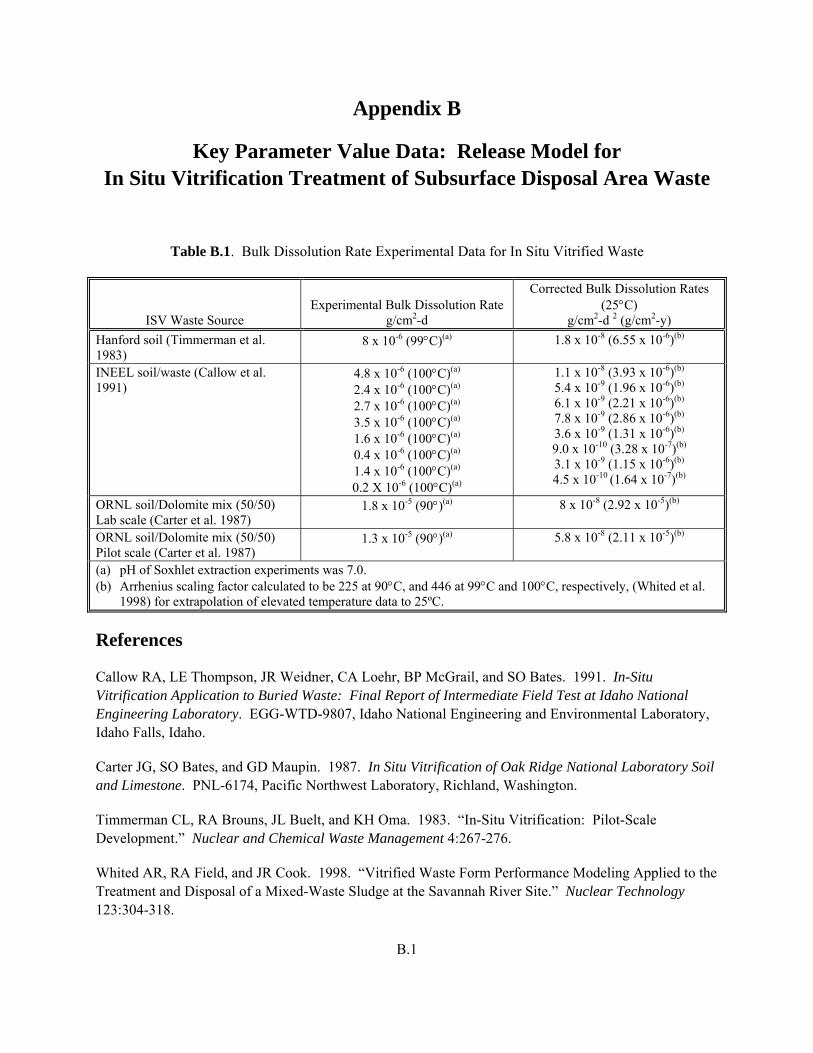
Appendix B
Key Parameter Value Data: Release Model for In Situ Vitrification Treatment of Subsurface Disposal Area Waste
Table B.1. Bulk Dissolution Rate Experimental Data for In Situ Vitrified Waste
ISV Waste Source Experimental Bulk Dissolution Rate
g/cm2-d
Corrected Bulk Dissolution Rates (25°C)
g/cm2-d 2 (g/cm2-y) Hanford soil (Timmerman et al. 1983)
8 x 10⁻⁶ (99°C)(a) 1.8 x 10⁻⁸ (6.55 x 10⁻⁶)(b)
INEEL soil/waste (Callow et al. 1991)
4.8 x 10⁻⁶ (100°C)(a)
2.4 x 10⁻⁶ (100°C)(a)
2.7 x 10⁻⁶ (100°C)(a)
3.5 x 10⁻⁶ (100°C)(a)
1.6 x 10⁻⁶ (100°C)(a)
0.4 x 10⁻⁶ (100°C)(a)
1.4 x 10⁻⁶ (100°C)(a)
0.2 X 10⁻⁶ (100°C)(a)
1.1 x 10⁻⁸ (3.93 x 10⁻⁶)(b) 5.4 x 10⁻⁹ (1.96 x 10⁻⁶)(b) 6.1 x 10⁻⁹ (2.21 x 10⁻⁶)(b) 7.8 x 10⁻⁹ (2.86 x 10⁻⁶)(b) 3.6 x 10⁻⁹ (1.31 x 10⁻⁶)(b) 9.0 x 10⁻¹⁰ (3.28 x 10⁻⁷)(b) 3.1 x 10⁻⁹ (1.15 x 10⁻⁶)(b) 4.5 x 10⁻¹⁰ (1.64 x 10⁻⁷)(b)
ORNL soil/Dolomite mix (50/50) Lab scale (Carter et al. 1987)
1.8 x 10⁻⁵ (90°)(a) 8 x 10⁻⁸ (2.92 x 10⁻⁵)(b)
ORNL soil/Dolomite mix (50/50) Pilot scale (Carter et al. 1987)
1.3 x 10⁻⁵ (90°)(a) 5.8 x 10⁻⁸ (2.11 x 10⁻⁵)(b)
(a) pH of Soxhlet extraction experiments was 7.0. (b) Arrhenius scaling factor calculated to be 225 at 90°C, and 446 at 99°C and 100°C, respectively, (Whited et al. 1998) for extrapolation of elevated temperature data to 25ºC.
References
Callow RA, LE Thompson, JR Weidner, CA Loehr, BP McGrail, and SO Bates. 1991. In-Situ Vitrification Application to Buried Waste: Final Report of Intermediate Field Test at Idaho National Engineering Laboratory. EGG-WTD-9807, Idaho National Engineering and Environmental Laboratory, Idaho Falls, Idaho.
Carter JG, SO Bates, and GD Maupin. 1987. In Situ Vitrification of Oak Ridge National Laboratory Soil and Limestone. PNL-6174, Pacific Northwest Laboratory, Richland, Washington.
Timmerman CL, RA Brouns, JL Buelt, and KH Oma. 1983. “In-Situ Vitrification: Pilot-Scale Development.” Nuclear and Chemical Waste Management 4:267-276.
Whited AR, RA Field, and JR Cook. 1998. “Vitrified Waste Form Performance Modeling Applied to the Treatment and Disposal of a Mixed-Waste Sludge at the Savannah River Site.” Nuclear Technology 123:304-318.
B.1
Appendix C
Key Parameter Value Data: Release Models for Rocky Flats and Other Unconsolidated
Subsurface Disposal Area Waste
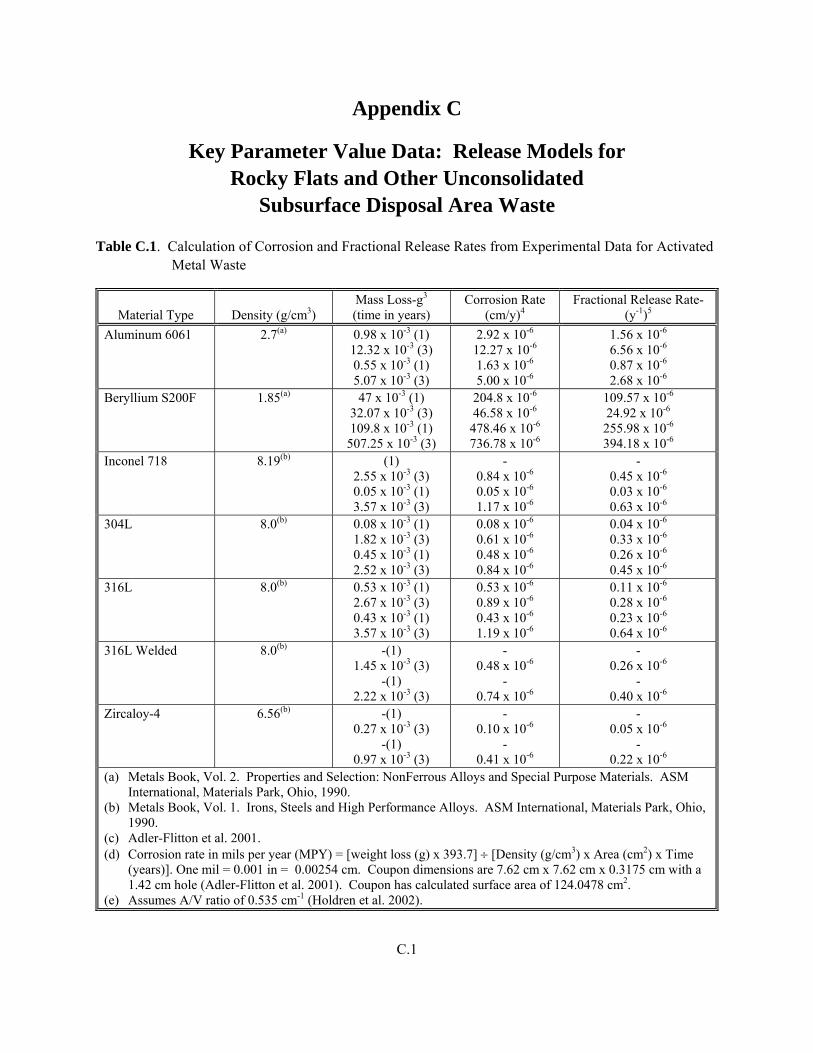
Appendix C
Key Parameter Value Data: Release Models for Rocky Flats and Other Unconsolidated
Subsurface Disposal Area Waste
Table C.1. Calculation of Corrosion and Fractional Release Rates from Experimental Data for Activated Metal Waste
Material Type Density (g/cm3) Mass Loss-g3 (time in years)
Corrosion Rate (cm/y)4
Fractional Release Rate-(y-1)5
Aluminum 6061 2.7(a) 0.98 x 10⁻³ (1) 12.32 x 10⁻³ (3) 0.55 x 10⁻³ (1) 5.07 x 10⁻³ (3)
2.92 x 10⁻⁶ 12.27 x 10⁻⁶ 1.63 x 10⁻⁶ 5.00 x 10⁻⁶
1.56 x 10⁻⁶
6.56 x 10⁻⁶ 0.87 x 10⁻⁶ 2.68 x 10⁻⁶
Beryllium S200F 1.85(a) 47 x 10-3 (1) 32.07 x 10⁻³ (3) 109.8 x 10⁻³ (1)
507.25 x 10⁻³ (3)
204.8 x 10⁻⁶ 46.58 x 10⁻⁶
478.46 x 10⁻⁶ 736.78 x 10⁻⁶
109.57 x 10⁻⁶ 24.92 x 10⁻⁶ 255.98 x 10⁻⁶ 394.18 x 10⁻⁶
Inconel 718 8.19(b) (1) 2.55 x 10⁻³ (3) 0.05 x 10⁻³ (1) 3.57 x 10⁻³ (3)
- 0.84 x 10⁻⁶ 0.05 x 10⁻⁶ 1.17 x 10⁻⁶
- 0.45 x 10⁻⁶ 0.03 x 10⁻⁶ 0.63 x 10⁻⁶
304L 8.0(b) 0.08 x 10⁻³ (1) 1.82 x 10⁻³ (3) 0.45 x 10⁻³ (1) 2.52 x 10⁻³ (3)
0.08 x 10⁻⁶ 0.61 x 10⁻⁶ 0.48 x 10⁻⁶ 0.84 x 10⁻⁶
0.04 x 10⁻⁶ 0.33 x 10⁻⁶ 0.26 x 10⁻⁶ 0.45 x 10⁻⁶
316L 8.0(b) 0.53 x 10⁻³ (1) 2.67 x 10⁻³ (3) 0.43 x 10⁻³ (1) 3.57 x 10⁻³ (3)
0.53 x 10⁻⁶ 0.89 x 10⁻⁶ 0.43 x 10⁻⁶ 1.19 x 10⁻⁶
0.11 x 10⁻⁶ 0.28 x 10⁻⁶ 0.23 x 10⁻⁶ 0.64 x 10⁻⁶
316L Welded 8.0(b) -(1) 1.45 x 10⁻³ (3)
-(1) 2.22 x 10⁻³ (3)
- 0.48 x 10⁻⁶
- 0.74 x 10⁻⁶
- 0.26 x 10⁻⁶
- 0.40 x 10⁻⁶
Zircaloy-4 6.56(b) -(1) 0.27 x 10⁻³ (3)
-(1) 0.97 x 10⁻³ (3)
- 0.10 x 10⁻⁶
- 0.41 x 10⁻⁶
- 0.05 x 10⁻⁶
- 0.22 x 10⁻⁶
(a) Metals Book, Vol. 2. Properties and Selection: NonFerrous Alloys and Special Purpose Materials. ASM International, Materials Park, Ohio, 1990. (b) Metals Book, Vol. 1. Irons, Steels and High Performance Alloys. ASM International, Materials Park, Ohio, 1990. (c) Adler-Flitton et al. 2001. (d) Corrosion rate in mils per year (MPY) = [weight loss (g) x 393.7] ÷ [Density (g/cm3) x Area (cm2) x Time (years)]. One mil = 0.001 in = 0.00254 cm. Coupon dimensions are 7.62 cm x 7.62 cm x 0.3175 cm with a 1.42 cm hole (Adler-Flitton et al. 2001). Coupon has calculated surface area of 124.0478 cm2. (e) Assumes A/V ratio of 0.535 cm-1 (Holdren et al. 2002).
C.1
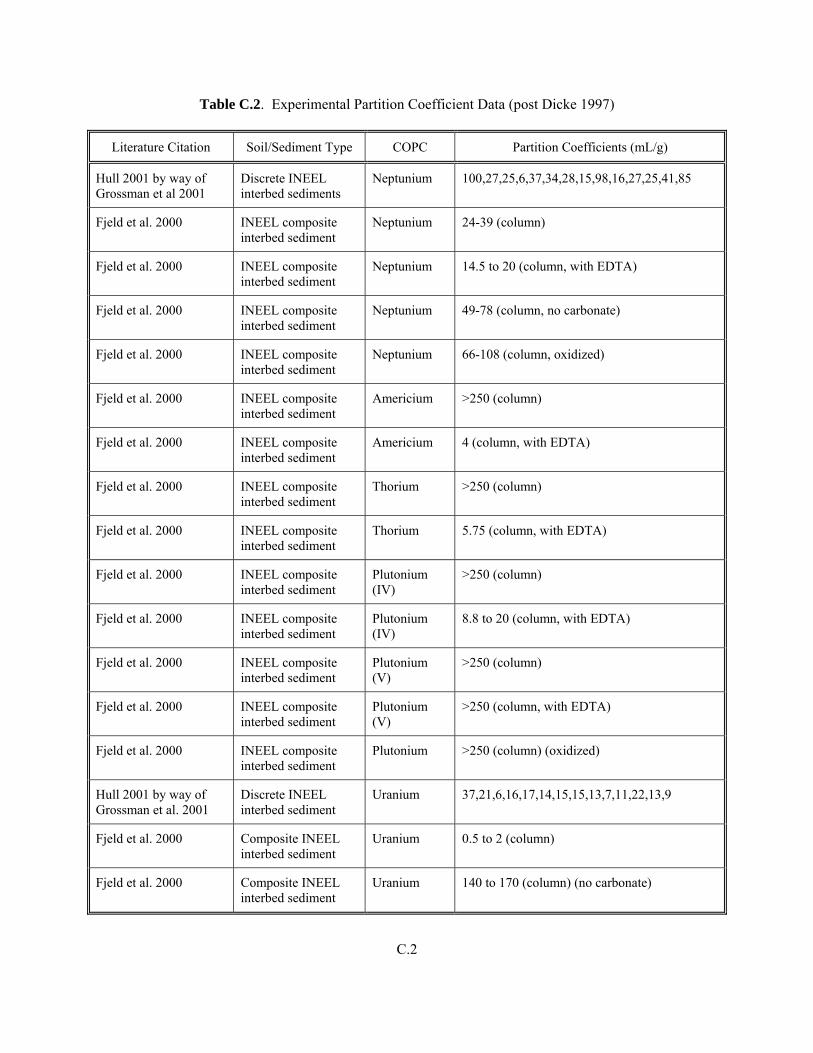
Table C.2. Experimental Partition Coefficient Data (post Dicke 1997)
Literature Citation Soil/Sediment Type COPC Partition Coefficients (mL/g)
Hull 2001 by way of Grossman et al 2001
Discrete INEEL interbed sediments
Neptunium 100,27,25,6,37,34,28,15,98,16,27,25,41,85
Fjeld et al. 2000 INEEL composite interbed sediment
Neptunium 24-39 (column)
Fjeld et al. 2000 INEEL composite interbed sediment
Neptunium 14.5 to 20 (column, with EDTA)
Fjeld et al. 2000 INEEL composite interbed sediment
Neptunium 49-78 (column, no carbonate)
Fjeld et al. 2000 INEEL composite interbed sediment
Neptunium 66-108 (column, oxidized)
Fjeld et al. 2000 INEEL composite interbed sediment
Americium >250 (column)
Fjeld et al. 2000 INEEL composite interbed sediment
Americium 4 (column, with EDTA)
Fjeld et al. 2000 INEEL composite interbed sediment
Thorium >250 (column)
Fjeld et al. 2000 INEEL composite interbed sediment
Thorium 5.75 (column, with EDTA)
Fjeld et al. 2000 INEEL composite interbed sediment
Plutonium (IV)
>250 (column)
Fjeld et al. 2000 INEEL composite interbed sediment
Plutonium (IV)
8.8 to 20 (column, with EDTA)
Fjeld et al. 2000 INEEL composite interbed sediment
Plutonium (V)
>250 (column)
Fjeld et al. 2000 INEEL composite interbed sediment
Plutonium (V)
>250 (column, with EDTA)
Fjeld et al. 2000 INEEL composite interbed sediment
Plutonium >250 (column) (oxidized)
Hull 2001 by way of Grossman et al. 2001
Discrete INEEL interbed sediment
Uranium 37,21,6,16,17,14,15,15,13,7,11,22,13,9
Fjeld et al. 2000 Composite INEEL interbed sediment
Uranium 0.5 to 2 (column)
Fjeld et al. 2000 Composite INEEL interbed sediment
Uranium 140 to 170 (column) (no carbonate)
C.2
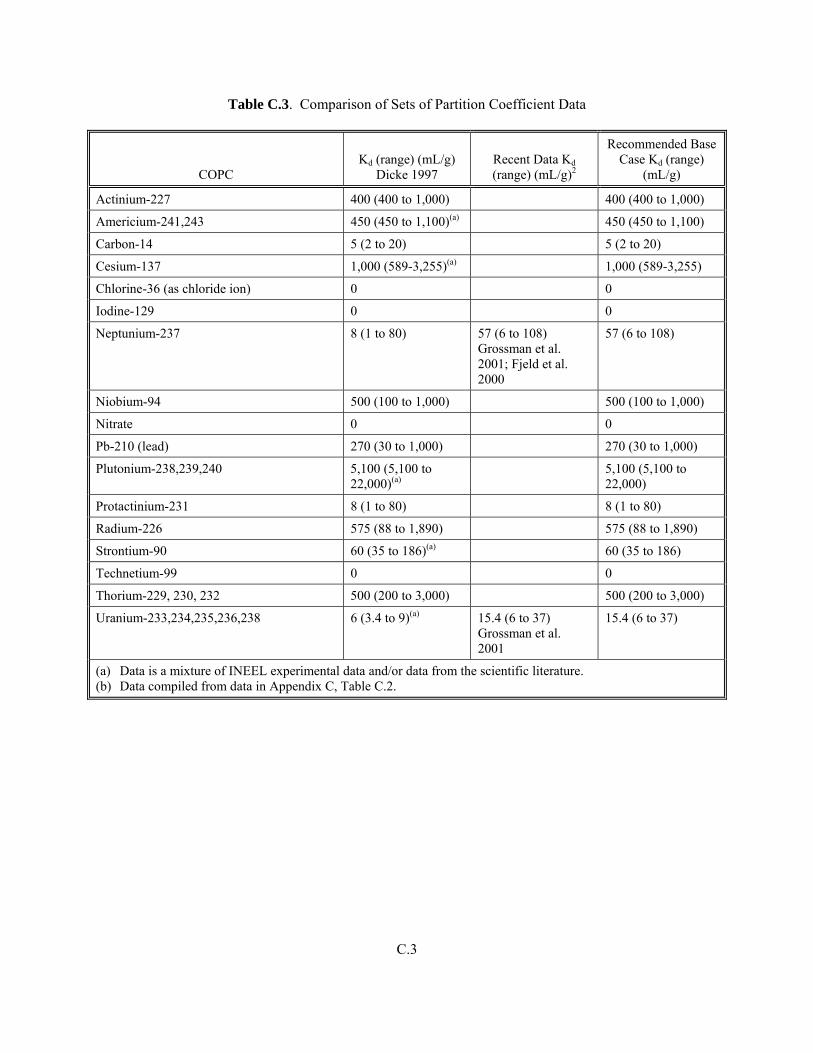
Table C.3. Comparison of Sets of Partition Coefficient Data
COPC Kd (range) (mL/g)
Dicke 1997 Recent Data Kd (range) (mL/g)2
Recommended Base Case Kd (range)
(mL/g)
Actinium-227 400 (400 to 1,000) 400 (400 to 1,000)
Americium-241,243 450 (450 to 1,100)(a) 450 (450 to 1,100)
Carbon-14 5 (2 to 20) 5 (2 to 20)
Cesium-137 1,000 (589-3,255)(a) 1,000 (589-3,255)
Chlorine-36 (as chloride ion) 0 0
Iodine-129 0 0
Neptunium-237 8 (1 to 80) 57 (6 to 108) Grossman et al. 2001; Fjeld et al. 2000
57 (6 to 108)
Niobium-94 500 (100 to 1,000) 500 (100 to 1,000)
Nitrate 0 0
Pb-210 (lead) 270 (30 to 1,000) 270 (30 to 1,000)
Plutonium-238,239,240 5,100 (5,100 to 22,000)(a)
5,100 (5,100 to 22,000)
Protactinium-231 8 (1 to 80) 8 (1 to 80)
Radium-226 575 (88 to 1,890) 575 (88 to 1,890)
Strontium-90 60 (35 to 186)(a) 60 (35 to 186)
Technetium-99 0 0
Thorium-229, 230, 232 500 (200 to 3,000) 500 (200 to 3,000)
Uranium-233,234,235,236,238 6 (3.4 to 9)(a) 15.4 (6 to 37) Grossman et al. 2001
15.4 (6 to 37)
(a) Data is a mixture of INEEL experimental data and/or data from the scientific literature. (b) Data compiled from data in Appendix C, Table C.2.
C.3
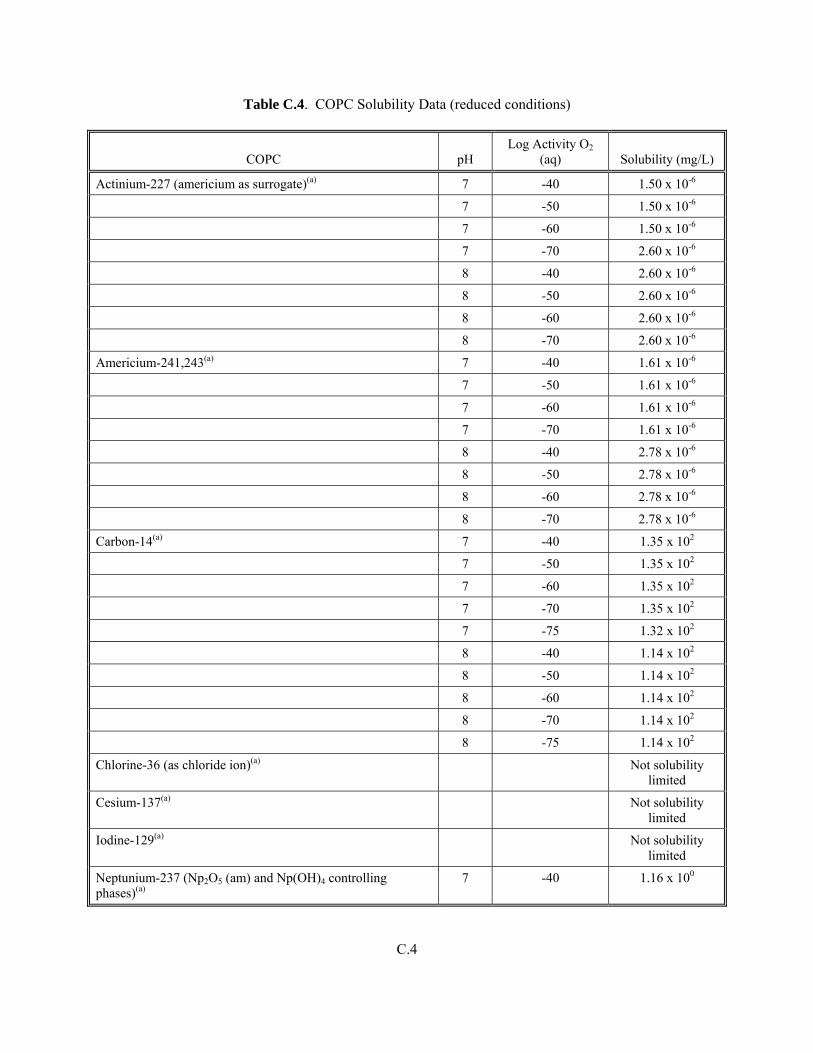
Table C.4. COPC Solubility Data (reduced conditions)
COPC pH Log Activity O2
(aq) Solubility (mg/L)
Actinium-227 (americium as surrogate)(a) 7 -40 1.50 x 10⁻⁶
7 -50 1.50 x 10⁻⁶
7 -60 1.50 x 10⁻⁶
7 -70 2.60 x 10⁻⁶
8 -40 2.60 x 10⁻⁶
8 -50 2.60 x 10⁻⁶
8 -60 2.60 x 10⁻⁶
8 -70 2.60 x 10⁻⁶
Americium-241,243(a) 7 -40 1.61 x 10⁻⁶
7 -50 1.61 x 10⁻⁶
7 -60 1.61 x 10⁻⁶
7 -70 1.61 x 10⁻⁶
8 -40 2.78 x 10⁻⁶
8 -50 2.78 x 10⁻⁶
8 -60 2.78 x 10⁻⁶
8 -70 2.78 x 10⁻⁶
Carbon-14(a) 7 -40 1.35 x 10²
7 -50 1.35 x 10²
7 -60 1.35 x 10²
7 -70 1.35 x 10²
7 -75 1.32 x 10²
8 -40 1.14 x 10²
8 -50 1.14 x 10²
8 -60 1.14 x 10²
8 -70 1.14 x 10²
8 -75 1.14 x 10²
Chlorine-36 (as chloride ion)(a) Not solubility limited
Cesium-137(a) Not solubility limited
Iodine-129(a) Not solubility limited
Neptunium-237 (Np2O5 (am) and Np(OH)4 controlling phases)(a)
7 -40 1.16 x 100
C.4
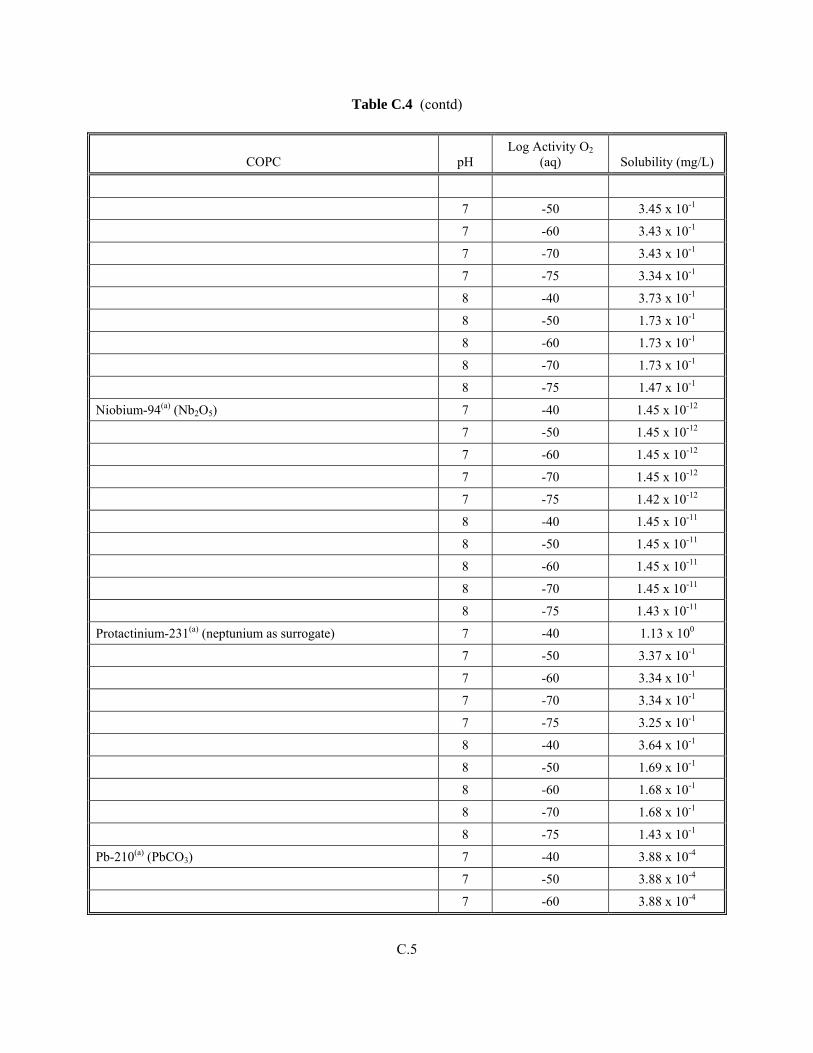
Table C.4 (contd)
COPC pH Log Activity O2
(aq) Solubility (mg/L)
7 -50 3.45 x 10⁻¹ 7 -60 3.43 x 10⁻¹
7 -70 3.43 x 10⁻¹
7 -75 3.34 x 10⁻¹
8 -40 3.73 x 10⁻¹
8 -50 1.73 x 10⁻¹
8 -60 1.73 x 10⁻¹
8 -70 1.73 x 10⁻¹
8 -75 1.47 x 10⁻¹
Niobium-94(a) (Nb2O5) 7 -40 1.45 x 10⁻¹²
7 -50 1.45 x 10⁻¹²
7 -60 1.45 x 10⁻¹²
7 -70 1.45 x 10⁻¹²
7 -75 1.42 x 10⁻¹²
8 -40 1.45 x 10⁻¹¹
8 -50 1.45 x 10⁻¹¹
8 -60 1.45 x 10⁻¹¹
8 -70 1.45 x 10⁻¹¹
8 -75 1.43 x 10⁻¹¹
Protactinium-231(a) (neptunium as surrogate) 7 -40 1.13 x 100
7 -50 3.37 x 10⁻¹
7 -60 3.34 x 10⁻¹
7 -70 3.34 x 10⁻¹
7 -75 3.25 x 10⁻¹
8 -40 3.64 x 10⁻¹
8 -50 1.69 x 10⁻¹
8 -60 1.68 x 10⁻¹
8 -70 1.68 x 10⁻¹
8 -75 1.43 x 10⁻¹
Pb-210(a) (PbCO3) 7 -40 3.88 x 10⁻⁴
7 -50 3.88 x 10⁻⁴
7 -60 3.88 x 10⁻⁴
C.5
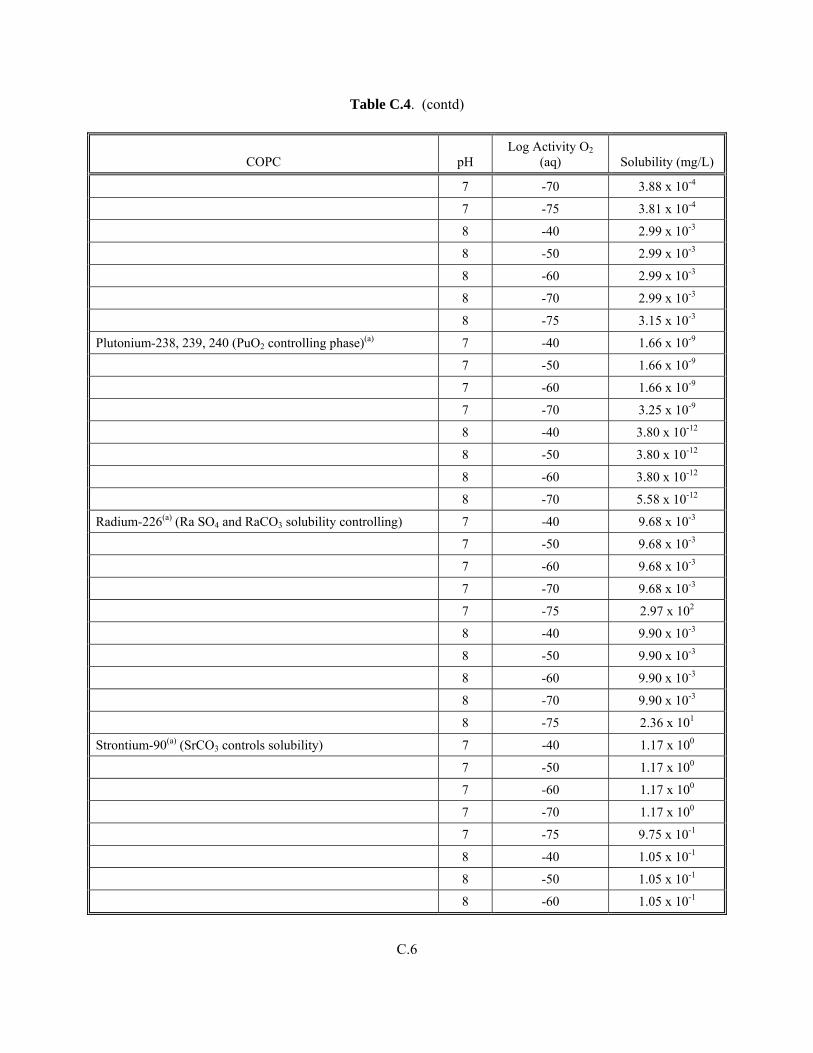
Table C.4. (contd)
COPC pH Log Activity O2
(aq) Solubility (mg/L)
7 -70 3.88 x 10⁻⁴
7 -75 3.81 x 10⁻⁴
8 -40 2.99 x 10⁻³
8 -50 2.99 x 10⁻³
8 -60 2.99 x 10⁻³
8 -70 2.99 x 10⁻³
8 -75 3.15 x 10⁻³
Plutonium-238, 239, 240 (PuO2 controlling phase)(a) 7 -40 1.66 x 10⁻⁹
7 -50 1.66 x 10⁻⁹
7 -60 1.66 x 10⁻⁹
7 -70 3.25 x 10⁻⁹
8 -40 3.80 x 10⁻¹²
8 -50 3.80 x 10⁻¹²
8 -60 3.80 x 10⁻¹²
8 -70 5.58 x 10⁻¹²
Radium-226(a) (Ra SO4 and RaCO3 solubility controlling) 7 -40 9.68 x 10⁻³
7 -50 9.68 x 10⁻³
7 -60 9.68 x 10⁻³
7 -70 9.68 x 10⁻³
7 -75 2.97 x 10²
8 -40 9.90 x 10⁻³
8 -50 9.90 x 10⁻³
8 -60 9.90 x 10⁻³
8 -70 9.90 x 10⁻³
8 -75 2.36 x 101
Strontium-90(a) (SrCO3 controls solubility) 7 -40 1.17 x 100
7 -50 1.17 x 100
7 -60 1.17 x 100
7 -70 1.17 x 100
7 -75 9.75 x 10⁻¹
8 -40 1.05 x 10⁻¹
8 -50 1.05 x 10⁻¹
8 -60 1.05 x 10⁻¹
C.6
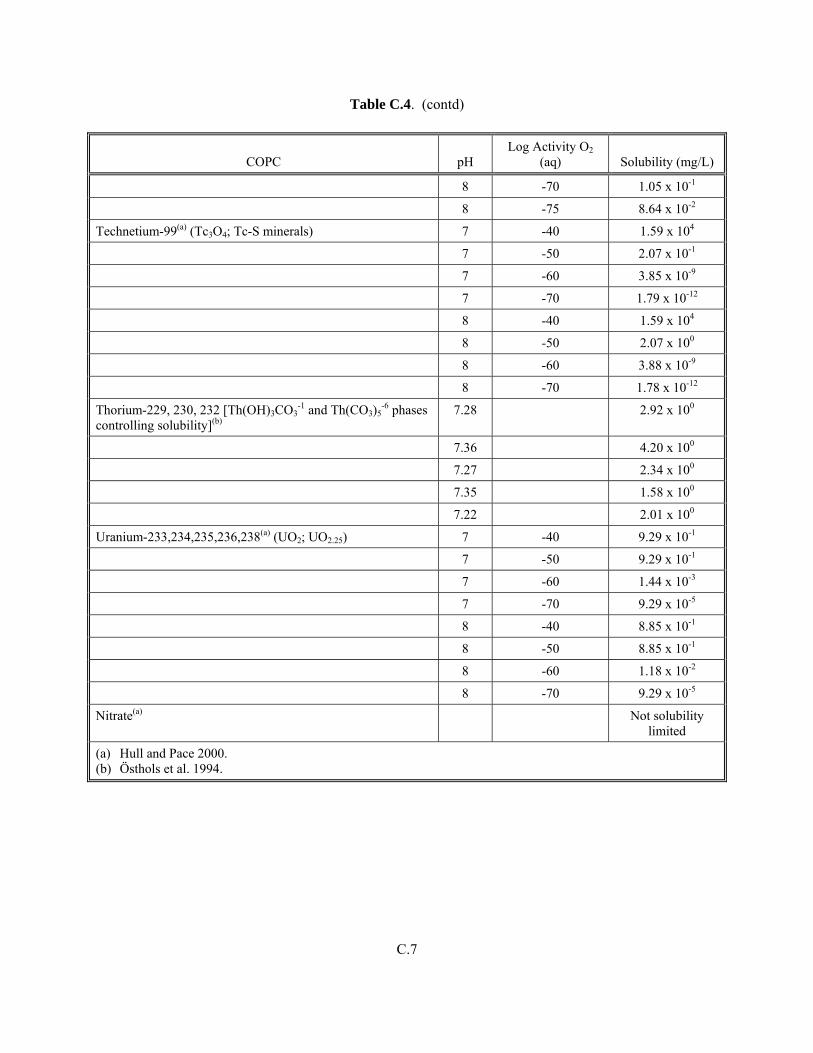
Table C.4. (contd)
COPC pH Log Activity O2
(aq) Solubility (mg/L)
8 -70 1.05 x 10⁻¹
8 -75 8.64 x 10⁻²
Technetium-99(a) (Tc3O4; Tc-S minerals) 7 -40 1.59 x 10⁴
7 -50 2.07 x 10⁻¹
7 -60 3.85 x 10⁻⁹
7 -70 1.79 x 10⁻¹²
8 -40 1.59 x 10⁴
8 -50 2.07 x 100
8 -60 3.88 x 10⁻⁹
8 -70 1.78 x 10⁻¹²
Thorium-229, 230, 232 [Th(OH)3CO3-1 and Th(CO3)5
-6 phases controlling solubility](b)
7.28 2.92 x 100
7.36 4.20 x 100
7.27 2.34 x 100
7.35 1.58 x 100
7.22 2.01 x 100
Uranium-233,234,235,236,238(a) (UO2; UO2.25) 7 -40 9.29 x 10⁻¹
7 -50 9.29 x 10⁻¹
7 -60 1.44 x 10⁻³
7 -70 9.29 x 10⁻⁵
8 -40 8.85 x 10⁻¹
8 -50 8.85 x 10⁻¹
8 -60 1.18 x 10⁻²
8 -70 9.29 x 10⁻⁵
Nitrate(a) Not solubility limited
(a) Hull and Pace 2000. (b) Östhols et al. 1994.
C.7
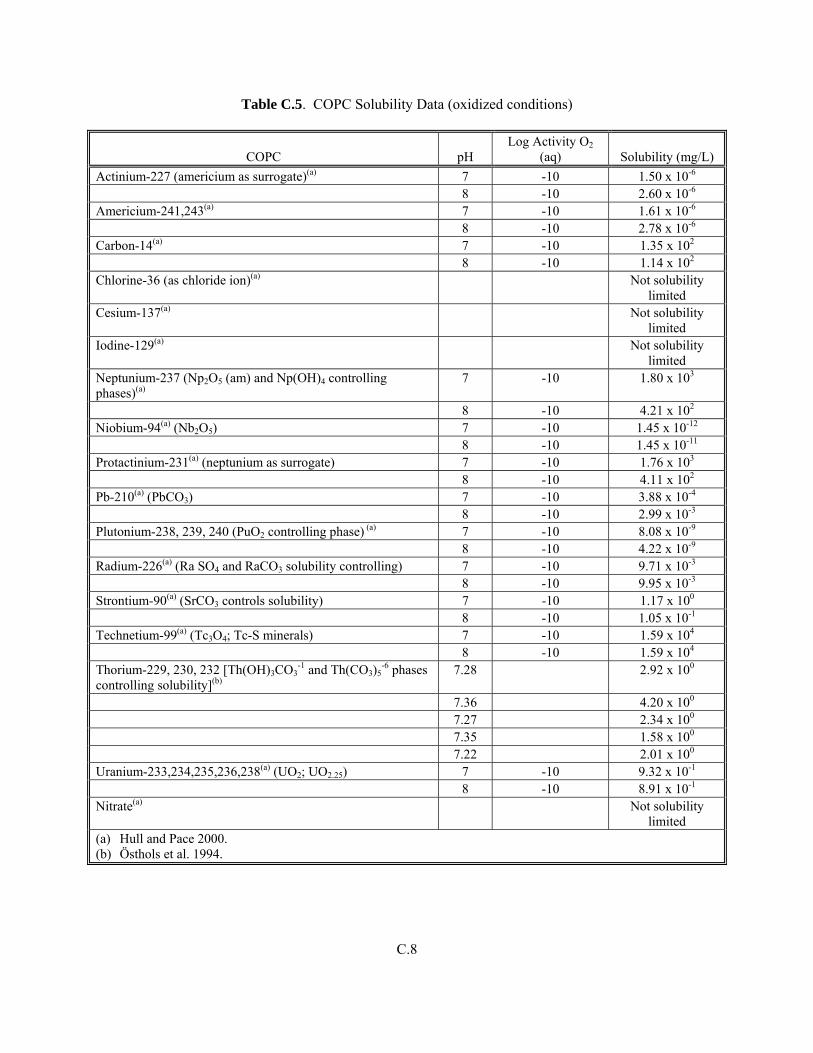
Table C.5. COPC Solubility Data (oxidized conditions)
COPC pH Log Activity O2
(aq) Solubility (mg/L) Actinium-227 (americium as surrogate)(a) 7 -10 1.50 x 10⁻⁶
8 -10 2.60 x 10⁻⁶ Americium-241,243(a)
7 -10 1.61 x 10⁻⁶
8 -10 2.78 x 10⁻⁶ Carbon-14(a) 7 -10 1.35 x 10²
8 -10 1.14 x 10² Chlorine-36 (as chloride ion)(a) Not solubility
limited Cesium-137(a) Not solubility
limited Iodine-129(a) Not solubility
limited Neptunium-237 (Np2O5 (am) and Np(OH)4 controlling phases)(a)
7 -10 1.80 x 10³
8 -10 4.21 x 10² Niobium-94(a) (Nb2O5) 7 -10 1.45 x 10⁻¹²
8 -10 1.45 x 10⁻¹¹ Protactinium-231(a) (neptunium as surrogate) 7 -10 1.76 x 10³
8 -10 4.11 x 10² Pb-210(a) (PbCO3) 7 -10 3.88 x 10⁻⁴
8 -10 2.99 x 10⁻³ Plutonium-238, 239, 240 (PuO2 controlling phase) (a) 7 -10 8.08 x 10⁻⁹
8 -10 4.22 x 10⁻⁹ Radium-226(a) (Ra SO4 and RaCO3 solubility controlling) 7 -10 9.71 x 10⁻³
8 -10 9.95 x 10⁻³ Strontium-90(a) (SrCO3 controls solubility) 7 -10 1.17 x 100
8 -10 1.05 x 10⁻¹ Technetium-99(a) (Tc3O4; Tc-S minerals) 7 -10 1.59 x 10⁴
8 -10 1.59 x 10⁴ Thorium-229, 230, 232 [Th(OH)3CO3
-1 and Th(CO3)5-6 phases
controlling solubility](b) 7.28 2.92 x 100
7.36 4.20 x 100 7.27 2.34 x 100
7.35 1.58 x 100 7.22 2.01 x 100
Uranium-233,234,235,236,238(a) (UO2; UO2.25) 7 -10 9.32 x 10⁻¹
8 -10 8.91 x 10⁻¹ Nitrate(a) Not solubility
limited (a) Hull and Pace 2000. (b) Östhols et al. 1994.
C.8
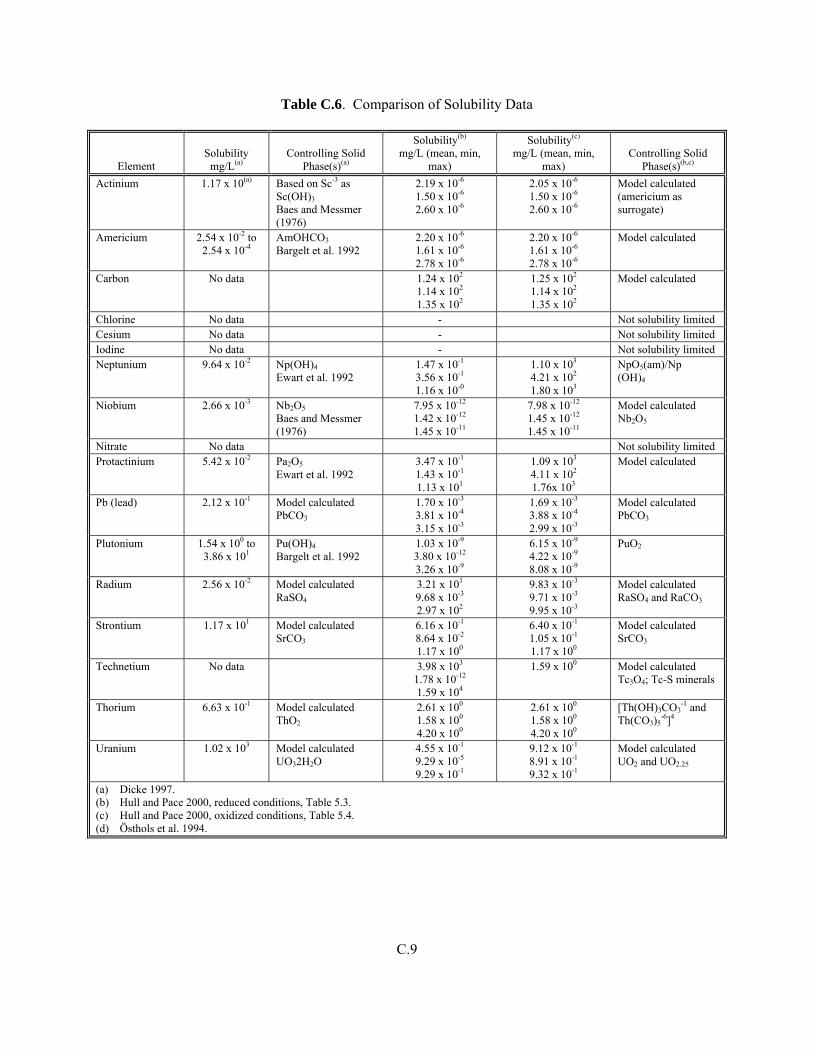
Table C.6. Comparison of Solubility Data
Element Solubility
mg/L(a) Controlling Solid
Phase(s)(a)
Solubility(b)
mg/L (mean, min, max)
Solubility(c)
mg/L (mean, min, max)
Controlling Solid Phase(s)(b,c)
Actinium 1.17 x 10(a) Based on Sc-3 as Sc(OH)3 Baes and Messmer (1976)
2.19 x 10⁻⁶ 1.50 x 10⁻⁶ 2.60 x 10⁻⁶
2.05 x 10⁻⁶ 1.50 x 10⁻⁶ 2.60 x 10⁻⁶
Model calculated (americium as surrogate)
Americium 2.54 x 10⁻² to 2.54 x 10⁻⁴
AmOHCO3 Bargelt et al. 1992
2.20 x 10⁻⁶ 1.61 x 10⁻⁶ 2.78 x 10⁻⁶
2.20 x 10⁻⁶ 1.61 x 10⁻⁶ 2.78 x 10⁻⁶
Model calculated
Carbon No data 1.24 x 10² 1.14 x 10² 1.35 x 10²
1.25 x 10² 1.14 x 10² 1.35 x 10²
Model calculated
Chlorine No data - Not solubility limited Cesium No data - Not solubility limited Iodine No data - Not solubility limited Neptunium 9.64 x 10⁻² Np(OH)4
Ewart et al. 1992 1.47 x 10⁻¹ 3.56 x 10⁻¹ 1.16 x 10-0
1.10 x 10³ 4.21 x 10² 1.80 x 10³
NpO5(am)/Np (OH)4
Niobium 2.66 x 10⁻³ Nb2O5 Baes and Messmer (1976)
7.95 x 10⁻¹² 1.42 x 10⁻¹² 1.45 x 10⁻¹¹
7.98 x 10⁻¹² 1.45 x 10⁻¹² 1.45 x 10⁻¹¹
Model calculated Nb2O5
Nitrate No data Not solubility limited Protactinium 5.42 x 10⁻² Pa2O5
Ewart et al. 1992 3.47 x 10⁻¹ 1.43 x 10⁻¹ 1.13 x 101
1.09 x 10³ 4.11 x 10² 1.76x 10³
Model calculated
Pb (lead) 2.12 x 10⁻¹ Model calculated PbCO3
1.70 x 10⁻³ 3.81 x 10⁻⁴ 3.15 x 10⁻³
1.69 x 10⁻³ 3.88 x 10⁻⁴ 2.99 x 10⁻³
Model calculated PbCO3
Plutonium 1.54 x 100 to 3.86 x 101
Pu(OH)4 Bargelt et al. 1992
1.03 x 10⁻⁹ 3.80 x 10⁻¹² 3.26 x 10⁻⁹
6.15 x 10⁻⁹ 4.22 x 10⁻⁹ 8.08 x 10⁻⁹
PuO2
Radium 2.56 x 10⁻² Model calculated RaSO4
3.21 x 101 9.68 x 10⁻³ 2.97 x 10²
9.83 x 10⁻³ 9.71 x 10⁻³ 9.95 x 10⁻³
Model calculated RaSO4 and RaCO3
Strontium 1.17 x 101 Model calculated SrCO3
6.16 x 10⁻¹ 8.64 x 10⁻² 1.17 x 100
6.40 x 10⁻¹ 1.05 x 10⁻¹ 1.17 x 100
Model calculated SrCO3
Technetium No data 3.98 x 10³ 1.78 x 10⁻¹² 1.59 x 10⁴
1.59 x 100 Model calculated Tc3O4; Tc-S minerals
Thorium 6.63 x 10⁻¹ Model calculated ThO2
2.61 x 100 1.58 x 100 4.20 x 100
2.61 x 100 1.58 x 100 4.20 x 100
[Th(OH)3CO3-1 and
Th(CO3)5-6]4
Uranium 1.02 x 10³ Model calculated UO32H2O
4.55 x 10⁻¹ 9.29 x 10⁻⁵ 9.29 x 10⁻¹
9.12 x 10⁻¹ 8.91 x 10⁻¹ 9.32 x 10⁻¹
Model calculated UO2 and UO2.25
(a) Dicke 1997. (b) Hull and Pace 2000, reduced conditions, Table 5.3. (c) Hull and Pace 2000, oxidized conditions, Table 5.4. (d) Östhols et al. 1994.
C.9
C.10
References Adler-Flitton MK May, CW Bishop, RE Mizia, LL Torres, and RD Rogers. 2001. Long-Term Corrosion/Degradation Test Third-Year Results. INEEL/EXT-01-00036, Rev. 0, Idaho National Engineering and Environmental Laboratory, Bechtel BWXT Idaho, LLC, Idaho Falls, Idaho.
Baes CF, Jr. and RE Messmer. 1976. “The Hydrolysis of Cations.” John Wiley and Sons, New York, 489p.
Bargelt RJ, CA Dicke, JM Hubbel, M Paarman, D Ryan, RW Smith, and TR Wood. 1992. Summary of RWMC Investigations Report. EGG-WM-9708, Rev. 0, EG&G Idaho Inc., Idaho Falls, Idaho.
Dicke CA. 1997. Distribution Coefficients and Contaminant Solubilities for the Waste Area Group 7 Baseline Risk Assessment. INEL/EXT-97-00201, Lockheed Martin Idaho Technologies Company, Idaho Falls, Idaho.
Ewart FT, HP Smith-Briggs, HP Thomason, and SJ Williams. 1992. “The Solubility of Actinides in a Cementitious Near-Field Environment.” Waste Management 12:241-252.
Fjeld RJ, JT Coats, and AW Elzerman. 2000. Final Report: Column Tests to Study the Transport of Plutonium and Other Radionuclides in Sedimentary Interbed at INEEL. INEEL/EXT-01-00763, Rev. 0, Idaho National Engineering and Environmental Laboratory, Idaho Falls, Idaho.
Grossman CJ, RA Fjeld, JT Coats, and AW Elzerman. 2001. The Sorption of Selected Radionuclides in Sedimentary Interbed Soils from the Snake River Plain. INEEL/EXT-01-01106, Rev. 0, Idaho National Engineering and Environmental Laboratory, Idaho Falls, Idaho.
Holdren KJ, BH Becker, NL Hampton, LD Koeppen, SO Magnuson, TJ Meyer, GL Olsen, and AJ Sondrup. 2002. Ancillary Basis for Risk Analysis of the Subsurface Disposal Area. INEEL/EXT-02-01125, Idaho National Engineering and Environmental Laboratory, Bechtel BWXT Idaho, LLC, Idaho Falls, Idaho.
Hull L and MN Pace. 2000. Solubility Calculations for Contaminants of Potential Concern. OU7-13/14. INEEL/EXT-2000-00465, Rev. 0, Bechtel BWXT Idaho, LLC, Idaho Falls, Idaho.
Hull L. 2001. Interoffice Memorandum to Theodore J. Meyer, Doug Burns, Swen Magnuson, and James McCarthy. Approach to Simulation of Actinides for the OU7-13/14 Baseline Risk Assessment. Idaho National Engineering and Environmental Laboratory, Bechtel BWXT Idaho, LLC, Idaho Falls, Idaho, LCH-04-01, April 4, 2001.
Östhols E, J Bruno, and I Grenthe. 1994. “On the Influence of Carbonate on Mineral Dissolution: III. The Solubility of Microcrystalline ThO2 in CO2-H2O Media.” Geochimica Cosmochimica Acta 58:613-623.
Appendix D
Support Data for In Situ Grouting Sensitivity Case Structure Process
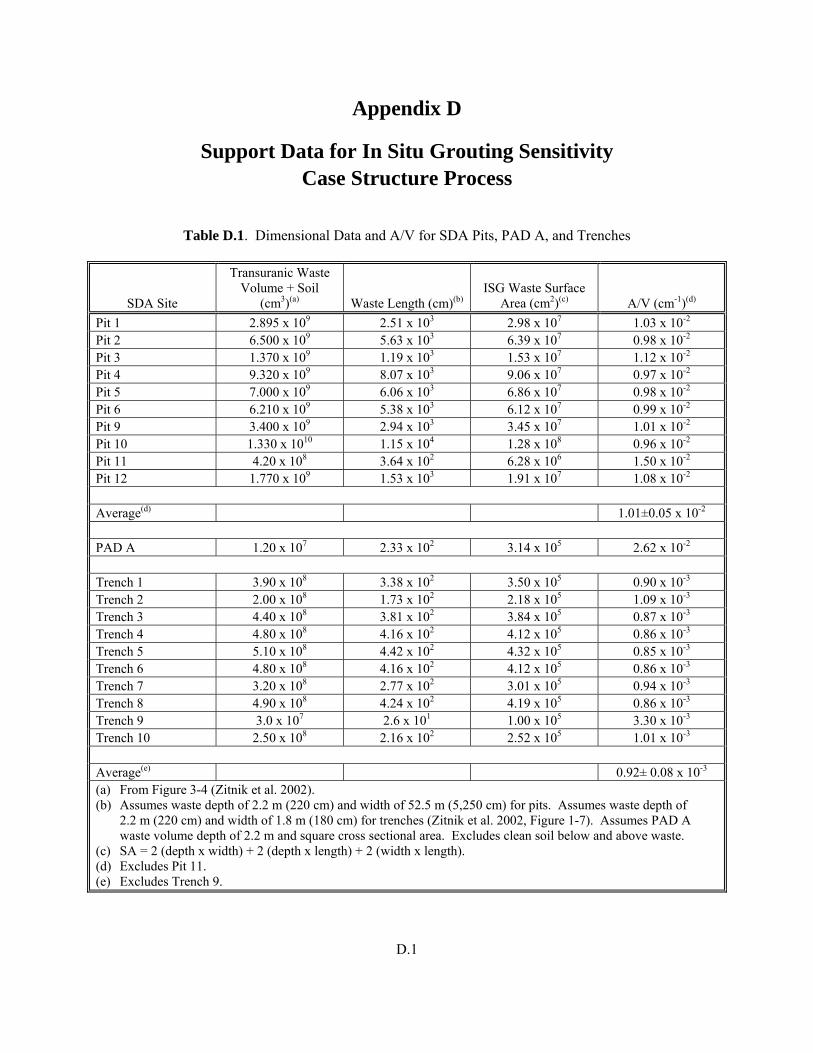
Appendix D
Support Data for In Situ Grouting Sensitivity Case Structure Process
Table D.1. Dimensional Data and A/V for SDA Pits, PAD A, and Trenches
SDA Site
Transuranic Waste Volume + Soil
(cm3)(a) Waste Length (cm)(b) ISG Waste Surface
Area (cm2)(c) A/V (cm-1)(d)
Pit 1 2.895 x 10⁹ 2.51 x 10³ 2.98 x 10⁷ 1.03 x 10⁻²
Pit 2 6.500 x 10⁹ 5.63 x 10³ 6.39 x 10⁷ 0.98 x 10⁻²
Pit 3 1.370 x 10⁹ 1.19 x 10³ 1.53 x 10⁷ 1.12 x 10⁻²
Pit 4 9.320 x 10⁹ 8.07 x 10³ 9.06 x 10⁷ 0.97 x 10⁻²
Pit 5 7.000 x 10⁹ 6.06 x 10³ 6.86 x 10⁷ 0.98 x 10⁻²
Pit 6 6.210 x 10⁹ 5.38 x 10³ 6.12 x 10⁷ 0.99 x 10⁻²
Pit 9 3.400 x 10⁹ 2.94 x 10³ 3.45 x 10⁷ 1.01 x 10⁻²
Pit 10 1.330 x 10¹⁰ 1.15 x 10⁴ 1.28 x 10⁸ 0.96 x 10⁻²
Pit 11 4.20 x 10⁸ 3.64 x 10² 6.28 x 10⁶ 1.50 x 10⁻²
Pit 12 1.770 x 10⁹ 1.53 x 10³ 1.91 x 10⁷ 1.08 x 10⁻²
Average(d) 1.01±0.05 x 10⁻²
PAD A 1.20 x 10⁷ 2.33 x 10² 3.14 x 10⁵ 2.62 x 10⁻²
Trench 1 3.90 x 10⁸ 3.38 x 10² 3.50 x 10⁵ 0.90 x 10⁻³
Trench 2 2.00 x 10⁸ 1.73 x 10² 2.18 x 10⁵ 1.09 x 10⁻³
Trench 3 4.40 x 10⁸ 3.81 x 10² 3.84 x 10⁵ 0.87 x 10⁻³
Trench 4 4.80 x 10⁸ 4.16 x 10² 4.12 x 10⁵ 0.86 x 10⁻³
Trench 5 5.10 x 10⁸ 4.42 x 10² 4.32 x 10⁵ 0.85 x 10⁻³
Trench 6 4.80 x 10⁸ 4.16 x 10² 4.12 x 10⁵ 0.86 x 10⁻³
Trench 7 3.20 x 10⁸ 2.77 x 10² 3.01 x 10⁵ 0.94 x 10⁻³
Trench 8 4.90 x 10⁸ 4.24 x 10² 4.19 x 10⁵ 0.86 x 10⁻³
Trench 9 3.0 x 10⁷ 2.6 x 101 1.00 x 10⁵ 3.30 x 10⁻³
Trench 10 2.50 x 10⁸ 2.16 x 10² 2.52 x 10⁵ 1.01 x 10⁻³
Average(e) 0.92± 0.08 x 10⁻³
(a) From Figure 3-4 (Zitnik et al. 2002). (b) Assumes waste depth of 2.2 m (220 cm) and width of 52.5 m (5,250 cm) for pits. Assumes waste depth of 2.2 m (220 cm) and width of 1.8 m (180 cm) for trenches (Zitnik et al. 2002, Figure 1-7). Assumes PAD A waste volume depth of 2.2 m and square cross sectional area. Excludes clean soil below and above waste. (c) SA = 2 (depth x width) + 2 (depth x length) + 2 (width x length). (d) Excludes Pit 11. (e) Excludes Trench 9.
D.1
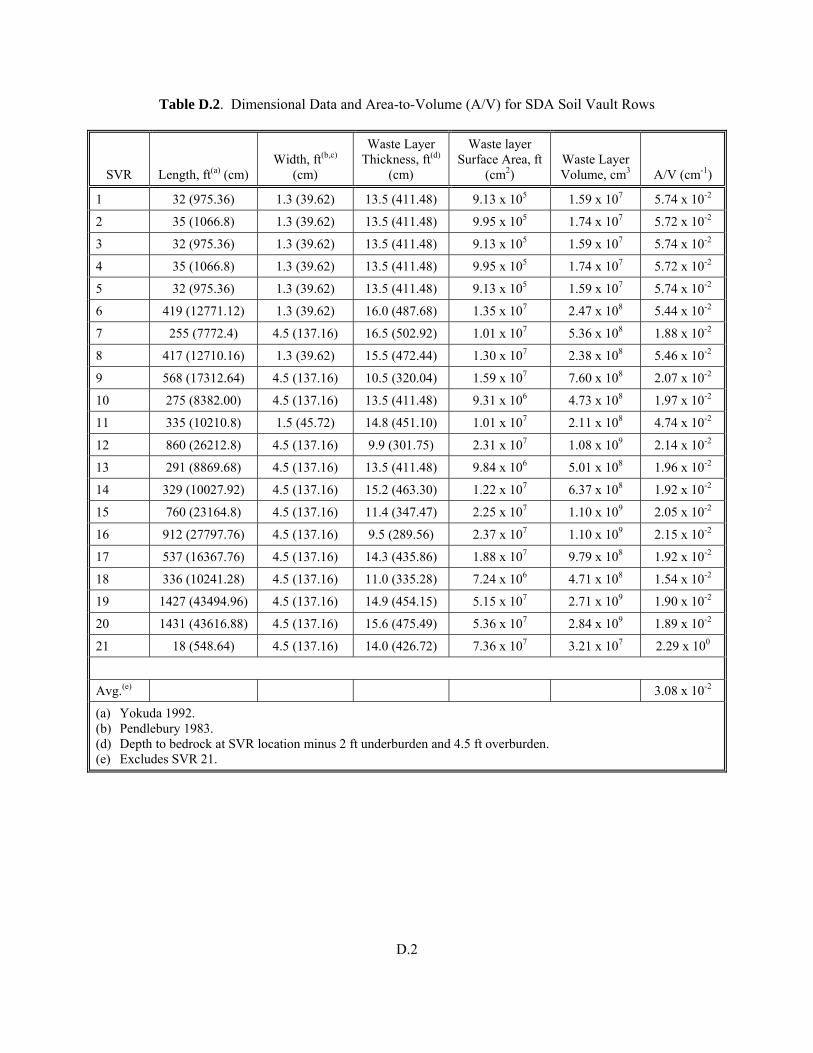
Table D.2. Dimensional Data and Area-to-Volume (A/V) for SDA Soil Vault Rows
SVR Length, ft(a) (cm) Width, ft(b,c)
(cm)
Waste Layer Thickness, ft(d)
(cm)
Waste layer Surface Area, ft
(cm2) Waste Layer Volume, cm3 A/V (cm-1)
1 32 (975.36) 1.3 (39.62) 13.5 (411.48) 9.13 x 10⁵ 1.59 x 10⁷ 5.74 x 10⁻²
2 35 (1066.8) 1.3 (39.62) 13.5 (411.48) 9.95 x 10⁵ 1.74 x 10⁷ 5.72 x 10⁻²
3 32 (975.36) 1.3 (39.62) 13.5 (411.48) 9.13 x 10⁵ 1.59 x 10⁷ 5.74 x 10⁻²
4 35 (1066.8) 1.3 (39.62) 13.5 (411.48) 9.95 x 10⁵ 1.74 x 10⁷ 5.72 x 10⁻²
5 32 (975.36) 1.3 (39.62) 13.5 (411.48) 9.13 x 10⁵ 1.59 x 10⁷ 5.74 x 10⁻²
6 419 (12771.12) 1.3 (39.62) 16.0 (487.68) 1.35 x 10⁷ 2.47 x 10⁸ 5.44 x 10⁻²
7 255 (7772.4) 4.5 (137.16) 16.5 (502.92) 1.01 x 10⁷ 5.36 x 10⁸ 1.88 x 10⁻²
8 417 (12710.16) 1.3 (39.62) 15.5 (472.44) 1.30 x 10⁷ 2.38 x 10⁸ 5.46 x 10⁻²
9 568 (17312.64) 4.5 (137.16) 10.5 (320.04) 1.59 x 10⁷ 7.60 x 10⁸ 2.07 x 10⁻²
10 275 (8382.00) 4.5 (137.16) 13.5 (411.48) 9.31 x 10⁶ 4.73 x 10⁸ 1.97 x 10⁻²
11 335 (10210.8) 1.5 (45.72) 14.8 (451.10) 1.01 x 10⁷ 2.11 x 10⁸ 4.74 x 10⁻²
12 860 (26212.8) 4.5 (137.16) 9.9 (301.75) 2.31 x 10⁷ 1.08 x 10⁹ 2.14 x 10⁻²
13 291 (8869.68) 4.5 (137.16) 13.5 (411.48) 9.84 x 10⁶ 5.01 x 10⁸ 1.96 x 10⁻²
14 329 (10027.92) 4.5 (137.16) 15.2 (463.30) 1.22 x 10⁷ 6.37 x 10⁸ 1.92 x 10⁻²
15 760 (23164.8) 4.5 (137.16) 11.4 (347.47) 2.25 x 10⁷ 1.10 x 10⁹ 2.05 x 10⁻²
16 912 (27797.76) 4.5 (137.16) 9.5 (289.56) 2.37 x 10⁷ 1.10 x 10⁹ 2.15 x 10⁻²
17 537 (16367.76) 4.5 (137.16) 14.3 (435.86) 1.88 x 10⁷ 9.79 x 10⁸ 1.92 x 10⁻²
18 336 (10241.28) 4.5 (137.16) 11.0 (335.28) 7.24 x 10⁶ 4.71 x 10⁸ 1.54 x 10⁻²
19 1427 (43494.96) 4.5 (137.16) 14.9 (454.15) 5.15 x 10⁷ 2.71 x 10⁹ 1.90 x 10⁻²
20 1431 (43616.88) 4.5 (137.16) 15.6 (475.49) 5.36 x 10⁷ 2.84 x 10⁹ 1.89 x 10⁻²
21 18 (548.64) 4.5 (137.16) 14.0 (426.72) 7.36 x 10⁷ 3.21 x 10⁷ 2.29 x 100
Avg.(e) 3.08 x 10⁻²
(a) Yokuda 1992. (b) Pendlebury 1983. (d) Depth to bedrock at SVR location minus 2 ft underburden and 4.5 ft overburden. (e) Excludes SVR 21.
D.2
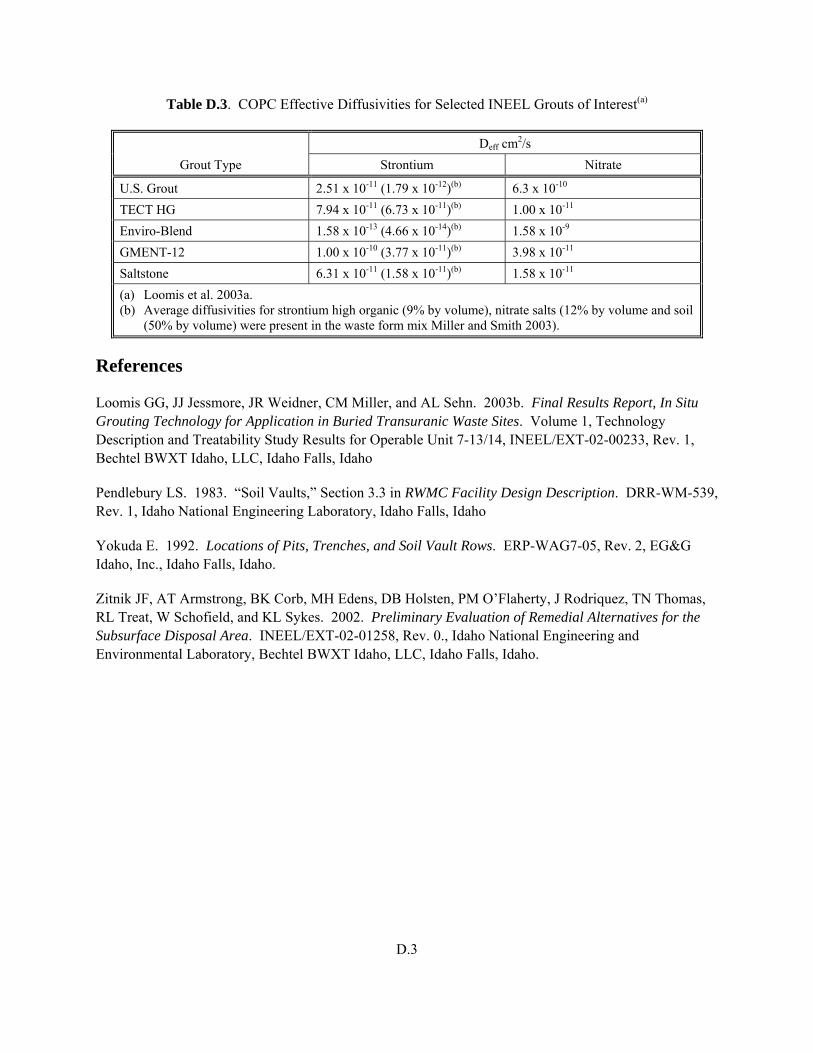
D.3
Table D.3. COPC Effective Diffusivities for Selected INEEL Grouts of Interest(a)
Grout Type Deff cm2/s
Strontium Nitrate
U.S. Grout 2.51 x 10⁻¹¹ (1.79 x 10⁻¹²)(b) 6.3 x 10⁻¹⁰
TECT HG 7.94 x 10⁻¹¹ (6.73 x 10⁻¹¹)(b) 1.00 x 10⁻¹¹
Enviro-Blend 1.58 x 10⁻¹³ (4.66 x 10⁻¹⁴)(b) 1.58 x 10⁻⁹
GMENT-12 1.00 x 10⁻¹⁰ (3.77 x 10⁻¹¹)(b) 3.98 x 10⁻¹¹
Saltstone 6.31 x 10⁻¹¹ (1.58 x 10⁻¹¹)(b) 1.58 x 10⁻¹¹
(a) Loomis et al. 2003a. (b) Average diffusivities for strontium high organic (9% by volume), nitrate salts (12% by volume and soil (50% by volume) were present in the waste form mix Miller and Smith 2003).
References
Loomis GG, JJ Jessmore, JR Weidner, CM Miller, and AL Sehn. 2003b. Final Results Report, In Situ Grouting Technology for Application in Buried Transuranic Waste Sites. Volume 1, Technology Description and Treatability Study Results for Operable Unit 7-13/14, INEEL/EXT-02-00233, Rev. 1, Bechtel BWXT Idaho, LLC, Idaho Falls, Idaho
Pendlebury LS. 1983. “Soil Vaults,” Section 3.3 in RWMC Facility Design Description. DRR-WM-539, Rev. 1, Idaho National Engineering Laboratory, Idaho Falls, Idaho
Yokuda E. 1992. Locations of Pits, Trenches, and Soil Vault Rows. ERP-WAG7-05, Rev. 2, EG&G Idaho, Inc., Idaho Falls, Idaho.
Zitnik JF, AT Armstrong, BK Corb, MH Edens, DB Holsten, PM O’Flaherty, J Rodriquez, TN Thomas, RL Treat, W Schofield, and KL Sykes. 2002. Preliminary Evaluation of Remedial Alternatives for the Subsurface Disposal Area. INEEL/EXT-02-01258, Rev. 0., Idaho National Engineering and Environmental Laboratory, Bechtel BWXT Idaho, LLC, Idaho Falls, Idaho.
Appendix E
In Situ Grouting Sensitivity Case Sub-Structures
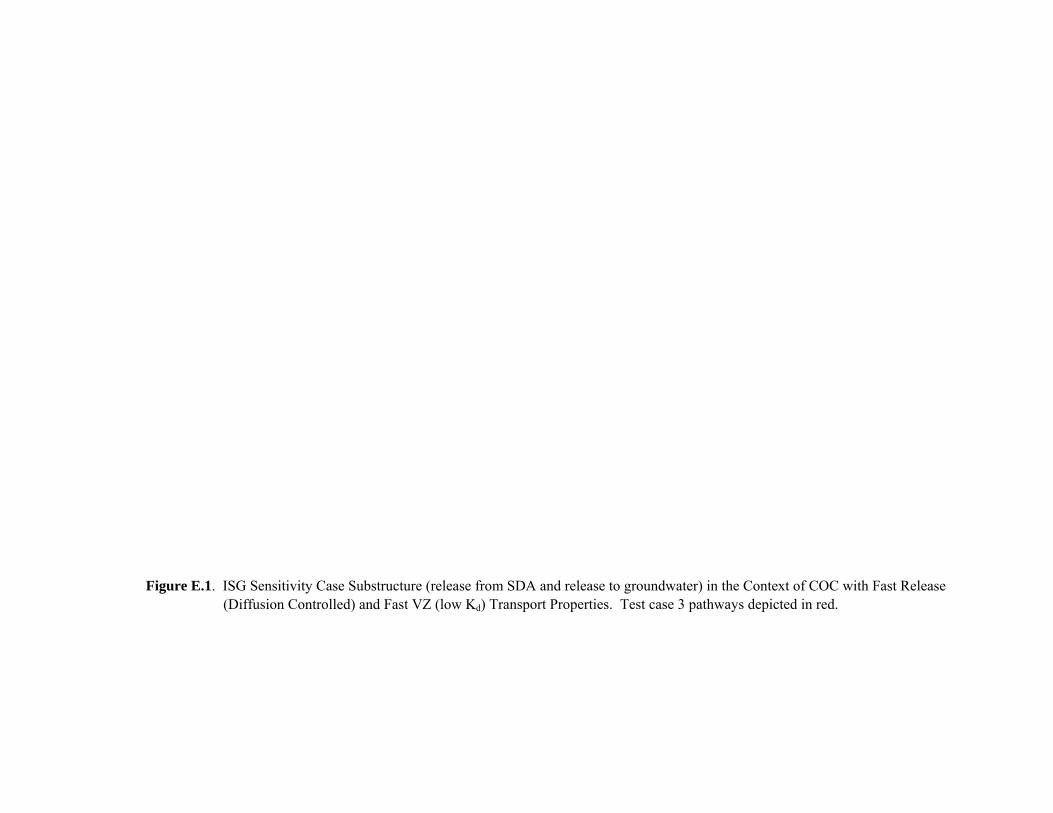
Figure E.1. ISG Sensitivity Case Substructure (release from SDA and release to groundwater) in the Context of COC with Fast Release (Diffusion Controlled) and Fast VZ (low Kd) Transport Properties. Test case 3 pathways depicted in red.
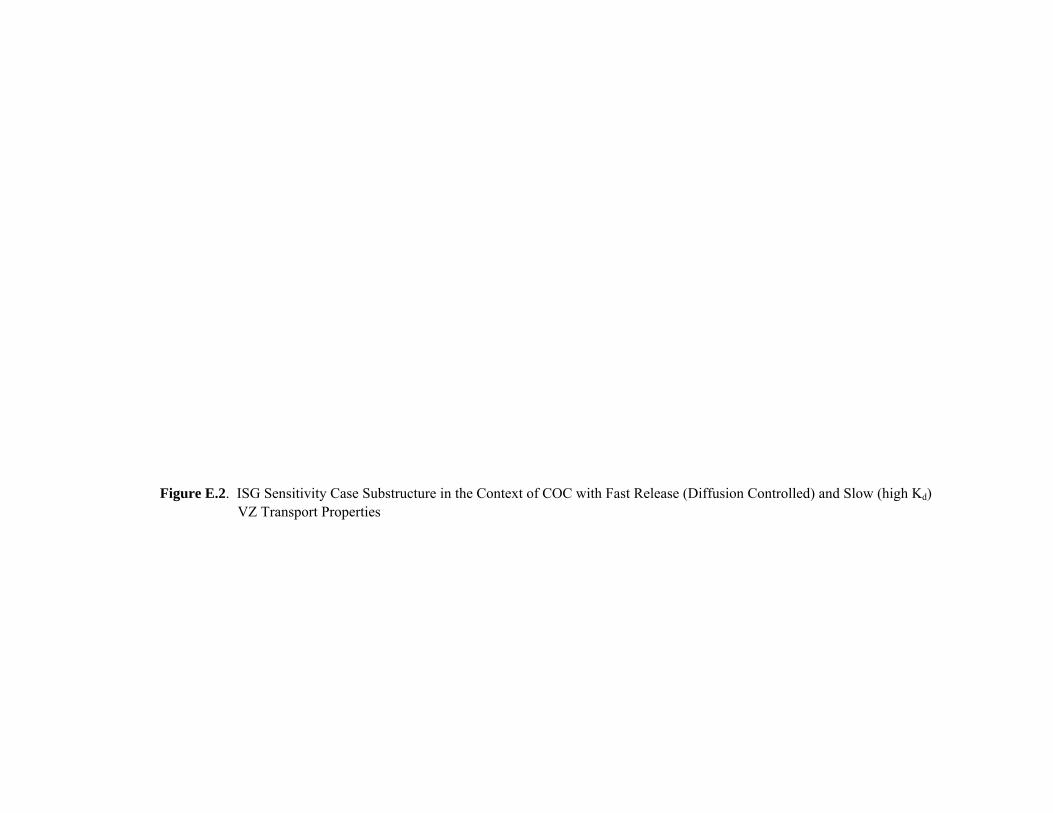
Figure E.2. ISG Sensitivity Case Substructure in the Context of COC with Fast Release (Diffusion Controlled) and Slow (high Kd) VZ Transport Properties
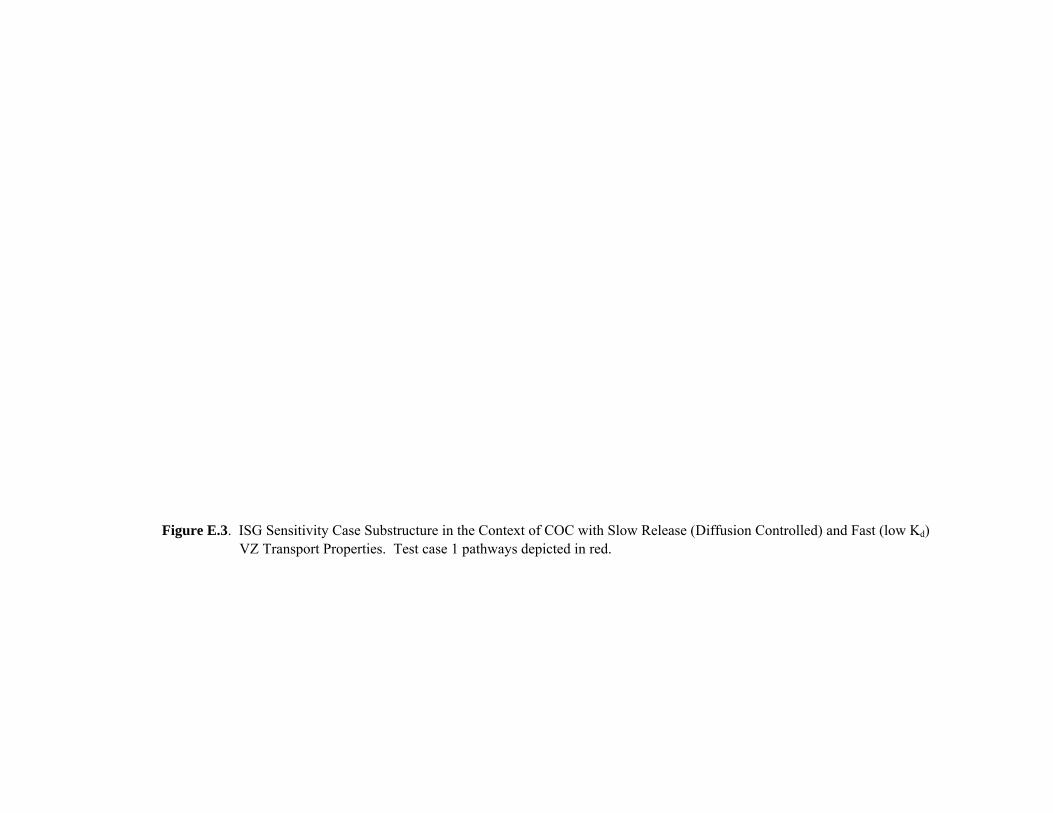
Figure E.3. ISG Sensitivity Case Substructure in the Context of COC with Slow Release (Diffusion Controlled) and Fast (low Kd) VZ Transport Properties. Test case 1 pathways depicted in red.
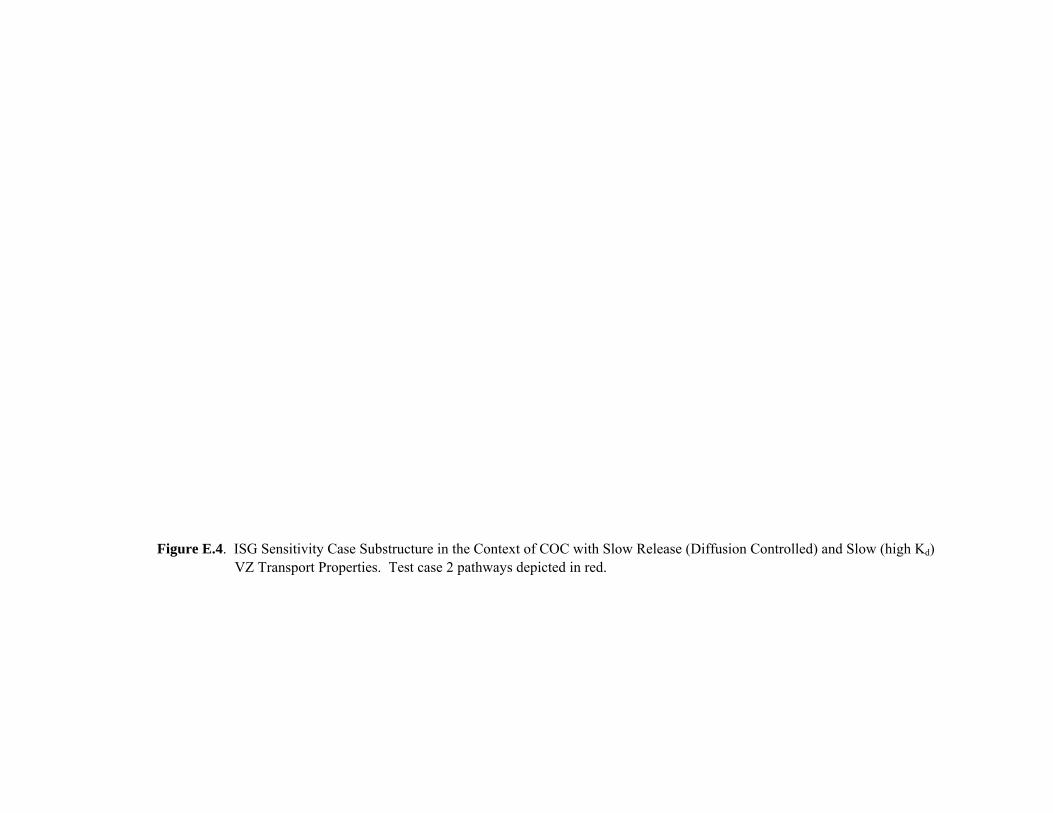
Figure E.4. ISG Sensitivity Case Substructure in the Context of COC with Slow Release (Diffusion Controlled) and Slow (high Kd) VZ Transport Properties. Test case 2 pathways depicted in red.
Appendix F
Support Data for In Situ Vitrification Sensitivity Case Structure
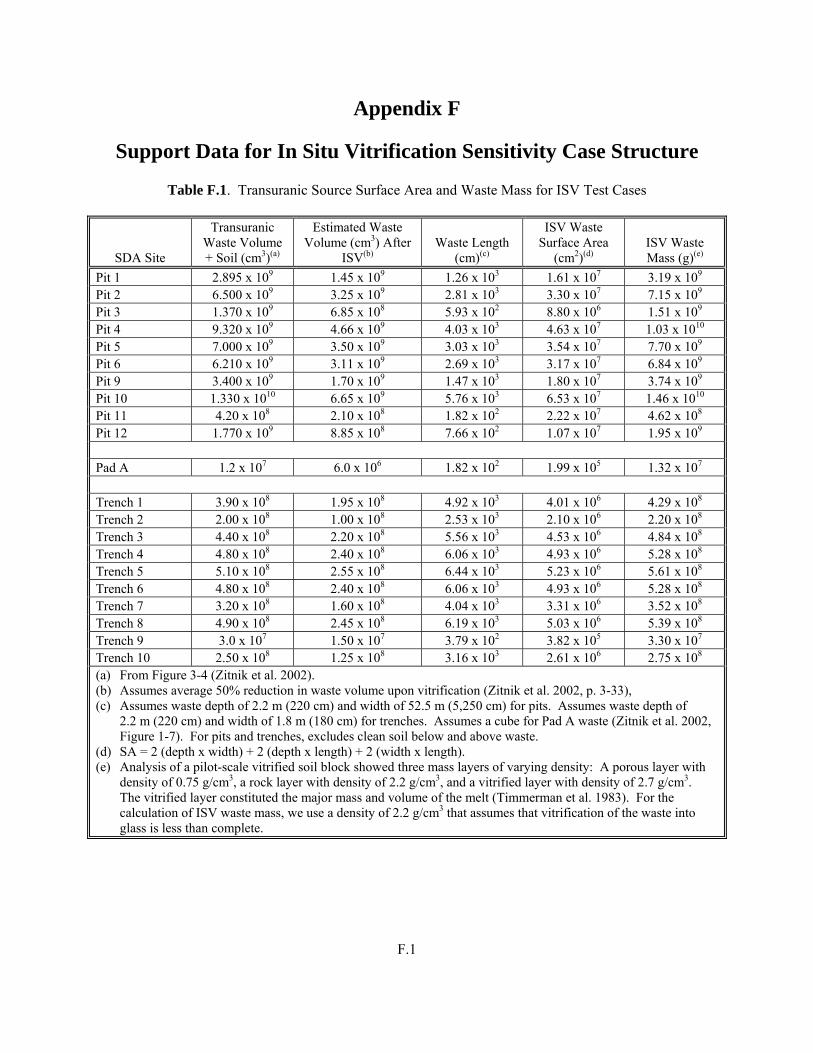
Appendix F
Support Data for In Situ Vitrification Sensitivity Case Structure
Table F.1. Transuranic Source Surface Area and Waste Mass for ISV Test Cases
SDA Site
Transuranic Waste Volume + Soil (cm3)(a)
Estimated Waste Volume (cm3) After
ISV(b) Waste Length
(cm)(c)
ISV Waste Surface Area
(cm2)(d) ISV Waste Mass (g)(e)
Pit 1 2.895 x 10⁹ 1.45 x 10⁹ 1.26 x 10³ 1.61 x 10⁷ 3.19 x 10⁹
Pit 2 6.500 x 10⁹ 3.25 x 10⁹ 2.81 x 10³ 3.30 x 10⁷ 7.15 x 10⁹
Pit 3 1.370 x 10⁹ 6.85 x 10⁸ 5.93 x 10² 8.80 x 10⁶ 1.51 x 10⁹
Pit 4 9.320 x 10⁹ 4.66 x 10⁹ 4.03 x 10³ 4.63 x 10⁷ 1.03 x 10¹⁰
Pit 5 7.000 x 10⁹ 3.50 x 10⁹ 3.03 x 10³ 3.54 x 10⁷ 7.70 x 10⁹
Pit 6 6.210 x 10⁹ 3.11 x 10⁹ 2.69 x 10³ 3.17 x 10⁷ 6.84 x 10⁹
Pit 9 3.400 x 10⁹ 1.70 x 10⁹ 1.47 x 10³ 1.80 x 10⁷ 3.74 x 10⁹
Pit 10 1.330 x 10¹⁰ 6.65 x 10⁹ 5.76 x 10³ 6.53 x 10⁷ 1.46 x 10¹⁰
Pit 11 4.20 x 10⁸ 2.10 x 10⁸ 1.82 x 10² 2.22 x 10⁷ 4.62 x 10⁸ Pit 12 1.770 x 10⁹ 8.85 x 10⁸ 7.66 x 10² 1.07 x 10⁷ 1.95 x 10⁹
Pad A 1.2 x 10⁷ 6.0 x 10⁶ 1.82 x 10² 1.99 x 10⁵ 1.32 x 10⁷
Trench 1 3.90 x 10⁸ 1.95 x 10⁸ 4.92 x 10³ 4.01 x 10⁶ 4.29 x 10⁸
Trench 2 2.00 x 10⁸ 1.00 x 10⁸ 2.53 x 10³ 2.10 x 10⁶ 2.20 x 10⁸
Trench 3 4.40 x 10⁸ 2.20 x 10⁸ 5.56 x 10³ 4.53 x 10⁶ 4.84 x 10⁸
Trench 4 4.80 x 10⁸ 2.40 x 10⁸ 6.06 x 10³ 4.93 x 10⁶ 5.28 x 10⁸
Trench 5 5.10 x 10⁸ 2.55 x 10⁸ 6.44 x 10³ 5.23 x 10⁶ 5.61 x 10⁸
Trench 6 4.80 x 10⁸ 2.40 x 10⁸ 6.06 x 10³ 4.93 x 10⁶ 5.28 x 10⁸
Trench 7 3.20 x 10⁸ 1.60 x 10⁸ 4.04 x 10³ 3.31 x 10⁶ 3.52 x 10⁸
Trench 8 4.90 x 10⁸ 2.45 x 10⁸ 6.19 x 10³ 5.03 x 10⁶ 5.39 x 10⁸
Trench 9 3.0 x 10⁷ 1.50 x 10⁷ 3.79 x 10² 3.82 x 10⁵ 3.30 x 10⁷
Trench 10 2.50 x 10⁸ 1.25 x 10⁸ 3.16 x 10³ 2.61 x 10⁶ 2.75 x 10⁸
(a) From Figure 3-4 (Zitnik et al. 2002). (b) Assumes average 50% reduction in waste volume upon vitrification (Zitnik et al. 2002, p. 3-33), (c) Assumes waste depth of 2.2 m (220 cm) and width of 52.5 m (5,250 cm) for pits. Assumes waste depth of 2.2 m (220 cm) and width of 1.8 m (180 cm) for trenches. Assumes a cube for Pad A waste (Zitnik et al. 2002, Figure 1-7). For pits and trenches, excludes clean soil below and above waste. (d) SA = 2 (depth x width) + 2 (depth x length) + 2 (width x length). (e) Analysis of a pilot-scale vitrified soil block showed three mass layers of varying density: A porous layer with density of 0.75 g/cm3, a rock layer with density of 2.2 g/cm3, and a vitrified layer with density of 2.7 g/cm3. The vitrified layer constituted the major mass and volume of the melt (Timmerman et al. 1983). For the calculation of ISV waste mass, we use a density of 2.2 g/cm3 that assumes that vitrification of the waste into glass is less than complete.
F.1
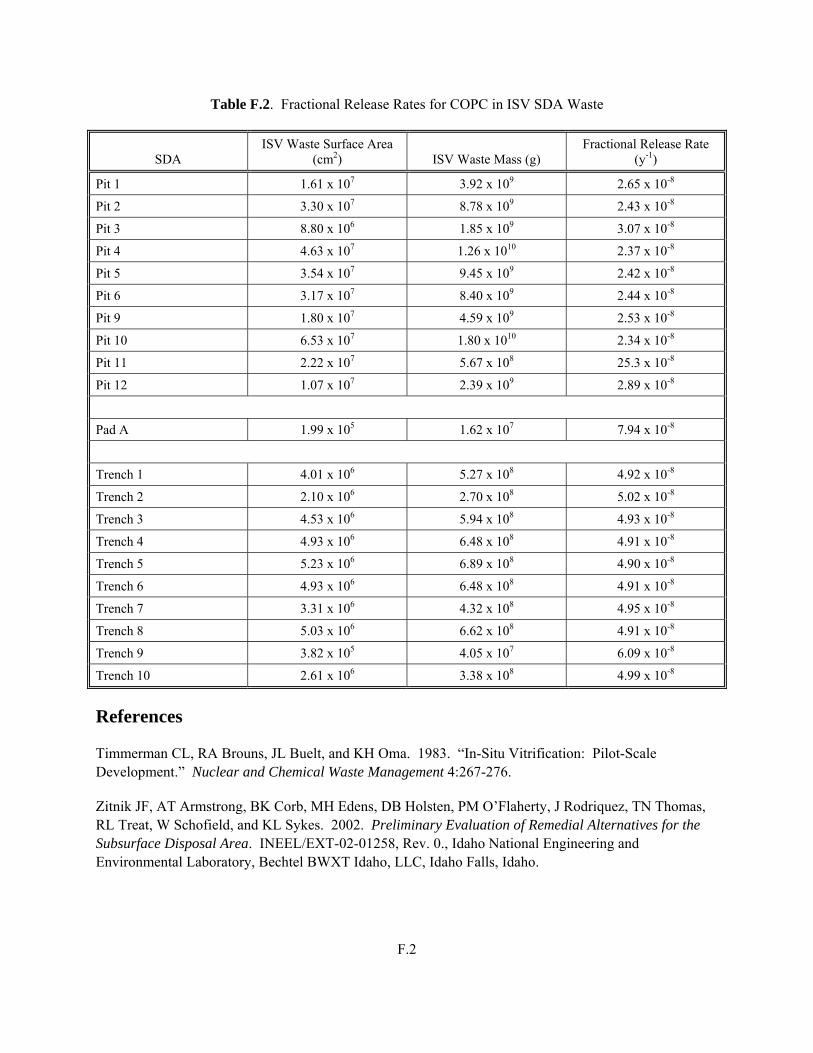
F.2
Table F.2. Fractional Release Rates for COPC in ISV SDA Waste
SDA ISV Waste Surface Area
(cm2) ISV Waste Mass (g) Fractional Release Rate
(y-1)
Pit 1 1.61 x 10⁷ 3.92 x 10⁹ 2.65 x 10⁻⁸
Pit 2 3.30 x 10⁷ 8.78 x 10⁹ 2.43 x 10⁻⁸
Pit 3 8.80 x 10⁶ 1.85 x 10⁹ 3.07 x 10⁻⁸
Pit 4 4.63 x 10⁷ 1.26 x 10¹⁰ 2.37 x 10⁻⁸
Pit 5 3.54 x 10⁷ 9.45 x 10⁹ 2.42 x 10⁻⁸
Pit 6 3.17 x 10⁷ 8.40 x 10⁹ 2.44 x 10⁻⁸
Pit 9 1.80 x 10⁷ 4.59 x 10⁹ 2.53 x 10⁻⁸
Pit 10 6.53 x 10⁷ 1.80 x 10¹⁰ 2.34 x 10⁻⁸
Pit 11 2.22 x 10⁷ 5.67 x 10⁸ 25.3 x 10⁻⁸
Pit 12 1.07 x 10⁷ 2.39 x 10⁹ 2.89 x 10⁻⁸
Pad A 1.99 x 10⁵ 1.62 x 10⁷ 7.94 x 10⁻⁸
Trench 1 4.01 x 10⁶ 5.27 x 10⁸ 4.92 x 10⁻⁸
Trench 2 2.10 x 10⁶ 2.70 x 10⁸ 5.02 x 10⁻⁸
Trench 3 4.53 x 10⁶ 5.94 x 10⁸ 4.93 x 10⁻⁸
Trench 4 4.93 x 10⁶ 6.48 x 10⁸ 4.91 x 10⁻⁸
Trench 5 5.23 x 10⁶ 6.89 x 10⁸ 4.90 x 10⁻⁸
Trench 6 4.93 x 10⁶ 6.48 x 10⁸ 4.91 x 10⁻⁸
Trench 7 3.31 x 10⁶ 4.32 x 10⁸ 4.95 x 10⁻⁸
Trench 8 5.03 x 10⁶ 6.62 x 10⁸ 4.91 x 10⁻⁸
Trench 9 3.82 x 10⁵ 4.05 x 10⁷ 6.09 x 10⁻⁸
Trench 10 2.61 x 10⁶ 3.38 x 10⁸ 4.99 x 10⁻⁸
References
Timmerman CL, RA Brouns, JL Buelt, and KH Oma. 1983. “In-Situ Vitrification: Pilot-Scale Development.” Nuclear and Chemical Waste Management 4:267-276.
Zitnik JF, AT Armstrong, BK Corb, MH Edens, DB Holsten, PM O’Flaherty, J Rodriquez, TN Thomas, RL Treat, W Schofield, and KL Sykes. 2002. Preliminary Evaluation of Remedial Alternatives for the Subsurface Disposal Area. INEEL/EXT-02-01258, Rev. 0., Idaho National Engineering and Environmental Laboratory, Bechtel BWXT Idaho, LLC, Idaho Falls, Idaho.
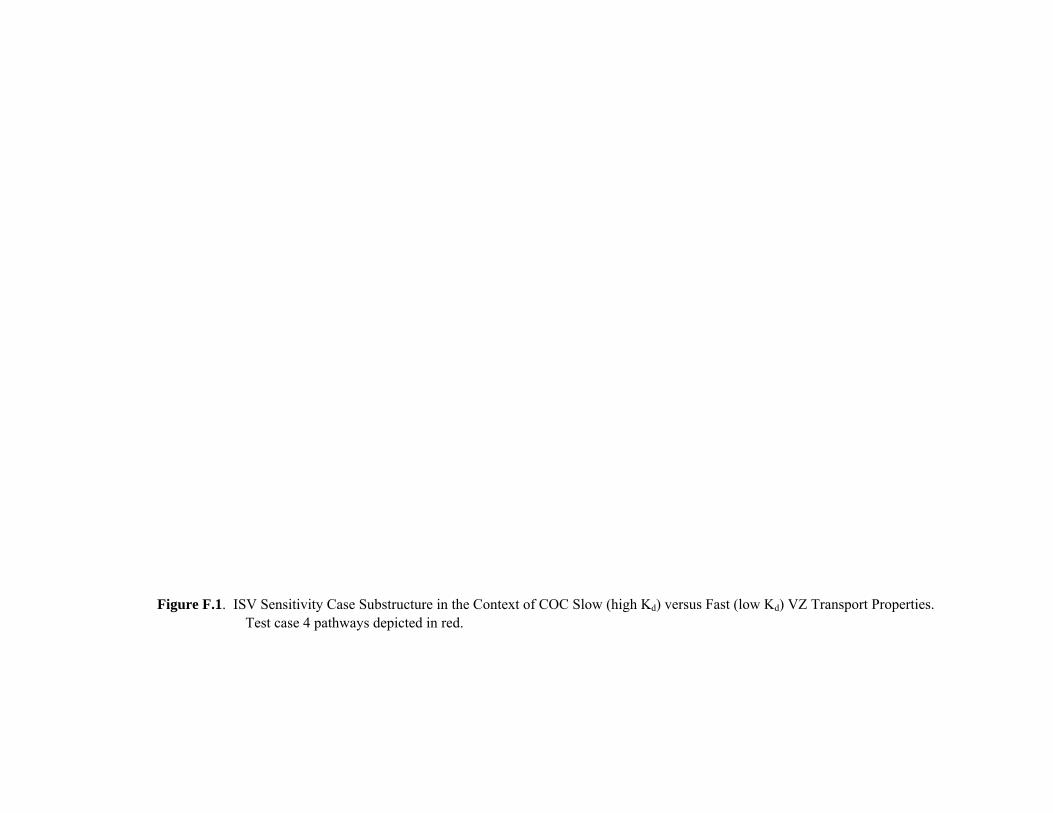
Figure F.1. ISV Sensitivity Case Substructure in the Context of COC Slow (high Kd) versus Fast (low Kd) VZ Transport Properties. Test case 4 pathways depicted in red.
Appendix G
Activated Metal Waste Sensitivity Case Structure
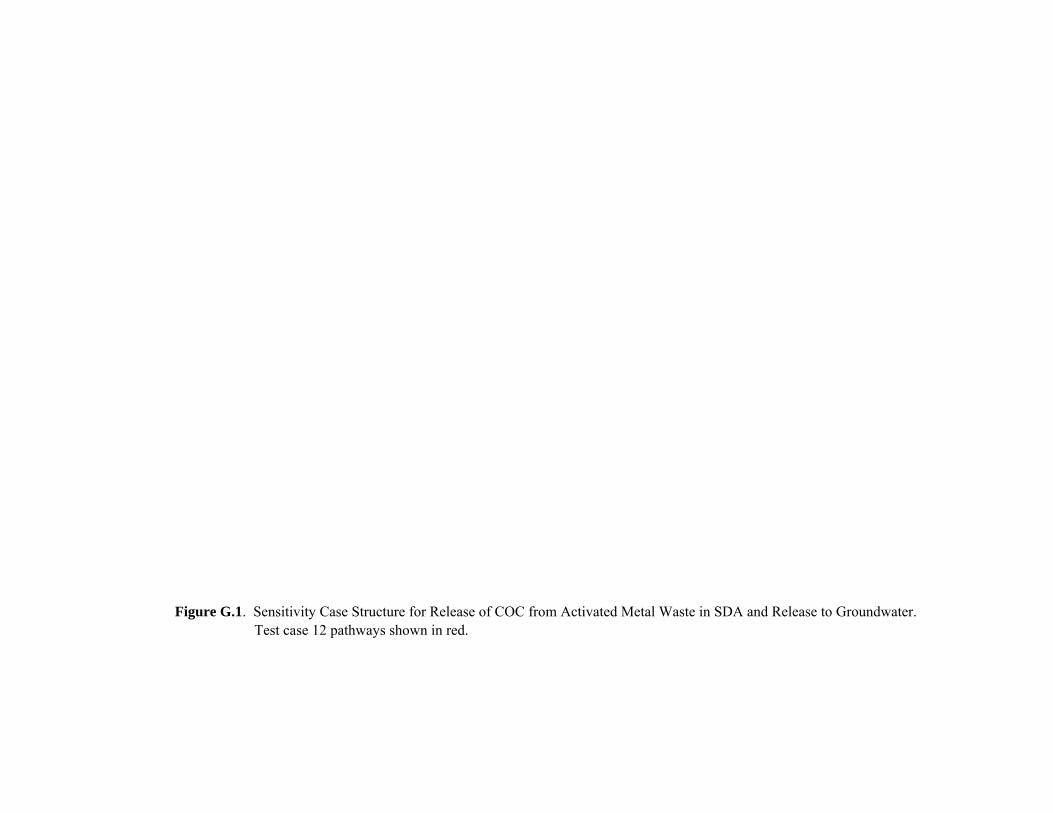
Figure G.1. Sensitivity Case Structure for Release of COC from Activated Metal Waste in SDA and Release to Groundwater.
Test case 12 pathways shown in red.
Appendix H
Rocky Flats Waste Sensitivity Case Structure
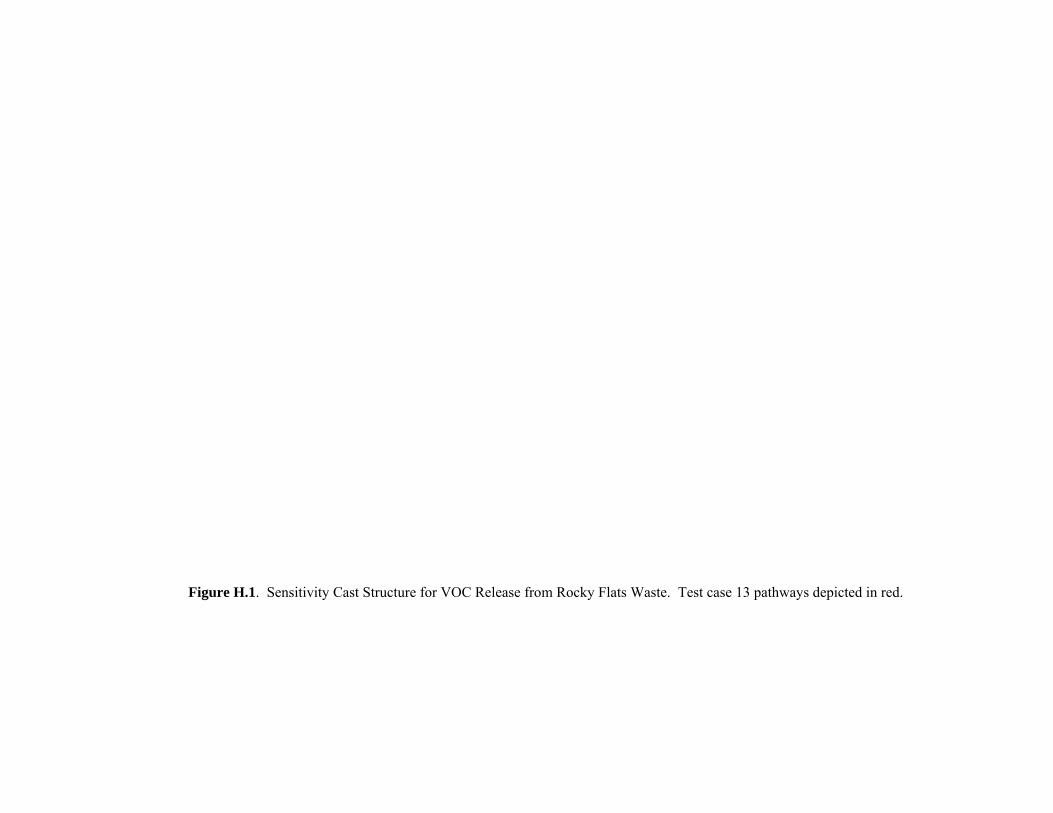
Figure H.1. Sensitivity Cast Structure for VOC Release from Rocky Flats Waste. Test case 13 pathways depicted in red.
Appendix I
Support Data for Unconsolidated Waste Sensitivity Case Structure
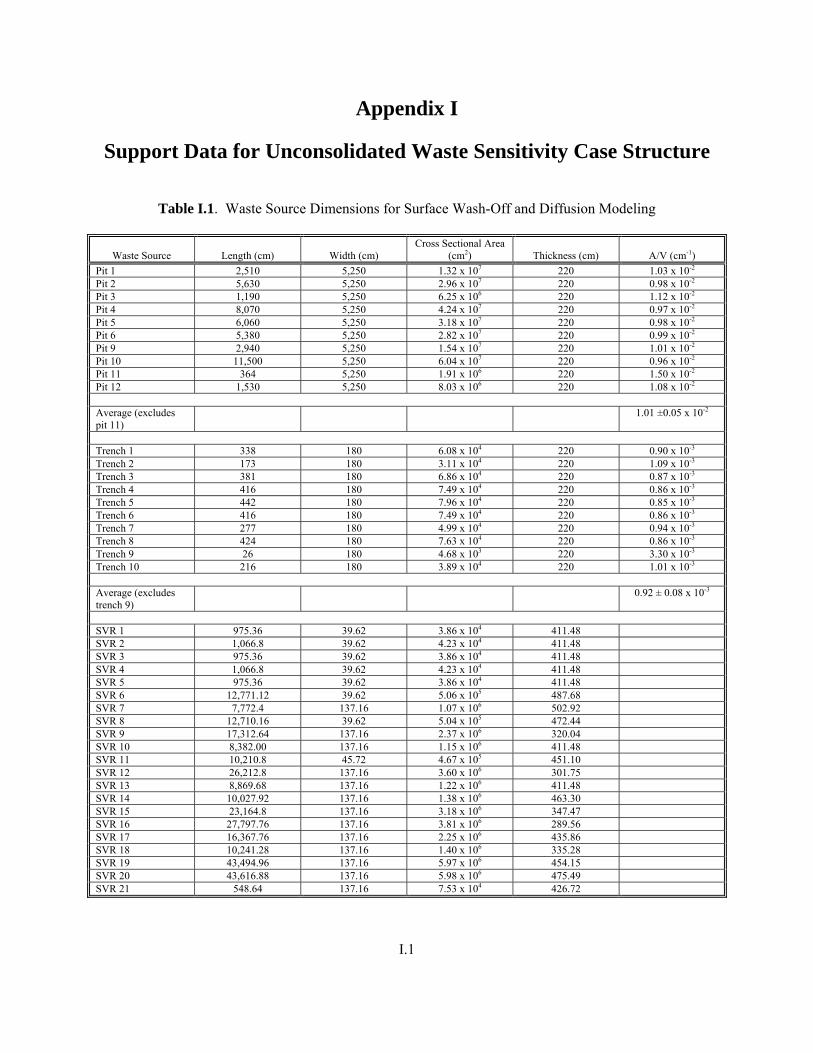
Appendix I
Support Data for Unconsolidated Waste Sensitivity Case Structure
Table I.1. Waste Source Dimensions for Surface Wash-Off and Diffusion Modeling
Waste Source Length (cm) Width (cm) Cross Sectional Area
(cm2) Thickness (cm) A/V (cm-1) Pit 1 2,510 5,250 1.32 x 10⁷ 220 1.03 x 10⁻²
Pit 2 5,630 5,250 2.96 x 10⁷ 220 0.98 x 10⁻²
Pit 3 1,190 5,250 6.25 x 10⁶ 220 1.12 x 10⁻²
Pit 4 8,070 5,250 4.24 x 10⁷ 220 0.97 x 10⁻²
Pit 5 6,060 5,250 3.18 x 10⁷ 220 0.98 x 10⁻²
Pit 6 5,380 5,250 2.82 x 10⁷ 220 0.99 x 10⁻²
Pit 9 2,940 5,250 1.54 x 10⁷ 220 1.01 x 10⁻²
Pit 10 11,500 5,250 6.04 x 10⁷ 220 0.96 x 10⁻²
Pit 11 364 5,250 1.91 x 10⁶ 220 1.50 x 10⁻²
Pit 12 1,530 5,250 8.03 x 10⁶ 220 1.08 x 10⁻²
Average (excludes pit 11)
1.01 ±0.05 x 10⁻²
Trench 1 338 180 6.08 x 10⁴ 220 0.90 x 10⁻³
Trench 2 173 180 3.11 x 10⁴ 220 1.09 x 10⁻³
Trench 3 381 180 6.86 x 10⁴ 220 0.87 x 10⁻³
Trench 4 416 180 7.49 x 10⁴ 220 0.86 x 10⁻³
Trench 5 442 180 7.96 x 10⁴ 220 0.85 x 10⁻³
Trench 6 416 180 7.49 x 10⁴ 220 0.86 x 10⁻³
Trench 7 277 180 4.99 x 10⁴ 220 0.94 x 10⁻³
Trench 8 424 180 7.63 x 10⁴ 220 0.86 x 10⁻³
Trench 9 26 180 4.68 x 10³ 220 3.30 x 10⁻³
Trench 10 216 180 3.89 x 10⁴ 220 1.01 x 10⁻³
Average (excludes trench 9)
0.92 ± 0.08 x 10⁻³
SVR 1 975.36 39.62 3.86 x 10⁴ 411.48 SVR 2 1,066.8 39.62 4.23 x 10⁴ 411.48 SVR 3 975.36 39.62 3.86 x 10⁴ 411.48 SVR 4 1,066.8 39.62 4.23 x 10⁴ 411.48 SVR 5 975.36 39.62 3.86 x 10⁴ 411.48 SVR 6 12,771.12 39.62 5.06 x 10⁵ 487.68 SVR 7 7,772.4 137.16 1.07 x 10⁶ 502.92 SVR 8 12,710.16 39.62 5.04 x 10⁵ 472.44 SVR 9 17,312.64 137.16 2.37 x 10⁶ 320.04 SVR 10 8,382.00 137.16 1.15 x 10⁶ 411.48 SVR 11 10,210.8 45.72 4.67 x 10⁵ 451.10 SVR 12 26,212.8 137.16 3.60 x 10⁶ 301.75 SVR 13 8,869.68 137.16 1.22 x 10⁶ 411.48 SVR 14 10,027.92 137.16 1.38 x 10⁶ 463.30 SVR 15 23,164.8 137.16 3.18 x 10⁶ 347.47 SVR 16 27,797.76 137.16 3.81 x 10⁶ 289.56 SVR 17 16,367.76 137.16 2.25 x 10⁶ 435.86 SVR 18 10,241.28 137.16 1.40 x 10⁶ 335.28 SVR 19 43,494.96 137.16 5.97 x 10⁶ 454.15 SVR 20 43,616.88 137.16 5.98 x 10⁶ 475.49 SVR 21 548.64 137.16 7.53 x 10⁴ 426.72
I.1
Appendix J
Unconsolidated Waste Sensitivity Case Structure
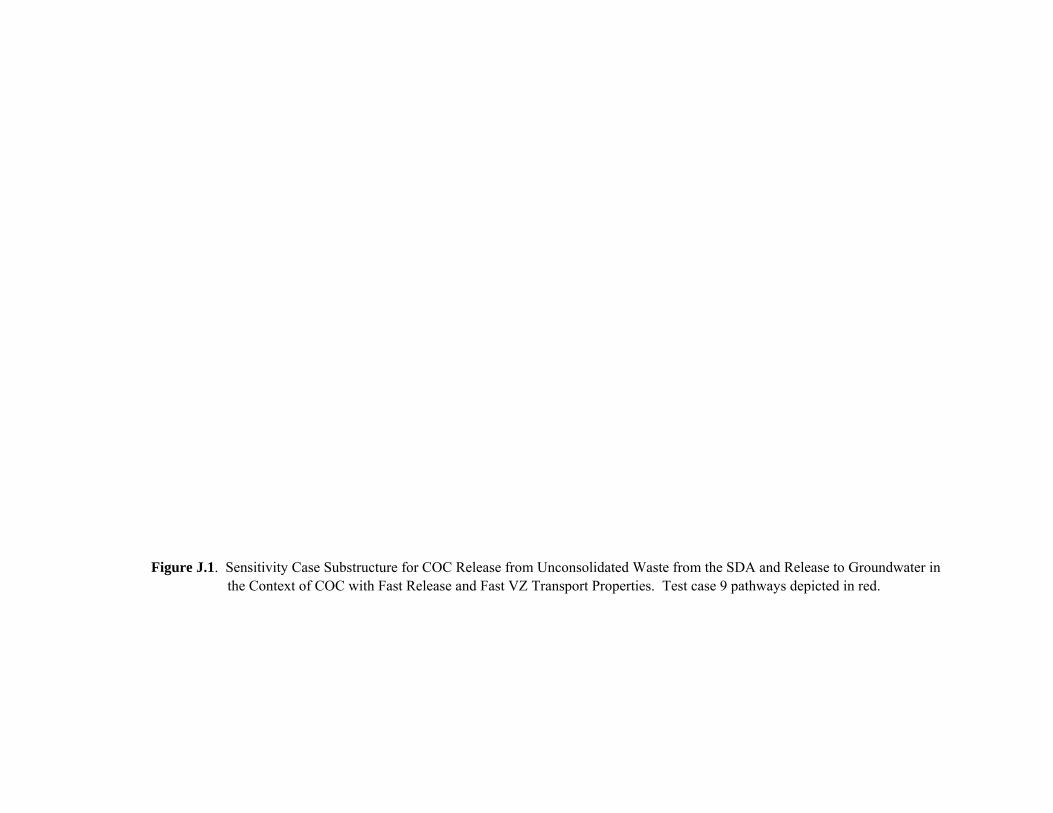
Figure J.1. Sensitivity Case Substructure for COC Release from Unconsolidated Waste from the SDA and Release to Groundwater in the Context of COC with Fast Release and Fast VZ Transport Properties. Test case 9 pathways depicted in red.
Figure J.2. Sensitivity Case Structure for COC Release from Unconsolidated Waste from SDA and to Groundwater in the Context of COC with Slow Release and Fast VZ Transport Properties
Figure J.3. Sensitivity Case Substructure for COC Release from Unconsolidated SDA Waste and Release to Groundwater in the Context
of COC with Slow Release and Slow VZ Transport Properties
Appendix K
Sensitivity Cases
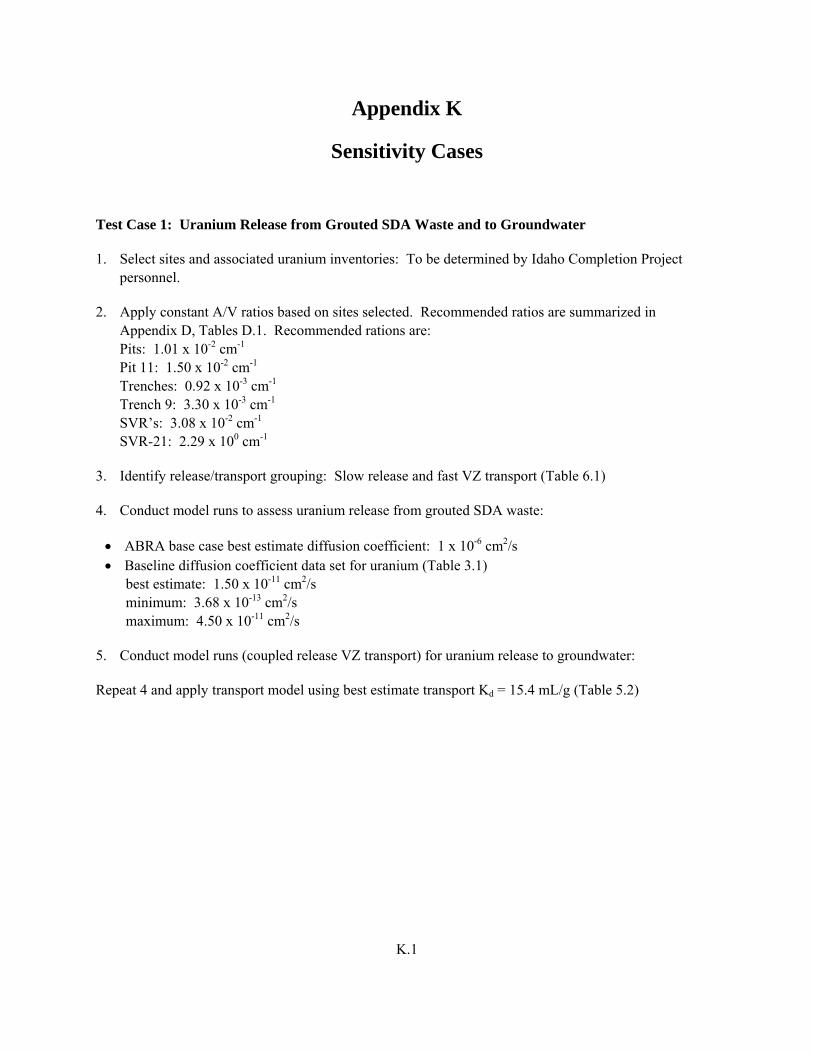
Appendix K
Sensitivity Cases
Test Case 1: Uranium Release from Grouted SDA Waste and to Groundwater
1. Select sites and associated uranium inventories: To be determined by Idaho Completion Project personnel.
2. Apply constant A/V ratios based on sites selected. Recommended ratios are summarized in Appendix D, Tables D.1. Recommended rations are:
Pits: 1.01 x 10⁻² cm-1 Pit 11: 1.50 x 10⁻² cm-1 Trenches: 0.92 x 10⁻³ cm-1 Trench 9: 3.30 x 10⁻³ cm-1 SVR’s: 3.08 x 10⁻² cm-1 SVR-21: 2.29 x 100 cm-1
3. Identify release/transport grouping: Slow release and fast VZ transport (Table 6.1)
4. Conduct model runs to assess uranium release from grouted SDA waste:
• ABRA base case best estimate diffusion coefficient: 1 x 10⁻⁶ cm2/s • Baseline diffusion coefficient data set for uranium (Table 3.1)
best estimate: 1.50 x 10⁻¹¹ cm2/s minimum: 3.68 x 10⁻¹³ cm2/s maximum: 4.50 x 10⁻¹¹ cm2/s
5. Conduct model runs (coupled release VZ transport) for uranium release to groundwater:
Repeat 4 and apply transport model using best estimate transport Kd = 15.4 mL/g (Table 5.2)
K.1

Test Case 2: Plutonium Release from Grouted SDA Waste and to Groundwater
1. Select sites and associated plutonium inventories: To be determined by Idaho Completion Project personnel.
2. Apply constant A/V ratios based on sites selected. Recommended ratios are summarized in Appendix D, Tables D.1 and D.2. Recommended ratios are:
Pits: 1.01 x 10⁻² cm-1 Pit 11: 1.50 x 10⁻² cm-1 Trenches: 0.92 x 10⁻³ cm-1 Trench 9: 3.30 x 10⁻³ cm-1 SVR’s: 3.08 x 10⁻² cm-1 SVR-21: 2.29 x 100 cm-1
3. Identify release/transport grouping: Slow release and slow VZ transport (Table 6.1)
4. Conduct model runs to assess plutonium release from grouted SDA waste:
• ABRA base case best estimate diffusion coefficient: 1 x 10⁻⁶ cm2/s • Baseline diffusion coefficient data set for plutonium (Table 3.1)
best estimate: 1.86 x 10⁻¹¹ cm2/s minimum: 1.03 x 10⁻¹⁶ cm2/s maximum: 1.30 x 10⁻¹⁰ cm2/s
5. Conduct model runs (coupled release/VZ transport) to assess plutonium release to groundwater:
Repeat 4 and apply transport model using best estimate transport Kd = 5,100 mL/g (Table 5.2)
K.2
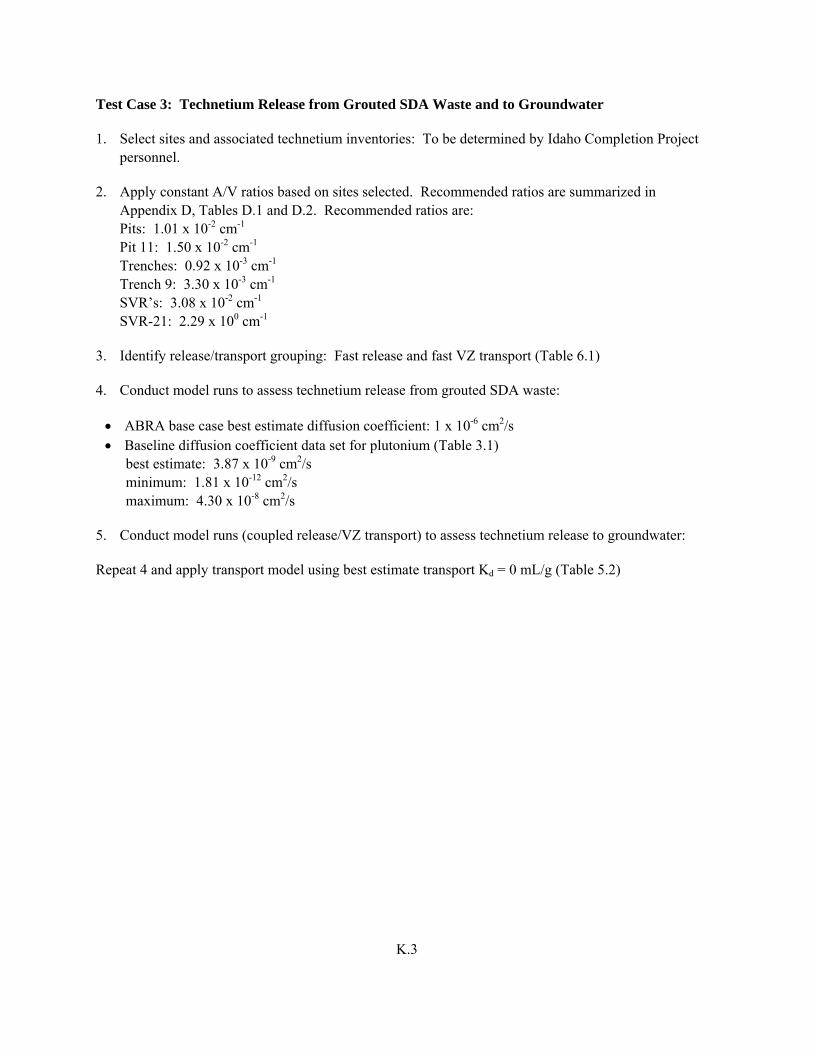
Test Case 3: Technetium Release from Grouted SDA Waste and to Groundwater
1. Select sites and associated technetium inventories: To be determined by Idaho Completion Project personnel.
2. Apply constant A/V ratios based on sites selected. Recommended ratios are summarized in Appendix D, Tables D.1 and D.2. Recommended ratios are:
Pits: 1.01 x 10⁻² cm-1 Pit 11: 1.50 x 10⁻² cm-1 Trenches: 0.92 x 10⁻³ cm-1 Trench 9: 3.30 x 10⁻³ cm-1 SVR’s: 3.08 x 10⁻² cm-1 SVR-21: 2.29 x 100 cm-1
3. Identify release/transport grouping: Fast release and fast VZ transport (Table 6.1)
4. Conduct model runs to assess technetium release from grouted SDA waste:
• ABRA base case best estimate diffusion coefficient: 1 x 10⁻⁶ cm2/s • Baseline diffusion coefficient data set for plutonium (Table 3.1)
best estimate: 3.87 x 10⁻⁹ cm2/s minimum: 1.81 x 10⁻¹² cm2/s maximum: 4.30 x 10⁻⁸ cm2/s
5. Conduct model runs (coupled release/VZ transport) to assess technetium release to groundwater:
Repeat 4 and apply transport model using best estimate transport Kd = 0 mL/g (Table 5.2)
K.3
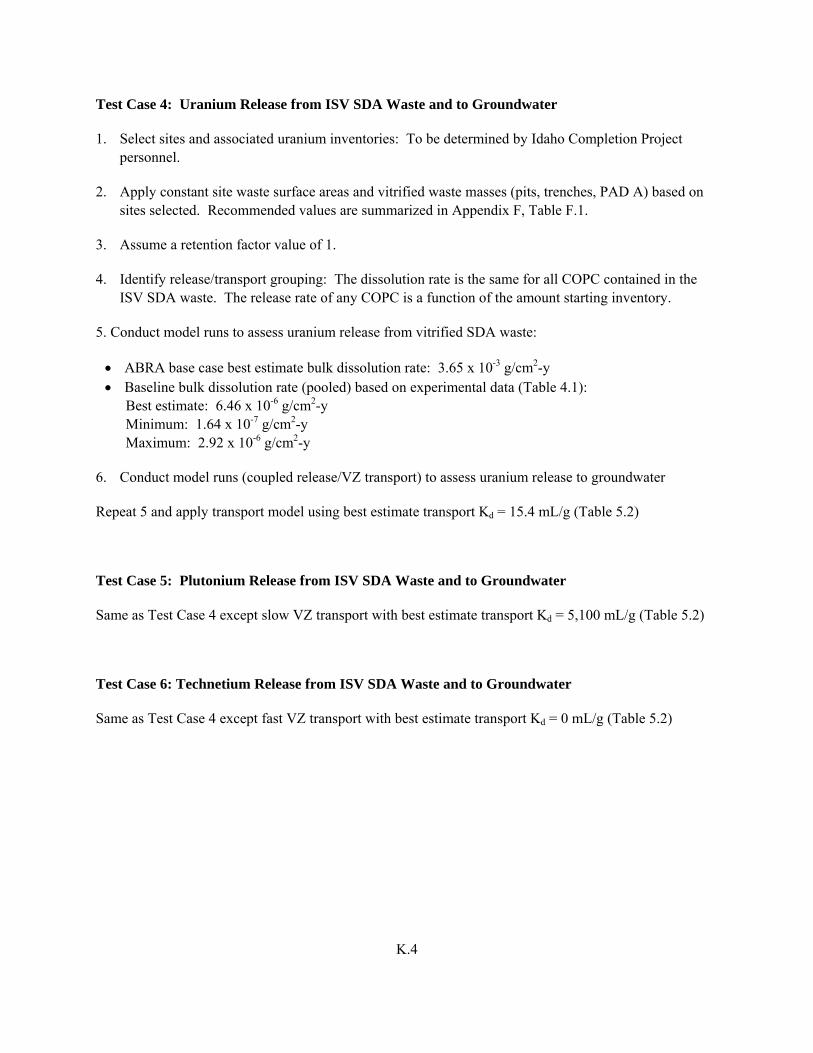
Test Case 4: Uranium Release from ISV SDA Waste and to Groundwater
1. Select sites and associated uranium inventories: To be determined by Idaho Completion Project personnel.
2. Apply constant site waste surface areas and vitrified waste masses (pits, trenches, PAD A) based on sites selected. Recommended values are summarized in Appendix F, Table F.1.
3. Assume a retention factor value of 1.
4. Identify release/transport grouping: The dissolution rate is the same for all COPC contained in the ISV SDA waste. The release rate of any COPC is a function of the amount starting inventory.
5. Conduct model runs to assess uranium release from vitrified SDA waste:
• ABRA base case best estimate bulk dissolution rate: 3.65 x 10⁻³ g/cm2-y • Baseline bulk dissolution rate (pooled) based on experimental data (Table 4.1):
Best estimate: 6.46 x 10⁻⁶ g/cm2-y Minimum: 1.64 x 10⁻⁷ g/cm2-y Maximum: 2.92 x 10⁻⁶ g/cm2-y
6. Conduct model runs (coupled release/VZ transport) to assess uranium release to groundwater
Repeat 5 and apply transport model using best estimate transport Kd = 15.4 mL/g (Table 5.2)
Test Case 5: Plutonium Release from ISV SDA Waste and to Groundwater
Same as Test Case 4 except slow VZ transport with best estimate transport Kd = 5,100 mL/g (Table 5.2)
Test Case 6: Technetium Release from ISV SDA Waste and to Groundwater
Same as Test Case 4 except fast VZ transport with best estimate transport Kd = 0 mL/g (Table 5.2)
K.4
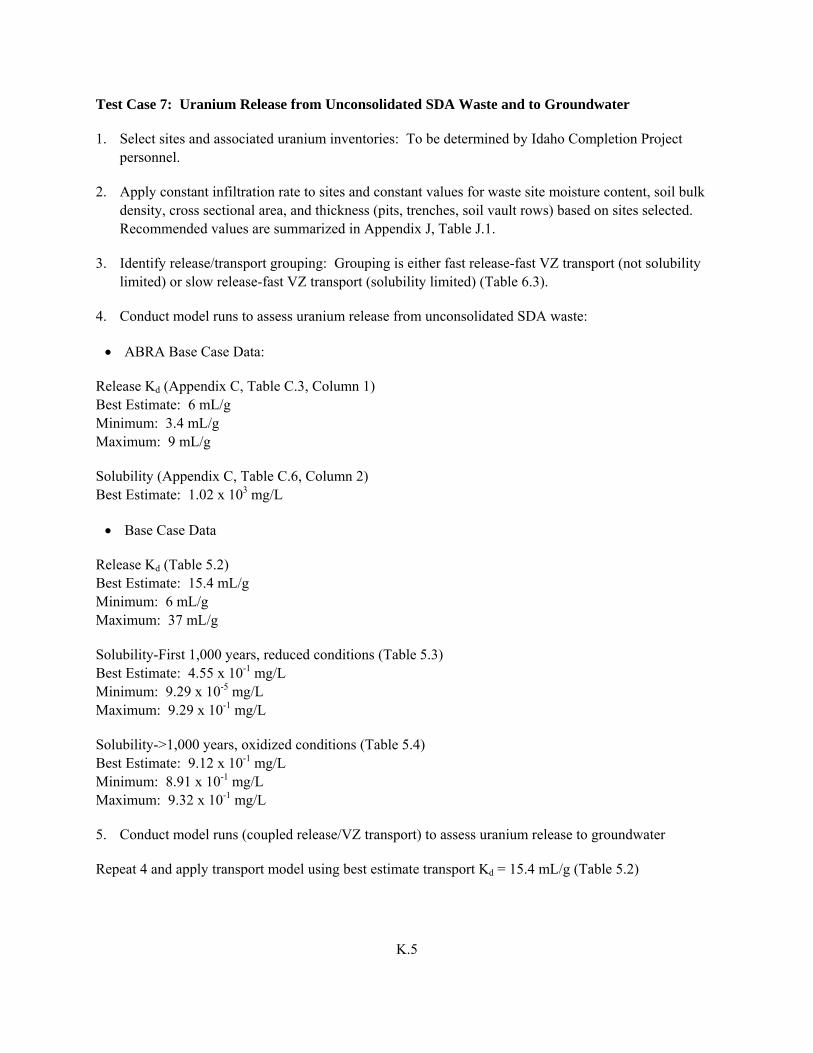
Test Case 7: Uranium Release from Unconsolidated SDA Waste and to Groundwater
1. Select sites and associated uranium inventories: To be determined by Idaho Completion Project personnel.
2. Apply constant infiltration rate to sites and constant values for waste site moisture content, soil bulk density, cross sectional area, and thickness (pits, trenches, soil vault rows) based on sites selected. Recommended values are summarized in Appendix J, Table J.1.
3. Identify release/transport grouping: Grouping is either fast release-fast VZ transport (not solubility limited) or slow release-fast VZ transport (solubility limited) (Table 6.3).
4. Conduct model runs to assess uranium release from unconsolidated SDA waste:
• ABRA Base Case Data:
Release Kd (Appendix C, Table C.3, Column 1) Best Estimate: 6 mL/g Minimum: 3.4 mL/g Maximum: 9 mL/g
Solubility (Appendix C, Table C.6, Column 2) Best Estimate: 1.02 x 10³ mg/L
• Base Case Data
Release Kd (Table 5.2) Best Estimate: 15.4 mL/g Minimum: 6 mL/g Maximum: 37 mL/g
Solubility-First 1,000 years, reduced conditions (Table 5.3) Best Estimate: 4.55 x 10⁻¹ mg/L Minimum: 9.29 x 10⁻⁵ mg/L Maximum: 9.29 x 10⁻¹ mg/L
Solubility->1,000 years, oxidized conditions (Table 5.4) Best Estimate: 9.12 x 10⁻¹ mg/L Minimum: 8.91 x 10⁻¹ mg/L Maximum: 9.32 x 10⁻¹ mg/L
5. Conduct model runs (coupled release/VZ transport) to assess uranium release to groundwater
Repeat 4 and apply transport model using best estimate transport Kd = 15.4 mL/g (Table 5.2)
K.5
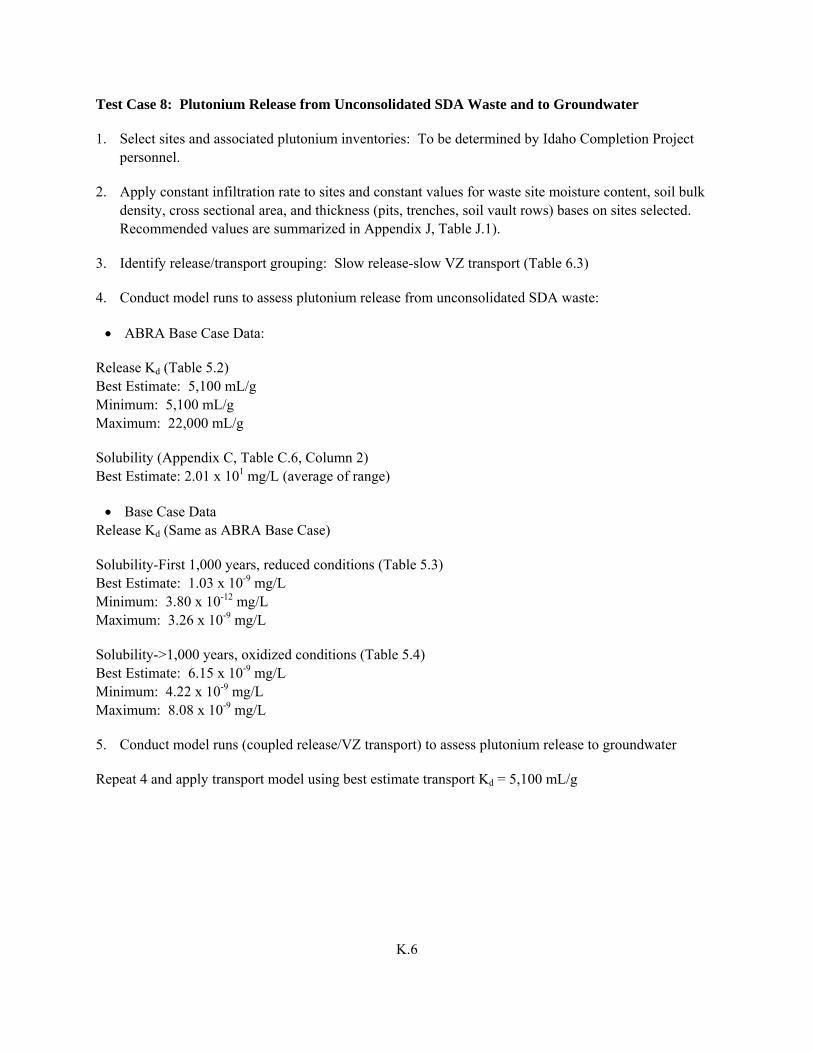
Test Case 8: Plutonium Release from Unconsolidated SDA Waste and to Groundwater
1. Select sites and associated plutonium inventories: To be determined by Idaho Completion Project personnel.
2. Apply constant infiltration rate to sites and constant values for waste site moisture content, soil bulk density, cross sectional area, and thickness (pits, trenches, soil vault rows) bases on sites selected. Recommended values are summarized in Appendix J, Table J.1).
3. Identify release/transport grouping: Slow release-slow VZ transport (Table 6.3)
4. Conduct model runs to assess plutonium release from unconsolidated SDA waste:
• ABRA Base Case Data:
Release Kd (Table 5.2) Best Estimate: 5,100 mL/g Minimum: 5,100 mL/g Maximum: 22,000 mL/g
Solubility (Appendix C, Table C.6, Column 2) Best Estimate: 2.01 x 101 mg/L (average of range)
• Base Case Data Release Kd (Same as ABRA Base Case)
Solubility-First 1,000 years, reduced conditions (Table 5.3) Best Estimate: 1.03 x 10⁻⁹ mg/L Minimum: 3.80 x 10⁻¹² mg/L Maximum: 3.26 x 10⁻⁹ mg/L
Solubility->1,000 years, oxidized conditions (Table 5.4) Best Estimate: 6.15 x 10⁻⁹ mg/L Minimum: 4.22 x 10⁻⁹ mg/L Maximum: 8.08 x 10⁻⁹ mg/L
5. Conduct model runs (coupled release/VZ transport) to assess plutonium release to groundwater
Repeat 4 and apply transport model using best estimate transport Kd = 5,100 mL/g
K.6
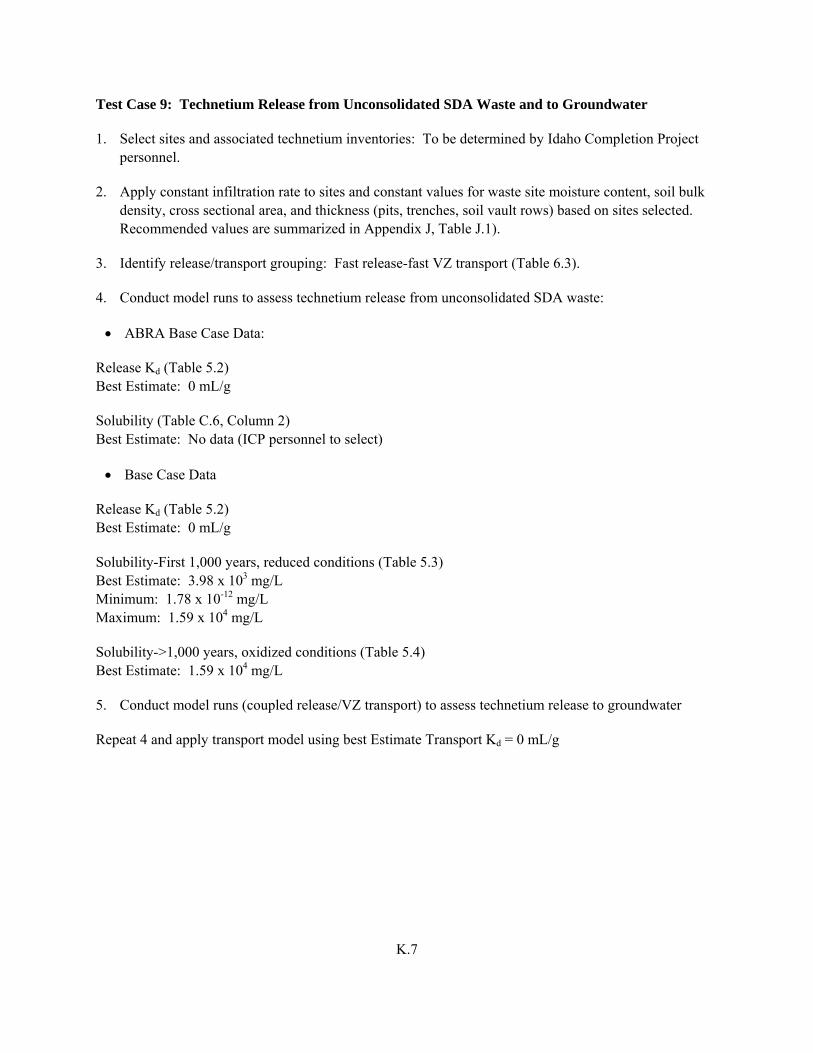
Test Case 9: Technetium Release from Unconsolidated SDA Waste and to Groundwater
1. Select sites and associated technetium inventories: To be determined by Idaho Completion Project personnel.
2. Apply constant infiltration rate to sites and constant values for waste site moisture content, soil bulk density, cross sectional area, and thickness (pits, trenches, soil vault rows) based on sites selected. Recommended values are summarized in Appendix J, Table J.1).
3. Identify release/transport grouping: Fast release-fast VZ transport (Table 6.3).
4. Conduct model runs to assess technetium release from unconsolidated SDA waste:
• ABRA Base Case Data:
Release Kd (Table 5.2) Best Estimate: 0 mL/g
Solubility (Table C.6, Column 2) Best Estimate: No data (ICP personnel to select)
• Base Case Data
Release Kd (Table 5.2) Best Estimate: 0 mL/g
Solubility-First 1,000 years, reduced conditions (Table 5.3) Best Estimate: 3.98 x 10³ mg/L Minimum: 1.78 x 10⁻¹² mg/L Maximum: 1.59 x 10⁴ mg/L
Solubility->1,000 years, oxidized conditions (Table 5.4) Best Estimate: 1.59 x 10⁴ mg/L
5. Conduct model runs (coupled release/VZ transport) to assess technetium release to groundwater
Repeat 4 and apply transport model using best Estimate Transport Kd = 0 mL/g
K.7
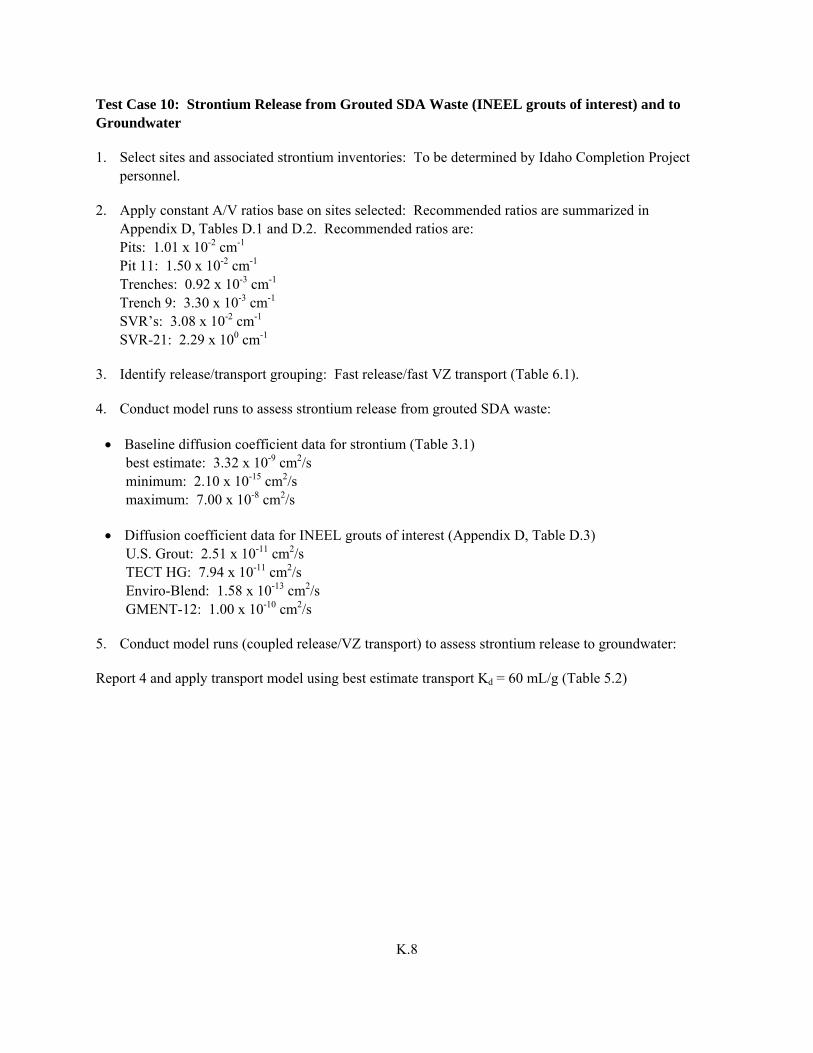
Test Case 10: Strontium Release from Grouted SDA Waste (INEEL grouts of interest) and to Groundwater
1. Select sites and associated strontium inventories: To be determined by Idaho Completion Project personnel.
2. Apply constant A/V ratios base on sites selected: Recommended ratios are summarized in Appendix D, Tables D.1 and D.2. Recommended ratios are:
Pits: 1.01 x 10⁻² cm-1 Pit 11: 1.50 x 10⁻² cm-1 Trenches: 0.92 x 10⁻³ cm-1 Trench 9: 3.30 x 10⁻³ cm-1 SVR’s: 3.08 x 10⁻² cm-1 SVR-21: 2.29 x 100 cm-1
3. Identify release/transport grouping: Fast release/fast VZ transport (Table 6.1).
4. Conduct model runs to assess strontium release from grouted SDA waste:
• Baseline diffusion coefficient data for strontium (Table 3.1) best estimate: 3.32 x 10⁻⁹ cm2/s minimum: 2.10 x 10⁻¹⁵ cm2/s maximum: 7.00 x 10⁻⁸ cm2/s
• Diffusion coefficient data for INEEL grouts of interest (Appendix D, Table D.3) U.S. Grout: 2.51 x 10⁻¹¹ cm2/s TECT HG: 7.94 x 10⁻¹¹ cm2/s Enviro-Blend: 1.58 x 10⁻¹³ cm2/s GMENT-12: 1.00 x 10⁻¹⁰ cm2/s
5. Conduct model runs (coupled release/VZ transport) to assess strontium release to groundwater:
Report 4 and apply transport model using best estimate transport Kd = 60 mL/g (Table 5.2)
K.8
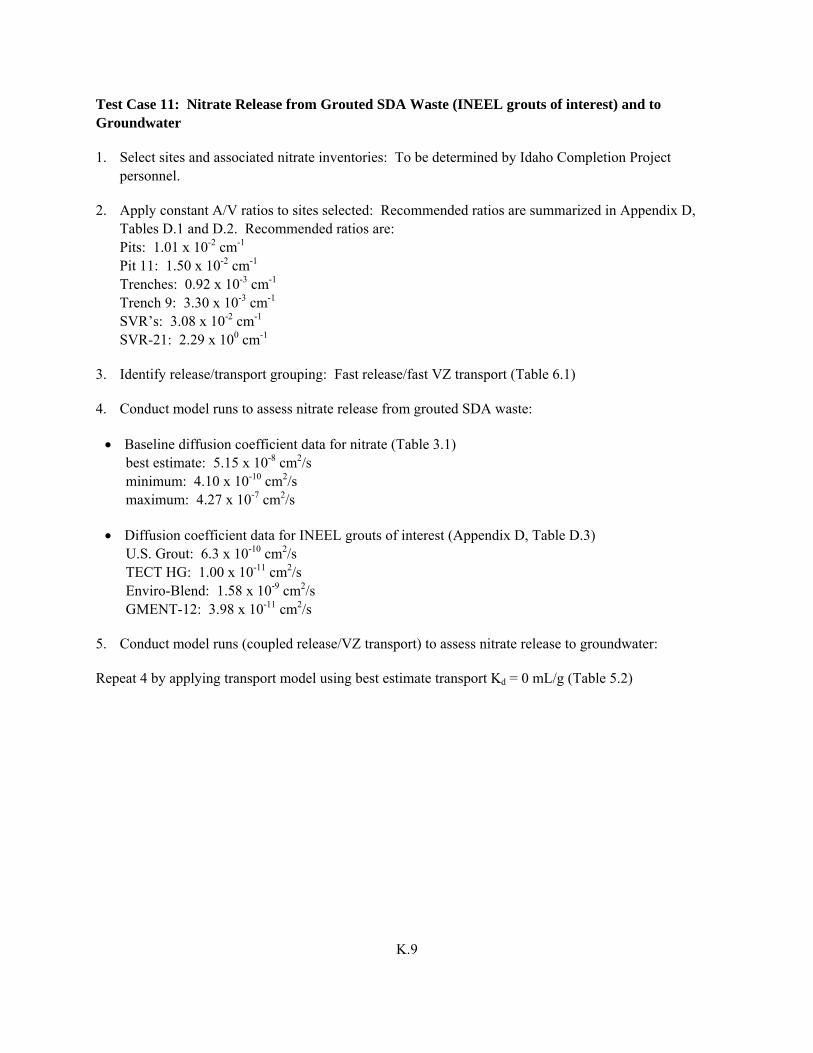
Test Case 11: Nitrate Release from Grouted SDA Waste (INEEL grouts of interest) and to Groundwater
1. Select sites and associated nitrate inventories: To be determined by Idaho Completion Project personnel.
2. Apply constant A/V ratios to sites selected: Recommended ratios are summarized in Appendix D, Tables D.1 and D.2. Recommended ratios are:
Pits: 1.01 x 10⁻² cm-1 Pit 11: 1.50 x 10⁻² cm-1 Trenches: 0.92 x 10⁻³ cm-1 Trench 9: 3.30 x 10⁻³ cm-1 SVR’s: 3.08 x 10⁻² cm-1 SVR-21: 2.29 x 100 cm-1
3. Identify release/transport grouping: Fast release/fast VZ transport (Table 6.1)
4. Conduct model runs to assess nitrate release from grouted SDA waste:
• Baseline diffusion coefficient data for nitrate (Table 3.1) best estimate: 5.15 x 10⁻⁸ cm2/s minimum: 4.10 x 10⁻¹⁰ cm2/s maximum: 4.27 x 10⁻⁷ cm2/s
• Diffusion coefficient data for INEEL grouts of interest (Appendix D, Table D.3) U.S. Grout: 6.3 x 10⁻¹⁰ cm2/s TECT HG: 1.00 x 10⁻¹¹ cm2/s Enviro-Blend: 1.58 x 10⁻⁹ cm2/s GMENT-12: 3.98 x 10⁻¹¹ cm2/s
5. Conduct model runs (coupled release/VZ transport) to assess nitrate release to groundwater:
Repeat 4 by applying transport model using best estimate transport Kd = 0 mL/g (Table 5.2)
K.9
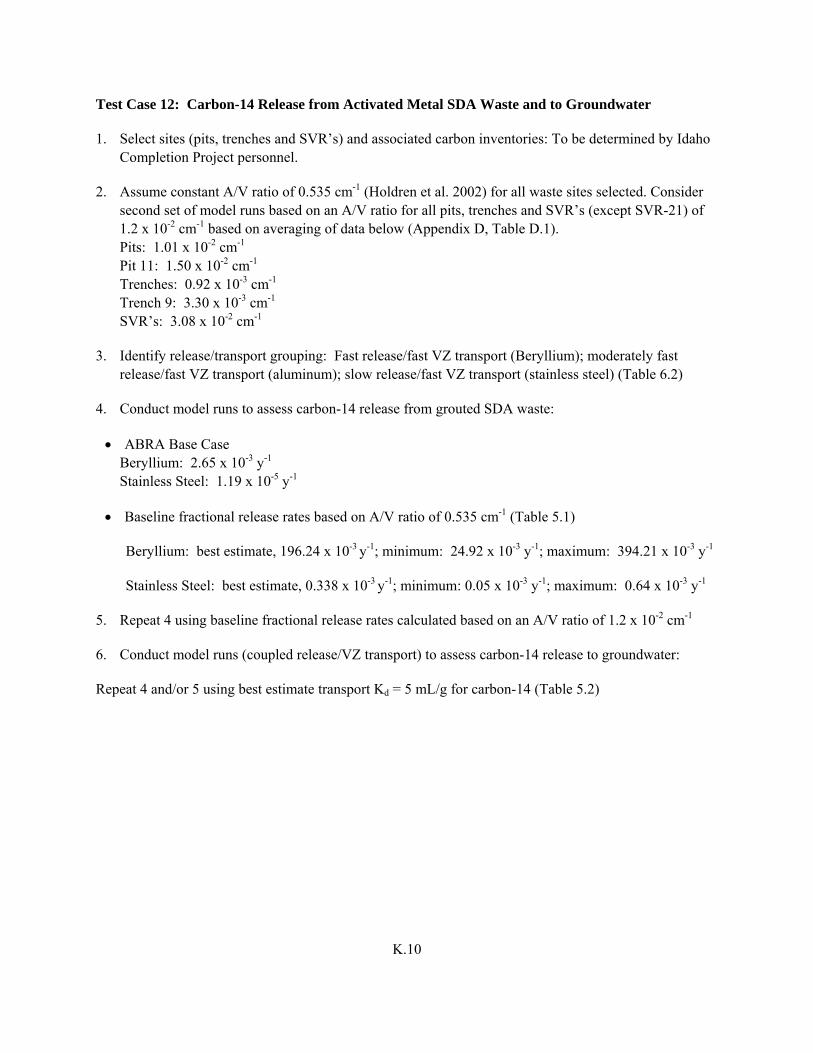
Test Case 12: Carbon-14 Release from Activated Metal SDA Waste and to Groundwater
1. Select sites (pits, trenches and SVR’s) and associated carbon inventories: To be determined by Idaho Completion Project personnel.
2. Assume constant A/V ratio of 0.535 cm-1 (Holdren et al. 2002) for all waste sites selected. Consider second set of model runs based on an A/V ratio for all pits, trenches and SVR’s (except SVR-21) of 1.2 x 10⁻² cm-1 based on averaging of data below (Appendix D, Table D.1).
Pits: 1.01 x 10⁻² cm-1 Pit 11: 1.50 x 10⁻² cm-1 Trenches: 0.92 x 10⁻³ cm-1 Trench 9: 3.30 x 10⁻³ cm-1 SVR’s: 3.08 x 10⁻² cm-1
3. Identify release/transport grouping: Fast release/fast VZ transport (Beryllium); moderately fast release/fast VZ transport (aluminum); slow release/fast VZ transport (stainless steel) (Table 6.2)
4. Conduct model runs to assess carbon-14 release from grouted SDA waste:
• ABRA Base Case Beryllium: 2.65 x 10⁻³ y-1 Stainless Steel: 1.19 x 10⁻⁵ y-1
• Baseline fractional release rates based on A/V ratio of 0.535 cm-1 (Table 5.1)
Beryllium: best estimate, 196.24 x 10⁻³ y-1; minimum: 24.92 x 10⁻³ y-1; maximum: 394.21 x 10⁻³ y-1
Stainless Steel: best estimate, 0.338 x 10⁻³ y-1; minimum: 0.05 x 10⁻³ y-1; maximum: 0.64 x 10⁻³ y-1
5. Repeat 4 using baseline fractional release rates calculated based on an A/V ratio of 1.2 x 10⁻² cm-1
6. Conduct model runs (coupled release/VZ transport) to assess carbon-14 release to groundwater:
Repeat 4 and/or 5 using best estimate transport Kd = 5 mL/g for carbon-14 (Table 5.2)
K.10
K.11
Test Case 13: Carbon Tetrachloride Release from Rocky Flats SDA Waste and to Groundwater
1. Select sites and associated carbon tetrachloride inventories: To be determined by Idaho Completion Project personnel.
2. Apply constant A/V ratios based on sites selected. Recommended ratios are summarized in Appendix D, Tables D.1 and D.2. Recommended ratios are:
Pits: 1.01 x 10⁻² cm-1 Pit 11: 1.50 x 10⁻² cm-1 Trenches: 0.92 x 10⁻³ cm-1 Trench 9: 3.30 x 10⁻³ cm-1
3. Identify release/transport grouping: N/A. The release/VZ transport grouping process is applied when COPC with distinguishing parameter properties exist. This is not the case with VOC. In the case of carbon tetrachloride, behavior is fast release (i.e., high value of diffusion coefficient) and fast VZ transport (very small Kd).
4. Conduct model runs for carbon tetrachloride to assess release from grouted SDA waste:
• ABRA Base Case (Kudera and Brown 1996) Saturated saltstone: 5 x 10⁻⁹ cm2/s (VOC release) Recommended: 1.5 x 10⁻⁸ cm2/s (VOC release)
• Interim Risk Assessment (Becker et al. 1998): 2 x 10⁻⁶ cm2/s (VOC release)
• Baseline diffusion coefficient data for carbon tetrachloride (Table 5.5) best estimate: 1.5 x 10⁻⁸ cm2/s minimum: 5.0 x 10⁻⁹ cm2/s maximum: 5.5 x 10⁻⁶ cm2/s
5. Conduct model runs (coupled release/VZ transport) to assess carbon tetrachloride release to groundwater:
Repeat 4 and apply transport model using transport Kd = 0.12 mL/g (Truex et al. 2001)
Reference
Truex MJ, CJ Murray, CR Cole, RJ Cameron, MD Johnson, RS Skeen, and CD Johnson. 2001. Assessment of Carbon Tetrachloride Groundwater Transport in Support of the Hanford Carbon Tetrachloride Innovative Technology Demonstration Program. PNNL-13560, Pacific Northwest National Laboratory, Richland, Washington.