Recommendations for Standardizing Glucose Reporting...
17
562 Recommendations for Standardizing Glucose Reporting and Analysis to Optimize Clinical Decision Making in Diabetes: The Ambulatory Glucose Profile Richard M. Bergenstal, M.D., 1 Andrew J. Ahmann, M.D., 2 Timothy Bailey, M.D., A.M.C.R., 3 Roy W. Beck, M.D., Ph.D., 4 Joan Bissen, R.D., 1,5 Bruce Buckingham, M.D., 6 Larry Deeb, M.D., 7 Robert H. Dolin, M.D., 8 Satish K. Garg, M.D., 9 Robin Goland, M.D., 10 Irl B. Hirsch, M.D., 11 David C. Klonoff, M.D., FACP, 12 Davida F. Kruger, M.S.N., A.P.N.-B.C., B.C.-A.D.M., 13 Glenn Matfin, M.B., Ch.B., M.Sc. (Oxon)., 1 Roger S. Mazze, Ph.D., 1 Beth A. Olson, B.A.N., R.N., C.D.E., 1 Christopher Parkin, M.S., 14 Anne Peters, M.D., 15 Margaret A. Powers, Ph.D., R.D., C.D.E., 1 Henry Rodriguez, M.D., 16 Phil Southerland, B.S., 17 Ellie S. Strock, A.N.P.-B.C., C.D.E., 1 William Tamborlane, M.D., 18 and David M. Wesley, B.A. 1 Author Affiliations: 1 International Diabetes Center at Park Nicollet, Minneapolis, Minnesota; 2 Harold Schnitzer Diabetes Health Center, Oregon Health and Science University, Portland, Oregon; 3 Institute and University of California, San Diego, San Diego, California; 4 Jaeb Center for Health Research, Tampa, Florida; 5 Park Nicollet Institute, Minneapolis, Minnesota; 6 Lucille Packard Children’s Hospital, Stanford University, Palo Alto, California; 7 Florida State University, Tallahassee, Florida; 8 Lantana Consulting Group, East Thetford, Vermont; 9 Barbara Davis Center for Childhood Diabetes, University of Colorado, Denver, Denver, Colorado; 10 Columbia University Medical Center, New York City, New York; 11 University of Washington, Seattle, Washington; 12 Mills-Peninsula Health Services, San Mateo, California; 13 Henry Ford Health System, Detroit, Michigan; 14 CGParkin Communications Inc., Boulder City, Nevada; 15 University of Southern California, Los Angeles, California; 16 University of South Florida, Tampa, Florida; 17 Team Type 1, Atlanta, Georgia; and 18 Yale University, New Haven, Connecticut Abbreviations: (ADA) American Diabetes Association, (AGP) ambulatory glucose profile, (AUC) area under the curve, (CGM) continuous glucose monitoring, (CV) coefficient of variation, (FDA) Food and Drug Administration, (GV) glycemic variability, (HbA1c) glycated hemoglobin, (IDC) International Diabetes Center, (IQR) interquartile range, (SD) standard deviation, (SMBG) self-monitoring of blood glucose, (T1DM) type 1 diabetes mellitus, (T1D Ex) T1D Exchange Clinical Registry, (T2DM) type 2 diabetes mellitus, (TIR) time in range Keywords: ambulatory glucose profile, continuous glucose monitoring, insulin, type 1 diabetes mellitus Corresponding Author: Richard M. Bergenstal, M.D., International Diabetes Center at Park Nicollet, 3800 Park Nicollet Blvd., Minneapolis, MN 55416-2699; email address [email protected] Journal of Diabetes Science and Technology Volume 7, Issue 2, March 2013 © Diabetes Technology Society Abstract Underutilization of glucose data and lack of easy and standardized glucose data collection, analysis, visualization, and guided clinical decision making are key contributors to poor glycemic control among individuals with type 1 diabetes mellitus. An expert panel of diabetes specialists, facilitated by the International Diabetes Center and sponsored by the Helmsley Charitable Trust, met in 2012 to discuss recommendations for standardizing the analysis and presentation of glucose monitoring data, with the initial focus on data derived from continuous glucose monitoring systems. The panel members were introduced to a universal software report, the Ambulatory Glucose Profile, and asked to provide feedback on its content and functionality, both as a research tool and in clinical settings. This article provides a summary of the topics and issues discussed during the meeting and presents recommendations from the expert panel regarding the need to standardize glucose profile summary metrics and the value of a uniform glucose report to aid clinicians, researchers, and patients. J Diabetes Sci Technol 2013;7(2):562–578 MEETING PROCEEDINGS
Transcript of Recommendations for Standardizing Glucose Reporting...

562
Recommendations for Standardizing Glucose Reporting and Analysis to Optimize Clinical Decision Making in Diabetes:
The Ambulatory Glucose Profile
Richard M. Bergenstal, M.D.,1 Andrew J. Ahmann, M.D.,2 Timothy Bailey, M.D., A.M.C.R.,3 Roy W. Beck, M.D., Ph.D.,4 Joan Bissen, R.D.,1,5 Bruce Buckingham, M.D.,6 Larry Deeb, M.D.,7
Robert H. Dolin, M.D.,8 Satish K. Garg, M.D.,9 Robin Goland, M.D.,10 Irl B. Hirsch, M.D.,11
David C. Klonoff, M.D., FACP,12 Davida F. Kruger, M.S.N., A.P.N.-B.C., B.C.-A.D.M.,13
Glenn Matfin, M.B., Ch.B., M.Sc. (Oxon).,1 Roger S. Mazze, Ph.D.,1
Beth A. Olson, B.A.N., R.N., C.D.E.,1 Christopher Parkin, M.S.,14 Anne Peters, M.D.,15
Margaret A. Powers, Ph.D., R.D., C.D.E.,1 Henry Rodriguez, M.D.,16 Phil Southerland, B.S.,17
Ellie S. Strock, A.N.P.-B.C., C.D.E.,1 William Tamborlane, M.D.,18 and David M. Wesley, B.A.1
Author Affiliations: 1International Diabetes Center at Park Nicollet, Minneapolis, Minnesota; 2Harold Schnitzer Diabetes Health Center, Oregon Health and Science University, Portland, Oregon; 3Institute and University of California, San Diego, San Diego, California; 4Jaeb Center for Health Research, Tampa, Florida; 5Park Nicollet Institute, Minneapolis, Minnesota; 6Lucille Packard Children’s Hospital, Stanford University, Palo Alto, California; 7Florida State University, Tallahassee, Florida; 8Lantana Consulting Group, East Thetford, Vermont; 9Barbara Davis Center for Childhood Diabetes, University of Colorado, Denver, Denver, Colorado; 10Columbia University Medical Center, New York City, New York; 11University of Washington, Seattle, Washington; 12Mills-Peninsula Health Services, San Mateo, California; 13Henry Ford Health System, Detroit, Michigan; 14CGParkin Communications Inc., Boulder City, Nevada; 15University of Southern California, Los Angeles, California; 16University of South Florida, Tampa, Florida; 17Team Type 1, Atlanta, Georgia; and 18Yale University, New Haven, Connecticut
Abbreviations: (ADA) American Diabetes Association, (AGP) ambulatory glucose profile, (AUC) area under the curve, (CGM) continuous glucose monitoring, (CV) coefficient of variation, (FDA) Food and Drug Administration, (GV) glycemic variability, (HbA1c) glycated hemoglobin, (IDC) International Diabetes Center, (IQR) interquartile range, (SD) standard deviation, (SMBG) self-monitoring of blood glucose, (T1DM) type 1 diabetes mellitus, (T1D Ex) T1D Exchange Clinical Registry, (T2DM) type 2 diabetes mellitus, (TIR) time in range
Keywords: ambulatory glucose profile, continuous glucose monitoring, insulin, type 1 diabetes mellitus
Corresponding Author: Richard M. Bergenstal, M.D., International Diabetes Center at Park Nicollet, 3800 Park Nicollet Blvd., Minneapolis, MN 55416-2699; email address [email protected]
Journal of Diabetes Science and Technology Volume 7, Issue 2, March 2013 © Diabetes Technology Society
AbstractUnderutilization of glucose data and lack of easy and standardized glucose data collection, analysis, visualization, and guided clinical decision making are key contributors to poor glycemic control among individuals with type 1 diabetes mellitus. An expert panel of diabetes specialists, facilitated by the International Diabetes Center and sponsored by the Helmsley Charitable Trust, met in 2012 to discuss recommendations for standardizing the analysis and presentation of glucose monitoring data, with the initial focus on data derived from continuous glucose monitoring systems. The panel members were introduced to a universal software report, the Ambulatory Glucose Profile, and asked to provide feedback on its content and functionality, both as a research tool and in clinical settings. This article provides a summary of the topics and issues discussed during the meeting and presents recommendations from the expert panel regarding the need to standardize glucose profile summary metrics and the value of a uniform glucose report to aid clinicians, researchers, and patients.
J Diabetes Sci Technol 2013;7(2):562–578
MEETING PROCEEDINGS

563
Recommendations for Standardizing Glucose Reporting and Analysis to Optimize Clinical Decision Making in Diabetes: The Ambulatory Glucose Profile Bergenstal
www.journalofdst.orgJ Diabetes Sci Technol Vol 7, Issue 2, March 2013
Introduction
An expert panel of diabetes specialists met in Tampa, FL, March 28–29, 2012, to discuss the utility of continuous glucose monitoring (CGM) in clinical practice and research applications. Representatives from the U.S. Food and Drug Administration (FDA) and Health Level Seven International and a type 1 diabetes mellitus (T1DM) patient advocate were also in attendance. The 2-day meeting was hosted and facilitated by the International Diabetes Center (IDC), Minneapolis, MN, and funded by the Helmsley Charitable Trust. The purpose of the meeting was to develop recommendations for standardizing the analysis and presentation of glucose monitoring data, with the initial focus on data derived from CGM systems. The panel acknowledged that self-monitoring of blood glucose (SMBG) was currently the predominate mode of glucose monitoring in diabetes and additional conferences were needed to address the issues particularly relevant to reporting and analysis of SMBG data even though there is considerable overlap between SMBG and CGM standardization.
As a starting point for standardization discussions, the panel members were introduced to a universal software report, the Ambulatory Glucose Profile (AGP), created by Mazze and coauthors1 and further developed by the IDC2 and asked to provide feedback on its content and functionality, both as a research tool and in clinical settings. This article provides a summary of the topics and issues discussed during the meeting and presents recommendations from the expert panel regarding the value of a uniform glucose report to clinicians, researchers, and patients. Directly following the expert panel discussions, a brief summary of the preceding discussion and recommendations was presented to representatives of medical device companies involved in glucose monitoring for reaction and feedback.
Critical Issues Impacting Diabetes ManagementSeveral issues potentially impacting the effectiveness of diabetes management were presented to the group to provide context for the meeting and outline the rationale for standardization of glucose data reporting. Many of the barriers to optimal glycemic control discussed here apply to both T1DM and type 2 diabetes mellitus (T2DM), particularly T2DM patients treated with insulin, but time constraints at the meeting and space constraints here only allow for a focus on T1DM. The following is a summary of the issues discussed at the expert panel.
Suboptimal Glycemic Control in Type 1 Diabetes MellitusDespite advances in insulin preparations, insulin delivery devices, and glucose monitoring technology, glycemic control in most T1DM patients is suboptimal. Published data3 from the T1D Exchange Clinical Registry (T1D Ex), which maintains health records on over 26,000 participants with T1DM from 68 clinics throughout the United States, reveals that the average glycated hemoglobin (HbA1c) among younger patients ranges from 8.3% to 8.7% (≤25 years); average HbA1c among older patients is only somewhat better at approximately 7.7%. Interestingly, among the adult and pediatric age group participants in the T1D Ex, improved glycemic control (lower HbA1c levels) was associated with CGM use and more frequent SMBG, insulin pump use, white race, higher household income, higher participant or parent education, and private insurance. While the data from these 68 clinics, expert in the management of T1DM, may not be completely representative of the entire U.S. population of individuals with T1DM, they clearly identify some important associations between epidemiologic characteristics or approaches to management with metabolic and clinical outcomes, thus suggesting areas for further investigation.3,4
Suboptimal glycemic control is often the result of poor adherence to prescribed insulin regimens; however, studies have shown that many T1DM patients are reluctant to follow and/or adjust their insulin regimens as needed.5–7 T1D Ex data confirm that missing insulin doses, avoiding insulin at the start of the meal, and not working to refine insulin-to-carbohydrate ratios at each meal are also associated with a higher HbA1c.8 Poor adherence to insulin therapy may also be due to fear of hypoglycemia.9 Patients quickly learn that severe hypoglycemia is potentially dangerous, physically punishing, and a source of possible social embarrassment.10 Cryer11 has established that hypoglycemia is the limiting factor in optimizing glycemic control in both T1DM and T2DM. A study by Anderbro and coauthors12 identified frequency of severe hypoglycemia as the most significant factor associated with fear of low glucose levels in adults
564
Recommendations for Standardizing Glucose Reporting and Analysis to Optimize Clinical Decision Making in Diabetes: The Ambulatory Glucose Profile Bergenstal
www.journalofdst.orgJ Diabetes Sci Technol Vol 7, Issue 2, March 2013
with T1DM. Strategies and technologies that can improve clinician and patient understanding of glucose patterns and facilitate therapy intensification while reducing the frequency and fear of hypoglycemia may, in turn, improve overall glycemic control in diabetes.
Limitations of Glycated Hemoglobin as the Sole Measure of Glycemic ControlGlycated hemoglobin is the glycemic marker most linked to the complications of diabetes and remains a key component of diabetes management, but is not without controversy.13 While an elevated HbA1c was clearly the major factor identified as the cause of diabetic retinopathy in the Diabetes Control and Complications Trial, HbA1c still accounted for only approximately 11% of the variation in risk between intensive and standard glycemic control patients.14 A clear limitation of this measure of average glucose control or glucose exposure over 2–3 months is the inability of the HbA1c to characterize diurnal glucose patterns, which are critical to understand for safe, effective, and timely insulin adjustment and informed clinical decision making. Patients with similar HbA1c values can have markedly dissimilar patterns of glucose excursions and rates of hypoglycemia throughout the day and overnight.
Including the amount or severity of hypoglycemia in any measure of overall glucose control is particularly relevant in light of growing evidence that links severe hypoglycemia to excessive morbidity and mortality.15–18 In addition, persistent glucose excursions are associated with increased oxidative stress and the generation of potentially harmful reactive oxygen species.19 While glucose variability has not been shown in a randomized controlled trial to directly result in diabetes complications, there are strong associations between glucose variability and increased carotid intima media thickening and the risk of microvascular complications.20,21 Determining the effects of acute and long-term glucose variability on diabetes complications will require additional studies in both inpatient and outpatient settings.22
The fact that increased glycemic variability (GV) is a strong predictor of hypoglycemia23,24 and is also correlated with poor glycemic control25 is probably the most compelling reason to identify and to work to minimize GV today. Glycemic variability, independent from other measures of glycemic control, is predictive of patient satisfaction with an intensive insulin regimen.26 This is worth noting as health care teams strive to achieve the triple aim of improved quality and patient experience at a reasonable cost.27 Although data from SMBG can reveal gross patterns of GV, its episodic nature often overlooks significant glucose excursions.28 There are numerous case reports of significant and potentially dangerous hypoglycemia, particularly overnight, or hyperglycemic excursions after meals that are missed with SMBG monitoring but are evident with CGM. Evaluating the additional data and glucose patterns that CGM provides can enable a meaningful change in lifestyle or drug therapy.
Many feel it is time to establish a definition of optimal glycemic control that includes HbA1c being at target (personalized for each individual, but somewhere around 7% for many adults) without any severe hypoglycemia and only a minimal number of very low or dangerously low glucose values.29 Continuous glucose monitoring reported in a standardized way along with HbA1c would foster a precise definition of this composite goal. Using a standardized composite goal, the medical community could establish with more confidence whether or not a particular insulin formulation, a new technology for insulin delivery, or an innovative patient-centered approach to care was an important factor in helping individuals with diabetes reach optimal glycemic control. At this time, minimizing GV is a treatment goal that, if achieved, can help one reach an acceptable HbA1c without excessive hypoglycemia. If GV is shown in randomized trials to be an independent causative factor in diabetes complications and the definition of variability is standardized, it could be added to the optimal glucose control composite target. Additionally, if CGM becomes the standard research and clinical tool to evaluate and manage glycemic control, a logical glycemic goal would be to maximize time in target range, also known as time in range (TIR).30,31 To make TIR more broadly acceptable as a research end point or clinical measure, it would need to be qualified with the addition of some measure that quantifies the amount and severity of accompanying hypoglycemia. Further studies will need to be conducted to define what is an acceptable and achievable TIR and the accompanying acceptable level of hypoglycemia for a variety of patient groups from pediatrics to the frail elderly.
While this discussion focuses on glycemic control, it is important to note that other composite targets for good diabetes management are being explored (HbA1c+hypoglycemia+wt gain32,33 or HbA1c+low-density lipoprotein+blood pressure34

565
Recommendations for Standardizing Glucose Reporting and Analysis to Optimize Clinical Decision Making in Diabetes: The Ambulatory Glucose Profile Bergenstal
www.journalofdst.orgJ Diabetes Sci Technol Vol 7, Issue 2, March 2013
or HbA1c+low-density lipoprotein+blood pressure+aspirin if high risk cardiovascular disease+no tobacco use35,36). These composites emphasize the importance of taking a multifactorial approach to reducing diabetes complications, in particular, cardio-vascular disease.37
Underutilization of Continuous Glucose MonitoringContinuous glucose monitoring can provide immediate (real-time) feedback on current glucose levels and trends (direction and rate of change), as well as retrospective data that can reveal patterns of glycemic control over specified time periods and glucose metrics that can be compared from visit to visit or for research analysis. Continuous glucose monitoring devices measure glucose levels in interstitial fluid in 1 or 5 min increments (depending on the system used) on a continuous basis. Use of CGM has been demonstrated to be associated with improved glycemic control in both children and adults in the T1D Ex.38 Additionally, studies have shown CGM use to be effective in improving HbA1c levels and reducing the risk of hypoglycemia in subjects with poorly controlled T1DM and T2DM,39–43 even in patients already utilizing insulin pump therapy.44 A meta-analysis showed that using real-time CGM compared with SMBG reduced HbA1c and reduced hypoglycemia.45 A second meta-analysis showed that using CGM with insulin pump therapy compared with SMBG and multiple daily insulin injections resulted in a lower HbA1c with no increase in hypoglycemia.46 Trials have also demonstrated that CGM is beneficial for T1DM patients who have already achieved excellent control47 and that safe and efficacious CGM use in children and adults can be sustained over time.48–51 Despite the benefits of CGM, adoption of this technology in clinical practice has been very slow. Only 3% of young patients (≤25 years) in T1D Ex use CGM for their diabetes management; CGM use among older T1DM patients (26–49 years) is slightly higher at 14%.3
Although underutilization of CGM is often attributed to limited reimbursement and patients’ and parents’ perceptions regarding the complexity and inconvenience of CGM use, clinician reluctance is also a key issue. This may be due to the lack of experience/expertise of clinicians in determining the most appropriate candidates for CGM or in interpreting CGM data. There are also time constraints and the potential disruption of workflow associated with CGM initiation, downloading, and interpretation in clinical practices. Lack of a relatively simple or (at least) straightforward and intuitive statistical and graphic visualization of the glucose data via download software is a major contributor to the uncertainty and reluctance of clinicians to incorporate CGM into their practices. In addition, people with diabetes who were very strong advocates in the 1980s for the use of SMBG have been less vocal regarding their desire to utilize CGM. This is, in part, because patients have not been actively engaged in viewing data displays and understanding how glucose data and patterns might guide them to optimize insulin delivery or lifestyle choices. Despite the fact that CGM provides a means of better characterizing glucose control and may improve the management of many patients with diabetes, there remains a desire on the part of patients, providers, and researchers to see continued progress in making the technology more accurate and more convenient.
Lack of Standardization of Glucose ReportingCurrently, there are three commercial CGM device manufacturers: DexCom, Medtronic, and Abbott (currently available in Europe). Each of these manufacturers provides software to download and analyze the CGM data and generate a report or series of reports. Although there are some similarities between the various software programs, there is no standardization regarding which statistics are reported or how the data are presented graphically nor is there common terminology for the various analyses presented. Moreover, the sheer diversity and number of reporting options creates such a daunting “learning curve” that many clinicians never invest the time necessary to even start using CGM technology, let alone attempt to become proficient in its use. More focus on patient-friendly presentations of the data would also be of great benefit.
Common definitions and metrics are needed in order to assess patient status, make more informed clinical decisions, and evaluate the performance of clinicians (e.g., Has the percentage of time patients are in good glycemic control improved? Are patients in good control with fewer low, very low, and dangerously low glucose readings?) Standardization of clinical terms and metrics allows a more accurate assessment of individual patients and comparisons of progress from visit to visit. Patient populations, diabetes medications, new technology, and systems of care can more effectively be assessed, thus facilitating efficient clinical decision making and appropriate design of clinic process and flow.

566
Recommendations for Standardizing Glucose Reporting and Analysis to Optimize Clinical Decision Making in Diabetes: The Ambulatory Glucose Profile Bergenstal
www.journalofdst.orgJ Diabetes Sci Technol Vol 7, Issue 2, March 2013
Standardization also has the potential to make patient care and clinical research more efficient from a reimbursement and regulatory standpoint.
SummaryIn light of the data, it is clear that most children and adults with T1DM are not in optimal glycemic control. While the around-the-clock demanding nature of this disease explains much of the difficulty in achieving good glycemic control, there are factors that can be improved, such as facilitating adherence to principles of effective insulin delivery and minimizing the occurrence and, thus, fear of dangerous hypoglycemia. Other factors such as use of HbA1c as the primary or often sole measurement of glucose control and underutilization of glucose data by clinicians and patients also contribute to the problem.
Given the demonstrated benefits of CGM in managing glycemia and reducing hypoglycemia, which can potentially lead to greater patient adherence and improved clinical outcomes, it is imperative that health care providers, clinical researchers, industry, regulators, and payers work together to find ways to expand appropriate adoption of CGM use in clinical practice. An important first step in this effort is to standardize the reporting and analysis of CGM data and create a universal template in which data are presented in a predictable, easy-to-view format while allowing users to customize settings (e.g., glucose target range) for each patient and to perform more in-depth analyses of the data as desired. Standardized reporting and analysis of CGM data would help clinicians develop expertise in CGM use, enhance quality of care through enhanced pattern recognition, improve practice efficiencies with minimal disruption of workflow, and engage patients, thereby reinforcing consistent use of CGM technology.
Standardization of Glucose Reporting, Analysis, and Clinical Decision MakingThe second part of the meeting focused on a discussion of the relevant metrics and defaults that require standardization for initial review and analysis of CGM data. The key metrics/defaults identified by the group were target range, glucose exposure, GV, hypoglycemia, and hyperglycemia. After considerable open discussion, panel members provided their input on each metric/default via an electronic audience response system, allowing us to tabulate their opinions. The following is a summary of the panel’s responses and justification for metrics selected for the simplified clinical AGP report and the expanded research AGP report.
Target RangeMost panel members (56%) selected 70–180 mg/dl as the default target range. While not an ideal or normal glucose range, it represents a target range commonly used in clinical practice and one that promotes realistic and safe expectations. It has been shown with SMBG data, and, to a certain extent, with CGM data, that, if 50% of the readings are in this range, the HbA1c will usually be around 7%.52 Some of the panel voted for 70–140 mg/dl to get a sense of how close to ideal control the patient had come but agreed this could be saved for an expanded or research view.
The notion of TIR was felt to be an important concept that needs to be standardized for clinical care, research, and regulatory purposes.53 TIR can be expressed as percentage of readings in range (primary AGP output) and hours per day in range (secondary AGP output). Both of these are easy for patients to understand and can be followed over time for signs of improvement. The time above and below the target range should also be prominently displayed, and it is important to agree on a series of divisions of the ranges below and above the target that convey the severity of hypoglycemia and hyperglycemia experienced by the patient. TIR is a logical clinical management and clinical research outcome metric that would be more meaningful or reliable if also combined with the degree or severity of hypoglycemia and hyperglycemia.
Glucose ExposureOverall, more than three-quarters (82%) of the panel members were neutral or considered a glucose exposure metric to be of little value for clinical management. Nevertheless, when evaluating options for reporting glucose exposure [area under the curve (AUC) for 24 h, AUC normalized hourly, excess AUC for 24 h, mean glucose of all readings,

567
Recommendations for Standardizing Glucose Reporting and Analysis to Optimize Clinical Decision Making in Diabetes: The Ambulatory Glucose Profile Bergenstal
www.journalofdst.orgJ Diabetes Sci Technol Vol 7, Issue 2, March 2013
median glucose of all readings], 82% of panel members chose mean glucose of all readings as the metric to which clinicians and patients can most easily relate. Although mean/median glucose of all readings was not considered critical to clinical decision making, most (59%) participants indicated that mean glucose exposure for specific time periods (e.g., overnight, fasting, 2–4 h postprandial) could be helpful in evaluating the effects of food, exercise, or insulin. Because HbA1c is not always available when the CGM report is being reviewed, it seems appropriate to include the estimated HbA1c55 based on the average glucose. Finally, it was agreed that having the actual AUC glucose exposure data can be a helpful clinical research metric.
Glycemic VariabilityThe majority (69%) of panel members indicated that standard deviation (SD) was the metric most commonly used and understood for assessing and reporting GV. In a 2010 review titled Glucose Variability: Does It Matter?, DeVries and coauthors22 concluded that SD was the easiest and best validated measure for quantifying variability from CGM.Rodbard56 greatly expanded the dialogue on SD, concluding it is a reasonable measure because most other measures being considered are related in a linear manner to SD. Rodbard explains that, in addition to total SD, which most investigators and automated programs calculate, there are actually at least eight different components of SD that all have potential research or clinical merit, including some fairly commonly recognized as intraday SD (SD within a day) and interday SD (SD between days). Many authors point out that, if the distribution of glucose data collected from CGM were Gaussian, distributed normally around the mean, then SD would be a very reliable clinical and research measure of GV. However, nearly all agreed that real-world patient CGM data come in a variety of shapes and are invariably skewed. Some very novel and important methods of nonlinear transformation of the glucose scale to achieve a nearly symmetrical or Gaussian distribution has allowed Kovatchev and coauthors56,57 and others to define indices of risk for low and high glucose.
The panel acknowledged that there are many ways to analyze or transform glucose data to measure one component or another of GV, including SD, coefficient of variation (CV), interquartile range (IQR), mean amplitude of glucose excursion, M-value, mean of daily difference, continuous overall net glycemic action, and others; however, they focused on three: SD, CV, and IQR. Standard deviation was selected for ease of use, familiarity, and correlation with other factors, despite the drawback of most real-world data not being normally distributed. Another perceived drawback for SD and some other measures of GV is their dependence on measures of mean glucose level or HbA1c. Percentage of coefficient of variance or variation, derived from SD (100 × SD/mean of observations), was also selected by the panel as one component of GV to follow. This measure was proposed by Rodbard58 as the best parameter to use to characterize GV because it is relatively more constant than other measures, irrespective of mean glucose or HbA1c, which we know can vary in T1DM. Although this makes CV a good marker to follow for research purposes, CV is not easily displayed in a visual fashion, so it is less helpful as part of the CGM clinical view. The third GV factor that the panel considered worthy of including was IQR, the only commonly recognized method of expressing GV that is not dependent on the assumption of normal distribution; it simply takes the difference between the 75th and 25th percentiles of glucose values, and that 50% of glucose values is called the IQR, which has long been considered to be the most logical and visually understandable way to express GV using SMBG,1,55 and it has been shown to have equal clinical utility in analyzing and visualizing CGM data.2 If CGM data are collected for an adequate amount of time (discussed later in this article) and the data are displayed as a modal day, then IQR provides a reliable (not influenced by non-Gaussian distribution) aggregate measure of GV, and it allows one to easily visualize the time of day or relationship to a meal or medication when there is high GV, which may need clinical attention. An increasing number of studies are showing that high GV must be addressed if one is to improve the overall mean glucose or HbA1c and that one must work to reduce a high GV in order to minimize the risk of hypoglycemia.23–25 While a value for SD or CV might also indicate a problem with excessive GV (once the community agrees on the definition of excessive), there is the additional potential clinical benefit of being able to visualize GV hour-by-hour throughout the day as reliably portrayed by the IQR.
Most (64%) panel members saw little or no value in reporting glycemic stability [rate of change in glucose measured from the median curve (mg/dl/h)]; 29% were neutral on this metric and felt that, because it was a different measure than classic GV, it could be further explored in a research view as desired.
568
Recommendations for Standardizing Glucose Reporting and Analysis to Optimize Clinical Decision Making in Diabetes: The Ambulatory Glucose Profile Bergenstal
www.journalofdst.orgJ Diabetes Sci Technol Vol 7, Issue 2, March 2013
HypoglycemiaThe discussion of hypoglycemia focused on two main issues: cut points for hypoglycemia and the definition of severe hypoglycemia. The majority (88%) of panel members selected <70 mg/dl as the criteria for “reportable hypoglycemia.” This value agrees with what most clinicians use in practice and publications as well as what the FDA used in their guidance regarding the conduct and evaluation of artificial pancreas clinical trials, where the degree of hypoglycemia is a major consideration.31 This is similar to the 2005 American Diabetes Association (ADA) Workgroup59 report on hypoglycemia (which used ≤70 mg/dl as the definition of hypoglycemia) and consistent with 2013 ADA Standards of Medical Care,60 which states in the summary of glycemic recommendations that the preprandial capillary plasma glucose goals are 70–130 mg/dl (with room for individualization), so logically, below this would represent hypoglycemia. The panel felt that there needed to be some additional gradation or separation of hypoglycemia into buckets or categories so that the patient, clinician, researcher, or regulatory agency can better quantify the severity of hypoglycemia. The majority (53%) of participants were satisfied with <55 mg/dl as criteria for more significant hypoglycemia. After the panel, further correspondence led to both hypoglycemia and hyperglycemia being divided into three categories of severity. For hypoglycemia, it is <70 mg/dl (3.9 mmol/liter), <60 mg/dl (3.3 mmol/liter), and <50 mg/dl (2.8 mmol/liter) corresponding to the glucose being considered low, very low, or dangerously low, respectively (Figure 1). These three levels of severity of hypoglycemia are also the ones frequently referenced as being worthy of note in the final FDA artificial pancreas guidance, which is one of the first FDA documents to acknowledge the use of CGM as an outcome marker.31 There is also a clinical category of severe hypoglycemia (e.g., requiring assistance from another person). The panel acknowledged that this definition of severe hypoglycemia was almost universally accepted, but 79% of the panel felt that there needed to be another subcategory of severe hypoglycemia, which they suggested be called major hypoglycemia (requiring medical personnel intervention in the home or an emergency center, hospitalization, seizure, coma, or death). This seemed necessary because quantifying severe hypoglycemia can be difficult given that the term “requiring assistance” is subjective, hard to collect from claims data or electronic medical records, and often not appropriate in pediatrics, where hypoglycemia of any severity often requires assistance. It was also felt that administering glucagon by lay individuals should qualify as major hypoglycemia, but again, this is somewhat subjective and can also be hard to capture reliably.
In addition to the percentage of glucose values below these thresholds, hypoglycemia would be quantified by the time in each range of hypoglycemia and the number of episodes (defined as at least 10 consecutive min below the criteria) of each range of hypoglycemia per day, as discussed earlier (target range).
Finally, the panel acknowledged that there are other important categories or classifications of hypoglycemic events such as the ADA Workgroup on Hypoglycemia report discussed earlier.59 This report classifies a hypoglycemic event as severe (requiring assistance), documented symptomatic (symptoms and glucose ≤70 mg/dl), asymptomatic (no typical symptoms but glucose ≤70 mg/dl), probable symptomatic (typical symptoms but no glucose available), and relative (typical symptoms but glucose >70 mg/dl). These classifications are helpful and are considered the standard approach to classification of hypoglycemia if CGM is not being utilized; however, if continuous glucose data are used in clinical practice or clinical trials, then the classification system proposed here with documenting severe and major hypoglycemic events, along with percentage of readings, time spent, and number of episodes of glucose readings <70, <60, and <50 mg/dl, may allow the medical community to more clearly define safe glycemic control and be able to effectively compare treatments and strategies for reducing hypoglycemia. The ADA, FDA, and European Medicines Agency, along with other organizations, will need to continue to work to define what constitutes a meaningful reduction in hypoglycemia in the era of increasingly more accurate and frequently utilized CGM, but that work must start with standard definitions of hypoglycemia.
HyperglycemiaPanel members agreed that there should be several levels of severity of hyperglycemia above the upper range of the treatment target of 180 mg/dl that have some relevance to clinical practice. Many felt significant hyperglycemia should be >250 mg/dl (43%) and 25% felt it should be even higher, such as >300 or 400 mg/dl. Again, in trying to be consistent in quantifying the severity of hyperglycemia into three levels, we propose >180 mg/dl (10.0 mmol/liter), >250 mg/dl (13.9 mmol/liter), and >400 mg/dl (22.2 mmol/liter) corresponding to the glucose being considered high, very high,

569
Recommendations for Standardizing Glucose Reporting and Analysis to Optimize Clinical Decision Making in Diabetes: The Ambulatory Glucose Profile Bergenstal
www.journalofdst.orgJ Diabetes Sci Technol Vol 7, Issue 2, March 2013
Figure 1. Glucose target ranges and categories. Dx, diagnosis; DKA, diabetic ketoacidosis; Glu, glucose; Hypo, hypoglycemia; Maj, major; ER, emergency room; admit, admittance.
or dangerously high, respectively (Figure 1). As with hypoglycemia, there is a clinically based category of severe hyperglycemia, called diabetic ketoacidosis, which is a clinical diagnosis only in part related to hyperglycemia but also including acidosis and ketosis. While the criteria for hyperglycemia severity are arbitrary, they do represent values that are commonly used in clinical practice to signal an advancing degree of concern, and many clinical or nursing guidelines are associated with these numbers to increase aggressiveness of clinical management (e.g., increase fluid intake, give an additional or increased insulin correction dose, change insulin infusion set if using a pump, or check urine or capillary ketones) or initiate more frequent phone, electronic, or in-person contact.
Proposed Ambulatory Glucose Profile “Dashboard”The IDC has developed a data-analysis software program (captūr AGP™) that statistically and visually represents glycemic exposure, variability, stability, and TIR over a period of time using downloaded CGM or SMBG data.2 The visual report allows clinicians, educators, and patients to identify glucose patterns and areas of highest clinical concern so that lifestyle and pharmacologic therapy can be adjusted appropriately.

570
Recommendations for Standardizing Glucose Reporting and Analysis to Optimize Clinical Decision Making in Diabetes: The Ambulatory Glucose Profile Bergenstal
www.journalofdst.orgJ Diabetes Sci Technol Vol 7, Issue 2, March 2013
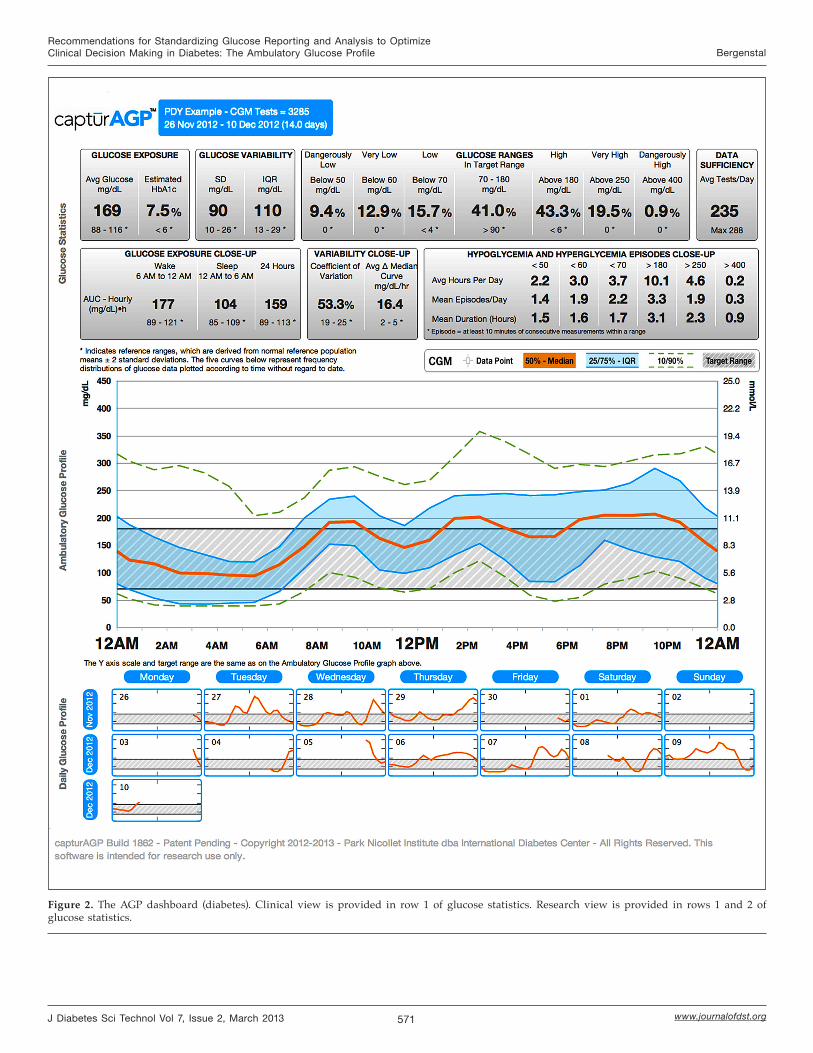
Panel members were asked to evaluate a preliminary draft of the AGP and provide input regarding its content, statistical default settings, graphic elements, and overall functionality. The primary focus was a “simplified” single-page document to be used in clinical practice or in communicating with a patient. Some thought was given to expanded parameters for use in clinical trials or more detailed clinical analysis. This first version was to focus on glucose data only, while later versions can incorporate other insulin pump, lifestyle, and pharmacologic information. Figure 2 presents the most recent version of the proposed AGP developed by the IDC, which incorporates input from the panel. Figure 3 shows an AGP from an individual without diabetes and is representative of a normal reference population.2 This comparison, while not the expected outcome for most patients, serves as a helpful reference tool for clinicians and patients to see graphically how tightly regulated the glucose is in individuals without diabetes.
The AGP “dashboard” serves as the default page of the software program and is designed to present the most relevant statistical and graphical information that would allow clinicians to quickly assess the glycemic status of a patient and make meaningful clinical decisions, in most cases, while the patient is also viewing the dashboard and providing helpful insights and feedback.
As shown in Figure 2, the AGP dashboard presents a summary of the glucose data of patients in three parts: (1) statistical summary, (2) visual display, and (3) daily views. For a comprehensive prospective glucose analysis, it is recommended that patients collect approximately 14 days of CGM data. In a series of analyses of CGM data in T1DM and T2DM, 14 days of CGM data gave a very accurate, relatively stable reflection of the key glucose metrics discussed previously, and the modal day display of glucose medians, peaks, troughs, and variability were highly reflective of what the display would look like after 30 days of CGM use in most patients.61 Although fewer days of CGM data can be analyzed, approximately 14 days, displayed as an AGP, gives the patient and clinician an acceptable degree of confidence to make clinical decisions in most cases without having to normalize or transform the data into other tables, graphics, or indices to assist with management. Seven to 10 days of CGM data may provide enough data for reasonable clinical decision making if 14 days of data are not available or according to the clinician’s judgment. Additional indices or composite measures may be helpful for research and may be employed to meet the needs of certain patients.
Part 1: Statistical Summary The statistical summary presents groupings of data components (Figure 2). The box at the top of the dashboard presents the patient name, date range, and total number of CGM tests. If using a CGM device that measures glucose at 5 min increments, the maximum number of tests would be 288 per day, 2017 over 7 days, and 4032 over 14 days. Patients often achieve approximately 70–80% of 14-day goal or 2822–3225 tests.62b
In the first row of data, the glucose exposure box presents the average glucose and estimated HbA1c based on collected data. The glucose variability box presents the SD (total SD) and IQR of the collected data. Within the glucose ranges, collected data are presented as a percentage of values in target range (default 70–180 mg/dl) bounded by low ranges [low (<70), very low (<60), dangerously low (<50)] and high ranges (high (>180), very high (>250), dangerously high (>400)].
The data sufficiency box provides guidance to clinicians regarding whether the amount of data is sufficient in reflecting the actual glucose status of the patient. The average tests/day is automatically generated depending on which device is downloaded. The maximum is 288/day if glucose is measured at 5 min increments, 144/day if measured at 10 min increments. This information allows clinicians to verify the glucose sampling frequency of patients’ devices and provides a quick check to see if the patient captured most of the possible tests per day.
Only the first row of the statistical summary shows up as the default or dashboard clinical view of AGP. With a click, one can expand to a second row of statistical variables (the research view of AGP) that include: glucose exposure close-up, variability close-up, and hypoglycemia and hyperglycemia episodes close-up.
The glucose exposure close-up displays the hourly average (mean of the hourly averages or AUC for three segments: wake (daytime, 6:00 am to midnight), sleep (nocturnal, midnight to 6:00 am), and 24 h. There is growing consensus among
571
Recommendations for Standardizing Glucose Reporting and Analysis to Optimize Clinical Decision Making in Diabetes: The Ambulatory Glucose Profile Bergenstal
www.journalofdst.orgJ Diabetes Sci Technol Vol 7, Issue 2, March 2013
Figure 2. The AGP dashboard (diabetes). Clinical view is provided in row 1 of glucose statistics. Research view is provided in rows 1 and 2 of glucose statistics.

572
Recommendations for Standardizing Glucose Reporting and Analysis to Optimize Clinical Decision Making in Diabetes: The Ambulatory Glucose Profile Bergenstal
www.journalofdst.orgJ Diabetes Sci Technol Vol 7, Issue 2, March 2013
Figure 3. The AGP dashboard (normal).

573
Recommendations for Standardizing Glucose Reporting and Analysis to Optimize Clinical Decision Making in Diabetes: The Ambulatory Glucose Profile Bergenstal
www.journalofdst.orgJ Diabetes Sci Technol Vol 7, Issue 2, March 2013
clinicians and trial investigators that if the wake and sleep times are not known or documented, these are reasonable default times with the intention of making the default nocturnal time narrow, so it has high probability of reflecting the sleep, nocturnal, or basal time segment.
The variability close-up presents the CV as a percentage (SD/N × 100), which is often used for tracking change in overall GV in research studies. Stability of glucose is defined as mean hourly change from the median curve (mg/dl)/h. This reflects the average stability represented as the change in glucose per hour measured along the median glucose curve over the day. Individuals with diabetes can have fluctuations in glucose with a high or low degree of variability or consistency. While the clinical significance of glucose fluctuations is not known, significant glucose fluctuations do not occur in individuals with normal glucose metabolism.
The hypoglycemia and hyperglycemia episodes close-up addresses the considerable clinical and research interest in how much time patients spend in the target range or above or below the target. Since the more time patients spend in the extremes of low or high glucose is known to be detrimental, it can be helpful to record this information in several ways. While the target range panels (in the first row or default dashboard view) express this as the percentage of CGM readings in each range, this panel gives three additional measures: average hours per day, mean episodes/day, and mean duration (hours). Average hours per day presents the percentage of values in each range of below target, in target, and above target. Mean episodes/day presents the mean of episodes in each range. An episode is defined as at least 10 min of consecutive measurements within a given range (or three consecutive readings if glucose is measured at 5 min increments). Once the readings are below or above a target and last for three readings (10 min), the episode continues until reading moves into a new target zone. Over time, the research community needs to determine if the number of episodes or the cumulative time spent in hypoglycemia or hyperglycemia is most impactful on quality of life or risk of complications.
Note that below each data component or panel in the statistical summary section is a reference range derived from a normal reference population (mean ± 2SD).2 Although patients with diabetes (particularly T1DM) are not expected to achieve completely normal glucose values, this gives a frame of reference. Acceptable or desirable values for various subsets of T1DM points (e.g., toddlers, adolescents, adults, elderly, those with hypoglycemic unawareness) can be established over time. Right now, those caring for toddlers (<6 years old), children (<13 years old), and adolescents (13–20 years old) can change target ranges as desired and look at the derived HbA1c (based on CGM data) to see if these patients are reaching the ADA61 or International Society for Pediatric and Adolescent Diabetes64 suggested age-specific targets.
Part 2: Visual DisplayThe visual display presents a modal day (also called standard day, average day) in which all collected data over multiple days are collapsed and plotted according to time (without regard to date) as if they occurred over 24 h, starting and ending at midnight. Smoothed curves representing the median (50th), 25th, and 75th (IQR) and 10th and 90th frequency percentiles define the 24 h AGP. At a glance, one can observe the time(s) of day when glucose is most consistently low or high and when the most variability is occurring [the width of 25–75 (50% of reading) or 10–90 (80% of readings)] that needs to be addressed. This is an exercise clinicians can do together with patients in a matter of minutes. For instance, without dependence on numbers, formulas, or derived indices, clinicians and patients can quickly become skilled at identifying the risk of hypoglycemia. For example, if the 10th percentile curve crosses 70 mg/dl or lower, there is moderate risk of hypoglycemia at that time since consistently 10% of the values fall in this range. However, if the 25th percentile curve crosses into hypoglycemia, this implies a marked risk since more than 25% of the glucose values fall in the hypoglycemic range, and consequently, this should be addressed before additional therapy is instituted to treat accompanying hyperglycemia as is often seen with significant GV.
The target range is noted, and the default view is 70–180 mg/dl to match the default statistics; however, this is interactive and can easily be changed by the clinician, as needed. Also, with one click, each individual glucose reading that comprises the AGP can be overlaid on the glucose curves.

574
Recommendations for Standardizing Glucose Reporting and Analysis to Optimize Clinical Decision Making in Diabetes: The Ambulatory Glucose Profile Bergenstal
www.journalofdst.orgJ Diabetes Sci Technol Vol 7, Issue 2, March 2013
Part 3: Daily ViewThe daily view is presented as a calendar of thumbnail AGPs (target range and median line) of the 24 h pattern for each day that is included in the overall profile. This allows for comparison of patterns on specific days (e.g., weekend versus weekday) and permits a deeper discussion with the patient regarding special circumstances that may be responsible for extremes or fluctuations in glucose readings. Clicking a thumbnail will enlarge it to a full-size one-day AGP with corresponding glucose metrics for that day. A modified daily view as well as a concise modal day AGP view that captures pump download data that is important to health care professionals (e.g., basal rates, insulin-to-carbohydrate ratio, correction doses, carbohydrate intake) as they refine pump therapy is in development. Over time, standardized glucose reporting and analysis using tools like AGP must be extended for T1DM and T2DM patients using multiple daily injections of insulin.
Moving ForwardThe current iteration of the AGP dashboard (the first row of glucose statistics) provides a basic starting point that allows clinicians and patients to begin to more effectively visualize and utilize glucose data as a key component in addition to the HbA1c to drive lifestyle and therapy decisions in the management of diabetes. The clinician can click and reveal the second row of glucose statistics if desired. Piloting is underway to quickly incorporate the AGP dashboard into an electronic medical record so that it is easy to compare with the next AGP after a therapy adjustment or at a subsequent visit or electronic communication. Key to successful implementation of AGP or other ways of analyzing and viewing CGM data is an enhanced workflow that seamlessly and rapidly acquires glucose data from any device at a clinic visit or over the Internet cloud network. Additional functionality, such as inclusion of data relevant to insulin or other diabetes medication administration, nutrition (timing and carbohydrate content), and physical activity is being explored. Currently, these data can be added by the clinician on the AGP modal day graphic at a clinic visit. These can facilitate clear communications with the patient and help to arrive at a jointly agreed upon action plan with the patient. Workflow usability studies and patient and provider preference or satisfaction evaluations are being designed utilizing the AGP dashboard.
Industry Issues and ConsiderationRepresentatives from the diabetes device industry (SMBG, CGM, insulin pump systems, and data management) attended the final report-out and summary portion of the meeting to discuss their reaction and possible concerns regarding the AGP dashboard and reporting standardization. Although some representatives expressed concern that standardization could potentially stifle innovation, others stated that the AGP dashboard approach, in fact, encourages more innovation because it creates an entry for clinicians to begin interacting with CGM data immediately and thus allows manufacturers to focus on more sophisticated data analysis features and capabilities (e.g., “secondary visualizations”). Many participants (panel members and industry representatives) felt that the AGP dashboard approach was analogous to the electrocardiogram, noting that while several manufacturers produce electrocardiogram systems, visualization of the data is standardized. Although all the issues regarding integration of insulin pump data and proprietary software have yet to be resolved, there was general consensus among industry representatives that there would be value to including a standard report such as the AGP dashboard in their product features so that there would be a consistent approach to presenting glucose data for patients and diabetes care providers. It was agreed to continue discussions and to collaborate in some manner with the IDC/Helmsley Trust/Expert Panel and others so as to move the standardization of glucose data collection, display, and interpretation forward.
ConclusionsDespite advances in insulin preparations, insulin delivery devices, and glucose monitoring technology, glycemic control in many T1DM patients remains suboptimal. Use of HbA1c as a primary (or sole) measure of glycemic status, under-utilization of SMBG and CGM data, and lack of easy and standardized glucose data collection, analysis, visualization, and guided clinical decision making are, clearly, key contributors to poor glycemic control within this population.
Working with the Helmsley Charitable Trust, expert collaborators, industry, and regulatory officials, the IDC will continue to develop, test, and assist with implementation of the AGP dashboard as the standard reporting system
575
Recommendations for Standardizing Glucose Reporting and Analysis to Optimize Clinical Decision Making in Diabetes: The Ambulatory Glucose Profile Bergenstal
www.journalofdst.orgJ Diabetes Sci Technol Vol 7, Issue 2, March 2013
for CGM and, ultimately, SMBG data. Through standardization of clinical terms and key metrics, with glucose data visualized in an easily interpreted format, the AGP dashboard has the opportunity to benefit clinicians, patients, payers, and regulators through improved patient care, better understanding and utilization of glucose data in clinical practice, and greater ability to evaluate and improve clinical performance. Standardized reporting also has potential to benefit clinical research by enabling investigators and regulators to agree on standardized benchmarks that define improvement in glycemic control and a reduction in hypoglycemia, hyperglycemia, and glucose variability. This will allow for new drugs, new devices, and new team-based approaches to diabetes management to be evaluated more effectively.
Standardizing glucose reporting and analysis, with tools such as AGP, may be one step toward optimizing clinical decision making in diabetes. While CGM has been shown to be valuable in several clinical settings, continued research is needed to define which individuals with T1DM or T2DM will benefit most from either real-time use of CGM or retrospective analysis of intermittent use of CGM.
Participant List:
Andrew J. Ahmann, M.D., Harold Schnitzer Diabetes Health Center, Oregon Health and Science University; Timothy Bailey, M.D., director, Advanced Metabolic Care + Research (AMCR) Institute and University of California, San Diego; Dana Ball, Leona M. and Harry B. Helmsley Charitable Trust; Roy W. Beck, M.D., Ph.D., Jaeb Center for Health Research; Richard M. Bergenstal, M.D., IDC; Joan Bissen, R.D., Park Nicollet Institute/IDC; Bruce Buckingham, M.D., Santa Clara Valley Medical Center and Lucille Packard Children’s Hospital, Stanford University; Larry Deeb, M.D., Florida State University; Robert H. Dolin, M.D., Lantana Consulting Group/Chair-Elect Health Level Seven(HL-7) Board of Directors; Satish K. Garg, M.D., Barbara Davis Center for Childhood Diabetes, University of Colorado, Denver; Robin Goland, M.D., Columbia University Medical Center; Mary L. Johnson, R.N., B.S., C.D.E., IDC; William Kimmel, America’s ThoughtWorks; David C. Klonoff, M.D., Mills-Peninsula Health Services; Davida F. Kruger, M.S.N., A.P.N.-B.C., B.C.-A.D.M., Henry Ford Health System; Courtney Lias, Ph.D., Food and Drug Administration; Glenn Matfin, M.B., Ch.B., M.Sc. (Oxon)., IDC; Roger Mazze, Ph.D., IDC; Imran Nasrullah, M.S., J.D., T1D Ex; Beth A. Olson, B.A.N., R.N., C.D.E., IDC; David Panzirer, Leona M. and Harry B. Helmsley Charitable Trust; Chris Parkin, M.S., CG Parkin Communications Inc.; Anne Peters, M.D., University of Southern California; Margaret A. Powers, Ph.D., R.D., C.D.E., IDC; Jeff Putney, Sursumcorda Resource Group LLC; Carol Rizzo, B.A., Rizzo Advisory Services; Henry Rodriguez, M.D., University of South Florida; Sid Pinney, B.S., ThoughtWorks; Marie Schiller, partner, Health Advances LLC; Phil Southerland, B.S., Team Type 1; Ellie S. Strock, A.N.P.-B.C., C.D.E., IDC; William Tamborlane, M.D., Yale University; Kyle Thompson, B.S., IDC; and David M. Wesley, B.A., Sursumcorda Resource Group LLC.
Companies Represented at Report-Out:
Abbott Diabetes Care, Animus Corporation, Bayer HealthCare LLC, BD Medical-Diabetes Care, Close Concerns Inc., DexCom, Diasend, LifeScan Inc., Medtronic Diabetes, Park Nicollet Foundation, RocheDiagnostics, Sanofi US, and SweetSpotDiabetes.
Funding:
Funding for the meeting was provided by the Leona M. and Harry B. Helmsley Charitable Trust.
Disclosures:
Richard Bergenstal serves on the advisory board/acts as a consultant/provides research support for Abbott Diabetes Care, Amylin, Bayer, Becton Dickinson, Boehringer Ingelheim, Intuity, Calibra, DexCom, Eli Lilly, Halozyme, Helmsley Trust, Hygieia, Johnson & Johnson, Medtronic, Merck, NIH, Novo Nordisk, ResMed, Roche, Sanofi, and Takeda; his employer, non-profit Park Nicollet Institute, contracts for his services, and no personal income goes to Dr. Bergenstal; he has inherited Merck stock; and he has been a volunteer for the ADA and Juvenile Diabetes Research Foundation. Andy Ahmann acts as consultant/provides research support for Medtronic and Sanofi, acts as consultant/speaker for Novo, provides research support for Mannkind and Amylin, and acts as consultant to Lilly. Tim Bailey acts as consultant for Bayer, Lifescan, Medtronic, and Roche and provides research support for Abbott, Animas, Bayer, BD, Dexcom, Lifescan, and Medtronic. Bruce Buckingham provides research support for Medtronic MiniMed and acts as consultant to Sanofi-Aventis, BD Biosciences, Roche, GlySens, Debiotech, Unomedical, Animas, and Bayer. Satish K. Garg serves on the advisory board for Sanofi, DexCom, Medtronic, Novo-Nordisk, and Roche Diagnostics and provides research support for Novo Nordisk, Eli Lilly and Company, Merck, Mannkind, Halozyme, Cebix Inc., Medtronic, Sanofi, and Jaeb Center. Robin Goland serves on the advisory board for Medtronic and provides research support for Sanofi, Medtronic. Irl Hirsch provides research support for Sanofi and acts as consultant for Abbott, Johnson & Johnson, Roche Diagnostics, and Valeritas. David Klonoff has financial or business/organizational interests in Bayer, Insuline, Roche, and Sanofi and holds interest or leadership position in Diabetes Technology Management, Inc. Davida Kruger serves on the advisory board for DexCom, Abbott, Johnson & Johnson, Roche Diagnostics, and Assante. Glen Matfin serves on the advisory board for Sanofi, Genzyme, and Lilly (but receives no payments for these services). Christopher Parkin serves as consultant to Roche Diagnostics, Dexcom, and Sanofi. Ann Peters serves as consultant to Amylin/Lilly, Abbott Diabetes Care, BD, Janssen, Medtronic, Roche, Takeda, and Sanofi and as a speaker for Amylin/Lilly and Novo Nordisk. Henry Rodriguez acts as consultant and serves on the advisory board for Roche Diagnostics. Phil Southerland declares sponsorship by Novo Nordisk. Ellie Strock serves as consultant for Abbott Diabetes Care. William Tamborlane acts as consultant for Boehringer Ingelheim, Sanofi, LifeScan, Medtronic, Novo Nordisk, and Bristol Myers Squibb.
576
Recommendations for Standardizing Glucose Reporting and Analysis to Optimize Clinical Decision Making in Diabetes: The Ambulatory Glucose Profile Bergenstal
www.journalofdst.orgJ Diabetes Sci Technol Vol 7, Issue 2, March 2013
References:
1. Mazze RS, Lucido D, Langer O, Hartmann K, Rodbard D. Ambulatory Glucose Profile: representation of verified self-monitored blood glucose data. Diabetes Care. 1987;10(1):111–7.
2. Mazze RS, Strock E, Wesley D, Borgman S, Morgan B, Bergenstal R, Cuddihy R. Characterizing glucose exposure for individuals with normal glucose tolerance using continuous glucose monitoring and ambulatory glucose profile analysis. Diabetes Technol Ther. 2008;10(3):149–59.
3. Beck RW, Tamborlane WV, Bergenstal RM, Miller KM, DuBose SN, Hall CA; T1D Exchange Clinic Network. The T1D Exchange clinic registry. J Clin Endocrinol Metab. 2012;97(12):4383–9.
4. Miller KM, Beck RW, Bergenstal RM, Goland RS, Haller MJ, McGill JB, Rodriguez H, Simmons JH, Hirsch IB; for the T1D Exchange Clinic Network. Evidence of a strong association between frequency of self-monitoring of blood glucose and hemoglobin A1C levels in T1D Exchange clinic registry participants. Diabetes Care. 2013. Epub ahead of print.
5. Di Battista AM, Hart TA, Greco L, Gloizer J. Type 1 diabetes among adolescents: reduced diabetes self-care caused by social fear and fear of hypoglycemia. Diabetes Educ. 2009;35(3):465–75.
6. Morris AD, Boyle DI, McMahon AD, Greene SA, MacDonald TM, Newton RW. Adherence to insulin treatment, glycaemic control, and ketoacidosis in insulin-dependent diabetes mellitus. The DARTS/MEMO Collaboration. Diabetes Audit and Research in Tayside Scotland. Medicines Monitoring Unit. Lancet. 1997;350(9090):1505–10.
7. Smith CB, Choudhary P, Pernet A, Hopkins D, Amiel SA. Hypoglycemia unawareness is associated with reduced adherence to therapeutic decisions in patients with type 1 diabetes: evidence from a clinical audit. Diabetes Care. 2009;32(7):1196–8.
8. McGill1 JB, Chen V, Beck RW. Diabetes management among adults under excellent control in the type 1 diabetes exchange clinic registry: how do they do it? EASD 2012 Berlin, oral presentation, 186.
9. Wild D, von Maltzahn R, Brohan E, Christensen T, Clauson P, Gonder-Frederick L. A critical review of the literature on fear of hypoglycemia in diabetes: Implications for diabetes management and patient education. Patient Educ Couns. 2007;68(1):10–5.
10. Brouhard BH. Hypoglycemia. In: Travis LB, Brouhard BH, Schreiner BJ, eds. Diabetes mellitus in children and adolescents. Philadelphia: W.B. Saunders; 1987, 169–78.
11. Cryer PE. Hypoglycaemia: the limiting factor in the glycaemic management of type I and type II diabetes. Diabetologia. 2002;45(7):937–48.
12. Anderbro T, Amsberg S, Adamson U, Bolinder J, Lins PE, Wredling R, Moberg E, Lisspers J, Johansson UB. Fear of hypoglycaemia in adults with type 1 diabetes. Diabet Med. 2010;27(10):1151–8.
13. Sacks DB. Hemoglobin a1c in diabetes: panacea or pointless? Diabetes. 2013;62(1):41–3.
14. Hirsch IB, Amiel SA, Blumer IR, Bode BW, Edelman SV, Seley JJ, Verderese CA, Kilepatrick ES. Using multiple measures of glycemia to support individualized diabetes management: recommendations for clinicians, patients, and payers. Diabetes Technol Ther. 2012;14(11):973–83.
15. Zoungas S, Patel A, Chalmers J, de Galan BE, Li Q, Billot L, Woodward M, Ninomiya T, Neal B, MacMahon S, Grobbee DE, Kengne AP, Marre M, Heller S; ADVANCE Collaborative Group. Severe hypoglycemia and risks of vascular events and death. N Engl J Med. 2010;363(15):1410–8.
16. Seaquist ER, Miller ME, Bonds DE, Feinglos M, Goff DC Jr, Peterson K, Senior P; ACCORD Investigators. The impact of frequent and unrecognized hypoglycemia on mortality in the ACCORD study. Diabetes Care. 2012;35(2):409–14.
17. McCoy RG, Van Houten HK, Ziegenfuss JY, Shah ND, Wermers RA, Smith SA. Increased mortality of patients with diabetes reporting severe hypoglycemia. Diabetes Care. 2012;35(9):1897–901.
18. Cryer PE. Severe hypoglycemia predicts mortality in diabetes. Diabetes Care. 2012;35(9):1814–6.
19. Monnier L, Mas E, Ginet C, Michel F, Villon L, Cristol JP, Colette C. Activation of oxidative stress by acute glucose fluctuations compared with sustained chronic hyperglycemia in patients with type 2 diabetes. JAMA. 2006;295(14):1681–7.
20. Esposito K, Ciotola M, Carleo D, Schisano B, Sardelli L, Di Tommaso D, Misso L, Saccomanno F, Ceriello A, Giugliano D. Post-meal glucose peaks at home associate with carotid intima-media thickness in type 2 diabetes. J Clin Endocrinol Metab. 2008;93(4):1345–50.
21. Monnier L, Colette C, Leiter L, Ceriello A, Hanefeld M, Owens D, Tajima N, Tuomiletho J, Davidson J; PGR Group. The effect of glucose variability on the risk of microvascular complications in type 1 diabetes. Diabetes Care. 2007;30(1):185–8.
22. Siegelaar SE, Holleman F, Hoekstra JB, DeVries JH. Glucose variability; does it matter? Endocr Rev. 2010;31(2):171–82.
23. Monnier L, Wojtusciszyn A, Colette C, Owens D. The contribution of glucose variability to asymptomatic hypoglycemia in persons with type 2 diabetes. Diabetes Technol Ther. 2011;13(8):813–8.
24. Qu Y, Jacober SJ, Zhang Q, Wolka LL, DeVries JH. Rate of hypoglycemia in insulin- treated patients with type 2 diabetes can be predicted from glycemic variability data. Diabetes Technol Ther. 2012;14(11):1008–12.
25. Rodbard D, Bailey T, Jovanovic L, Zisser H, Kaplan R, Garg SK. Improved quality of glycemic control and reduced glycemic variability with use of continuous glucose monitoring. Diabetes Technol Ther. 2009;11(11):717–23.
26. Testa MA, Gill J, Su M, Turner RR, Blonde L, Simonson DC. Comparative effectiveness of basal-bolus versus premix analog insulin on glycemic variability and patient-centered outcomes during insulin intensification in type 1 and type 2 diabetes: a randomized, controlled, crossover trial. J Clin Endocrinol Metab. 2012;97(10):3504–14.
27. Berwick DM, Nolan TW, Whittington J. The triple aim: care, health, and cost. Health Aff (Millwood). 2008;27(3):759–69.
28. Centers for Disease Control and Prevention (CDC). Self-monitoring of blood glucose among adults with diabetes--United States, 1997-2006. MMWR Morb Mortal Wkly Rep. 2007;56(43):1133–7.
29. Muchmore D. The end point is just the beginning. J Diabetes Sci Technol. 2011;5(5):1287–9.
577
Recommendations for Standardizing Glucose Reporting and Analysis to Optimize Clinical Decision Making in Diabetes: The Ambulatory Glucose Profile Bergenstal
www.journalofdst.orgJ Diabetes Sci Technol Vol 7, Issue 2, March 2013
30. Juvenile Diabetes Research Foundation Continuous Glucose Monitoring Study Group, Bode B, Beck RW, Xing D, Gilliam L, Hirsch I, Kollman C, Laffel L, Ruedy KJ, Tamborlane WV, Weinzimer S, Wolpert H. Sustained benefit of continuous glucose monitoring on A1C, glucose profiles, and hypoglycemia in adults with type 1 diabetes. Diabetes Care. 2009;32(11):2047–9
31. Final Guidance for Industry and the Food and Drug Administration Staff: The Content of Investigational Device Exemption (IDE) and Premarket Approval (PMA) Applications for Artificial Pancreas Device Systems. http://www.fda.gov/downloads/MedicalDevices/DeviceRegulationandGuidance/GuidanceDocuments/UCM259305.pdf. Accessed on February 24, 2013.
32. Zinman B, Schmidt WE, Moses A, Lund N, Gough S. Achieving a clinically relevant composite outcome of an HbA1c of <7% without weight gain or hypoglycaemia in type 2 diabetes: a meta-analysis of the liraglutide clinical trial programme. Diabetes Obes Metab. 2012;14(1):77–82.
33. Bergenstal RM, Li Y, Porter TK, Weaver C, Han J. Exenatide once weekly improved glycaemic control, cardiometabolic risk factors and a composite index of an HbA1c < 7%, without weight gain or hypoglycaemia, over 52 weeks. Diabetes Obes Metab. 2013;15(3):264–71.
34. Cheung BM, Ong KL, Cherny SS, Sham PC, Tso AW, Lam KS. Diabetes prevalence and therapeutic target achievement in the United States, 1999 to 2006. Am J Med. 2009;122(5):443–53.
35. The D5. The five goals for living well with diabetes. http://www.thed5.org. Accessed November 5, 2012.
36. Consumer Reports Health. Special report for Minnesota residents. How does your doctor compare? http://mnhealthscores.org/news/assets/CR-MNCM%20insert%20FINAL.pdf. Accessed November 5, 2012.
37. Gaede P, Lund-Andersen H, Parving HH, Pedersen O. Effect of a multifactorial intervention on mortality in type 2 diabetes. N Engl J Med. 2008;358(6):580–91.
38. Bode BW, Beck RW, DuBose SN, Bode BW, Peters AL, Hirsch IB, Miller KM; T1D Exchange Clinic Network. A comparison of users and nonusers of real-time continuous glucose monitoring with type 1 diabetes in the type 1 diabetes exchange. J Diabetes Sci Technol. 2012;6(2):A18.
39. Ryan EA, Germsheid J. Use of continuous glucose monitoring system in the management of severe hypoglycemia. Diabetes Technol Ther. 2009;11(10):635–9.
40. Geiger MC, Ferreira JV, Hafiz MM, Froud T, Baidal DA, Meneghini LF, Ricordi C, Alejandro R. Evaluation of metabolic control using a continuous subcutaneous glucose monitoring system in patients with type 1 diabetes mellitus who achieved insulin independence after islet cell transplantation. Cell Transplant. 2005;14(2-3):77–84.
41. Bailey TS, Zisser HC, Garg SK. Reduction in hemoglobin A1C with real-time continuous glucose monitoring: results from a 12-week observational study. Diabetes Technol Ther. 2007;9(3):203–10.
42. Garg S, Jovanovic L. Relationship of fasting and hourly blood glucose levels to HbA1c values: safety, accuracy, and improvements in glucose profiles obtained using a 7-day continuous glucose sensor. Diabetes Care. 2006;29(12):2644–9.
43. Garg S, Zisser H, Schwartz S, Bailey T, Kaplan R, Ellis S, Jovanovic L. Improvement in glycemic excursions with a transcutaneous, real-time continuous glucose sensor: a randomized controlled trial. Diabetes Care. 2006;29(1):44–50.
44. Battelino T, Conget I, Olsen B, Schütz-Fuhrmann I, Hommel E, Hoogma R, Schierloh U, Sulli N, Bolinder J; SWITCH Study Group. The use and efficacy of continuous glucose monitoring in type 1 diabetes treated with insulin pump therapy: a randomised controlled trial. Diabetologia. 2012;55(12):3155–62.
45. Pickup JC, Freeman SC, Sutton AJ. Glycaemic control in type 1 diabetes during real time continuous glucose monitoring compared with self-monitoring of blood glucose: meta-analysis of randomised controlled trials using individual patient data. BMJ. 2011;343:d3805.
46. Yeh HC, Brown TT, Maruthur N, Ranasinghe P, Berger Z, Suh YD, Wilson LM, Haberl EB, Brick J, Bass EB, Golden SH. Comparative effectiveness and safety of methods of insulin delivery and glucose monitoring for diabetes mellitus: a systematic review and meta-analysis. Ann Intern Med. 2012;157(5):336–47.
47. Juvenile Diabetes Research Foundation Continuous Glucose Monitoring Study Group, Beck RW, Hirsch IB, Laffel L, Tamborlane WV, Bode BW, Buckingham B, Chase P, Clemons R, Fiallo-Scharer R, Fox LA, Gilliam LK, Huang ES, Kollman C, Kowalski AJ, Lawrence JM, Lee J, Mauras N, O’Grady M, Ruedy KJ, Tansey M, Tsalikian E, Weinzimer SA, Wilson DM, Wolpert H, Wysocki T, Xing D. The effect of continuous glucose monitoring in well-controlled type 1 diabetes. Diabetes Care. 2009;32(8):1378–83.
48. Vigersky RA, Fonda SJ, Chellappa M, Walker MS, Ehrhardt NM. Short- and long-term effects of real-time continuous glucose monitoring in patients with type 2 diabetes. Diabetes Care. 2012;35(1):32–8.
49. Battelino T, Phillip M, Bratina N, Nimri R, Oskarsson P, Bolinder J. Effect of continuous glucose monitoring on hypoglycemia in type 1 diabetes. Diabetes Care. 2011;34(4):795–800.
50. Deiss D, Bolinder J, Riveline JP, Battelino T, Bosi E, Tubiana-Rufi N, Kerr D, Phillip M. Improved glycemic control in poorly controlled patients with type 1 diabetes using real-time continuous glucose monitoring. Diabetes Care. 2006;29(12):2730–2.
51. Hirsch IB, Abelseth J, Bode BW, Fischer JS, Kaufman FR, Mastrototaro J, Parkin CG, Wolpert HA, Buckingham BA. Sensor-augmented insulin pump therapy: results of the first randomized treat-to-target study. Diabetes Technol Ther. 2008;10(5):377–83.
52. Brewer KW, Chase HP, Owen S, Garg SK. Slicing the pie. Correlating HbA--values with average blood glucose values in a pie chart form. Diabetes Care. 1998;21(2):209–12.
53. Kowalski AJ. Can we really close the loop and how soon? Accelerating the availability of an artificial pancreas: a roadmap to better diabetes outcomes. Diabetes Technol Ther. 2009;11 Suppl 1:S113–9.
54. Nathan DM, Kuenen J, Borg R, Zheng H, Schoenfeld D, Heine RJ; A1c-Derived Average Glucose Study Group. Translating the A1C assay into estimated average glucose values. Diabetes Care. 2008;31(8):1473–8.
55. Rodbard D. Interpretation of continuous glucose monitoring data: glycemic variability and quality of glycemic control. Diabetes Technol Ther. 2009;11 Suppl 1:S55–67.

578
Recommendations for Standardizing Glucose Reporting and Analysis to Optimize Clinical Decision Making in Diabetes: The Ambulatory Glucose Profile Bergenstal
www.journalofdst.orgJ Diabetes Sci Technol Vol 7, Issue 2, March 2013
56. Kovatchev BP, Cox DJ, Gonder-Frederick LA, Young-Hyman D, Schlundt D, Clarke W. Assessment of risk for severe hypoglycemia among adults with IDDM: validation of the low blood glucose index. Diabetes Care. 1998;21(11):1870–5.
57. Kovatchev BP, Otto E, Cox D, Gonder-Frederick L, Clarke W. Evaluation of a new measure of blood glucose variability in diabetes. Diabetes Care. 2006;29(11):2433–8.
58. Rodbard D. Hypo- and hyperglycemia in relation to the mean, standard deviation, coefficient of variation, and nature of the glucose distribution. Diabetes Technol Ther. 2012;14(10):868–76.
59. Workgroup on Hypoglycemia, American Diabetes Association. Defining and reporting hypoglycemia in diabetes: a report from the American Diabetes Association Workgroup on Hypoglycemia. Diabetes Care. 2005;28(5):1245–9.
60. American Diabetes Association. Standards of Medical Care in Diabetes--2013. Diabetes Care. 2013;36 Suppl 1:S11–66.
61. Dunn TC, Crouther N. Assessment of the variance of the ambulatory glucose profile over 3-20 days of continuous glucose monitoring. EASD, Stockholm, Abstract. September 2010.
62. Mazze R, Strock E, Morgan B, Wesley D, Bergenstal R, Cuddihy R. Diurnal glucose patterns of exenatide once weekly: a 1-year study using continuous glucose monitoring with ambulatory glucose profile analysis. Endocr Pract. 2009;15(4):326–34.
63. International Society for Pediatric and Adolescent Diabetes. IDF/ISPAD 2011 global guideline for diabetes in childhood and adolescence. http://www.ispad.org/resources/idfispad-2011-global-guideline-diabetes-childhood-and-adolescence. Accessed February 18, 2013.