Recommendations for Measuring Taxi Availability...
24
Recommendations for Measuring Taxi Availability for PCN Determination Prepared for San Francisco Taxicab Commission July 2003 Schaller Consulting 94 Windsor Place, Brooklyn, NY (718) 768-3487 [email protected] www.schallerconsult.com
Transcript of Recommendations for Measuring Taxi Availability...
Recommendations for Measuring Taxi Availability
for PCN Determination
Prepared for
San Francisco Taxicab Commission
July 2003
Schaller Consulting 94 Windsor Place, Brooklyn, NY
(718) 768-3487 [email protected]
www.schallerconsult.com
S.F. TAXI COMMISSION PCN METHODOLOGY 1
SC HA LL ER CO N S U L TI N G
Table of Contents
1. Purpose and Methodology ...........................................................................................2
2. Site visit ...........................................................................................................................3
3. Review of Past Studies .................................................................................................5 SFPD Taxicab Detail Surveys and Airport Survey.......................................................5 Dispatch company data ..................................................................................................5 Other Analyses ...............................................................................................................7
4. Data Analysis ..................................................................................................................8 Taxi trip estimates .........................................................................................................8 Geographic distribution of dispatch calls ......................................................................9 Calls by time of day and day of the week ....................................................................12
5. Recommendations .......................................................................................................14 Factors for the PCN determination .............................................................................14 Overall Recommendations ...........................................................................................15 Detailed Recommendations Regarding Survey Methodology.....................................16
S.F. TAXI COMMISSION PCN METHODOLOGY 2
SC HA LL ER CO N S U L TI N G
1. Purpose and Methodology Local law provides that the Taxi Commission shall hold a hearing at least once per year to determine whether the public convenience and necessity (PCN) requires issuance of additional taxicab permits. The Taxi Commission relies in part on surveys compiled by the San Francisco Police Department to make this determination. Over the past several years, the Taxi Commission has determined that additional cabs were needed in San Francisco, and authorized the issuance of hundreds of new permits. The number of permits in San Francisco has risen from 981 in 1998 to 1,381 today. The purpose of this project is to review the surveys that have been conducted and to recommend any changes necessary to ensure that the surveys provide valid and accurate measurements of taxicab availability in San Francisco. This review was conducted by Bruce Schaller, Principal of Schaller Consulting, under contract to the San Francisco Taxicab Commission. The project consisted of a review of relevant reports, most notably including the San Francisco Police Department (SFPD) Taxicab Detail’s surveys; interviews with members of the taxi industry, City staff and other relevant personnel; and analysis of computerized dispatch data provided by two dispatch companies and of other information gathered in the course of the project. The PCN determination should take into account a range of factors that include industry finances and the relationship between issuing more medallions and improving taxi response times. While these factors are noted in this report, the purpose of this project and focus of this report is to make recommendations about the measurement of cab availability.

S.F. TAXI COMMISSION PCN METHODOLOGY 3
SC HA LL ER CO N S U L TI N G
2. Site visit Meetings were held on April 7-9, 2003 with individuals and groups in the taxi industry and City government. The purpose of these meetings was to understand the full range of issues related to measuring taxi availability and to hear different groups’ perspectives on these issues. I talked with these groups about both the technical aspects of measuring cab availability and broader issues concerning how the data are and will be used. These meetings and interviews involved the following groups and individuals:
! Representatives of taxi dispatch companies ! United Taxicab Workers ! Permit Holders and Drivers ! SFPD Taxicab Detail ! San Francisco International Airport Landside Operations ! Muni and Paratransit Broker ! Consumer Assurance Department ! Controller’s office
I also visited four dispatch companies (Yellow, Luxor, DeSoto and Citywide), the taxi hold areas and the inspection facility at San Francisco International Airport and the inspection facility at the Consumer Assurance Department. Comments from these groups and individuals focused on the survey methodology for the Taxicab Detail’s dispatch survey and on interpretation of availability data. Comments emphasized the importance of collecting accurate data and interpreting the results in light of the full range of considerations that should be part of the PCN review. Specific comments on the dispatch survey methodology were:
1. Call testing should take account of seasonality – September and October are the industry’s busiest months, biasing the survey results against the industry.
2. The testing should take into account major events occurring at the time and the effects of street construction, both of which affect availability of cabs and response times.
3. Sample sizes are inadequate.
4. Waiting 30 minutes after the call is placed is not realistic; in practice, customers call again in 10 to 15 minutes if a cab does not show up.
5. Data should be weighted to the size of the dispatch company.
6. The number of calls made from each neighborhood is arbitrary.
S.F. TAXI COMMISSION PCN METHODOLOGY 4
SC HA LL ER CO N S U L TI N G
7. Testers should leave their cell phones on after making a reservation to receive a callback if required.
Specific comments on the dispatch data submitted by dispatch companies were:
1. Need clear definition of “dispatch” and other terms used in reporting.
2. Data should be audited. Other issues raised largely focused on interpretation and use of the data. Comments included:
1. Clear standards are needed to evaluate response times. The standards should take into account the remoteness of the location, economic feasibility of providing rapid service, and the time of day.
2. Availability data should be interpreted in light of other data on cab utilization rates, driver earnings, the density of business in different parts of the city, and split of flags, taxi stand, airport and pre-arranged calls.
3. Adding cabs does not necessarily solve problems with availability, especially in the western and southern parts of the city.
4. There should be a way to both decrease as well as increase the number of cabs.
5. Availability, the efficiency of the industry and response times are affected by the efficiency of dispatch companies and drivers in dispatching and accepting calls.
6. Some drivers refuse to accept pre-arranged calls, even when they are available, and this negatively affects response times.
These comments were quite helpful in evaluating past studies and making recommendations. I appreciate the time and courtesy of those I met with and their commitment to the best interests of the taxi industry in the city. The discussion and recommendations below incorporate relevant points from my discussions during my visit to the city.
S.F. TAXI COMMISSION PCN METHODOLOGY 5
SC HA LL ER CO N S U L TI N G
3. Review of Past Studies Previous surveys include those conducted by the Taxicab Detail and San Francisco International Airport (SFO), dispatch data submitted by dispatch companies, and studies by the San Francisco Controllers Office and Golden Gate Restaurant Association.
SFPD Taxicab Detail Surveys and Airport Survey
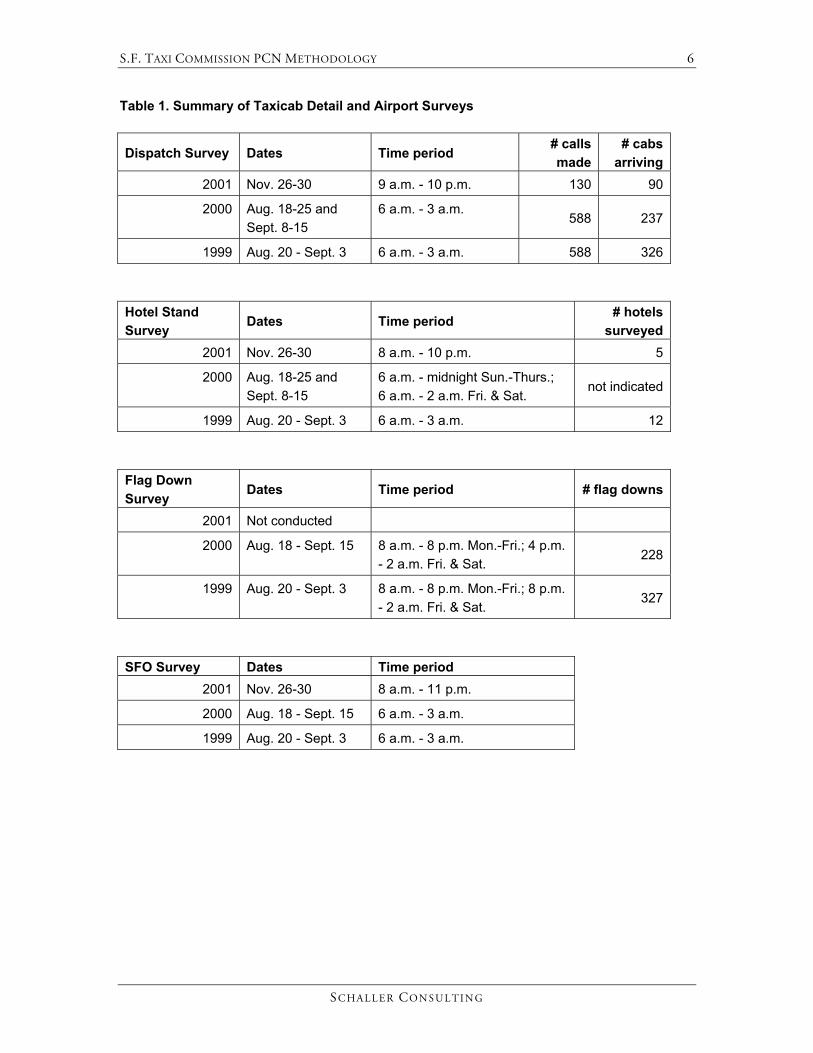
Table 1 summarizes the three types of surveys conducted by the Taxicab Detail and the survey at SFO staging lots conducted by a contractor for Landside Operations. The most extensive survey programs in recent years were carried out in 1999 and 2000. A smaller survey program was implemented in 2001. No surveys were conducted in 2002. In 1999, 588 calls were made to dispatch services, conditions at 12 hotel stands were surveyed, 327 flag downs were made and SFO observations were made for 14 days. The great strength of these surveys is that they directly measure taxicab availability. They measure the amount of time testers spent waiting for taxicabs after calling on the phone and while trying to flag down a cab. The surveys also observe supply and demand conditions at hotels (the number of cabs and number of passengers waiting at hotels) and supply conditions at SFO (the number of cabs in taxi lots). These surveys thus address the heart of the issue of cab availability and have been the primary basis for the PCN determination. Because they directly measure cab availability, these studies have been and should continue to be the primary basis for assessing taxi availability in the PCN process. Certain modifications are needed, however, to improve the methodology of these surveys and the reporting of results, as discussed in the recommendations section below.
Dispatch company data
In addition to the surveys conducted by the Taxicab Detail and SFO, dispatch companies submit to the Commission data on the number of telephone requests for service they receive with further detail on the number of cabs dispatched and the number of non-response complaints. These data are submitted semi-annually. The strength of these data is that they quantify the level of demand for cabs by telephone pre-arrangement. The data also show how demand changes over time. The utility of the data are limited by several factors, however. The data do not reflect other important sources of demand such as flags and hotel and airport stands. Another limitation is that the data do not capture the number of callers who encounter a busy signal or hang up while on hold. The ability to get through to a call-taker on the phone
S.F. TAXI COMMISSION PCN METHODOLOGY 6
SC HA LL ER CO N S U L TI N G
Table 1. Summary of Taxicab Detail and Airport Surveys
Dispatch Survey Dates Time period # calls made
# cabs arriving
2001 Nov. 26-30 9 a.m. - 10 p.m. 130 90
2000 Aug. 18-25 and Sept. 8-15
6 a.m. - 3 a.m. 588 237
1999 Aug. 20 - Sept. 3 6 a.m. - 3 a.m. 588 326
Hotel Stand Survey
Dates Time period # hotels
surveyed2001 Nov. 26-30 8 a.m. - 10 p.m. 5
2000 Aug. 18-25 and Sept. 8-15
6 a.m. - midnight Sun.-Thurs.; 6 a.m. - 2 a.m. Fri. & Sat.
not indicated
1999 Aug. 20 - Sept. 3 6 a.m. - 3 a.m. 12
Flag Down Survey
Dates Time period # flag downs
2001 Not conducted
2000 Aug. 18 - Sept. 15 8 a.m. - 8 p.m. Mon.-Fri.; 4 p.m. - 2 a.m. Fri. & Sat.
228
1999 Aug. 20 - Sept. 3 8 a.m. - 8 p.m. Mon.-Fri.; 8 p.m. - 2 a.m. Fri. & Sat.
327
SFO Survey Dates Time period 2001 Nov. 26-30 8 a.m. - 11 p.m.
2000 Aug. 18 - Sept. 15 6 a.m. - 3 a.m.
1999 Aug. 20 - Sept. 3 6 a.m. - 3 a.m.
S.F. TAXI COMMISSION PCN METHODOLOGY 7
SC HA LL ER CO N S U L TI N G
is an important aspect of cab availability for pre-arranged calls. Finally, the data reported by the dispatch companies does not show how long customers waited for a cab after requesting service. This is also a critical measure of availability. In addition to these inherent limitations of the dispatch data, there have been questions raised about the consistency of reporting by the various dispatch companies and whether each company uses the same definition of “calls received” and “calls dispatched.” Thus, while the dispatch company data are useful barometers of pre-arranged demand for service, the data do not measure taxi availability itself.
Other Analyses
Several other groups have brought other data to bear on the issue of how many cabs San Francisco needs. A Golden Gate Restaurant Association study analyzed the relationship between the number of medallions and the number of residents, visitors and hotel rooms in San Francisco and selected other cities. The City Controller’s office has charted growth in taxicabs compared with changes in population, MUNI passenger trips, paratransit trips, employment, SFO enplaned passengers and occupied hotel room nights. These data are useful as background, particularly to understand trends in demand. Despite some attempts to do so, however, these data are unable to address whether the current number of taxicabs is optimal to meet demand for service. They cannot answer this question as long as the relationship between these sources of demand and actual demand for taxi service is unknown. Without some formula to translate population, visitation, hotel room nights, etc., into demand for cab service, these studies cannot prescribe the number of cabs needed in San Francisco.
S.F. TAXI COMMISSION PCN METHODOLOGY 8
SC HA LL ER CO N S U L TI N G
4. Data Analysis In forming recommendations for measurement of taxicab availability, it is important to know how many taxi users obtain cabs through flag downs, telephone pre-arrangement, etc. It is also important to know the geographic distribution of demand and the distribution of demand by time of day and day of the week. Accordingly, I conducted additional analyses in each of these areas. Results are presented in this section.
Taxi trip estimates
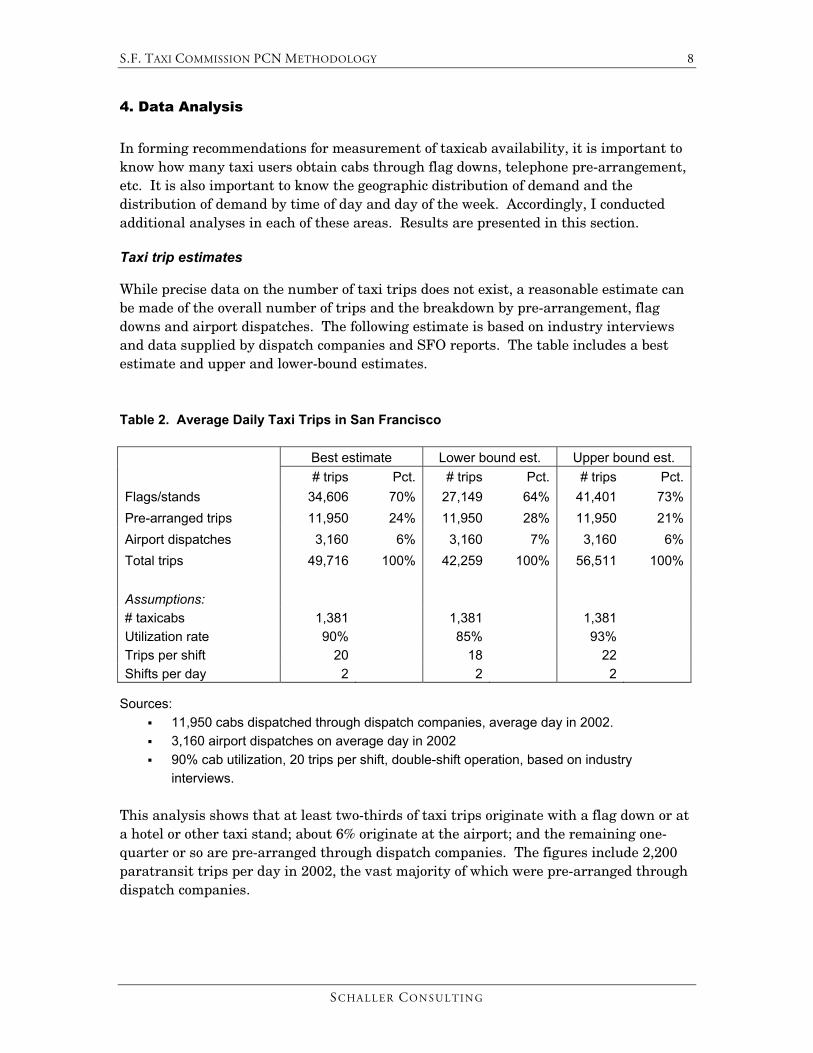
While precise data on the number of taxi trips does not exist, a reasonable estimate can be made of the overall number of trips and the breakdown by pre-arrangement, flag downs and airport dispatches. The following estimate is based on industry interviews and data supplied by dispatch companies and SFO reports. The table includes a best estimate and upper and lower-bound estimates. Table 2. Average Daily Taxi Trips in San Francisco
Best estimate Lower bound est. Upper bound est. # trips Pct. # trips Pct. # trips Pct.
Flags/stands 34,606 70% 27,149 64% 41,401 73%Pre-arranged trips 11,950 24% 11,950 28% 11,950 21%Airport dispatches 3,160 6% 3,160 7% 3,160 6%Total trips 49,716 100% 42,259 100% 56,511 100%
Assumptions: # taxicabs 1,381 1,381 1,381 Utilization rate 90% 85% 93% Trips per shift 20 18 22 Shifts per day 2 2 2
Sources: ! 11,950 cabs dispatched through dispatch companies, average day in 2002. ! 3,160 airport dispatches on average day in 2002 ! 90% cab utilization, 20 trips per shift, double-shift operation, based on industry
interviews. This analysis shows that at least two-thirds of taxi trips originate with a flag down or at a hotel or other taxi stand; about 6% originate at the airport; and the remaining one-quarter or so are pre-arranged through dispatch companies. The figures include 2,200 paratransit trips per day in 2002, the vast majority of which were pre-arranged through dispatch companies.
S.F. TAXI COMMISSION PCN METHODOLOGY 9
SC HA LL ER CO N S U L TI N G
Geographic distribution of dispatch calls
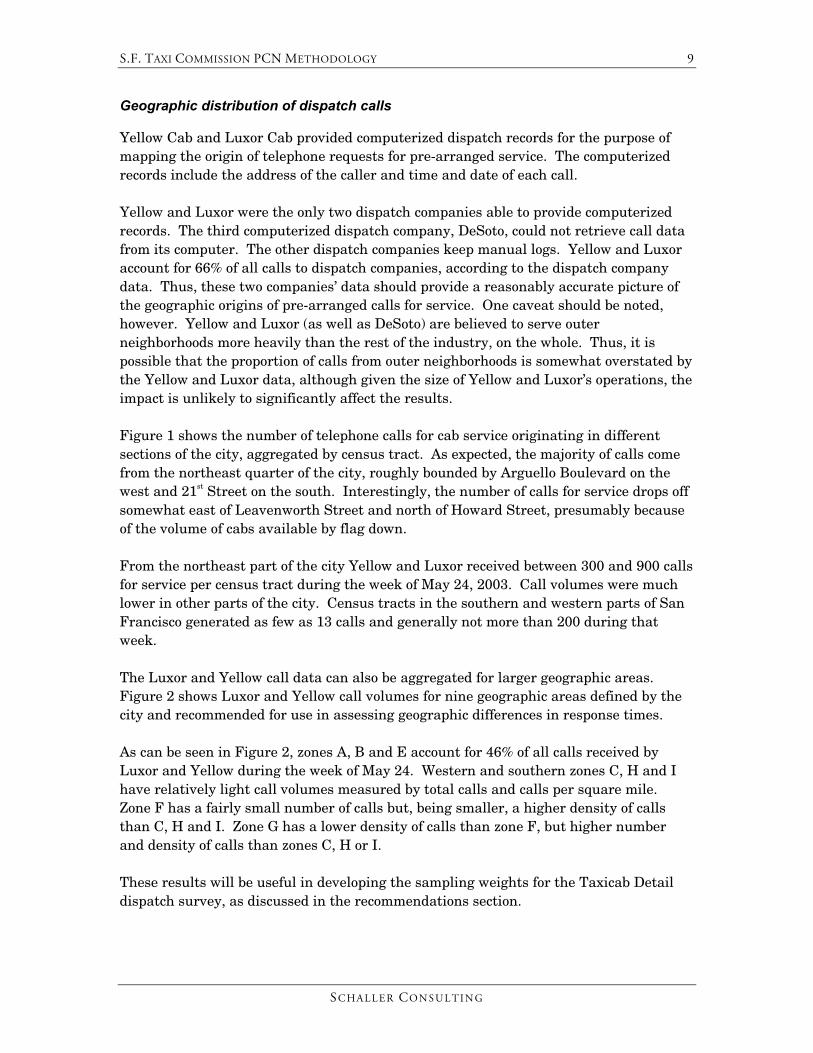
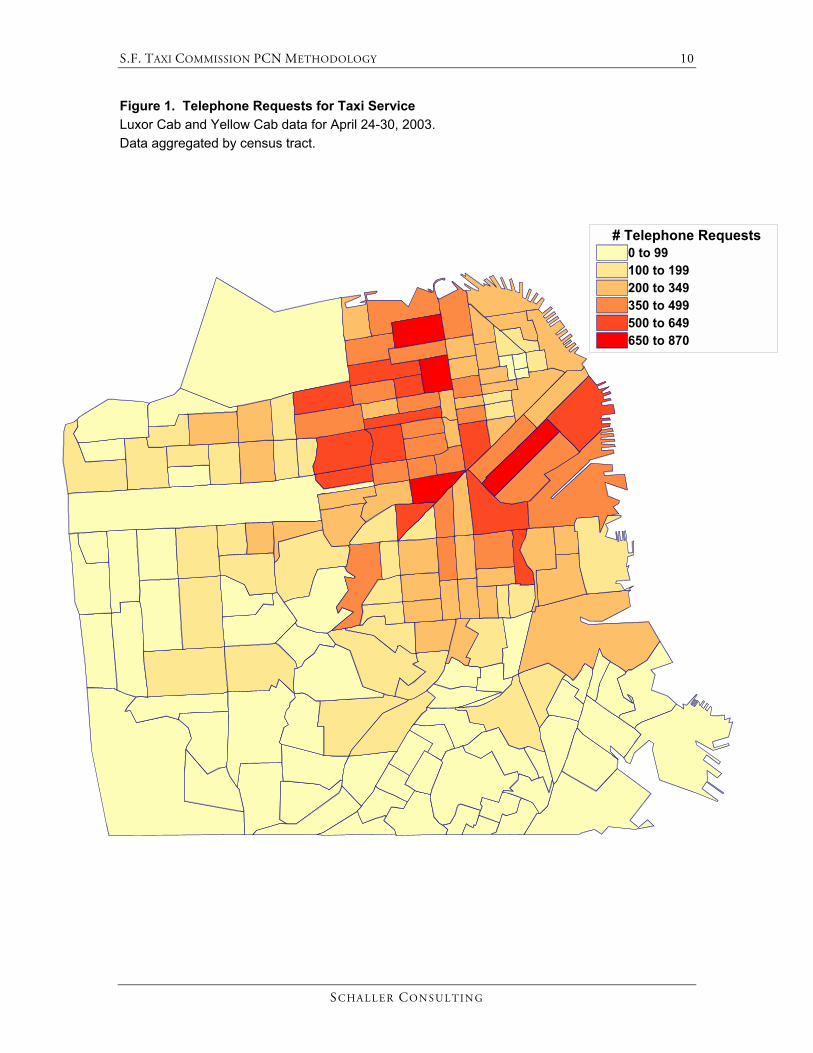
Yellow Cab and Luxor Cab provided computerized dispatch records for the purpose of mapping the origin of telephone requests for pre-arranged service. The computerized records include the address of the caller and time and date of each call. Yellow and Luxor were the only two dispatch companies able to provide computerized records. The third computerized dispatch company, DeSoto, could not retrieve call data from its computer. The other dispatch companies keep manual logs. Yellow and Luxor account for 66% of all calls to dispatch companies, according to the dispatch company data. Thus, these two companies’ data should provide a reasonably accurate picture of the geographic origins of pre-arranged calls for service. One caveat should be noted, however. Yellow and Luxor (as well as DeSoto) are believed to serve outer neighborhoods more heavily than the rest of the industry, on the whole. Thus, it is possible that the proportion of calls from outer neighborhoods is somewhat overstated by the Yellow and Luxor data, although given the size of Yellow and Luxor’s operations, the impact is unlikely to significantly affect the results. Figure 1 shows the number of telephone calls for cab service originating in different sections of the city, aggregated by census tract. As expected, the majority of calls come from the northeast quarter of the city, roughly bounded by Arguello Boulevard on the west and 21st Street on the south. Interestingly, the number of calls for service drops off somewhat east of Leavenworth Street and north of Howard Street, presumably because of the volume of cabs available by flag down. From the northeast part of the city Yellow and Luxor received between 300 and 900 calls for service per census tract during the week of May 24, 2003. Call volumes were much lower in other parts of the city. Census tracts in the southern and western parts of San Francisco generated as few as 13 calls and generally not more than 200 during that week. The Luxor and Yellow call data can also be aggregated for larger geographic areas. Figure 2 shows Luxor and Yellow call volumes for nine geographic areas defined by the city and recommended for use in assessing geographic differences in response times. As can be seen in Figure 2, zones A, B and E account for 46% of all calls received by Luxor and Yellow during the week of May 24. Western and southern zones C, H and I have relatively light call volumes measured by total calls and calls per square mile. Zone F has a fairly small number of calls but, being smaller, a higher density of calls than C, H and I. Zone G has a lower density of calls than zone F, but higher number and density of calls than zones C, H or I. These results will be useful in developing the sampling weights for the Taxicab Detail dispatch survey, as discussed in the recommendations section.
S.F. TAXI COMMISSION PCN METHODOLOGY 10
SC HA LL ER CO N S U L TI N G
Figure 1. Telephone Requests for Taxi Service Luxor Cab and Yellow Cab data for April 24-30, 2003. Data aggregated by census tract.
# Telephone Requests0 to 99100 to 199200 to 349350 to 499500 to 649650 to 870
S.F. TAXI COMMISSION PCN METHODOLOGY 11
SC HA LL ER CO N S U L TI N G
Figure 2. Telephone Requests for Taxi Service for Nine Geographic Areas Luxor Cab and Yellow Cab data for April 24-30, 2003.
Zone A 16% of calls
2,531 calls/sq. mile
Zone B 10% of calls
1,710 calls/sq. mile
Zone C 6% of calls
301 calls/sq. mile
Zone D 15% of calls
2,022 calls/sq. mile
Zone E 20% of calls
3,357 calls/sq. mile
Zone F 7% of calls
1,417 calls/sq. mile
Zone G 13% of calls
605 calls/sq. mile
Zone H 7% of calls
367 calls/sq. mile
Zone I 6% of calls
224 calls/sq. mile
S.F. TAXI COMMISSION PCN METHODOLOGY 12
SC HA LL ER CO N S U L TI N G
Calls by time of day and day of the week
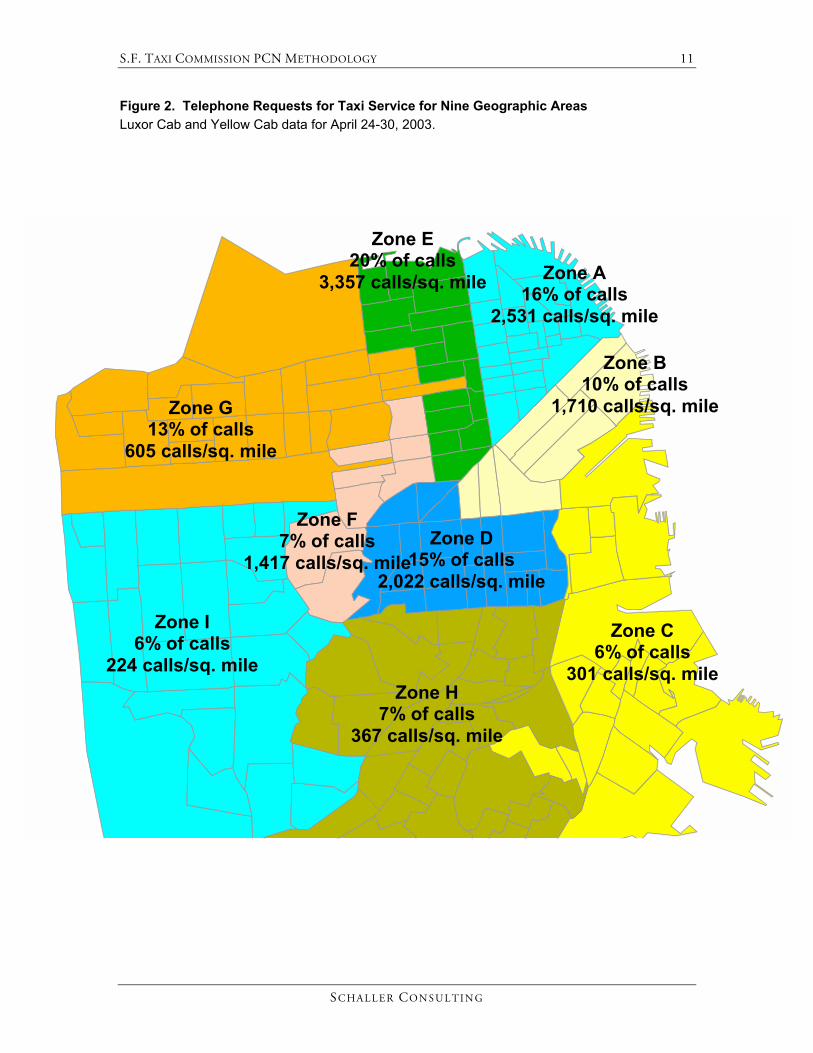
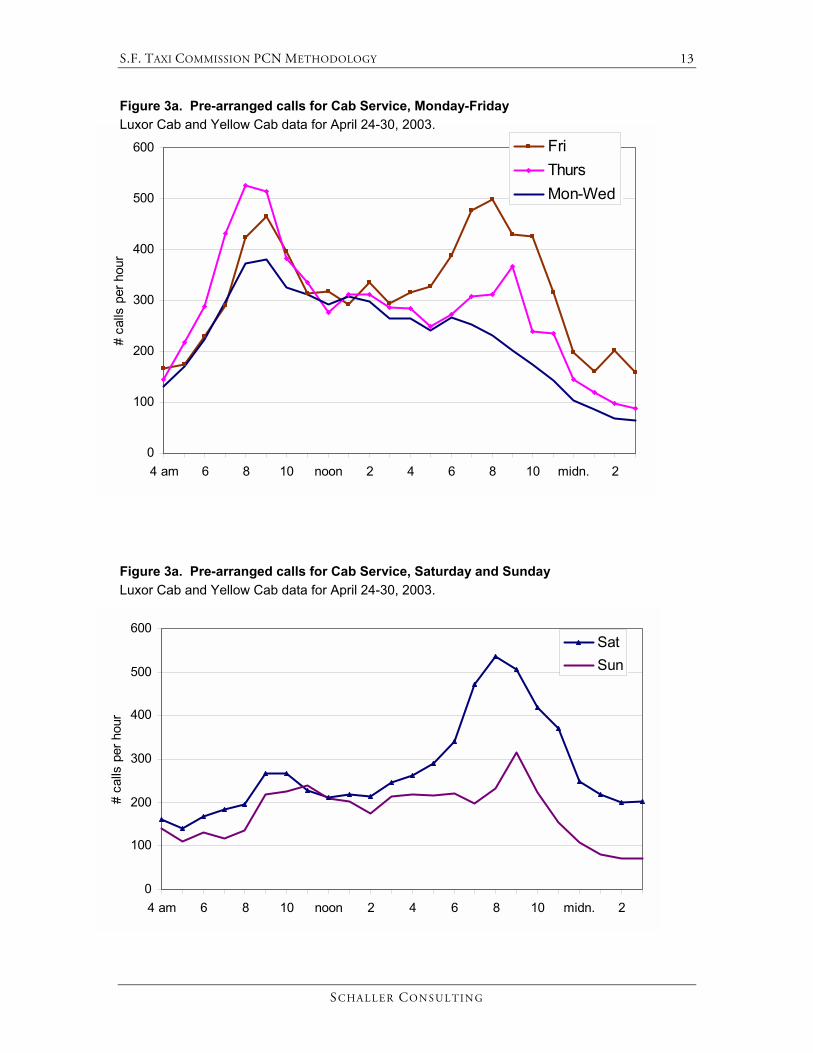
In addition to geography, time of day has an important influence on demand for and availability of taxicab service. Availability studies should take into account differences by time of day and day of the week. Figures 3a and 3b show the number of calls received by Luxor Cab and Yellow Cab by time of day for each day of the week. Monday, Tuesday and Wednesday are essentially the same and thus combined for the sake of simplicity. The figures show that peak demand times for telephone pre-arrangement are Thursday and Friday mornings and Friday and Saturday evenings. The number of calls on Monday, Tuesday and Wednesday mornings is somewhat less than on Thursday and Friday mornings. Midday calls number about the same each day of the week. Call volumes tail off quickly after 6 p.m. on Monday through Wednesday.
S.F. TAXI COMMISSION PCN METHODOLOGY 13
SC HA LL ER CO N S U L TI N G
0
100
200
300
400
500
600
4 am 6 8 10 noon 2 4 6 8 10 midn. 2
# ca
lls p
er h
our
FriThursMon-Wed
0
100
200
300
400
500
600
4 am 6 8 10 noon 2 4 6 8 10 midn. 2
# ca
lls p
er h
our
SatSun
Figure 3a. Pre-arranged calls for Cab Service, Monday-Friday Luxor Cab and Yellow Cab data for April 24-30, 2003. Figure 3a. Pre-arranged calls for Cab Service, Saturday and Sunday Luxor Cab and Yellow Cab data for April 24-30, 2003.
S.F. TAXI COMMISSION PCN METHODOLOGY 14
SC HA LL ER CO N S U L TI N G
5. Recommendations
Factors for the PCN determination
The Taxi Commission’s PCN determination must take into account a broad range of factors. These include taxi availability as measured in various surveys. The PCN determination cannot hinge solely on taxi availability, however. As noted above, other factors to be considered include driver earnings and the efficiency and effectiveness of dispatch operations. The PCN determination must balance the need to provide a sufficient amount of service for customers with the fact that if drivers cannot earn a reasonable living, the quality of taxi service will suffer. The Commission must also consider whether issuing additional medallions will address shortfalls in cab availability. The Commission must consider the relationship between the number of cabs and service response times to various parts of the city. It may be the case that cabs are plentiful in the downtown area but not in outlying areas of the city. The issue then becomes whether adding to the number of cabs will simply improve availability in the outlying areas, or only in the downtown area. The availability studies can help to address this issue by showing the effects of changes in supply and demand on availability in particular areas of the city. If, after issuance of additional medallions, availability improves in areas lacking adequate cab service, then increasing the number of cabs can be seen as an effective step. On the other hand, if availability does not improve with expansion of the industry, the Commission must assess the reasons for that and possible solutions. Perhaps the number of cabs is still inadequate, or perhaps other steps are needed, such as changes to dispatch methods or dispatch technology. Another issue raised by taxi drivers in particular is that the city may at some times have too many taxicabs. The availability surveys can help the Commission determine whether this is in fact the case. Unfortunately, however, the PCN process does not provide a mechanism to reduce the number of cabs, aside from possibly not replacing attrition of perhaps a dozen cabs a year. It would be advisable to consider changing applicable local law to permit the Commission to decrease as well as increase the number of medallions. While a range of factors should be considered in the PCN process, the heart of the PCN determination will continue to be an assessment of taxi availability – are passengers adequately served? To assess this issue, taxi availability surveys should provide the following:
(1) A complete picture of availability taking into account telephone pre-arrangement, taxi and airport stands and flag downs;
S.F. TAXI COMMISSION PCN METHODOLOGY 15
SC HA LL ER CO N S U L TI N G
(2) An accurate measurement of availability for each means of obtaining cab service; and
(3) Standards for assessing whether a given level of availability is satisfactory (i.e., how long a wait time should be considered acceptable?).
The following recommendations are made to achieve these goals. Recommendations are organized as two broad recommendations and then a series of detailed recommendations concerning survey methodology.
Overall Recommendations
1. Continue the surveys that collect data for each of the methods by which cab service can be obtained, i.e., flags, hotel stands, telephone pre-arrangement and airport stands.
These surveys are the best feasible methodology to measure industry-wide taxicab availability. The surveys match actual customer experience in attempting to obtain cab service. They cover the four primary ways in which customers seek out cab service: flags, hotel and airport stand and telephone pre-arrangement. They also encompass the entire customer experience. In the case of telephone pre-arrangement, this includes placing the call, possible busy signals and being placed on hold, and possible delays between when the cab is dispatched and when it arrives. Another strength of the Taxicab Detail’s surveys is that they can include the entire taxi industry. Other data sources, such as dispatch company computer records, by contrast, are available for only two dispatch companies. The methodology employed by the Taxicab Detail in carrying out these surveys has been developed and refined over a number of years. The detailed recommendations below are intended to address issues that were identified in the course of this project. Once these modifications are made, the surveys should provide a sound and reliable basis for evaluating taxicab availability in San Francisco. 2. Supplement the existing surveys with a customer satisfaction survey. In addition to these data collection methods, a customer satisfaction survey should be conducted. This survey will enable the Taxi Commission to evaluate San Franciscan’s satisfaction levels with current taxi service and response times. The survey results can be used to evaluate whether response times are adequate. Thus, the pairing of the City’s field observations (carried out to date by the Taxicab Detail) and a customer satisfaction survey will provide a complete picture of taxi availability and standards for the Commission to use in evaluating the adequacy of a given level of response times and availability.
S.F. TAXI COMMISSION PCN METHODOLOGY 16
SC HA LL ER CO N S U L TI N G
Results from the customer survey can also be used to confirm the weights developed earlier based on Luxor and Yellow dispatch data. These weights will be applied to the City’s dispatch survey results from each geographic area, as discussed below. 3. Consider supplementing the above methods with analysis of computerized
dispatch data from Yellow and Luxor. Yellow and Luxor’s dispatch systems record each trip made by each cab, regardless of how the trip was initiated (pre-arrangement, flag, etc.). These systems create massive databases that can show the number of flags and calls by geographic area, customer waiting times for pre-arranged calls, total number of trips and fare revenues per cab, and other useful data. Although the data obviously cover only Yellow and Luxor cabs, the depth and richness of the data would provide very valuable additional information about taxi industry operations and response times. Consideration should be given to obtaining and analyzing these data as part of the PCN process. Among issues that need to be addressed in this process are confidentiality concerns about the data. For the City’s purposes, some personal information about customers (name and phone number, etc.) can be withheld by the companies, although the City would need address information. Only aggregated data would be made public and data can be combined for the two companies, as done for this report.
Detailed Recommendations Regarding Survey Methodology
The following provides detailed recommendations for survey methodology pertaining to the overall recommendations #1 and #2. 1. Dispatch Survey The following recommendations will ensure that the Dispatch Survey produces:
(1) Citywide data on cab availability with an acceptable margin of error – thus providing a firm basis for PCN determinations.
(2) Statistically valid results for geographic areas of the city – permitting comparisons between different areas of the city.
(3) Statistically valid results for different times of the day and week and different times of the year – showing conditions at both high-demand and low-demand times.
Recommendations:
a) Timing. Conduct the primary survey in September and a smaller survey in the February or June. These months capture relative higher and lower months of taxi demand. Both surveys should be conducted over a two week period. Exact dates should avoid large conventions or other events that create an inordinate demand for taxicab service.
S.F. TAXI COMMISSION PCN METHODOLOGY 17
SC HA LL ER CO N S U L TI N G
b) Time of day. Make calls from 6 a.m. to midnight on Sunday through Thursday and 6 a.m. to 3 a.m. on Friday and Saturday (stretching into Saturday and Sunday mornings). (Note that 90% of the calls to Luxor and Yellow are made during these time periods.)
c) Geographic areas. Use pre-defined geographic areas for data collection and analytic purposes. Figure 2 shows geographic areas recommended by Taxi Commission staff. Comparison of data for each area will show geographic variations in response times, provided sufficient sample sizes are achieved in each area (see (d) below).
d) Sampling plan for Sept. survey. A stratified random sample should be used to provide statistically valid results for each geographic area and citywide. Stratification should be defined based on geography and time of day/day of week. Sample size should be 125 calls for each of the nine geographic areas for a total of 1,125 calls citywide. Friday and Saturday nights should be oversampled to generate about 200 responses during these peak demand times. See Table 3 for the number of calls per hour. Data should be weighted in two stages. The first stage is to weight data to account for the Friday and Saturday night oversampling (see Table 3 for weights). The second stage is to weight data for each geographic area. Table 4 shows geographic weights based on Yellow and Luxor dispatch data.
e) Sampling plan for Spring survey. The spring survey should involve 350 calls. This sample size will produce confidence intervals of less than 5 percentage points. Because the goal is to provide citywide data only, there should not be a geographic stratification or Friday/Saturday oversampling. The number of calls in each geographic area should be apportioned by the percentages shown in Table 4.
f) Number of calls per dispatch company. Pro-rate the number of calls to each dispatch company by the number of dispatch calls received by each company as shown in their dispatch reports. For example, Yellow Cab received 34% of all citywide dispatch calls in 2002; thus, 34% of test calls should be made to Yellow Cab. (This is a slight change from previous methods which pro-rated calls by the number of cabs affiliated with each dispatch company.)
g) Anonymous testers. Use fresh testers for calls to smaller dispatch companies so that the voices of the callers are not recognized.
S.F. TAXI COMMISSION PCN METHODOLOGY 18
SC HA LL ER CO N S U L TI N G
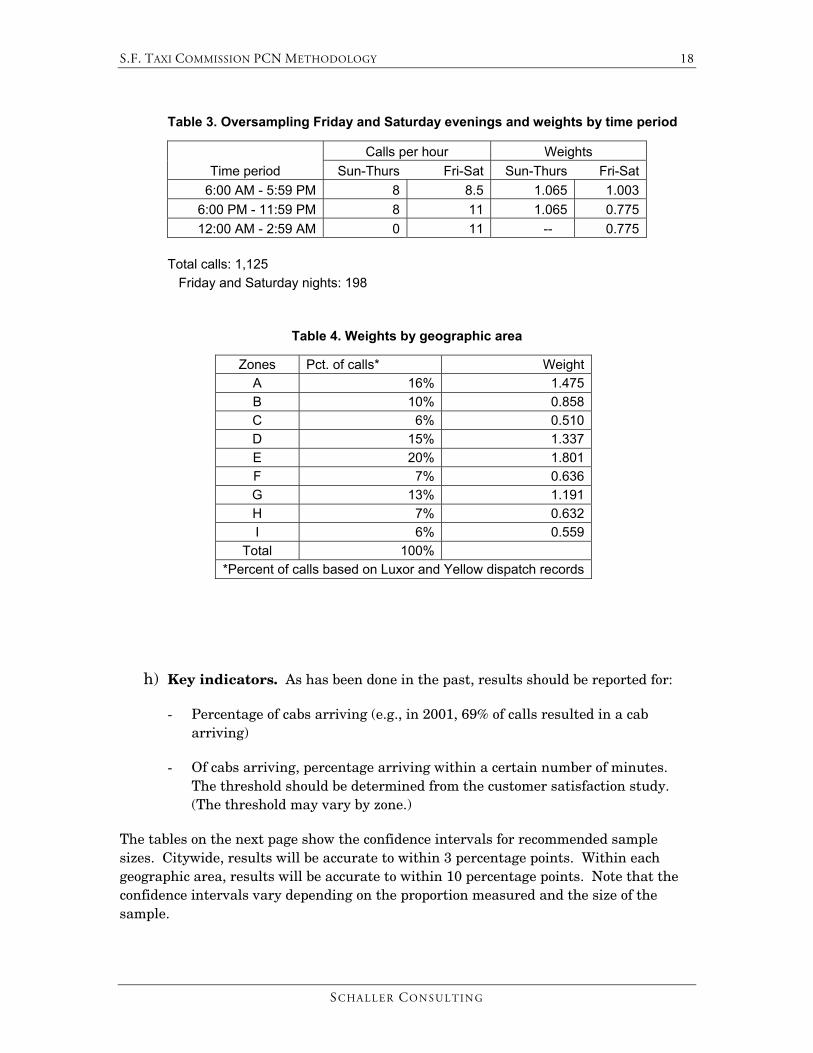
Table 3. Oversampling Friday and Saturday evenings and weights by time period
Calls per hour Weights Time period Sun-Thurs Fri-Sat Sun-Thurs Fri-Sat
6:00 AM - 5:59 PM 8 8.5 1.065 1.003 6:00 PM - 11:59 PM 8 11 1.065 0.775 12:00 AM - 2:59 AM 0 11 -- 0.775
Total calls: 1,125 Friday and Saturday nights: 198
Table 4. Weights by geographic area
Zones Pct. of calls* Weight A 16% 1.475 B 10% 0.858 C 6% 0.510 D 15% 1.337 E 20% 1.801 F 7% 0.636 G 13% 1.191 H 7% 0.632 I 6% 0.559
Total 100% *Percent of calls based on Luxor and Yellow dispatch records
h) Key indicators. As has been done in the past, results should be reported for:
- Percentage of cabs arriving (e.g., in 2001, 69% of calls resulted in a cab arriving)
- Of cabs arriving, percentage arriving within a certain number of minutes. The threshold should be determined from the customer satisfaction study. (The threshold may vary by zone.)
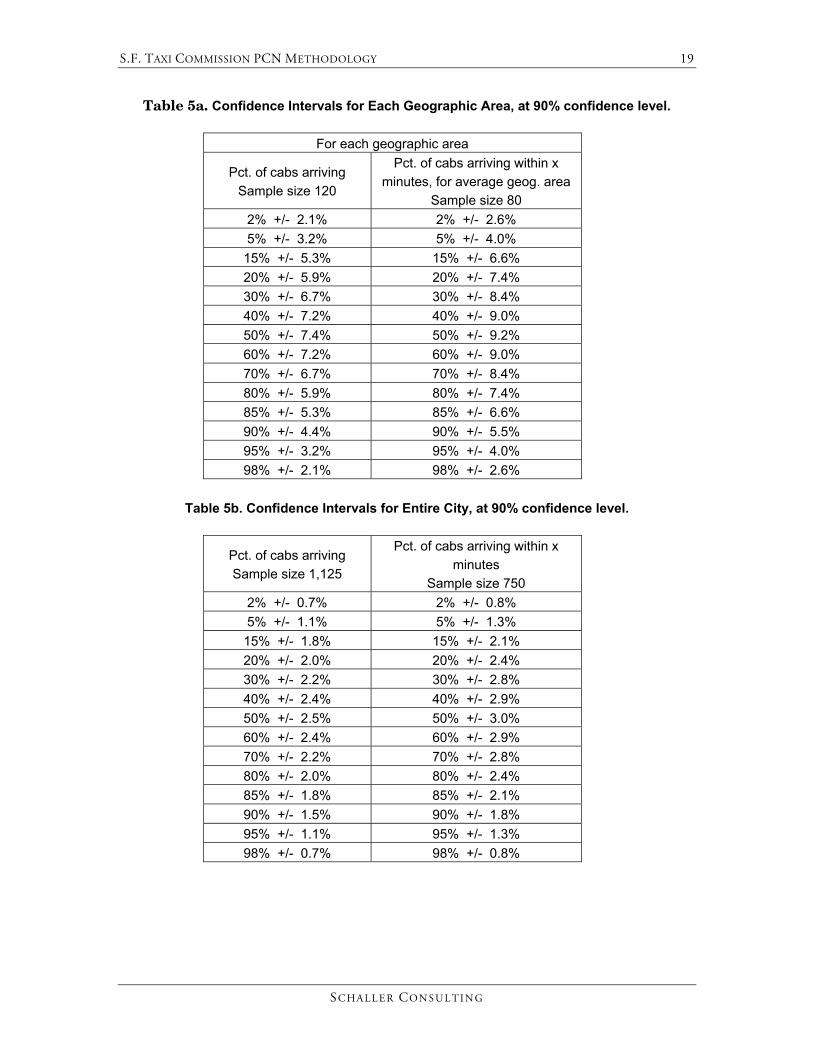
The tables on the next page show the confidence intervals for recommended sample sizes. Citywide, results will be accurate to within 3 percentage points. Within each geographic area, results will be accurate to within 10 percentage points. Note that the confidence intervals vary depending on the proportion measured and the size of the sample.
S.F. TAXI COMMISSION PCN METHODOLOGY 19
SC HA LL ER CO N S U L TI N G
Table 5a. Confidence Intervals for Each Geographic Area, at 90% confidence level.
For each geographic area
Pct. of cabs arriving Sample size 120
Pct. of cabs arriving within x minutes, for average geog. area
Sample size 80 2% +/- 2.1% 2% +/- 2.6% 5% +/- 3.2% 5% +/- 4.0% 15% +/- 5.3% 15% +/- 6.6% 20% +/- 5.9% 20% +/- 7.4% 30% +/- 6.7% 30% +/- 8.4% 40% +/- 7.2% 40% +/- 9.0% 50% +/- 7.4% 50% +/- 9.2% 60% +/- 7.2% 60% +/- 9.0% 70% +/- 6.7% 70% +/- 8.4% 80% +/- 5.9% 80% +/- 7.4% 85% +/- 5.3% 85% +/- 6.6% 90% +/- 4.4% 90% +/- 5.5% 95% +/- 3.2% 95% +/- 4.0% 98% +/- 2.1% 98% +/- 2.6%
Table 5b. Confidence Intervals for Entire City, at 90% confidence level.
Pct. of cabs arriving Sample size 1,125
Pct. of cabs arriving within x minutes
Sample size 750 2% +/- 0.7% 2% +/- 0.8% 5% +/- 1.1% 5% +/- 1.3% 15% +/- 1.8% 15% +/- 2.1% 20% +/- 2.0% 20% +/- 2.4% 30% +/- 2.2% 30% +/- 2.8% 40% +/- 2.4% 40% +/- 2.9% 50% +/- 2.5% 50% +/- 3.0% 60% +/- 2.4% 60% +/- 2.9% 70% +/- 2.2% 70% +/- 2.8% 80% +/- 2.0% 80% +/- 2.4% 85% +/- 1.8% 85% +/- 2.1% 90% +/- 1.5% 90% +/- 1.8% 95% +/- 1.1% 95% +/- 1.3% 98% +/- 0.7% 98% +/- 0.8%
S.F. TAXI COMMISSION PCN METHODOLOGY 20
SC HA LL ER CO N S U L TI N G
Some examples for how to read these tables:
For geographic areas:
(1) Cabs arriving: suppose that 70 percent of the 125 test calls result in a cab arriving. The result would be 70 percent plus or minus 6.7 percentage points.
(2) Wait times: suppose that among the approximately 80 cabs that arrived to pick up the caller, that 60 percent arrived within 15 minutes. The result would be 60 percent plus or minus 9.0 percentage points.
For citywide results:
(1) Cabs arriving: suppose that 80 percent of the 1,125 test calls result in a cab arriving. T he result would be 80 percent plus or minus 2.0 percentage points.
(2) Wait times: suppose that among the approximately 750 cabs that arrived to pick up the tester, that 85 percent arrived within 15 minutes. The result would be 85 percent plus or minus 2.1 percentage points.
2. Hotel Stand Survey. Past surveys of hotel stands have involved observations of the number of taxicabs and number of customers waiting at each hotel stand. These data provide a basic measure of availability – are there cabs available at the hotel, and if not, how many people are waiting for a cab? Results have been reported for average number of taxis waiting and average number of fares waiting. The following modifications will:
(1) Produce data on actual wait times at hotels
(2) Show the likelihood that a cab is available when hotel patrons exit their hotels. Recommendations:
a) Collect customer waiting times. Where fares are waiting for a cab, the survey team should observe wait times of customers arriving at the stand. Waiting times should be reported separately for customers whose entire wait was observed, and customers who were already waiting when observations began or continued to wait after observations ended.
b) Report amount of time cab waiting vs. customers are waiting. Another
measure of service is the likelihood of waiting for a cab when emerging from a hotel. The survey should report the percentage of time that cabs were waiting at the stands versus the percentage of time that customers were waiting. These percentages should be reported by time of day and day of the week.
S.F. TAXI COMMISSION PCN METHODOLOGY 21
SC HA LL ER CO N S U L TI N G
3. Flag Down Survey. As discussed earlier, flag downs represent the predominant method that customers use to obtain taxi service in San Francisco. Accurate data on waiting times for flags is thus important to compiling an accurate overall picture of cab availability. The Taxi Detail’s methodology for flag downs has been appropriately simple and involves flagging down cabs at various locations and recording the amount of time until a cab stopped. The Taxi Detail reports the percentage of flag down times that are under 1 minute, 2-5 minutes, 6-10 minutes, etc. The following changes are designed to ensure that the Flag Down Survey has:
(1) An acceptable margin of error
(2) Appropriate geographic coverage. Recommendations:
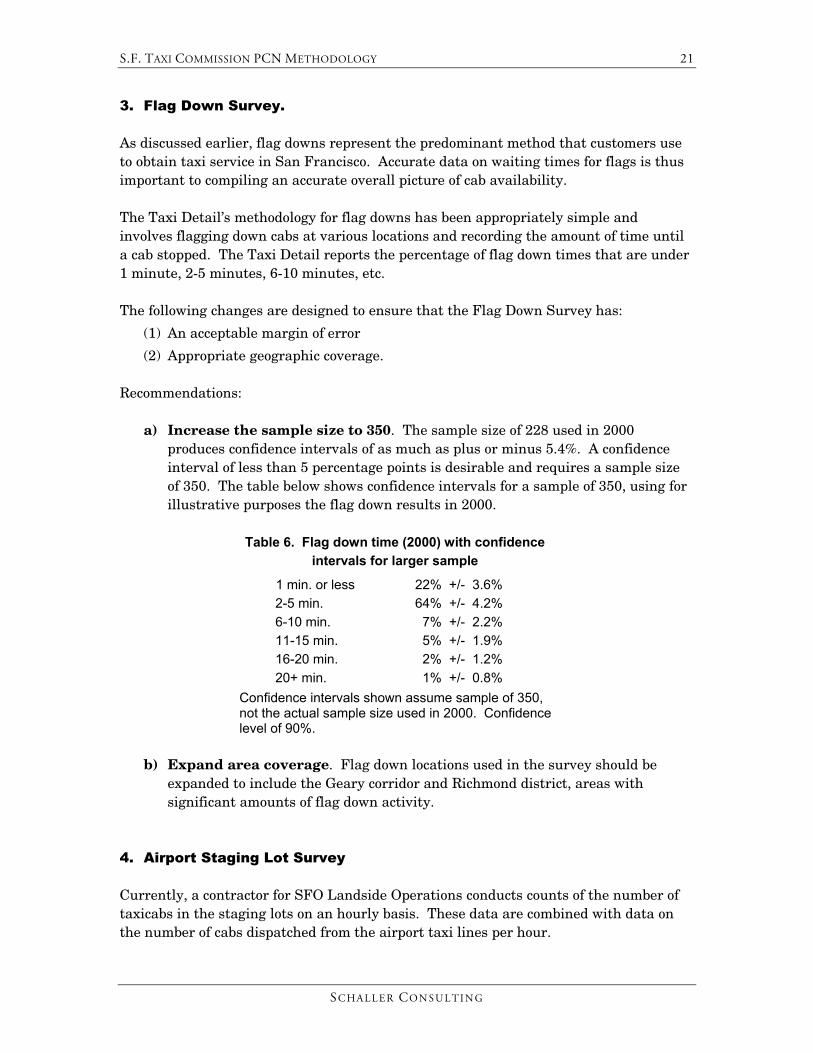
a) Increase the sample size to 350. The sample size of 228 used in 2000 produces confidence intervals of as much as plus or minus 5.4%. A confidence interval of less than 5 percentage points is desirable and requires a sample size of 350. The table below shows confidence intervals for a sample of 350, using for illustrative purposes the flag down results in 2000.
Table 6. Flag down time (2000) with confidence
intervals for larger sample
1 min. or less 22% +/- 3.6% 2-5 min. 64% +/- 4.2% 6-10 min. 7% +/- 2.2% 11-15 min. 5% +/- 1.9% 16-20 min. 2% +/- 1.2% 20+ min. 1% +/- 0.8%
Confidence intervals shown assume sample of 350, not the actual sample size used in 2000. Confidence level of 90%.
b) Expand area coverage. Flag down locations used in the survey should be
expanded to include the Geary corridor and Richmond district, areas with significant amounts of flag down activity.
4. Airport Staging Lot Survey Currently, a contractor for SFO Landside Operations conducts counts of the number of taxicabs in the staging lots on an hourly basis. These data are combined with data on the number of cabs dispatched from the airport taxi lines per hour.
S.F. TAXI COMMISSION PCN METHODOLOGY 22
SC HA LL ER CO N S U L TI N G
These data provide a clear picture of taxi availability at the airport, indicating whether and at what times of the day the staging lots lack waiting taxicabs (a rare occurrence). These data also provide somewhat of a barometer of taxi demand elsewhere in the city, since it is likely that the number of cabs waiting at the airport is inversely related to the demand for cab service in the rest of San Francisco. No changes are recommended in the methodology of the airport staging lot survey. 5. Customer Satisfaction Survey The four data collection methods discussed above – dispatch, hotel, flag down and airport staging lot surveys – provide objective information about cab activities and availability. These surveys should be supplemented with a customer satisfaction survey to capture the qualitative experience of cab riders. The central issue for the customer satisfaction survey is: how satisfactory are actual response times to cab users? Are riders satisfied when they wait 10 minutes after calling a cab? 15 minutes? 20 minutes? etc. How does location, time of day, weather or other factors affect their satisfaction? Results from the survey will be critical to evaluating the results from the dispatch, flag down and airport surveys. For example, in evaluating dispatch response times what waiting times should be considered satisfactory? Should these vary geographically, by time of day, etc.? The customer satisfaction survey will have other benefits as well. It will, for example, afford the Taxi Commission the opportunity to ask questions about satisfaction with drivers, vehicles and other aspects of service, all of which have regulatory implications. The survey can also gather data on rider demographics, ridership frequency and other customer attributes that comprise valuable information to understanding the public’s needs. Detailed recommendations are:
a) Survey methodology. Interviewing by telephone is recommended. Telephone interviewing provides several advantages to alternative methods such as mail or intercept surveys. The response rate for phone surveys can be expected to be 60% to 75% compared with 10% to 20% for mail surveys. I would expect the survey to be about 15 minutes in length, easily managed in a telephone interview but long for a mail or intercept survey. Finally, using modern computer-assisted telephone interviewing (CATI) systems, questions in a telephone survey can be tailored to the specific situation of each respondent based on answers to previous questions. This creates more flexibility in the range of questions that can be
S.F. TAXI COMMISSION PCN METHODOLOGY 23
SC HA LL ER CO N S U L TI N G
asked and makes the survey run smoothly, since questions are relevant to each respondent.
b) Sample size. A sample size of 800 is recommended to provide a reasonable margin of error (+/- 3 percentage points) and detail for sub-areas of the city and for both customers who call for pre-arrangement and for riders who flag down cabs.
c) Sampling method. Two sampling methods are available. The first is random digit dialing (RDD) of San Francisco households, screening for potential respondents who have recently used a cab. RDD interviewing is a well-established methodology for surveys of a random sample of the population. The main disadvantage of the RDD method is cost – RDD costs escalate quickly for groups that comprise a small percentage of the overall population due to the need to call many households to find cab users. An alternate method is to call from lists. For this survey, the appropriate source of lists would be from taxi dispatch companies. To use this method, each dispatch company would need to provide a list of residential phone numbers of recent callers. A total of 8,000 to 10,000 phone numbers would be needed to ensure completion of 800 interviews. The use of lists can reduce survey costs where the incidence of taxi usage is low. There are several disadvantages, however. Dispatch companies may be reluctant to provide the phone numbers of customers for privacy or other reasons. It may be difficult or impossible to extract phone numbers from computerized databases used by the companies. Even if they cooperate, non-residential phone numbers must be removed from the sample, which can be a time consuming task. Given these difficulties, I recommend that random digit dialing method be used for the customer satisfaction survey.
d) Stratification. The sample should be geographically stratified to ensure a statistically valid sample of residents in the western and southern parts of the city are surveyed. The sample should include 350 residents from zones C, G, H and I as shown in Figure 2. The sample should also include at least 350 respondents who call for a cab on the phone, and 350 respondents who flag cabs on the street. (Some respondents will fall into both categories.)
e) Frequency. The survey does not need to be conducted every year. A frequency of three to five years should provide sufficiently up-to-date customer satisfaction information for PCN purposes.