Recommendations for a Cockpit Display that Integrates ... · Source of Acquisition NASA Ames...
25
Source of Acquisition NASA Ames Research Center NASNTM-2004-212830 Recommendations for a Cockpit Display that Integrates Weather Information with Traffic Information Doreen A. Cornerford Ames Research Center, Moffett Field, California July 2004 https://ntrs.nasa.gov/search.jsp?R=20060017833 2018-07-20T12:35:43+00:00Z
Transcript of Recommendations for a Cockpit Display that Integrates ... · Source of Acquisition NASA Ames...

Source of Acquisition NASA Ames Research Center
NASNTM-2004-212830
Recommendations for a Cockpit Display that Integrates Weather Information with Traffic Information Doreen A. Cornerford Ames Research Center, Moffett Field, California
July 2004
https://ntrs.nasa.gov/search.jsp?R=20060017833 2018-07-20T12:35:43+00:00Z

The NASA STI Program Office ... in Profile
Since its founding, NASA has been dedicated to the advancement of aeronautics and space science. The NASA Scientific and Technical Information (STI) Program Office plays a key part in helping NASA maintain this important role.
The NASA STI Program Office is operated by Langley Research Center, the lead center for NASA’s scientific and technical information. The NASA STI Program Office provides access to the NASA STI Database, the largest collection of aeronautical and space science STI in the world. The Program Office is also NASA’s institutional mechanism for disseminating the results of its research and development activities. These results are published by NASA in the NASA STI Report Series, which includes the following report types:
TECHNICAL PUBLICATION. Reports of completed research or a major significant phase of research that present the results of NASA programs and include extensive data or theoretical analysis. Includes compilations of significant scientific and technical data and information deemed to be of continuing reference value. NASA counterpart of peer-reviewed formal professional papers, but having less stringent limitations on manuscript length and extent of graphic presentations.
e TECHNICAL MEMORANDUM. Scientific and technical findings that are preliminary or of specialized interest, e.g., quick release reports, working papers, and bibliographies that contain minimal annotation. Does not contain extensive analysis.
CONTRACTOR REPORT. Scientific and technical findings by NASA-sponsored contractors and grantees.
CONFERENCE PUBLICATION. Collected papers from scientific and technical conferences, symposia, seminars, or other meetings sponsored or eo-sponsored by NASA.
SPECIAL PUBLICATION. Scientific, technical, or historical information from NASA programs, projects, and missions, often concerned with subjects having substantial public interest.
TECHNICAL TRANSLATION. English-language translations of foreign scientific and technical material pertinent to NASA’s mission.
Specialized services that Complement the STI Program Office’s diverse offerings include creating custom thesauri, building customized databases, organizing and publishing research results ... even providing videos.
For more information about the NASA STI Program Office, see the following:
Access the NASA STI Program Home Page at http:llwww.sti.nasa.gov
E-mail your question via the Internet to [email protected]. gov
Fax your question to the NASA STI Help Desk at (301) 621-0134
Telephone the NASA STI Help Desk at (301) 621-0390
Write to: NASA STI Help Desk NASA Center for Aerospace
Information 7121 Standard Drive Hanover, MD 21076-1320

NASNTM- 2004-212830
Recommendations for a Cockpit Display that Integrates Weather Information with Traffic Information Doreen A. Comerford Ames Research Center, Moflett Field, California
National Aeronautics and Space Administration
Ames Research Center Moffett Field, California 94035
~ ~ _ _ _ _
July 2004

Acknowledgments
This effort was supported by the System-Wide Accident Prevention (SWAP) element of NASA's Aviation Safety Program. Dr. Bettina Beard was the SWAP lead at the time this effort was undertaken, and I would like to extend my thanks to Dr. Beard for her consistent support and her careful and thoughtful feedback throughout this endeavor. I also would like to thank Dr. Min-Ju Liao for reviewing this paper.
Available from:
NASA Center for Aerospace Information 7121 Standard Drive Hanover, MD 21076-1320 301-62 1-0390
National Technical Information Service 5285 Port Royal Road Springfield, VA 22161
703-605-6000
This report is also available in electronic form at: http://humanfactors.arc.nasa.gov/web/lib~~/publications/publications.php

Table of Contents
1 . Overview ...................................................................................................................................... 1
2 . Weather ....................................................................................................................................... 1
Recommendations for Weather Information in the Cockpit ................................................ 3
2.1.1 The Weather Data to Collect and the Manner in which It Should be Processed ............................................................................................ 3
The Display of Weather Information ....................................................................... 6
Closing Remarks about Weather Information in the Cockpit ................................... 9
2.1
2.1.2
2.1.3
3 . Traffic ......................................................................................................................................... 9
Recommendations for Traffic Information in the Cockpit .................................................. 9
3.1.1
3.1.2
3.1
The Traffic Data to Collect and the Manner in which It Should be Aocessed ........ 10
The Display of Traffic Information ...................................................................... 10
4 . Weather and Traffic ................................................................................................................... 12
4.1 Recommendations for Integrating Weather Information with a Cockpit Display of Traffic Information ................................................................. 12
4.1.1 The Display of Weather Information as Integrated with Traffic Information ......... 12
5 . Previous Research and Development Activities ........................................................................... 15
6 . Concluding Remarks and Future Directions ............................................................................... 16
7 . References ................................................................................................................................. 18
V

1. Overview This effort was supported by the System-Wide Accident Prevention element of NASA’s Aviation Safety Program. As evidenced by this effort and plans for Phase II of the Aviation Safety and Security Program, an eventual goal of the program is to provide integrated traffic, weather, and terrain information in the cockpit. Such integration theoretically should allow the flight crew to mimic Visual Meteorological Conditions in Instrument Meteorological Conditions. In other words, by providing the flight crew with a display that integrates information about hazards in the airspace, they may be able to fly as safely and efficiently on a cloudy day as they would be able to fly on a clear day. In such a case, the flight crew could merely use the integrated display to mimic what they would see out the window on a clear day.
This document may serve as a first step toward the goal of integrating traffic, weather, and terrain information; it provides recommendations for a cockpit display that integrates weather information with traffic information. While some of the recommendations are general enough to be used for any type of operations, these recommendations are targeted for Federal Aviation Regulations Part 121 Operations. In other words, these recommendations are meant to apply only to scheduled, commercial flights. Once these recommendations have been thoroughly validated, a follow-up effort should address the inclusion of terrain in an integrated display.
This document is organized in the following manner. First, weather information is discussed as an independent subject matter, and recommendations are presented for presenting weather in the cockpit. Second, traffiic is discussed independently, but this discussion essentially reviews work on the display of traffic in the cockpit. Third, recommendations for the cockpit integration of weather and traffic information are discussed. Fourth,
several research groups are recognized for their efforts in developing systems that are relevant to the current discussion. Finally, closing remarks provide suggestions for future efforts.
2. Weather The Federal Aviation Administration’s (FAA) Commercial Aviation Safety Team, who are part of the FAA’s Safer Skies initiative, report that “Weather accounted for one third of fatal U.S. airline accidents from 1987 to 1996” (Federal Aviation Administration, 2002). Providing better weather information to the flight deck may enhance safety by allowing the flight crew to make better-informed decisions regarding weather avoidance.
A study performed by Rhoda qnd Pawlak (1999) clearly demonstrates the flight crew’s need for better weather information. Rhoda and Pawlak analyzed real-world traffic flows to determine which weather variables affected pilots’ decisions, and they identified several conditions that yielded biases in decision making. First, they found that the decision to penetrate a weather cell was greatly affected by whether or not the aircraft was a leader (Le., one who flew a route that had not been used for the previous 10 minutes). Specifically, only 27% of leaders that encountered heavy weather penetrated‘it, whereas 56% of followers penetrated heavy weather. One could argue that the success of a “leader” in making it through the weather cell is weather- related information in and of itself. However, the following findings are biases that do not seem directly related to weather information. Specifically, Rhoda and Pawlak’s second finding was that weather-related decision making appears to be greatly affected by the distance from the airport. When aircraft were approximately 20 miles (or less) from the airport, they were much more likely to penetrate a storm cell. For example, when aircraft were six miles from airport, they penetrated storm cells more than 90% of the time, whereas when they were approximately 50 miles from they airport they onIy

penetrated storm cells about 30% of the time. This finding demonstrates decision making that does not appear to be based on the severity of the weather. Instead, it appears to be affected more by the fact that a deviation from the flight plan is more likely to result in aborted approaches as nearing the airport. Third, Rhoda and Pawlak found that only 15% of “on time” aircraft penetrated heavy weather, while 5 1 % of “late” aircraft (Le., aircraft that were behind schedule by15 minutes or more) penetrated heavy weather. Clearly, this finding suggests that flight crews were biased in their decision making, as the decision probably was not based on the severity of the weather. Finally, the researchers found that the time of day affected whether pilots deviated around lightning. They found that pilots circumvented lightning twice as often in the day vs. the night. Again, this finding suggests that decision making was not solely influenced by the intensity of the weather variable (in this case lightning), but was influenced by factors.
Each of the findings from the study performed by Rhoda and Pawiak (1999) clearly suggests that better cockpit weather information is needed, in an attempt to alleviate biased decision making about weather avoidance. Alleviating these biases should enhance safety in flight.
User resistance should not be an implementation problem, since Forman, Wolfson, Hallowell, and Moore (1999) found that commercial pilots believe weather information, in the form of real-time graphical cockpit displays, is of great importance for improving the national airspace. Of course, certification issues are always of concern. However, several avionics manufacturers have been successful in getting systems certified that provide weather to the cockpit. For example, the IHAS 500 is a certified system offered by BendidKing. This integrated hazard avoidance system provides the pilot with weather information, as well as traff“~ and terrain information, and moving maps.
Therefore, it certainly is not impossible to certify a system that presents weather information that is integrated with other information.
In the following paragraphs, recommendations are offered for the presentation of weather information in the commercial flight deck. It is not the current objective to define or evaluate hardware or other technologies (e.g., sensors or models) that are part of the weather information collection and dissemination system. These technologies are reviewed at great length in other sources (e.g., Keel, Stancil, Eckert, Brown, Gimmestad, & Richards, 2000; National Research Council, 1995). Instead, the objective in the following pages is to suggest the types of data that might be useful to pilots, how t,hc data should be integrated, and how it should be presented. To meet this objective, it is most efficient to adopt the philosophy of Herron and Witchey (2000), who in addressing aviation weather technologies, state that “ideas should be considered from the perspective of how things could be rather than how things are.” Therefore, in discussing weather information requirements and display recommendations, it is assumed that weather technologies will continue to improve. For example, current- day, onboard radar must be operated manually by the flight crew. Optimal and successful use of this equipment requires a substantial amount of experience on the part of the flight crew. However, Rockwell Collins (Kronfeld, 2003) has developed an onboard radar that utilizes algorithms to automate the tilt of the radar based on certain parameters (e.g., current altitude above the terrain). Therefore, it is reasonable to assume that this type of technology will be adopted in some form and onboard radar will be less vulnerable to some of the human error that currently compromises the information obtained from it. Numerous other development efforts are underway that aim to improve weather technologies (e.g., the National Aviation Weather Center has experimental products to make icing prediction, Bass & Minsk, 2001),
2

and the current assumption is that the quality, quantity, resolution, and frequency of information will continue to improve.
2.1 Recommendations for Weather Information in the Cockpit
The recommendations found throughout this paper are based on previous research and published literature. Because the major goal of the paper is to provide the recommendations, the information is presented in a non- traditional form. Specifically, rather than first presenting a review of the literature and only presenting the recommendations thereafter, this paper is organized around the recommendations. Therefore, relevant literature and research are discussed in the context of each recommendation.
2.1.1 The Weather Data to Collect and the Manner in which It Should be Processed
Recommendation 1: Obtain information that is based on multiple of weather.
Information is available about numerous types of weather phenomenon. In fact, the Rapid Update Cycle Model from the Forecast Systems Laboratory at the National Center for Environmental Prediction provides well over 200 types of weather information as its output, including such types as dew point, precipitation, visibility, etc. Clearly, the flight crew would not be interested in obtaining data about 200 types of weather phenomenon nor would they be able to mentally integrate that amount of information. However, a bias exists toward radar returns, and while radar returns may be very informative, a graphical display of radar reflectivity does not insure that the flight crew is approaching safe airspace. For example, clear air turbulence would not appear on a standard NEXRAD graphical image. Therefore, the current recommendation is to identify the types of weather that are of particular importance to the commercial aviation sector and to include only that information in a cockpit display of weather.
(Recommendations for how this information should be displayed are discussed in another section.)
Several previous efforts have addressed the types of weather that are particularly important in commercial aviation (FAA, 2001; Honeywell, 1999; Keel et al., 2000; Raytheon ATMSDI Team, 2002). Presented alphabetically, the following list may serve as a summary of their collective discussions and/or findings regarding important types of weather:
* Convection
Cyclones
* Hail
* Hurricanes
Icing
Lightning
* Precipitation
Temperature
Thunderstorms
* Tornados
* Turbulence
Visibilitykeiling
* Volcanic Ash
Winds
Two of the four sources used to create this list provide only a discussion of the important types of weather information (Keel et al., 2000; Raytheon ATMSDI Team, 2002). The third source (FAA, 2001) provides real-world summary statistics. Specifically, the National Aviation Safety Data Analysis Center (NASDAC) in the Office of System Safety of the FAA analyzed the National Transportation Safety Board Accident and Incident Database for the years 1991 through 2001. They found that weather-related accidents during Part 121
3

operations (scheduled flights) were most often attributed to:
0 Turbulence (75%)
* Winds (6.7%)
Precipitation (5.8%)
Visibility (3.3%)
Thunderstorms (2.5%)
The fourth source (Honeywell, 1999) presents the important weather types based on interviews with aviation weather experts: a pilot from American airlines, a pilot from Northwest airlines, an “aviation weather consultant,” and an expert from the National Center for Atmospheric Research. When responses from these experts are combined and tallied, the following types of weather are identified as the most important, with the first three being weighted equally important:
* Convection
Icing
* Turbulence
Volcanic Ash
Because research in this area clearly is lacking, the current suggestion is to implement a large- scale study that systematically identifies the types of weather information that are of importance to the commercial flight crew. The purpose here is simply to recommend that multiple types of weather be utilized when presenting weather information to the flight crew. These few previous works might serve as a point from which to begin efforts in this area.
Recommendation 2: Obtain information that is based on multiple sources of weather.
Whether or not a particular type of weather information may be obtained from multiple
sources is known. Therefore, once the first recommendation is met, identifying existing sources for the important types of weather is trivial. Of course, this statement is not meant to imply the actual collection of such information is a trivial matter, but a discussion of weather technologies is out of the scope of the current document.
Three potential advantages are afforded by utilizing multiple sources for one particular type of weather information, when available. First, in some cases, weather data may be presented at different time intervals, and having multiple sources may allow more frequent information updates than would otherwise be possible. Second, different sources may cover different portions of the airspace. A perfect example of this case is onboard weather radar and ground-based radar products. Onboard radar is more sensitive and timely than ground-based radar. However, it is limited in scope (Le., the area it can cover). Therefore, conibining onboard and ground-based radars would provide more comprehensive coverage. In fact, Rockwell Collins has made an initial attempt at this particular integration for this particular reason (Kronfeld, 2003). Third, having multiple sources for one type of weather information allows the accuracy of the data to be examined in real time. Once again, radar can be used as an example to illustrate why accuracy assessments might be important. Onboard radar can be subject to radar attenuation. Radar attenuation occurs when one weather cell absorbs or reflects all (or essentially all) of the signals sent by the radar. Therefore, if another weather cell lies behind this first cell, it goes undetected. In this case, ground-based radar might be able to detect the “hidden” cell. A comparison between the two sources of information might alleviate some problems like the radar attenuation problem. While these advantages might not be realized with every case in which multiple sources are available, the option of utilizing multiple sources should certainly be explored for each type of weather phenomenon.
4
Recommendation 3: Utilize an algorithm based on meteorological principles to create a meaningful integration of the various types of weather and various sources of weather.
At a most fundamental level, this algorithm should utilize variable thresholds, conditional probabilities, and weighting. In terms of thresholds, the algorithm certainly should include upper andor lower thresholds for particular weather variables. For example, the algorithm might include a wind speed that is an absolute threshold at which all aircraft at any altitude would be unable to tolerate. Conditional probabilities certainly would be useful in the algorithm. Casner (2002) and Keel et al. (2000) discuss various weather phenomena. From their discussions, the following list was created to demonstrate various weather variables that would be candidates for conditional probabilities:
* When the dew point is less than 3 deg C, fog tends to develop.
When an aircraft is between 10,000 and 25,000 feet, the chances of hail increase.
When lightning is frequent, the probability of a severe thunderstorm is high.
When a thunderstorm has a top of 35,000 ft or higher, they tend to be severe.
*
When a radar return shows large changes in intensity across short distances, chances of severe turbulence are high.
If the “shape” of a radar return resembles a finger, hook, U-shape or has scalloped edges, chances of hail are high.
0
Of course, this list is quite incomplete and is in too vague of a form to be useful. However, it demonstrates that meteorological phenomenon
have conditional probabilities associated with them. Finally, the algorithm should include differential weighting for the types of weather. For example, the presence of a tornado should certainly be weighted more heavily than the presence of fog. What is probably more interesting than mere weighting is conditional weighting. For example, Keel et al. (2000) explain that information about low-level winds is extremely critical during the landing phase of flight. The presence of strong winds could cause an aircraft to deviate from its flight path and could cause a ground collision. Therefore, during the landing phase of flight, winds should be weighted more heavily than when en route. The same holds true for precipitation. Precipitation could affect the aircraft’s ability to maintain proper contact with the runway, and clearly should be weighted differentially for the landing and takeoff phdses of flight.
Like the discussion associated with the first recommendation, the examples presented here serve only to demonstrate how the algorithm could be used. It is strongly advised that any algorithm include input from both meteorologists and aviation experts, and future efforts should be directed toward such input.
Recommendation 4: Include relevant, non- meteorological variables in the integration algorithm. While meteorological variables certainly are important, many non-meteorological variables should be incorporated in the algorithm. For example, each carrier has different philosophies and rules regarding weather variables, and of course, these would affect allowable thresholds of weather variables. Another example is aircraft type. Each aircraft has different sensitivities, and the allowable thresholds of some weather variables would change according to aircraft type. Finally, practical experience of experts might also be used to develop the algorithm. Rhoda and Pawlak (1999) suggest that controllers “know” that pilots generally will not penetrate precipitation that is N W S VIP level 3 (41 dbZ) or higher. Therefore, if there are
5

radar returns above 41 db, the algorithm might categorize it as unacceptable for flight. Examples also can be presented in which non- meteorological variables would yield conditional probabilities. For example, Casner (2002) presents several FAA recommendations that might take the form of conditional probabilities:
If there is a thunderstorm, do not fly under it.
If a thunderstorm covers 6/10 or more of an area, do not try to circumvent the thunderstorm.
If a thunderstorm is categorized as severe, avoid it by at least 20 miles. (This recommendation is especially important if an anvil is present.)
The examples presented here again serve only to demonstrate how the algorithm could be used. It is strongly advised that any algorithm include input from meteorologists and aviation experts of various specialties (e.g., the FAA, the airlines, engineers, etc.).
2.1.2 The Display of Weather Information The first four recommendations are related to the weather data. However, little guidance has been offered to developers as to the methods by which the weather data should be displayed (Raytheon ATMSDI Team, 2002, p. 23). This section contains recommendations regarding the display of weather data. The goal is to provide a display in which the weather data yields useful weather information for the flight deck crew.
Recommendation 5: Based on the algorithm discussed in the previous pages, create and display general “hazard zones.”
By presenting the flight crew with general “hazard zones,” the algorithm (and display) essentially automates the integration of weather information for the flight crew. At least three advantages are afforded by this
“automation.” First, automating the integration of weather information lessens the information processing burden for the flight crew. The advantages of this approach should be especially pronounced when the flight crew is under high mental workload conditions and their mental resources already are scarce (e.g., in an emergency or high traffic situation). Second, creating general hazard zones eliminates, what would otherwise be, a very cluttered display. Therefore, this recommendation is consistent with the following idea put forth by Bass & Minsk (2001): “Note that merely giving every weather hazard its own color schema and layering all weather products on one screen may not yield a useful product. Such a display may quickly become cluttered and difficult to interpret” (p. 3). Third, by automating the integration of information, pilots do not have to be concerned about misinterpreting information. Data collected by Forman et al. (1999) suggests that pilots may not fully understand even the weather information they receive on a regular basis. Specifically, Forman et al. administered a survey in which 124 pilots participated (45 of which were commercial pilots). One of the questions addressed the meaning of a Convective SIGMET (Significant Meteorological Information). The SIGMET is meant to alert pilots to convective activity, as it describes the location of a significant thunderstorm up to 2 hours in the future. SIGMETS are issued on a relatively regular basis. However, survey results suggest that most pilots believe that a Convective SIGMET represents present conditions or conditions up to 1 hour in the future. Therefore, even common weather information is being misinterpreted by pilots. If the algorithm on which it is based is valid, the general hazard zone would offset some of the current-day misinterpretations.
There are two alternatives to the current recommendation in which a hazard zone is utilized. The first is to have varying degrees of hazards. For example, Rockwell Collins (Kronfeld, 2003) has a display that
6

characterizes hazardous cells as “hazardous” or “possibly-hazardous.” This approach is not recommended, as the use of varying characterizations creates the risk of misinterpretation. For example, Bass and Minsk (2001) describe a case in which dispatchers interpreted a color-coding scheme to mean that the current icing levels were severe rather than the fact that the probability of icing was high. Because the recommended algorithms already incorporate both current data and some associated probabilities and thresholds, there is no need to have varying levels of hazards displayed. The second alternative is to present “go” and “no-go’’ areas. In fact, Rockwell Collins (Kronfeld, 2003) also utilizes this approach, as they categorize some areas as “non-hazardous.” The recommended approach is to avoid using categories such as “go” and “non- hazardous.” These categories provide the erroneous implication that “go” regions (or even non-specified regions) are deemed undoubtedly safe. Of course, no region of airspace can ever be deemed as undoubtedly safe. Therefore, the current recommendation does not include the use of “nonhazardous” or “no-go’’ zones but includes only the use of a “hazard” or “no-go” zone. Such a “hazard” zone might be conceived as being analogous to a work zone on a freeway. The driver knows the closed area of the freeway has been identified as having characteristics that are not conducive to safe driving. However, the driver does not assume that any open portion of the road will be without hazards.
Recommendation 6: Create and display “insufficient data” zones to inform the user that there is either no data or insuflcient data to determine if an area is hazardous.
Outside of the hazard zone, one other type of zone is recommended for the weather display. Specifically, it is important to notify the flight crew when an area has either no weather data available for an area or if the data is insufficient to determine the safety of the
airspace. For such “unknown” regions, the desired response is one in which the flight crew would approach it only with extreme caution and only when necessary. If areas having insufficient data are simply Ieft uncoded, the flight crew would assume that the area simply did not meet the criteria for being categorized as hazardous and would treat it accordingly.
In sum, the primary recommendations for the display of weather are to present “hazard zones” and “insufficient data” zones. However, Recommendation 7 and Recommendation 8 present options to complement these base options. These options are consistent with a recommendation put forth by the Raytheon ATMSDI Team (2002). The team suggests that the user should be allowed to view information at ‘different levels of abstraction, and these next two recommendations represent the ability of the flight crew to view weather information at a complementary level of abstraction.
Recommendation 7: Provide the flight crew with the ability to access the list of weather variables that are responsible for “creating” a hazard zone andlor any weather variables that might be available about an “insufficient data” zone.
Allowing the flight crew to view the list of relevant weather variables is important for several reasons. First, because this option provides a sense of an “open system,” the flight crew eventually will get a sense of the variables that the algorithm utilizes. By repeatedly viewing this list, the hope is that the flight crew may begin to build trust in the system. Second, this option is important for the zones that have “insufficient data.” By allowing the flight crew this option, they can determine if there is any data available for a particular “insufficient data” zone. Finally, this list would serve to help the flight crew determine if they would like to view any particular type of weather information in isolation (see Recommendation 8).
7

In terms of the implementation of this option, it is recommended that the list only appear upon request. For example, imagine a simple algorithm were being used in which five weather variables were included. A pilot might place a cursor over a “hazard area,” and a list of 3 weather variables might appear. This list would inform the pilot as to which 3 of the 5 variables were of some importance in this area. If the list is viewed only upon request, display clutter does not become an issue, but the flight crew is allowed access to the information at any time.
Recommendation 8: view weather variables in isolation on an as- needed basis.
Allow the flight crew to
As mentioned in the context of Recommendation 7, providing an “open system” will encourage flight crews to build trust in the system. The hope is that pilots will not frequently utilize this option. In fact, to obtain this specific of information, it is recommended that the flight crew be required to take some extra step (e.g., hit an extra button). Having to take the extra step will encourage pilots to utilize this information only when it is truly needed. However, there may be instances when the flight crew absolutely needs information about a particular type of weather. Therefore, making this specific information unavailable to flight crews, when it is available, would be quite inappropriate. On the other hand, providing them with this option does create complications. Specifically, it yields all of the problems associated with display clutter and raises questions regarding the best means by which all of the weather information should be coded. To offset the costs associated with adhering to this recommendation, three options are suggested in the following paragraph.
When allowing access to specific weather information, the first option is to allow the flight crew the ability to view only one type of
weather information at a time. If research suggests that information overlay is important (i.e., viewing multiple weather types simultaneously), then the second and third options certainly should be considered. The second option is to limit the type of information that may be viewed independently. For example, the display might limit graphical representations to include only traditional data (radar returns, lightning, etc.). The probabilities or the more obscure (but important) information included in the algorithms might be excluded from the independent viewing option. The final option might be to include a “clear all” button, in which the flight crew can quickly return to the aggregated data (Le., where only “hazard” and “insufficient data” zones are displayed). While each of these three.options may be helpful, the issues raised by this recommendation are ones that need empirical research to determine the best implementation of the recommendation.
Recommendation 9: weather iitformution on the display.
Display the age of the
The Raytheon ATMSDI Team (2002) describes one of the current-day problems with the age of weather data:
NEXRAD data may already be 5 or 6 minutes old when it reaches the weather service provider, and may take up to 1 additional minute to be broadcast. Therefore, weather data may be up to 7 minutes old when it is initially presented on a cockpit display. In addition, the NEXRAD data are updated only every 7 minutes. The result is weather data that may be 14 minutes old (p. 19).
As discussed in the opening paragraphs about weather, the current approach is to work under the assumption that technologies will continue to improve. Therefore, this description of data lag is considered a worst case scenario. However, even in the best case scenario, it is important for the flight crew to be presented
8

with the age of the weather information. This task is straightforward for the option in which weather variables are viewed in isolation. However, the question of age becomes more complicated when the default display options are in use. Specifically, when weather data are combined to create the general “hazard” and “insufficient data” zones, the data used will be of different ages at any moment in time. Therefore, it is a question as to whether the flight crew should be presented with the age of the oldest or age of the most recent data that have been incorporated in the algorithm. A safe approach, at this time, is to suggest that the age of the oldest and the age of the most recent data be displayed. However, the eventual answer to this question is probably that it depends on the particular data that are utilized in the algorithm. Empirical research is needed to address this particular question.
2.1.3 Closing Remarks about Weather
The preceding pages present nine recommendations pertaining to weather information in the flight deck of commercial aircraft. Several of these recommendations addressed the weather data itself (the types of data to obtain and how it should be processed), and several of these recommendations addressed the display of this information. The following section addresses traffic information for the cockpit. However, the discussion later returns to weather, when the integration of weather with traffic information is addressed. In that section, further recommendations are put forth that include recommendations about weather information.
Information in the Cockpit
3. Traffic In general, the aviation community has accepted the concept of “free flight,” albeit to varying degrees. Most definitions of free flight address the idea that the flight crew plays an active role in managing their flight path through the airspace (RTCA, 1995). Presumably, a future free flight environment will grant less control to ground controllers and will provide an increasingly greater
amount of freedom and responsibility to the flight crew. In terms of the bottom line, future free flight environments may save dollars, as aircraft can “freely” traverse along paths that are most efficient for them. However, such an environment lacks the structure of the traditional national airspace system, and an adequate cockpit display of traffic information is absolutely necessary for safety purposes. An adequate cockpit display of traffic information would allow pilots to make safe decisions; such a display would provide the flight crew with a complete and intuitive picture of the surrounding traffic and would support traffic avoidance activities.
3.1 Recommendations for Traffic
Unlike the discussion of weather, the discussion of a cockpit display of traffic information (CDTI) does not provide recommendations, but reviews previous work. Specifically, the Ames Flight Deck Display Research Group at NASA Ames Research Center has spent approximately 10 years performing research and development on concepts related to a CDTI. As such, presenting recommendations here would be unfruitful and redundant with their work. Instead, their approach is discussed, and because it is based on a long-standing research and development program, should be used implicitly as a set of potential recommendations. In addition to the Ames Flight Deck Display Research Group, the Society of Automotive Engineers (SAE) put together a subcommittee who created interface criteria for the CDTI (SAE G-10 Cockpit Display of Traffic Information Subcommittee, 1999). The approach of the Ames Flight Deck Display Research Group has been consistent with these recommendations, with only a few exceptions. These exceptions are mentioned in the following paragraphs.
Information in the Cockpit
9

3.1.1 The Traffic Data to Collect and the Manner in which It Should be Processed
While complicated, information requirements for traffic separation are less complicated than for weather avoidance. Of course, there are different types of traffic, as there are different types of weather. However, all types of traffic share one commonality: impact with it is catastrophic. Therefore, the flight crew must know the current position of all aircraft (regardless of type) and there is no need for differential weighting and the like. Current position information can be obtained easily if the assumption is made that all aircraft are equipped with Automatic Dependent Surveillance-Broadcast (ADS-B). This technology allows aircraft to transmit and receive three-dimensional position information via data link.
Providing current position information meets the requirements for the task. However, the Ames Flight Deck Display Research Group also incorporates an alerting algorithm in the CDTI concept (Johnson, Battiste, & Holland, 1999). This algorithm utilizes current three- dimensional position information and current velocity to determine if a conflict is likely with each aircraft. If flight plans are available, this information also is utilized. For a more detailed discussion of this algorithm, see Carpenter and Kuchar (1997) and Yang and Kuchar ( 1998).
In sum, the activities of the Ames Flight Deck Display Group suggest that the minimum types of data that requires collection are (1) current position of surrounding aircraft and (2) current velocity of surrounding aircraft. When possible, the flight plans of surrounding aircraft should be obtained. Finally, the Ames group utilizes an algorithm that incorporates these variables to determine probabilities of collision.
Ames Flight Deck Display Research Group is consistent with the recommendations put forth by SAE, with only two exceptions. First, the S A E subcommittee recommends that the CDTI system should detect and communicate failures in its operation, and second, the subcommittee recommends that the system should be capable of integrating data from multiple sensors or datalinks to provide the best information to the flight deck crew (SAE G-10 Cockpit Display of Traffic Information Subcommittee, 1999). These recommendations are closely tied with the real-world implementation of a CDTI, as such the Ames Flight Deck Display group has chosen to address the recommendations at a later date.
3.1.2 The Ames Flight Deck Display Research Group has focused much of its efforts on the display of traffic information in particular. Johnson, Battiste, and Holland (1999) describe many of the display characteristics and options, but the group’s web site contains more recent developments and efforts
factors.arc.nasa.gov/ihh/cdti/index.html), and the SAE document has many recommendations for the display of traffic information as well. Therefore, any recommendation presented here would be redundant with previous efforts. Instead of presenting recommendations, the important features of the Ames Flight Deck Display Research Group’s CDTI are reviewed in the following paragraphs. These might be taken implicitly as recommendations. Again, any supplemental information provided by the SAE subcommittee is addressed as well.
The Display of Traffic Information
(Cf., http://hUman-
In terms of information collection and information processing, the approach of the
10
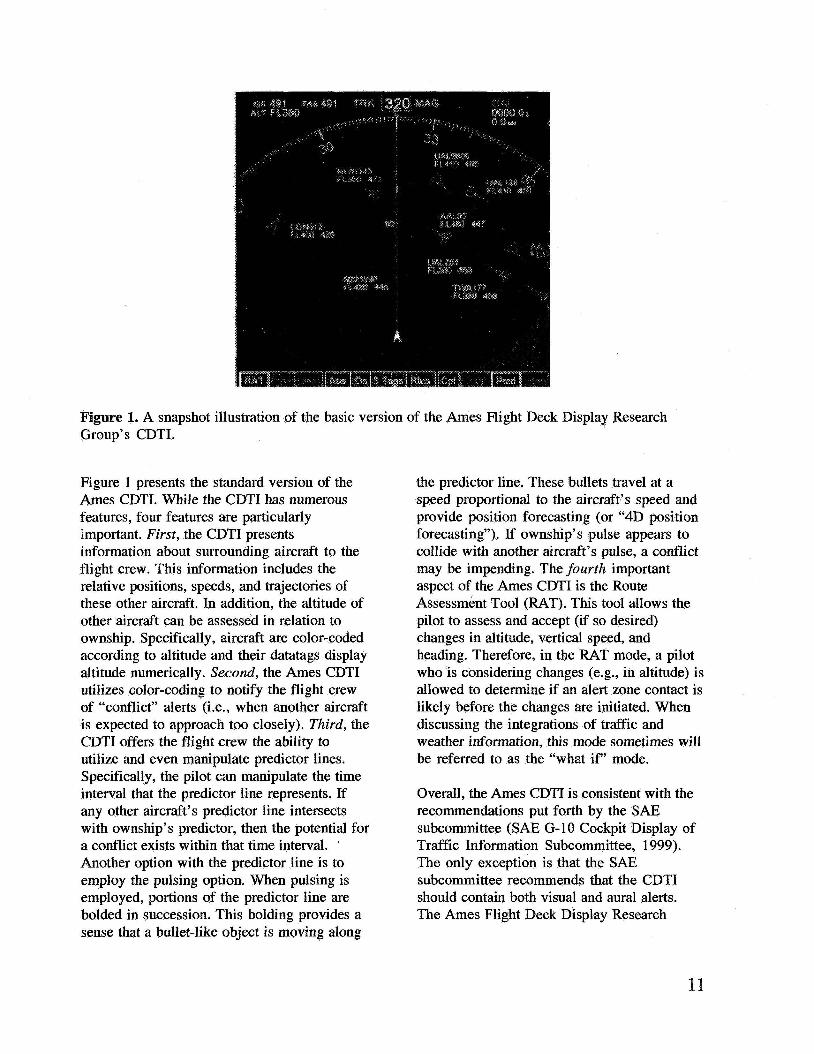
Figure 1. A snapshot illustration of the basic version of the Ames Flight Deck Display Research Group’s CDTI.
Figure 1 presents the standard version of the Ames CDTI. While the CDTI has numerous features, four features are particularly important. First, the CDTI presents information about surrounding aircraft to the flight crew. This information includes the relative positions, speeds, and trajectories of these other aircraft. In addition, the altitude of other aircraft can be assessed in relation to ownship. Specifically, aircraft are color-coded according to altitude and their datatags display altitude numerically. Second, the Ames CDTI utilizes color-coding to notify the flight crew of “conflict” alerts (Le., when another aircraft is expected to approach too closely). Third, the CDTI offers the flight crew the ability to utilize and even manipulate predictor lines. Specifically, the pilot can manipulate the time interval that the predictor line represents. If any other aircraft’s predictor line intersects with ownship’s predictor, then the potential for a conflict exists within that time interval. . Another option with the predictor line is to employ the pulsing option. When pulsing is employed, portions of the predictor line are bolded in succession. This bolding provides a sense that a bullet-like object is moving along
the predictor line. These bullets travel at a speed proportional to the aircraft’s speed and provide position forecasting (or “4D position forecasting”). If ownship’s pulse appears to collide with another aircraft’s pulse, a conflict may be impending. The fourth important aspect of the Ames CDTI is the Route Assessment Tool (RAT). This tool allows the pilot to assess and accept (if so desired) changes in altitude, vertical speed, and heading. Therefore, in the RAT mode, a pilot who is considering changes (e.g., in altitude) is allowed to determine if an alert zone contact is likely before the changes are initiated. When discussing the integrations of traffic and weather information, this mode sometimes will be referred to as the “what if’ mode.
Overall, the Ames CDTI is consistent with the recommendations put forth by the SAE subcommittee (SAE G-10 Cockpit Display of Traffic Information Subcommittee, 1999). The only exception is that the SAE subcommittee recommends that the CDTI should contain both visual and aural alerts. The Ames Flight Deck Display Research

Group is currently exploring the possibility of aural alerting and voice inputs.
4. Weather and Traffk The integration of weather information with traffic information should be beneficial on a theoretical basis. Boyer and Wickens (1994) state that “. ..integrating information across several spatial locations into one display reduces the amount of visual scanning and ‘mental gymnastics’ that would be needed if more than one view display is used” (p. 10). Such information integration also is consistent with the Proximity Compatibility Principle (cf., Wickens, 1992, p. 98-101). This principle suggests that, when mental integration or divided attention is required, sources of information should be physically proximal. Therefore, the current approach is not without theoretical support.
4.1 Recommendations for Integrating Weather Information with a Cockpit Display of Traffic Infor mation
The following pages present recommendations regarding the integration of weather and traffic information. Unlike the previous discussion of weather and previous discussion of traffic, issues regarding data collection and processing are not addressed. These issues were addressed in the previous pages, where weather and traffic were discussed in isolation.
4.1.1 The Display of Weather Information as Integrated with TraBc Information
Recommendation IO: Allow the flight crew to display weather and traffz information from various viewpoints, including a perspective (three-dimensional) viewpoint.
Because the nature of airspace is three- dimensional, the flight crew should have access to a three-dimensional rendering of the information. As an example, Figure 2 provides an illustration of the Ames CDTI, which allows the user to view traffic in a perspective format. A display that allows a perspective viewpoint is
considered ecologically valid and theoretically should provide better support when the flight crew must make relative judgments (e.g., will my flight path pass through that weather cell?). However, there has been mixed support for the use of perspective displays (e.g., Boyer & Wickens, 1994), and under some circumstances, there are clear advantages to other display perspectives. For example, when wanting to make relative altitude judgments, a profile view would probably be superior. Therefore, like the Ames CDTI, an integrated display should provide the user with the ability to view information from a perspective (3D), plan (top-down), or profile (side) view. Such a display should support tasks of varying sorts.
Recommendation 11: Create visual momentum for transitions between viewing perspectives.
Visual momentum was originally used by screen editors to provide a sense of continuity across different “shots” (O’Brien & Wickens, 1997, p. 10). In the context of cockpit displays, visual momentum is provided when a smooth transition between viewpoints is provided. For example, imagine that a pilot was viewing weather and traffic in a planar (top down) perspective and wanted to change to a profile (side) perspective. A smooth transition between the two perspectives would provide visual momentum and theoretically would eliminate any disorientation caused by the change in viewpoints. In fact, this type of transitioning was precisely what Hollands, Ivanovic, and Enomoto (2003) examined in their study. They provided either a continuous or discrete transition between two-dimensional and three-dimensional renderings of terrain. Participants were asked to answer questions about the relative position of two objects. Reaction times to answer the questions were shorter and accuracy was greater when the transition between perspectives was continuous. This result suggests that visual momentum is an important technique to use when multiple display perspectives are provided.
12
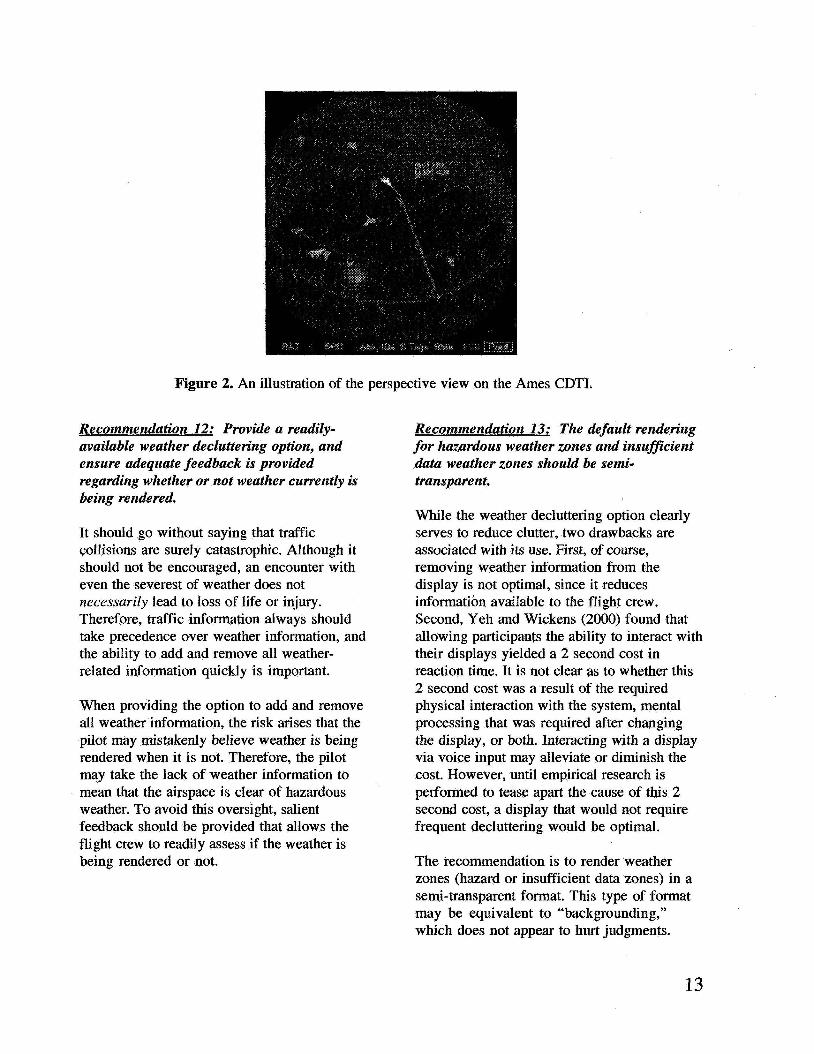
Figure 2. An illustration of the perspective view on the Ames CDTI.
Recommendation 12: Provide a readily- available weather decluttering option, and ensure adequate feedback is provided regarding whether or not weather currently is being rendered.
It should go without saying that traffic collisions are surely catastrophic. Although it should not be encouraged, an encounter with even the severest of weather does not necessarily lead to loss of life or injury. Therefore, traffic information always should take precedence over weather information, and the ability to add and remove all weather- related information quickly is important.
When providing the option to add and remove all weather information, the risk arises that the pilot may mistakenly believe weather is being rendered when it is not. Therefore, the pilot may take the lack of weather information to mean that the airspace is clear of hazardous weather. To avoid this oversight, salient feedback should be provided that allows the flight crew to readily assess if the weather is being rendered or not.
Recommendation 13: The default renLc..’ring for hazardous weather zones and insufficient data weather zones should be semi- transparent.
While the weather decluttering option clearly serves to reduce clutter, two drawbacks are associated with its use. First, of course, removing weather information from the display is not optimal, since it reduces information available to the flight crew. Second, Yeh and Wickens (2000) found that allowing participants the ability to interact with their displays yielded a 2 second cost in reaction time. It is not clear as to whether this 2 second cost was a result of the required physical interaction with the system, mental processing that was required after changing the display, or both. Interacting with a display via voice input may alleviate or diminish the cost. However, until empirical research is performed to tease apart the cause of this 2 second cost, a display that would not require frequent decluttering would be optimal.
The recommendation is to render weather zones (hazard or insufficient data zones) in a semi-transparent format. This type of format may be equivalent to “backgrounding,” which does not appear to hurt judgments.
13

Specifically, Yeh and Wickens (2000) asked participants to answer questions about a map (e.g., Is unit j in the northeast comer?). They found that “. . .totally eliminating irrelevant background information provided no benefits over simply ‘backgrounding’ that information” (p. 10). Therefore, no cost should be associated with making the weather zones semi-transparent. Yet, this format provides the benefit of allowing the pilot to see traffic that may be above, below, or behind a weather zone. As a result, the flight crew should not have to use the decluttering option as often as they otherwise would have, and the semi-transparent format has the added benefit of having properties that are consistent with the real-world variable (that is, when we think of weather, we think of clouds.
Recommendation 14: Provide a representation of forecasted hazard zones and their movement over time.
Upon request, the flight crew should have access to a graphical representation of forecasted hazard zones and their movement over time. In terms of being able to distinguish current weather from forecasted weather, the mere movement of the forecasted zones will serve as a distinguishing characteristic from current weather zones. As discussed in the section on traffic, the AMES CDTI contains 4D position forecasting for ownship via a pulsed predictor line. If this option of 4D position forecasting is adopted, the simultaneous display of the pulsed predictor and forecasted hazard zones should allow for a very easy determination as to whether or not a conflict with a hazard zone is likely. Specifically, the pilot should be able to easily identify if the pulse moves down an aircraft’s predictor line and intersects with an area that is designated as a “hazard zone.”
Of course, having continuous graphical representations of dynamic, forecasted zones is certainly not practical in terms display clutter. These forecasted cells should be displayed only upon request. Recommendation 15
describes a complementary option that insures the flight crew will be notified if a potential weather zone penetration is imminent, even in the absence of the graphic representations of forecasted hazards.
Recommendation 15: Highlight portions of the aircraft’s predictor line as a warning that the flight plan intersects with the position of a forecasted hazard zone.
By highlighting the predictor line if the flight plan intersects with a forecasted hazard zone, the flght crew is notified of the potential danger without the clutter of a graphical rendering of the forecasted zone. In fact, highlighting the predictor line not only notifies the flight crew of the potential danger, but it provides location !dormation. Therefore, the flight crew can quickly discern the immediacy of the potential weather hazard by noting how “far out” on the predictor path the highlighting appears. If time allows, the flight crew could employ the graphical option for forecasted weather, as discussed in Recommendation 14.
Recommendation 16: Provide a “what ij” tool that allows for the assessment of rerouting options for the simultaneous avoidance of weather and traffic.
This tool might be a combination of the RAT tool utilized on the Ames CDTI (Johnson et al., 1999) and the option described in Recommendation 15. Specifically, as when using the RAT tool, any proposed change to the flight path that yields a traffic conflict would result in some coding of the traffic (e.g., both ownship and the conflicted aircraft are coded yellow). In terms of weather, the “what if’ mode should (by default) include a graphical representation of the forecasted hazard zones. In this manner, the flight crew can obtain the “big picture” about the weather when considering reroutitlg strategies. If a proposed change to the flight plan yields an intersection with a hazard zone, the flight
14

path should be highlighted accordingly (as described in Recommendation 15).
Two studies raise questions about biases in judgments when attempting to avoid weather hazards. Specifically, Boyer and Wickens (1994) asked participants to find a safe route through weather hazards, and they found that participants created shorter, more efficient paths with the two-dimensional display. A second study, performed by O’Brien and Wickens (1997), found that the mere integration of weather and traffic onto a single display (2D or 3D) yielded increased deviations on the horizontal axis and decreased deviations on the vertical axis. However, both of these potential biases should be offset with the current “what if” tool. Because the predictor line becomes highlighted when it comes in contact with a representation of weather, pilots should have no problems in finding the most efficient path. That is, they can simply move the path slowly until it becomes highlighted, at which point, they will know the path has been moved too far.
5. Previous Research and Development Activities
The previous pages have presented an initial set of recommendations for the cockpit display of weather information, traffic information, and the integration of the two. Of course, these recommendations are meant to act as suggestions as to how the flight crew would be served best. However, other researchers have spent time developing systems, and some of these systems are directly relevant to the current effort. Five research and development efforts should be recognized in terms of their relevance to current discussion. The first, and perhaps the most comprehensive system, is the one developed by Honeywell (1999). They developed a decision aid that utilizes a wide variety of input including: wind, weather, a navigation database, an aircraft performance database, and a world map. The display allows the user to visualize the aircraft trajectory from both a planar and profile view.
It further identifies the airspace that is affected by the following types of weather: convection, icing, ozone, turbulence, ash, and a user defined type of weather. A constant hue is used to distinguish between each type of weather, and intensity is used to indicate the severity of the particular type of weather. Given the aforementioned recommendations, this system might be improved by including the option of a three-dimensional rendering of the airspace and providing the option of having the weather information integrated. However, this system is meant to be a preflight planning tool, and the goals of such a tool are different than an onboard display.
Second, researchers at NASA Langley (Ballin, Sharma, Vivona, Johnson, Ramiscal, 2002) have developed the Autonomous Operations Planner (AOP). “The AOP is d flight deck- based decision support research system that is currently under development.. .It assists a flight crew in mission planning and execution, as needed for future civil operations under the DAG-TM paradigm” (p. 4). The AOP essentially takes boundaries for any area hazard (e.g., special use airspace, weather, terrain) and determines if ownship trajectory penetrates these boundaries. However, the current version of AOP only recognizes two- dimensional polygons. Based on the current recommendations, the AOP might prove more useful if it eventually accepts three- dimensional information. In addition, the AOP does not appear to distinguish between the types of weather it utilizes; weather is merely represented by a two-dimensional portion of airspace. Furthermore, the AOP does not distinguish between weather hazard zones, terrain, or special use airspace. This approach may be problematic because mistakenly entering one type of airspace may result in very different consequences than entering another (e.g., entering a hazardous weather zone does not necessarily lead to catastrophe, whereas encountering terrain does). Therefore, the AOP may serve the flight crew better if the types of hazard zones were distinguished for the flight crew.
15

A third effort was put forth by Scanioa (1992). This earty effort is, in fact, one of the most comprehensive in its attempts to present various types of weather in the cockpit. The proposed display included surface observations, terminal forecasts, ceilings, visibility, radar returns, and lightning. In light of the present recommendations, however, this display probably would serve the flight deck better if each type of weather infomation were not presented on different “pages” of the display. Such infomation separation requires a great amount of mental effort in order to create a “mental picture” of the weather situation.
The fourrh effort that deserves mention is another project undertaken at Honeywell Laboratories. Specifically, Dorneich, Ologinboba, Vemers, Winchester, and Krishnamurthi (20023 developed a concept called ANCOA (Alerting and Notification of Conditions Outside the Aircraft). Their effort does not appear to recognize the different types of weather, but it is thorough ia ffie sense that it acknowledges weather, u&c, terrain, and mission. Given the previous set of recomendations, the ANCOA system d g b t better serve the flight deck if the information were integrated into one display. la the current system, the information regarding weather, traffic, terrain, and mission are split between the primary flight display and the navigation display. For example, the primary flight display shows only a textual message to warn of weather, but the navigation display presents a top down view of hazards.
The fiflh and final &€or& that should be mentioned is one being undertaken by the h e s Right k k Display Research Group. As described in the section about trdfic, the h s Flight Deck Display Research Group has a mature CDTL They currently are undergoing efforts to incorporate weather into their display and are attempting to adhere io some, if not dl, of the aforementioned recommendations. Their initial efforts are
described on their website (http:/lbuman- €actors.arc.nasa. govlihhlcdti/3d_cd~~i13dcdti.htm 1).
6. Conchding Remarks and Future Directions
The preceding recornendations should be rreareed as an initiat set of recomtuenclations for an integrated display of weather and traffic idormation. Many, if not most, of the recomrnendations should be explored empirically and practically. One activity is particularly important in future efforts. Cockpit weather information requirements should be clearly defined to serve as a foundation for any cockpit display that contains weather information. As a first step, pilots should be queried as to the types of weather infomatian they use, when they use it, and how they use it. Latorella, Lane, and Garland (2002) collected such information, but the respondents were general aviation pilots. These results m y not be valid for Part 121 operators, as general aviation pilots fly at lower altitudes and with different aircraft capabilities. The Honeywell team (1999) did include two commercial airline pilots in their interviews. However, input from a greater nuhnber of pilots would be optimal. Waving a display that contains weather and traffic infomation cannot be expected to increase sdety, unless the display contains infomation that pilots actually need and want.
As was mentioned at the opening of this document, the ultimate goal is tu provide support for safe navigation. To best support safe navigation, a logical measure is to integrate the sources of conslict onto one display &e., to integrate traffic, weather, and terrain infomation on a cockpit display). The current effort focused on a display that initially incorporates weather and traffic. Some teams have been examining terrain information in isolation, aod when an efForf eventualfy is made tu integrate weather, traffic, and terrain, these teams certainly should be consulted. For example, a team at NASA Langley Research Center has developed a
synthetic vision system that provides terrain information. Several other research teams, such as the U.S. Air Force Research Laboratory, are actively developing similar systems. (For a review of such activities, see Snow and French, 2002). The eventual incorporation of terrain into a display of traffic and weather may be as difficult as the initial integration of traffic and weather. Terrain is like traffic (but not weather), in that it is a certain obstruction. Therefore, a reasonable argument might be that terrain information should be a constant display feature. If so, display clutter certainly will be an issue. Human factors research is clearly needed to determine the needs of the flight crew in terms of terrain information before attempts are made to integrate traffic, weather, and terrain.
While this paper is meant to address the display of weather and traffic information for the flight deck, it is clear that much work
needs to be done to improve the system as a whole. The Raytheon ATMSDI Team (2002) discusses weather in particular, but they succinctly provide an example of current-day problems: “The flight crew has 3 levels of intensity from onboard radar, while the dispatcher has 16 levels from a variety of sources, and the FAA staff have 3 levels from ground based radar (if they use the FAA certified weather radar data)” (p. 31). A combination of tradition, certification challenges, and training costs may be responsible for problems such as these. However, in this day and age, technologies can no longer be used as an excuse as to why all parties of the national airspace system do not utilize, view, and communicate about a common set of data. Work should be directed toward this ultimate goal, as clear communication between the pahies of the national airspace system is a precursor to safe skies.
17

.
7. Referenoes Ballin, M. G., Sharma, V., Vivona, R.A., Johnson, E.J., & Ramiscal, E. (2002). A Flight Deck Decision Support Tool for Autonomous Airborne Operations, AIAA-2002-4554, Reston,VA, AIAA
Bass, E. J. & Minsk, €3. S. (2002). Toward integrating real-time and forecast weather hazards information for improved pilot decision making. Eleventh lizm-national Symposium on Aviation Psychdogy. Colwnbus, OH, March 5-8, 2001.
Boyer, S.B. & Wickens, C.D. (1994). 3D weather displays for aircraft cockpits. (Tech. Report ARL-94-1 I fNASA-94-4).
Carpenter, B.D. & Kuchar, 3.K. (1997). Probabiiity-based collision alerting logic for closely-spaced pardlei approach. 35th Aerospace Scienees Meering Le Exhibit, Reno, NV, January 6-10, 1997.
Casner, S.M. (2002). Cockpit Automation. Ames: Iowa State Press.
Dorneich, M.C., Ofofinboba, Q., Ververs, P.M., Winchester, W., & Krishnamurthi, S. (2002). Alerting and notification of conditions outside the aircraft (ANCOA): Integrated alerting guidelines and conceptual design (Tech. Report Contract NAST-00107).
Federal Aviation Administration (2002). Commercial aviationlCAST agenda issues. Retrieved June I1 ,2002 from http:f/www .faa.gov/ apdsafer-skies/chhtm.
Federal Aviation Administration (2001). NASDAC Review of NTSB Weather-Related Accidents, Retrieved November 2,2003 from http:/lwww .mdac f . Rov/aviation-studies/weat her-shldyls~dyindex.ht.ml.
Forman, KE., Wolfson, M. M., Hallowell, R. G., & Moore, M. P. (1999). Aviation user needs €or convective weather fmcasts. American Meteorological Society 79" ~ n n u u l Conference, Dallas, TX, January 10-15, 1999. Retrieved December 10,2003, from http:llwww .ll.mit.edulAviationWeather~s~-n~ ds.pdf
Herron, R.G. & W'itchey, R.D. (2000). Aviation weather communications requirements, technology, and solutions. Presented at AYSP Program Review, Hampton, VA? May 23 - 25,2000.
Hollands, J.G., Ivanovic, M. & Enomoto, Y. (2003). Visual momentum and task switching with 2D and 3D display; with geographic terrain. Proceedings of the Human Factors and Ergonomics Society 47" Annual Meeting, Santa Monica, CA,
Honeywell (1 999). Weather avoidance using route optimization as a decision aid: An A W N topical study. Final report, November, 23, 1999. (Cooperative agreement with NASA *gley Research Center NCC-1-291).
Johson, W.W., Battiste, V., & Holland, S. (1999). A cockpit display designed to enable limited flight deck separation responsibility. Proceedings qf &E I999 World Aviation Conference, Anaheim, CA.
Keel, B.M., Stancil, C.E., Eckert, C.A., Brown, S.M,, Gimmestad, G.G., & Richards, M.A. (2000). Aviatit'ozz Weather Information Requirements Study (Tech. Report NASIVCR- 2000-210288). Retrieved June 13, 2002, from http://techreports .larc.nasa. gov/ltrflDH2000/crI NASA-2000-cr21 0288.pdf
Kronfeid, K.M. (2003). Enhanced Weather Radar (EWxR) System. (Tech. Report NASNCR-2003-2 12406).
18

Latorella, K., Lane, S., & Garland, D. General aviation pilots’ perceived usage and valuation of aviation weather information sources.
National Research Council (1995). Aviation weather services: A call for federal leadership and action. Washington, D.C.: National Academy Press.
O’Brien, J.V. & Wickens, C.D. (1997). Cockpit displays of traflc and weather information: Efsects of dimension and data base integration. (Tech. Report ARL-97-3lNASA- 97-1).
Raytheon ATMSDI Team (2002). Air Traffic Management System Development and Integration. (Cooperative agreement with NASA Ames Research Center, Contract number NAS2-00015).
Rhoda, D. A. & Pawlak, M. L. (1999). An Assessment of Thunderstorm Penetrations and Deviations by Commercial Aircraft in the Terminal Area. (Tech. Report NASNA-2). Lexington, MA: Massachusetts Institute of Technology, Lincoln Laboratory.
RTCA (1995). Report on the RTCA board of directors’ select committee on j-ee jlight. Washington, DC: RTCA, Inc.
SAE G- 10 Cockpit Display of Traffic Information Subcommittee (1 999). Human Interface Criteria for Cockpit Display of Trafic Information. SAE, Warrendale, PA.
Scanlon, C.H. (1992). A graphical weather system design for the NASA transport systems research vehicle B-737. (NASA Technical Memorandum 104205).
Snow, M. & French, G. (2002). Enhancing awareness in the cockpit. Aerospace Engineering, JanuaryIFebruary 2002, Warrendale, P A SAE.
Wickens, C.D. (1992). Engineering Psychology and Human Performance (2nd ed.). New York Harper Collins.
Yang, L. & Kuchar, J. (1998) fJsing intent information in probabilistic conflict analysis, Proceedings of the AIAA Guidance, Navigation, and Control Conference, Boston, MA.
Yeh, M. & Wickens, C.D. (2000). Attention jZtering in the design of electronic map displays: A comparison of color-coding, intensity coding, and decluttering techniques. (Tech. Report ARL-00-4lFED-LAB-00-2).
19

Form Approved OMB No. 0704-01 88
Report Documentation Page blic reporting burden for this collection of information is estimated Io average 1 hour per response. including the time for reviewing instructions, searching existmg data sources. gathering and iintaining the dala needed, and completing and reviewing Ihe collection of information Send comments regarding this burden estimate or any other aspect of this collection of information, including igestions for reducing this burden, Io Washington Headquarters Services. Directorale for lnformalio n Operations and Reporls, 1215 Jefferson Davis Highway, Suite 1204, Arlington, VA 22202-4302, d Io Ihe Office of Management and Budgel, Papeiwork Reduction Project (0704-0188). Washington, DC 20503
1. AGENCY USE ONLY (Leave blank) 2. REPORT DATE 3. REPORT TYPE AND DATES COVERED
July 2004 Technical Memorandum I I
4. TITLE AND SUBTITLE
Recommendations for a Cockpit Display that Integrates Weather Information with Traffic Information 6. AUTHOR(SJ
Doreen A. Comerford
7. PERFORMING ORGANIZATION NAME(S) AND ADDRESS(ES)
NASA Ames Research Center Moffett Field, California 94035- 1000
9. SPONSORlNGlMONlTORlNG AGENCY NAME@) AND ADDRESS(ES)
National Aeronautics and Space Administration
11. SUPPLEMENTARY NOTES
5. FUNDING NUMBERS
728-20-40
8. PERFORMING ORGANIATION REPORT NUMBER
IH-055
10. SPONSORlNGlMONlTORlNG AGENCY REPORT NUMBER
NASNTMi 2004-212830
Point of Contact: Doreen A. Comerford, M / S 262-2, Ames Research Center, Moffett Field, CA 94035 (650) 604-1508
12A. DlSTRlBUTlONlAVAILABlLlTY STATEMENT 128. DISTRIBUTION CODE Subject Category: 54-03 Distribution: Public Availability: NASA CAS1 (301) 621-0390
13. ABSTRACT (Maximum 200 words)
This effort was supported by the System-Wide Accident Prevention element of NASA’s Aviation Safety Program. This document may serve as a first step toward the goal of integrating traffic, weather, and terrain information; it provides recommendations for a cockpit display that integrates weather information with traffic information. While some of the recommendations are general enough to be used for any type of operations, these recommendations are targeted for Federal Aviation Regulations Part 121 Operations. The document is organized in the following manner. First, weather information is discussed as an independent subject matter, and recommendations are presented for presenting weather in the cockpit. Second, traffic is discussed independently, but this discussion essentially reviews work on the display of traffic in the cockpit. Third, recommendations for the cockpit integration of weather and traffic information are discussed. Fourth, several research groups are recognized for their efforts in developing systems that are relevant to the current discussion. Finally, closing remarks provide suggestions for future efforts.
14. SUBJECT TERMS I 15. NUMBER OF PAGES
Weather display, Traffic display, Integrated display . 16. PRICE CODE
OFREPOAT
Prescnbed by ANSI Std 2-39-18 298-102