Recognition of the Mtb-infected Cell: What IGRAS Have Allowed Us To Understand About TB David...
39
Recognition of the Mtb-infected Cell: What IGRAS Have Allowed Us To Understand About TB David Lewinsohn, MD, PhD Pulmonary & Critical Care Medicine Portland VA Medical Center Oregon Health & Sciences University The Royal Society SATELLITE MEETING ON Human evolution – plagues, pathogens and selection
-
Upload
brooklyn-donovan -
Category
Documents
-
view
213 -
download
0
Transcript of Recognition of the Mtb-infected Cell: What IGRAS Have Allowed Us To Understand About TB David...

Recognition of the Mtb-infected Cell:
What IGRAS Have Allowed Us To Understand About TB
David Lewinsohn, MD, PhDPulmonary & Critical Care Medicine
Portland VA Medical CenterOregon Health & Sciences University
The Royal Society
SATELLITE MEETING ONHuman evolution – plagues,
pathogens and selection


TB Diagnostics: Opportunities for Impact
• TB Disease– Case Finding
• Improved detection of bacterial products– LED / NAAT / Urine Dipstick / Novel Plasma or Urine Markers
• Rapid identification of drug resistance– Line Probe / Cepheid
• Improved understanding of immune markers of antigenic load• Identification of markers of active infection
– Treatment• Tools to identify those at risk for treatment failure
• “Latent” TB Infection– Identify those at risk for progression
• Improved understanding of bacterial persistence• Improved understanding of immune markers of antigenic load

Abu-Raddad L J et al. PNAS 2009;106:13980-13985
©2009 by National Academy of Sciences
Incidence Mortality

The Testing Strategy Should be Matched to Benefit
TST ≥ 10 mm
TST ≥ 15 mm
TST ≥ 5 mm

The TST Immune Phenotype
Rieder, Epidemiologic Basis of TB Control, IUTLD (1999) Risk highest shortly after infection
Late disease might reflect re-exposures
TST poor at identifying those at risk
Acute TB Infection
Persistent TB Infection

Outcome of contact evaluations
ARPES, 2001; S+
Reichler, 1996; all
Marks, 1998; S+ close
Contacts
Evaluated 55-81% of contacts complete TST
LTBI dx’d 22-36% found newly infected
Start TLTBI 63-74% begin treatment
Complete Rx 51-62% finish treatment
Outcome ~17-37% of target population actually complete TLTBI
Courtesy Andy Vernon, CDC

Lesson 1: David vs Goliath
TST– Associated with
Exposure to Mtb– Conversion
associated with risk of disease
– Treatment of benefit

IGRAs
Peter Andersen, SSI
Winner 2011 Novo Nordisk Prize
Steve Reed, IDRI
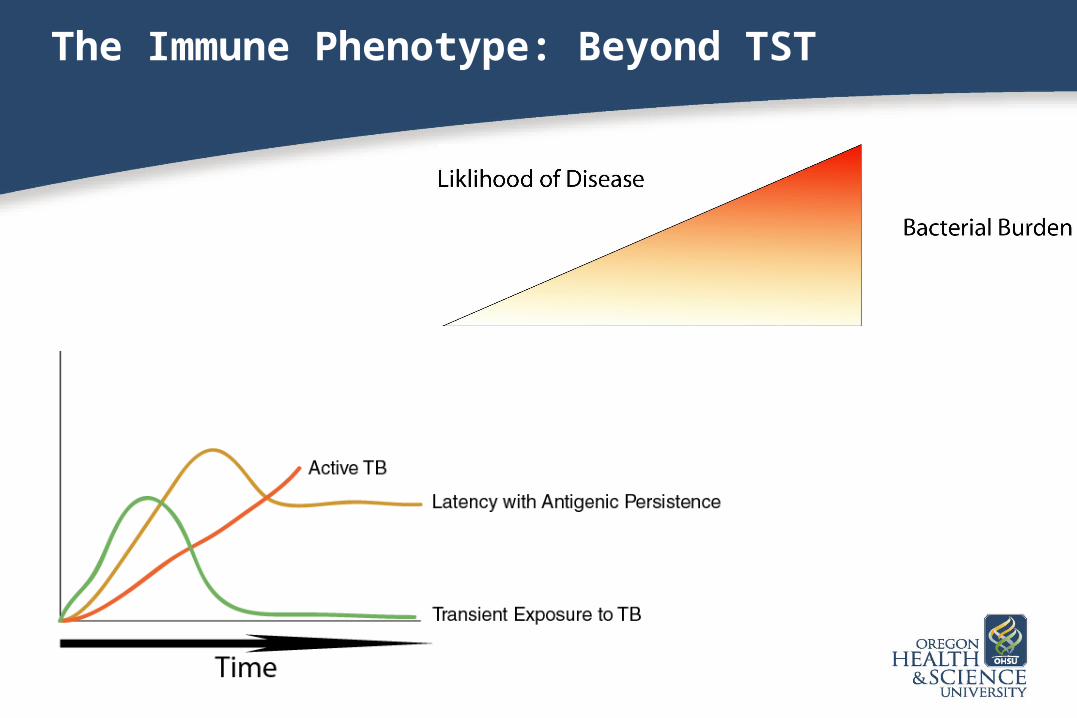
The Immune Phenotype: Beyond TST

Lesson 1: We Can do At Least as Well as the TST
“Professional” Antigen Presenting
Cell
CD4Lymphocyte
Protein
Peptide12-18 AA
CD4
TCR Class IIMHC
IFN-TNF
ESAT-6CFP-10
Quantiferon IFN-γ ELISACD4
T-SPOT IFN-γ ELISPOTCD4 / CD8

IGRAs and The Diagnosis of LTBI
• Test Accuracy– What is the Sensitivity of the test with regard to TB?– What is the Specificity in those unlikely to have been exposed?– What is the Likelihood of infection in those being tested?
• Association with Conditions Linked to Treatment Success– Is the test associated with exposure to Mtb?– Is the test associated with progression to TB?
• Are there other risks / benefits that might affect the decision as to which test to use?– Test logistics– Client and provider perceptions– Cost
• Is treatment based on the test associated with improved outcomes?– More accurate identification of those at risk?– Do more patients accept or complete treatment based on the test results?

Test Accuracy
– Sensitivity Active TB* • QFT-IT 84% (81,86)• TSPOT 93% (90,95)• TST 77% (71,82)
– Association with Exposure• Both QFT and TSPOT are more closely associated with
exposure than TST.
* Courtesy Madhu Pai, High prevalence countries

Test Accuracy
– Specificity*• QFT-IT 99% (98,100)• TSPOT 85-98%• TST
– BCG 49% (46,73)– No BCG 97% (95,99)
* Courtesy Madhu Pai, High prevalence countries

Progression to TB
– Diel R et al. Predictive value of a whole blood IFN-gamma assay for the development of active tuberculosis disease after recent infection with Mycobacterium tuberculosis. Am J Respir Crit Care Med. 2008.
• 601 household contacts• 40.4% (243/601) TST +• 11% (66/601( (11%) QFT+• Six contacts progressed to TB disease within the 2-year follow-up. • All were QFT positive and had declined preventive treatment, equating to a progression rate of 14.6% (6/41) among
those who were QFT positive.
– Kik et al. Predictive value for progression to tuberculosis by IGRA and TST in immigrant contacts. Eur Respir J. 2009 .
• 339 TST+ household contacts (5mm); prophylaxis not given• 9/288=3.1% (95% CI; 1.3-5.0) for TST ≥10• 5/178=2.8% (95% CI; 1.0-4.6) for QFTGIT (54% QFT+; 5/8 cases detected)• 6/181=3.3% (95% CI; 1.3-5.3) for T-SPOT.TB (63% TSPOT +; 6/8 cases detected)• Review of TB case reporting did not find cases in those who were TST-

High Risk Populations
• Heterogeneous Population• Very Limited Data in High Income Settings• TSPOT May be Less Affected by Low CD4 Counts• Immunosupression is Associated with Impaired Test Performance for Cellular Assays
• Sensitivity Active TB in HIV*– QFT-IT / TSPOT 84% (65,100)– TST 43% (25,85)
* Courtesy John Metcalfe• Association with Progression to TB
– Aichelburg et al., Clin Infect Dis. 2009 Apr 1;48(7):954-62.– 830 HIV+ subjects– 44 QFT+– 8 found to have TB at time of testing– 7QFT+– 1 QFT –– 3/37 QFT+ developed TB during follow up

Low Risk Populations
– Not candidates for Rx– Specificity of IGRAs may be superior to TST,
particularly in those with a history of BCG vaccination.
Khoury et al., JOEM, 2011

Lesson 2: There is nothing Latent about LTBI
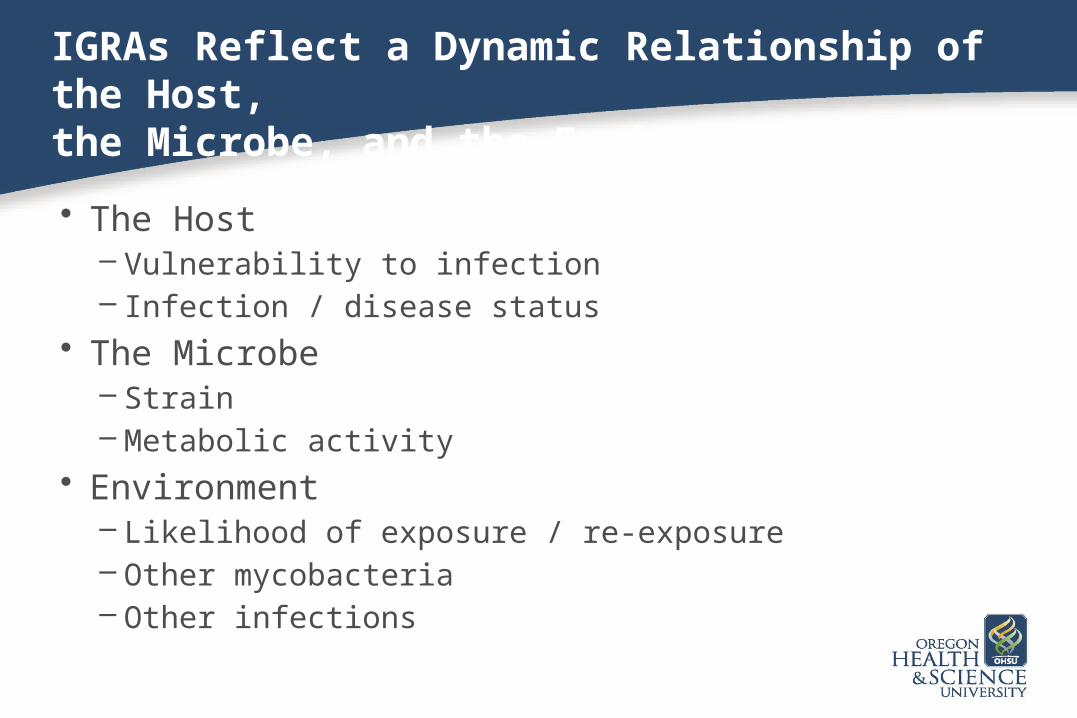
IGRAs Reflect a Dynamic Relationship of the Host,
the Microbe, and the Environment
• The Host– Vulnerability to infection– Infection / disease status
• The Microbe– Strain– Metabolic activity
• Environment– Likelihood of exposure / re-exposure– Other mycobacteria– Other infections
TST Variability
• Menzies, AJRCCM 1999– 6mm represents 2SD in repeated TST
measurements– TST reversions
• Following INH therapy among those recently exposed on a submarine
– Houk et al., 1968. Arch. Environ. Health 16:46–50
• Estimated 8% in exposed children• Estimated 8% annually in older adults

Do IGRAs Reflect Bacterial Burden?
• Metcalfe et al., AJRCCM 2009– 660 TB suspects in San Francisco– Increased IFN-γ associated with increased likelihood of TB
Kobashi et al., Lung 2010
Hinks et al., Infection and Immunity2009

Are IGRAs a Reflection of the Environment and/or Host?
Detjen et al., Clinical Vaccine Immunology2009
Ringshausen et al,Clinical and Vaccine Immunology2011

Transient Exposure?
• Friedman et al., Infect Control Hosp Epidemiol 2006– 45 % HCW previously positive by TST were negative on
repeat testing– Best correlation with persistent TST positivity
• Foreign birth• BCG• TST > 15mm
– Best correlation with TST reversion• Working in study clinic

Transient Exposure?
Ewer al al., Am J Respir Crit Care Med Vol 174. pp 831–839, 2006

Transient Exposure
• Natural exposure of guinea pigs to MDR/XDR– 75% of the 362 exposed guinea pigs had positive skin test
reactions [6 mm].– 12% had histopathologic evidence of active disease.– Reversions (6mm change) in skin test reactivity were seen in
22% of animals, exclusively among those with reactions of 6-13 mm.
– 2of 86 guinea pigs with reversion had histological evidence of disease vs 47% (31/66) of guinea pigs with large, non-reverting reactions.
– Immunosuppression had no effect

Can IGRAs Discern Recent from Remote Exposures?
• Millington et al., JID 2010– 27 subjects with self-
healed, untreated TB– >50 years– 17 + Ex-vivo ELISPOT (16
IFN-γ )– 6/10 + long term assay
• Recent vs Remote– Hinks et al., I&I 2009– Kik et al., IJTLD 2009
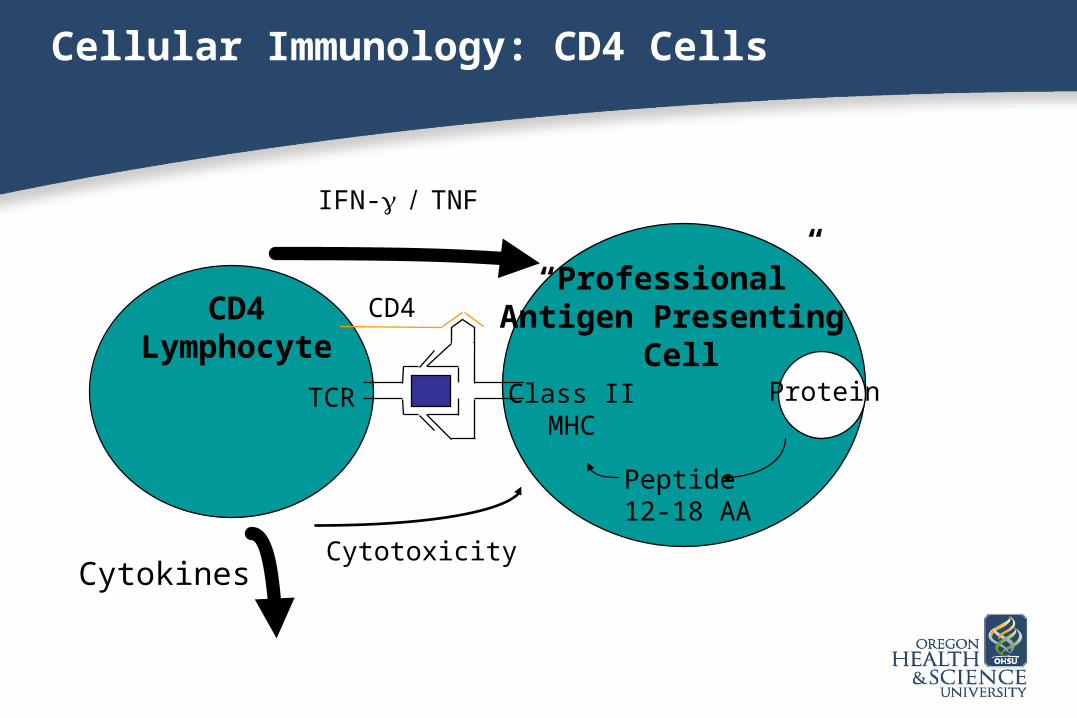
Cellular Immunology: CD4 Cells
“Professional” Antigen Presenting
Cell
CD4Lymphocyte
Protein
Peptide12-18 AA
CD4
TCR Class IIMHC
IFN-TNF
CytotoxicityCytokines
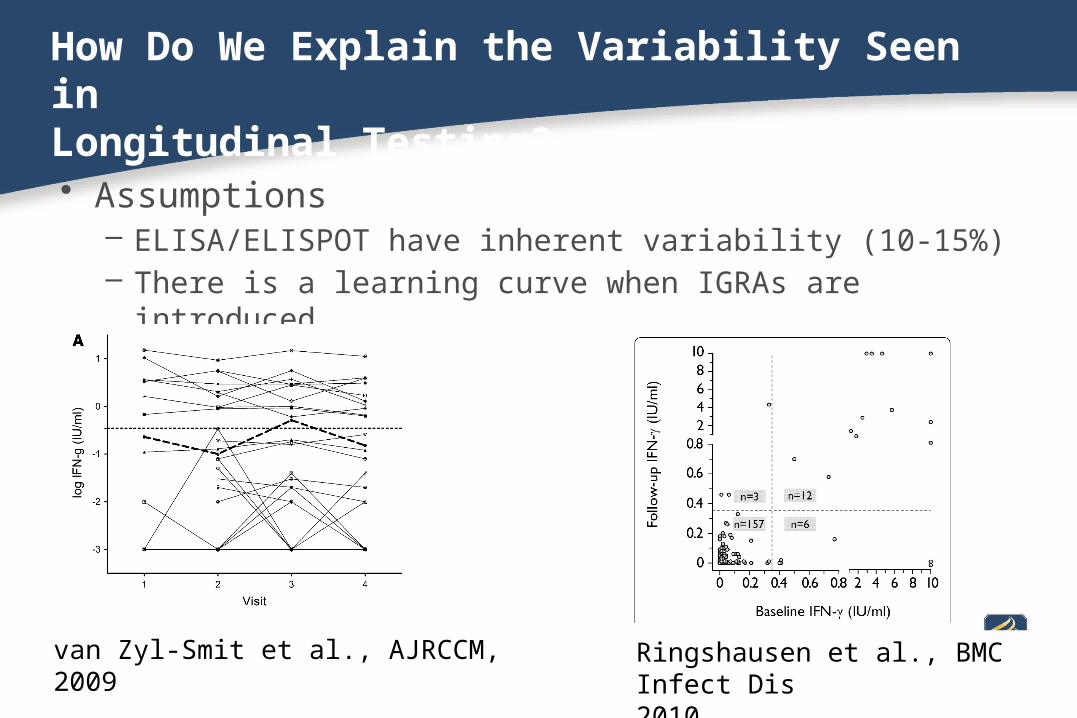
How Do We Explain the Variability Seen in Longitudinal Testing?
• Assumptions– ELISA/ELISPOT have inherent variability (10-15%)– There is a learning curve when IGRAs are introduced
van Zyl-Smit et al., AJRCCM, 2009 Ringshausen et al., BMC Infect Dis2010

Lesson 3: We Need Better Surrogates of Bacterial Burden


Novel T Cell Phenotypes
Adapted from Seder et al., Nat Rev Immunol, 2008


The Host: Sampling the Intracellular Environment
All CellsCD8
Lymphocyte
Peptide9-11AA
CD8
TCR
Class IMHC
IFN-TNF
CytotoxicityCytokines
CytoplasmicProtein
2m

ESAT-6 / CFP-10 Responses During TB Treatment
CD4 Response CD8 Response

BMI Has a Profound Effect on the CD4 Response
CD4 Response CD8 Response
BMI ≤ 17 BMI > 17 BMI ≤ 17 BMI > 17
* p = 0.02
Conclusions
• IGRAs perform at least as well as TST in those who might benefit from therapy.
• Quantitatively, IGRAs likely a reflection of persistent and variable Mtb-antigen.
• Improved surrogates of bacterial / disease burden are likely needed.

Acknowledgements• Portland VA Medical Center
Melanie Harriff Ervina WinataLynne Swarbrick Sue Smyk-PearsonMarielle Gold Joel Weekley
• OHSU Liz CanfieldDeborah Lewinsohn Melissa NyendakMegan Null Katelynne Garner-TorenAmanda Duncan Meghan CanslerVeena Rajaraman Shannon McWeeneyTomi Mori Byung ParkTodd Vogt Guanming Wu
• CollaboratorsHenry Boom CWRUDenise Johnson CWRUKeith Chervenak CWRUDave Sherman University of WashingtonKaren Dobos Colorado State UniversityJohn Belisle Colorado State UniversityLisa Wolf Colorado State UniversityHenry Boom Case Western Reserve UniversityRoy Mugerwa Makerere UniversityHarriett Myanja Makerere UniversitySarah Kiguli Makerere UniversityDennis Dobbs TBRUSarah Zalwango Makerere UniversityMary Nsereko TBRUPayam Nahid UCSFAlesandro Sette The La Jolla Institute for Allergy and ImmunologyJohn Altman Emory University
Special thanks to:Aeras
Sean BennettBruce McClainJerry SadoffDonata SizemoreJohn FulkersonDavid HokeyTom Evans
NIHChristine SizemoreAlison DeckhutTimothy Gondre-Lewis
OHSULynne SwarbrickAmanda DuncanMelissa NyendakMelissa KumagiPhyllis CarelloLynne SwarbrickErvina Winata