Reclamation of Phosphatic Clay Waste Ponds by...
193
Publication No. 02-030-056 RECLAMATION OF PHOSPHATICCLAY WASTE PONDS BY CAPPING Volume 1: Centrifugal Model Evaluation of Reclamation Schemes for Phosphatic Waste Clay Ponds Prepared by University of Florida, Department of Civil Engineering, under a grant sponsored by the Florida Institute of Phosphate Research Bartow, Florida April 1988 FLORIDA INSTITUTE OF PHOSPHATE RESEARCH
-
Upload
hoangtuyen -
Category
Documents
-
view
216 -
download
0
Transcript of Reclamation of Phosphatic Clay Waste Ponds by...

Publication No. 02-030-056
RECLAMATION OF PHOSPHATIC CLAY WASTE PONDS BY CAPPING Volume 1: Centrifugal Model Evaluation of Reclamation Schemes
for Phosphatic Waste Clay Ponds
Prepared by University of Florida, Department of Civil Engineering,
under a grant sponsored by the
Florida Institute of Phosphate Research
Bartow, Florida
April 1988
FLORIDA INSTITUTE OF PHOSPHATE RESEARCH

The Florida lnstitute of Phosphate Research was created in 1978 by the Florida Legislature(Chapter 378.101, Florida Statutes) and empowered to conduct research supportive to theresponsible development of the state’s phosphate resources. The lnstitute has targeted areasof research responsibility. These are: reclamation alternatives in mining and processing,including wetlands reclamation, phosphogypsum storage areas and phosphatic clay contain-ment areas; methods for more efficient, economical and environmentally balanced phosphaterecovery and processing; disposal and utilization of phosphatic clay; and environmentaleffects involving the health and welfare of the people, including those effects related to radia-tion and water consumption.
FIPR is located in Polk County, in the heart of the central Florida phosphate district. Thelnstitute seeks to serve as an information center on phosphate-related topics and welcomesinformation requests made in person, by mail, or by telephone.
Research Staff
Executive DirectorRichard F. McFarlin
Research Directors
G. Michael Lloyd Jr. -Chemical ProcessingGordon D. Nifong -Environmental ServicesDavid J. Robertson -ReclamationHassan El-Shall -BeneficiationRobert S. Akins -Mining
Florida lnstitute of Phosphate Research1855 West Main StreetBartow, Florida 33830(863) 534-7160
Reclamation of Phosphatic Clay Waste Ponds by 'Capping'
Volume 1: Centrifugal Model Evaluation of Reclamation Schemes for PhosphaticWaste Clay Ponds
Research Project: FIPR 82-02-030
Prepared by
Department of Civil Engineering IMC Bartow, FloridaUniversity of FloridaGainesville, Florida 32611
AGRICO, Mulberry, FloridaMOBIL, Nichols, Florida
Principal Investigators
F. C. TownsendD. G. BloomquistS. A. McClimansM. C. McVay
Prepared For
Florida Institute of Phosphate Research1855 West Main StreetBartow, Florida 33830
FIPR Project Manager: Dr. Henry L. Barwood
September 1986

DISCLAIMER
The contents of this report are reproduced herein as receivedfrom the contractor.
The opinions, findings and conclusions expressed herein are notnecessarily those of the Florida Institute of Phosphate Research,nor does mention of company names or products constitute endorse-ment by the Florida Institute of Phosphate Research.
ii

PERSPECTIVE
Henry L. Barwood, Ph.D.Hassan E. El-Shall, Dr.Eng.Sc.
Project Managers
Florida Institute of Phosphate Research
During the phosphate beneficiation process, substantialquantities of water clays are produced which are typically disposed inlarge impoundment areas. Due to the low permeability and self-weightof these clays, years are required prior to reclamation. There is anincreasing concern, both from the phosphate industry and the public ingeneral, to reduce the quantity of phosphatic clays that are storedabove ground and to reduce the turnaround time between mining andreclamation. Florida Institute of Phosphate Research shares in thisconcern. Therefore, FIPR has mobilized great research efforts to findsolutions to this problem.
Fundamental to the design of any reclamation scheme for theseareas, be it for industrial, agriculture, or grazing purposes, is therealization that the waste clays must be covered or capped to providea stable foundation. Furthermore, the application of a 6-10 ft. capappeared to be (at the time of inception of this project) the onlypractical method to enhance consolidation rates and increase the finalsolids content to provide below ground storage. Hence, this researchwas dedicated to determining feasible methods for capping these wasteclay ponds.
The research efforts included extensive laboratory investigationsand a full-scale field test. Specifically, three capping schemes wereevaluated (a) use of geotextiles, (b) vegetative crust for tensilereinforcement, and (c) capping without reinforcement directly on thesurface crust. Laboratory evaluation consisted of centrifugal modeltests of capped waste clays, permeameter tests on geotextiles andviscosity tests to measure shear strength versus solids content.Obtained data were used to verify and improve existing large strainconsolidation predictive models. Results of this investigation arepublished in six volumes. In addition, two volumes containingdetailed data and field test results are placed in an open file atFIPR's library as a reference material for interested parties.Discussion of the subject matter of these volumes is presented below:
Volume I "Centrifugal Model Evaluation of Reclamation Schemes forPhosphatic Waste Clay Ponds"
The objective of this part of research was to evaluatereclamation schemes for minimizing the turnaround time between miningand reclamation by enhancing consolidation of these waste clays.Specifically, the schemes evaluated were: (a) no treatment, (b) s/cmix, (c) sand caps over clay, (d) s/c mix caps over clay, and (e) useof flocculating agents coupled with s/c mixes or sand caps.

Traditionally, 1-g bench tests using. graduated cylinders havebeen used to evaluate clay settling rates and consolidation.Unfortunately, this method is unsatisfactory as (a) the stresslevels are lower than field conditions, and (b) excessive testingtimes are required. Offsetting these limitations is the use ofcentrifugal modelling techniques by which prototype stress levelsare applied and testing times reduced due to shortened drainagepaths. Thus, this research involved centrifugal models 8 to 12cm high accelerated to 60 to 80 g's, thereby replicating wasteponds 4.8 m to 9.6 m deep. A closed form solution was alsodeveloped to estimate consolidation magnitudes for clay, s/cmixes, and capped (sand or s/c mix) ponds,
The results of these centrifugal model tests demonstrated thatcentrifugation is a viable method for examining prototype waste claydisposal schemes, provided modelling of models is used for determiningthe time scaling exponent, and sand segregation potential in s/c mixesis considered. It was found that the time scaling exponent was afunction of the solids content and increased from 1.6 to 2.0 as thesolids contents increased from 14 to 20%. Sand segregation was not aproblem at 60 g's for solids contents 16%.
The descending order of disposal technique effectiveness inachieving the highest final solids content is: (a) sand capping(staged), (b) s/c mix capping, (c) s/c mix 1:1 to 2:1, (d)flocculants or untreated clay. The time required, however, is inproportion to the solids content; e.g., higher solids contentrequire longer times.
For s/c mixes, the greatest reduction in interface height occursfor a SCR of approximately 1:1. For s/c mixes exceeding 3:1, thefinal interface height is above that for untreated clays. The grainsize of the sand used has little effect on interface height for low(1:1) s/c mixes.
For capped ponds, a threshold solids content exists, below whichthe clay is incapable of supporting a cap.
Flocculants have a primary benefit of increasing setting ratesand can be used to achieve rapidly clay solids contents capable ofsupporting sand caps. However, flocculated clays and flocculatedclay/sand mixes provided final solids contents comparable to untreatedclays (but at shorter times).
Volume II "Centrifugal Modeling of the Consolidation Behavior ofPhosphatic Clay Mixed with Lime or Gypsum"
This second part of the research investigates the use of lime andgypsum as additives which might enhance the consolidation of the wasteclays. The research was divided into two stages. In the first stage,experimental techniques were used to determine the appropriatequantities of lime and gypsum to be added to the waste clays andassess the strength gains due to these additives. The second stageinvolved centrifuge modeling of the consolidation of the waste clayswith the determined quantities of lime and gypsum added.

The results of this investigation reveal that the pH testprovides a rapid method for determining the minimum lime contentrequired for strength producing clay-lime reactions. Lime percentagesof approximately 12% were required to achieve the pH level for theclays tested.of 3 to 5 times
Miniature vane shear tests showed 28-day strength gainsthat of untreated clay when 12% lime was added while
relatively small strength increases occurred for lower lime contents.Unfortunately, the high concentrations of lime required, and therelatively low 28-day strengths (14 to 25 psf) question thefeasibility of lime treatment from the standpoints of economics orsurface strength to support equipment. However, sufficient strengthto support a sand cap might be feasible, but caution is advised. Inthe case of gypsum, the pH test was unsuitable for determining thetarget gypsum content. Gypsum/clay ratios as high as 12:1 producedpractically no strength improvement.
Centrifugal model tests revealed that addition of lime hinderedthe consolidation magnitude of the clays. Apparently, the limestrengthens the soil skeleton sufficiently that little self-weightconsolidation occurs. Instead, the consolidation behavior of limetreated clay is akin to that of sand. In the case of gypsum addition,the consolidation magnitude was enhanced. Consolidation occurred morequickly, and final effective clay solids contents approached those ofuntreated clay. The behavior of clay/gypsum mixtures is similar tothat for sand/clay mixes.
Volume III "Evaluation of the Use of Geotextiles for CappingPhosphatic Waste Clays"
The basic objective of this research was to evaluate the use ofgeotextiles for capping phosphatic clay waste clay ponds and, thus, toenhance the consolidation process of these materials.
A system was designed and constructed for performing thepermeability tests such that four geotextiles could be testedsimultaneously. Waste clays at initial solids contents rangingfrom 17 to 19% were placed in the system and allowed to consolidateagainst the bottom of the geotextiles under the application of anapproximate 21 inch water head difference and air pressureranging from 3 to 4 psi, resulting in total head differencesranging from 8.6 to 10.9 feet of water. Flow rates versus timewere determined for each of the geotextiles that were tested.Total heads were measured adjacent to and 1 inch below the bottomof the geotextiles for the final two test groups. The flow rateand clogging indicator (to be defined later) versus time resultswere plotted to provide an indication of the long-term behaviorof each geotextile. Additionally, the thickness and equivalentopening size of the, geotextiles were analyzed to determine theeffects on geotextile performance.
At the conclusion of each group of tests, samples of the wasteclays were obtained adjacent to each geotextile to determine the finalsolids content. Additionally, scanning electron microphotographs(SEM'S) were obtained of several of the geotextiles before and aftertesting in order to examine clogging within the geotextiles.
Gary Albarelli

All of the above results were then utilized to compare thelong term filtration/permeability characteristics for the testedgeotextiles in order to develop a recommendation for selecting ageotextile for use in field testing applications. This, in turn,may lead to large-scale field use for capping phosphatic wasteclay ponds.
The following concresults:
lusions were developed based on the laboratory
1.
2.
3.
4.
5.
6.
7.
8.
Nonwoven polypropylene geotextiles with a thickness in therange of 70 to 110 mils exhibited the best long-termpermeability/filtration characteristics and should beselected for field testing.
Geotextiles manufactured of polypropylene yarns andfilaments exhibited better long term flow rate/filtrationcharacteristics than geotextiles manufactured of polyesteryarns and filaments.
No correlations existed between geotextile EOS andstabilized flow rate or long term filtration performanceunder the applied laboratory conditions.
Some piping of clay particles across the geotextiles occurswith the slurry at an initial solids content of 17-19% untilthe slurry attains a solids content such that the solidparticles will "bridge" the geotextile. However, thispiping does not adversely affect the long term performancecharacteristics for the desired applications.
The geotextiles generally prevent significant piping ofsolid clay particles with the slurry at an initial solidscontent of 17-19%.
With the exception of some thin nonwoven geotextiles, allgeotextiles undergo partial clogging/plugging from solidclay particles under the application of approximately 8.7feet of water head.
Economics, construction procedures, and exposure to fieldconditions should be taken into consideration before ageotextile is utilized in the field to enhance theconsolidation of phosphatic waste clay slurries.
It appears that the use of geotextiles for capping phosphatewaste clay ponds will cause the development of a solidscontent profile within the clays that will be greatestadjacent to the geotextile and will decrease with depth,which may, after a period of time, prevent water fromescaping and, thus, prevent the clays from consolidatingfurther.
Volume IV "Piecewise Linear Computer Modeling of Large StrainConsolidation"
The major objectives of this study were as follows:
A. To modify an existing piecewise linear computer program.
B. To compare spatial vs. reduced representation finite strainnon-linear consolidation theory,
C. To predict a series of model ponds to be discussed at the"Symposium on Consolidation and Disposal of Phosphatic andOther Waste Clays," Lakeland, Florida (1987).
D. To develop a multiple layer piecewise linear large strainconsolidation model.
Several consolidation computer programs based on the Gibson,England, and Hussey (GEH) theory (1969), and a piecewise linearprogram based on a spatial representation of finite strain, havebeen developed. However, GEH programs cannot model non-homogeneousprofiles and the piecewise linear program has difficulty modellinginitial filling conditions. Furthermore, no multiple layer largestrain consolidation model, either finite strain or piecewiselinear, has been developed. These drawbacks limit the applicabilityof computer modelling. Since piecewise linear theory is simplerthan GEH theory, and allows for non-homogeneous profiles, a largestrain piecewise linear program was developed which allows forany filling scheme in single layer consolidation (UF-McGS) and amethod of solution for piecewise linear multiple layerconsolidation model is outlined.
Results indicate that the UF-McGS model has excellent agreementwith GEH theory for quiescent consolidation, quiescent consolidationwith surcharge, and continuous fill. Also, the UF-McGS model agreedwith a closed form solution developed for homogeneous quiescent clays.
Volume V "Centrifugal Model Evaluation of the Consolidation Behaviorof Phosphatic Clays and Sand/Clay Mixes"
This part of study investigates the consolidation behavior ofphosphatic clays taken from 19 sites located in central and northernFlorida. Three types of centrifuge tests were run on each waste clay-- uncapped tests, capped tests, and sand/clay mix tests. Atterberglimits and x-ray diffraction tests were also conducted on the clays.The research had two main objectives. The first objective was todetermine if the Atterberg limits or the mineralogy of the waste clayscould be related to their settling behavior in the uncapped tests.The second objective was to examine the effects of sand caps andsand/clay mixes on the settlement characteristics of the clays.
It was found that Atterberg limits predicted the consolidationbehavior of the clay fairly well. A relationship was observed betweenliquidity index and effective stress for the uncapped clays, while nodefinite trends were observed between clay mineralogy and consolidation

behavior. Both sand/clay mixes and sand caps improved the settlementcharacteristics of the clays. Sand/clay mixes enhanced the time rateof consolidation more than the sand caps, while the sand caps generateda higher final clay solids content than the sand/clay mixes.
The final published volume (Volume VI) "Consolidation Properties ofPhosphatic Clays from Automated Slurry Consolidometer and CentrifugalModel Tests"
An automated slurry consolidometer, which is fully controlled bya computer-data acquisition system that monitors load, pore pressure,total stress, and deformation, was developed. The load is applied bya stepping motor. Results from the tests conducted show the effec-tiveness of the apparatus. The Constant Rate of Deformation test wasfound to have several advantages over the Controlled Hydraulic Gradienttest and is recommended for future applications; the results from bothtests were consistent. A "pseudo-preconsolidation" effect, attributedto the initial remolded condition of the specimen, was observed inboth constitutive relationships. Thus, the curves are not unique butdepend upon the initial solids content. However, different curvesapproach what seems to be a "virgin zone." The compressibilityrelationship also was found to be dependent upon the rate ofdeformation.
The technique using centrifugal modelling is based on themeasurement of pore pressure and void ration profiles with time, andthe use of a material representation of the specimen. Thecompressibility relationship obtained was in good agreement withthe results of CRD tests performed at a slow rate of deformation.The permeability relationship plotted parallel to the CRD curves,however, permeability values were approximately a half order ofmagnitude higher. Further research is required to explain thisdifference.
The constitutive relationships obtained in the study were used topredict the behavior of hypothetical ponds modelled in the centrifuge.A good agreement between centrifugal and numerical models was found.
Data obtained in the field are tabulated in Volume 7 which willbe placed in an open file at FIPR's library. However, it should be-mentioned that these tests were not conclusive due to severaltechnical and practical problems encountered during such tests.
At the end of each volume, the authors have listed severalrecommendations for further research. Most of these recommendations,however, are related to further modifications in test procedures orequipment to obtain more accurate date. Nothing is recommendedregarding future and practical aspects of capping techniques ofphosphatic clays. Nevertheless, the results of this research areinformative regarding the use of centrifugal and computer modeling ofthe consolidation behavior of phosphatic clays.
ACKNOWLEDGEMENTS
The support and sponsorship provided by the Florida Institute of
Phosphate Research for this investigation is acknowledged. The support
of IMC, Bartow, and Dr. J. E. Lawver for the preliminary sand capping
models is greatly appreciated. The co-operation and assistance for the
project is acknowledged for:
Dr. J. E. Lawver, IMC
Mr. Steve I. Olson, Agrico
Mr. H. H. Miller, Agrico
Mr. A. J. Propp, Mobil
Portions of this report reflect the Ph.D dissertation of Dr. David
Bloomquist and M.S. report of Mr. Stuart A. McClimans; Department of
Civil Engineering, University of Florida, Gainesville, Florida 32611.
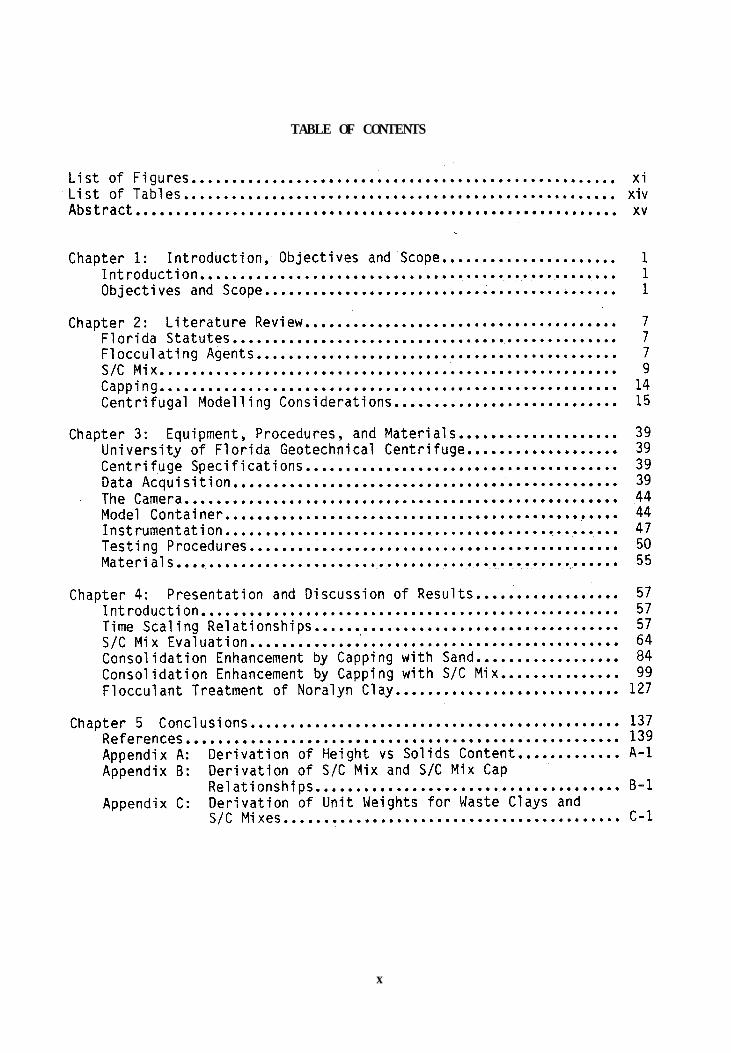
TABLE OF CONTENTS
x


Reclamation of Phosphatic Clay Waste Ponds by 'Capping'
Volume 1: Centrifugal Model Evaluation of Reclamation Schemes for
Phosphatic Waste Clay Ponds
Research Project FIPR 82-02-030
Abstract
During the phosphate beneficiation process, substantial quantities
of waste clays are produced which are typically disposed in large
impoundment areas. Due to the low permeability and self-weight of these
clays, years are required prior to reclamation. Accordingly, the
objective of this research was to evaluate reclamation schemes for
minimizing the turnaround time between mining and reclamation by
enhancing consolidation of these waste clays. Specifically, the schemes
evaluated were: (a) no treatment, (b) sand/clay mix (s/c) (c) sand
caps over clay, (d) sand/clay mix (s/c) caps over clay, and (e) use of
flocculating agents coupled with s/c mixes or sand caps.
Traditionally, bench tests using graduated cylinders have been used
to evaluate clay settling rates and final solids contents. Unfortu-
nately, this method is unsatisfactory as (a) the stress levels are
lower than field conditions, and (b) excessive testing times are
required. Consolidation testing has been used to obtain input para-
meters for calculating settlement rates and magnitudes, but this also
suffers from lengthy test times and theory limitations. Offsetting
these limitations is the use of centrifugal modelling techniques by
which prototype stress levels are applied and testing times reduced due
to shortened drainage paths. Thus this research involved centrifugal
xv

models 8 to 12 cm high accelerated to 60 to 80 g's, thereby replicating
waste ponds 4.8 m to 9.6 m deep. A closed form solution was also
developed to estimate consolidation magnitudes for clay, s/c mixes, and
capped (sand or s/c mix) ponds.
The results of these centrifugal model tests demonstrated that
centrifugation is a viable method for examining prototype waste clay
disposal schemes, provided modelling of models is used for determining
the time scaling exponent, and sand segregation potential in s/c mixes
is considered. It was found that the time scaling exponent was a
function of the solids content and increased from 1.6 to 2.0 as the
solids contents increased from 14 to 20%. Sand segregation was not a
problem at 60 g's for solids contents > 16%.
The descending order of disposal technique effectiveness in
achieving the highest final solids content is: (a) sand capping
(staged), (b) s/c mix capping, (c) s/c mix 1:1 to 2:1, (d)
flocculants or untreated clay. The time required, however, is in
proportion to the solids content; e.g., higher solids contents require
longer times.
For s/c mixes, the greatest reduction in interface height occurs
for a Sand:Clay Ratio (SCR) of approximately 1:1. For s/c mixes
exceeding 3:1, the final interface height is above that for untreated
clays. The grain size of the sand used has little effect on interface
height for low (1:1) s/c mixes.
For capped ponds, a threshold solids content exists, below which
the clay is incapable of supporting a cap.
xvi

Flocculants have a primary benefit of increasing setting rates and
can be used to achieve rapidly clay solids contents capable of
supporting sand caps. However, flocculated clays and flocculated
clay/sand mixes provided final solids contents comparable to untreated
clays (but at shorter times).
xvii

CHAPTER I: INTRODUCTION, OBJECTIVES AND SCOPE
INTRODUCTION
Phosphate has neither substitute nor replacement and hence, is used
extensively by the fertilizer industry. Unfortunately, during the
phosphate beneficiation process, several types of waste material are
produced, specifically waste clays and sand tailings. It is the
adequate disposal of these waste clays, that are one of the industry's
most pressing problems.
Waste Clay Disposal
At present, the only economically feasible method of disposal has
been the retention of the waste clays in large impoundment areas
surrounded by earthen dikes. When introduced into these impoundment
areas, the waste clays are in a form of slurry with a solids content of
only three to six percent by weight. Due to the very low permeability
and self-weight of this material, it may take tens of years to reach a
solids content of 20-25 percent. Because of this low solids content,
the volume of the slurried waste clay far exceeds the volume of
phosphate, sand, and clay originally removed from the mined area. As a
result, large above-ground impoundment areas are required.
When considering the waste clay disposal problem, a handful of
relevant facts should be kept in mind. These include:
· 40 million tons (dry weight) of clay are produced per year in
Florida
· For each ton of clay solid produced, four to five tons of
interstitial water remains permanently entrapped
1
Gary Albarelli

· More than 50,000 acres of settling areas are now in existence
with 4,000 acres added every year
· More than 300 miles of earth dams with heights up to 40 feet are
surrounding the settling areas
· 12-15 percent of the available phosphate remains in the waste
slurry
· All mined lands must now be reclaimed according to Florida
Statutes Chapter 16 and DNR Regulations
Considerable research has been directed toward minimizing the
above-ground storage areas. Generally speaking, if the average clay
solids content could be increased to approximately 30 percent then the
waste clay would occupy a volume equal to the ore mined. Mined areas
could then be fully reclaimed and above-ground storage could be
minimized.
A wide variety of dewatering methods have been proposed since the
mid-1970's (see Table 1). Preliminary investigations of these methods
indicate several economically viable methods for increasing the solids
content of waste clays. These are:
(1) chemical flocculation of clay slimes
(2 ) desiccated surface crusts
(3) addition of sand tailings (through either sand caps,
sand/clay caps, or sand/clay mixes)
While chemical flocculation can be studied in the laboratory using
graduated cylinders, no laboratory method exists for evaluating
desiccated crusts or addition of sand tailing to clays.
2

Table 1:
Potential Dewatering Methods (Bromwell et.al., 1977)
ADMIXING WITH COARSE MATERIAL EVAPO-TRANSPIRATION
ADSORPTION FILTRATION
BIOLOGICAL AGGREGATION FLOCCULATION
CENTRIFUGATION FREEZE-THAW
CHEMICAL COAGULATION HEAT
CHEMICAL SOLIDIFICATION MAGNETIC SEPARATION
DEEP-WELL INJECTION MECHANICAL THICKENERS
DRAINAGE SYSTEMS RADIOACTIVE IRRADIATION
DYNAMIC VIBRATION REVERSE OSMOSIS
ELECTRIC FIELD SPHERICAL AGGLOMERATION
ELECTOOSMOSIS
3
Stress Levels
Consolidation is defined as the time dependent settlement of a soil
mass due to the squeezing out of water under an excess pore water
pressure gradient. In most cases, the driving force causing
consolidation is a surcharge applied to the soil e.g., a structure
foundation. In the phosphatic clay retention pond, since a surcharge is
not normally applied, it is the self-weight body forces of the clay
particles which generate the excess pore pressures. With a 50 foot high
dam, even though the solids concentration is low, there is sufficient
material to induce appreciable self-weight consolidation.
In a typical laboratory bench test, however, this is not the
case. For example, a 1,500 ml container filled with a 4% solids content
slurry contains approximately 60 grams of clay. After some time the
solids content will approach 15%. This translates into an effective
stress of 12 psf at the bottom of the container. Clearly, this does not
approach the magnitude of stress levels encountered in a field environ-
ment, and is not sufficient to induce any significant consolidation.
Time
The second factor involves the substantial time required to
complete primary consolidation. Several researchers have used large
pipe columns to simulate field stress (e.g., Martin et. al., 1977)
While the boundary conditions approach those of actual slime ponds, in
some cases, the maximum duration of the tests were only 69 days. In
terms of consolidation, this is not a sufficient time to allow complete
primary settlement to occur.
4
Gary Albarelli
Gary Albarelli

Offsetting these limitations is the application of centrifugal
modelling techniques in which a 1/Nth scale model is constructed using
identical materials and geometry. Stress similitude is accomplished by
increasing the gravitational unit weight N times via centrifugal
acceleration.
OBJECTIVE AND SCOPE
From the preceding considerations, the research objectives of this
study were to evaluate various reclamation schemes to enhance
consolidation rates and magnitudes and thus reclamation efforts.
Specifically, the use of (a) flocculants, (b) sand/clay mixes, and
(c) capping as waste clay pond treatments were investigated.
These objectives were investigated using centrifugal modelling
techniques as applied to various reclamation schemes using waste clay
from IMC's Kingsford mine.
5

CHAPTER II LITERATURE REVIEW
FLORIDA STATUTES
Table 2 presents excerpts from Chapter 16C-16 Mine Reclamation
pertaining to waste clay reclamation. As stated (Para. 9-a-2) avoidance
of long-term existence of above ground disposal areas is recommended,
which suggests consolidating the clays to solids contents greater than
30-40%. Paragraph 9-b-1 suggests using the sand tailings for
accelerating the thickening (i.e., consolidation) or mixing the sand
with the clays. Paragraphs 12-b-1 and 13-a suggest using a sand/clay
mix and/or innovative techniques which will hasten reclamation.
Accordingly, Florida legislature has acknowledged waste clay reclamation
and mandated the use of innovative techniques, It is the evaluation of
some of these potential reclamation techniques, that is the subject of
this report.
FLOCCULATING AGENTS
Since initial USBM flocculating agent studies
in 1972, literally hundreds of flocculating agents have been screened
on phosphatic clays
and tested. The concept being that by adding chemical agents to the
clays, flocculation and rapid settlement are promoted, thereby
increasing solids contents. Flocculation costs and the residual effects
on future beneficiation has greatly reduced the number of viable
flocculants. Onoda (1977) examined the settling characteristics on
waste montmorillonitic clays treated with organic and inorganic
flocculants and concluded the most effective reagents were: non-ionic
polyacrylamide (PAM), followed by cationic and anionic PAMS. Smelley
7

Table 2 Excerpts From Florida Statutes Chapter 17Pertaining to Waste Clay Reclamation
8

and Field (1979) evaluated various organic and inorganic flocculating
reagents and concluded that hydrofluoric acid and polyethylene oxide
(PEO) were the most effective, with PEO being the most promising.
However, Barwood (1982) points out that PEO is mineral specific, i.e.,
good performance is obtained with smectite rich clays, but very poor
performance is obtained with polygorskite clays. Apparently,
consideration must be given to presence of sulfide materials and
exchange ions other than calcium.
Several pilot full-scale processes involving flocculants have been
used; specifically, Gardinier's process, Occidental's rotary screen
process, and Estech's enviro-clear process. Gardinier's process is a
two-stage flocculating system using proprietary flocculants and achieves
a reported 27-32 percent clay solids. Occidental‘s rotary screen is
based upon the USBR's PEO concept. PEO forms very strong stable flocs,
which can be partially dewatered on a static screen and further
dewatered on a rotary screen (tromel). The Estech's "Enviro-clear"
process is a technique utilizing a combination of flocculant and sand
tailings. A proprietary anionic polymer is used to flocculate the clay
to which sand is subsequently added. (Mctendon, et. al., 1983)
The optimium dosage to obtain the most beneficial settling rate and
final solids content for these processes is usually evaluated via bench
tests, with typical values less than 1.25 kg/MT (2.5 lbs/Ton).
SAND/CLAY MIX
The concept of a sand/clay mix disposal scheme arises from the
obvious need to dispose of both waste clays and tailings from the
beneficiation process. Accordingly, combining these two materials for
9

simultaneous disposal has additional suggested advantages of increased
unit weight and permeability of the mix, both which enhance consolida-
tion magnitude and rate. However, it should be cautioned that, the
increase in unit weight created by adding sand to waste clays will be
quite modest; i.e., assuming Gsclay = Gssand, then for sand/clay mix(1 + So x SCR) Y
WG
‘t = G(1 - So) + So (1 + SCR)
where γ t= total unit weight and γ' = γt- γ w
G = specific gravity
So = Solids content of clay
SCR = sand:clay ratio
γ w So(Gs-1)and for untreated clays γ t = T., l-so + S
For example, a 2:1 sand/clay mix of 16% clay solids using G=2.65 will
have a buoyant unit weight of 18.3 pcf as compared to 6.9 pcf for the
unmixed clays. Although a 268% increase in unit weight is obtained, a
buoyant unit weight of 18.3 pcf is quite low. The suggested increase in
permeability benefit is tempered by investigations involving the effect
of fines content on the permeability of sands which reveal that very
small quantities of montmorillonic clays; i.e., 4-5% are required to
render sand impermeable; i.e. k a 10-7
Figure 1.
10
(1-So)
to 10-8 cm/sec as illustrated in

WELL GRADED COARSE GRADATIONS (30-70% t20 SIEVE) W/IO TO 25 ?‘. NP FINES
POORLY GRADED SILTY SAND W/ 30 TO 50% NP FINES
CLAYEY SILTY S W/ 30 TO 50% FIN ES
I I I I I
0 I 2 3 4
%BENTONITE BY DRY WEIGHT OF SR BACKFILL
4
5
Figure 1. Relationship between Permeability and Quantity of Bentonite Added to SB Backfill (From D'Appolonia, 1980)
11

Sand/clay mixes are currently used by CF Industries (Hardee) (Keen,
1982) and Brewster Phosphates (Leitzman, 1982). The CF operation
involves discharging waste clays from the beneficiation plant to an
initial settling area where they thicken naturally to about 12% to 18%
solids. A dredge is then used to excavate the thickened clay and pump
it to a mixing station where a 2:l mix is prepared and pumped to
previously mined cuts for reclamation. Field data show that from an
initial average clay solids content of ~ 20%, the average clay solids
content has increased to ~ 32 to 36% over a 1.5 year period in a waste
pond approximatetly 35 ft. deep.
Estech's "Enviro-clear" process also involves sand/clay mixes,
however, in this case a flocculatant (PAM) is added to the beneficiation
clays (a 3 - 5%) to achieve rapidly a solids content capable of
maintaining the sand tailings in the mix. The clay, flocculant and sand
tailings are mixed simultaneously to produce a 1:1 to 2:1 s/c mix and
subsequently pumped to a waste storage pond.
IMC experimented with sand/clay mixes in which a 1.5:1 mix was
placed in an 18 ft. deep pit. Unfortunately, their observations
concluded that the ultimate clay density of the sand/clay mix would be
insufficient to allow the clays to be disposed at or below ground level.
In 1977-78, IMC performed tank tests to compare a 1:1 sand/clay mix
with clay only. Two tanks 9' x 14' x 22' were filled, one with
Kingsford clay (So = 12.6%) and the other with a 1:1 s/c with the clay
at 15.4%. After 403 days the clay had increased from 12.6% to 21.1% or
an increase of 8.5% solid content units. Correspondingly, the clay
12

faction of the s/c mix increased from 15.4% to 24.6% or a net change of
9.2% solid content units; as summarized below:
Waste Clay
Initial Solids Content, % 12.6 .
S/C Mix
15.4
Clay Solids after 403 days, % 21.2 24.0
Intial height in tank, ft. 20.75 21.4
Final height, ft. 12.2 12.5
% Settlement, AH/H, 41.2 41.6
From these results, it was concluded that the value of a s/c mix is
detectable, but of limited benefit.
Lawver (1982) using Somogyi's (1979) computer model, which had
been calibrated using the IMC tank tests, compared simulated
consolidation rates of clays only vs s/c mixes. For identical 34.5 ft.
deep ponds with O:l, 1:l and 3:l s/c mixes using a filling rate of 3 x
lo6 tons/yr, the following results were obtained:
0:l s/c 1:l s/c 3:l s/c
Fill Time, days 748 785 748
% clay solids when filled 22.2 25.6 29.4
Ultimate Settlement, ft. 9.2 8.4 6.6
% clay solids ultimately 28.7 33.1 37.4
Ultimate clay storage cap. T of clay/Acre-ft. 476.1 491 428
These results show that an optimium s/c ratio exists (i.e., 1:l) for
ultimate clay storage capacity, and that a net loss could occur if the
s/c ratio is too high.
13

CAPPING
An alternative method to sand/clay mixes for simultaneous disposal
of sand tailings and waste clays is to cap the waste clay settling ponds
with the sand tailings. Capping has the advantage of applying a greater
effective stress than the increased unit weight of a sand/clay mix.
Unfortunately, the major impediment to sand capping is; how does one
place a 2.5 ft. sand cap over very soft clays without having the cap
merely displace the clays and settle to the pit bottom? In this
context, IMC-Agrico-Mobil during 1978-1982 experimented with sand
capping (Lawver and Olson, 1982).
Their first large scale experiment evaluated methods for capping a
1.5 s/c mix in test pit; specifically, (a) sand sprays (as used by
Brewster, Lietzman, 1982), (b) flowing tailings from a side delivery
system, (c) tensile reinforcement of the surface using geotextiles, (d)
geotextile plus s/c mix cap.
a) Sand sprays - the use of sand sprays resulted in a very uneven
tailings distribution with sand piles forming conically around the spray
nozzles. Ultimately, these piles lead to localized heaving of the clays
and unacceptable results.
b) Side delivery pumping - attempts to "flow" the sand tailings
across the test pit produced beaches along the pit sides with
considerable heaving of the clays at the pit center. Obviously
continual disposition along the sides would only produce surface failure
of the clays.
c) Geotextile reinforcement - An initial experiment placed non-
woven fabric (Typar) over a small test pit consisting of 16% solids
14

clay. An attempt to flow sand tailings over geotextile resulted in side
beaches and heaving of the clays at the center producing unacceptible
results. Subsequently, a larger test pit of 1.5:1 s/c was successfully
capped using small bulldozers to push the sand tailings onto the
geotextile covering the pit. Although this latter method was
technically successful, the use of geotextiles and bulldozers was deemed
unfeasible economically.
d) Geotextile reinforcement plus s/c mix cap - Subsequent to
the tests described in (c), flowing a high (5:1) sand/clay mix over the
geotextile was attempted, with successful results.
Brewster Phosphates utilized a sand spray technique with the
objective of creating a sand/clay mix, however, the method could be used
to create a cap (Lietzman, 1982). In this procedure, the clays are
thickened to approximately 12 to 18% and the sand sprayed onto the clays
through nozzles mounted on a floating pipeline. At these solids content
the sand settles through the clays creating a s/c mix. If solids
contents less than 12% are used the sand merely flows through the clay
to the pit bottom, while solids higher than 18% result in a cap being
formed. Following the spraying operation, bulldozers are then used to
spread the final sand with overburden being added.
CENTRIFUGAL MODELLING CONSIDERATIONS
Introduction
Physical modelling is a popular technique in many engineering
disciplines and consists of constructing a scale model of prototype
dimensions and then subjecting it to actual operating or field
conditions. For the model to be a faithful representation of the
15
Gary Albarelli

prototype, it must be subjected to the same stresses which the prototype
might experience. This requirement is often difficult to satisfy.
If a model of reduced scale is constructed, it is reasonable to
expect that the model will have identical geometric properties as the
prototype. If constructed with the same materials, then material
properties will also be identical. It is also possible to subject this
scale model to surface or boundary forces similar to those experienced
by the prototype. However, when dealing with soils, there is one
imporatant condition which cannot be duplicated in a simple scale
model. Stresses at corresponding points in the model and prototype are
not equal. Although both are subjected to the same gravitational field,
stresses at any given point are a function of the height of overlying
material and its unit weight. Since these heights differ between model
and prototype, the stress levels will also differ. This dissimilarity
of body forces restricts the uses of conventional modelling in
geotechnical engineering.
Since stress levels in the soil are a function of the height and
unit weights of the overlying material, equivalent stress levels can be
achieved by increasing either height or unit weight. Since the obvious
advantage of modelling is reduced scale, the unit weight of the material
needs to be increased. This can be achieved by either changing material
(higher specific gravity) or by increasing the gravitational force.
Since we wish to model material as well as geometric properties, the
obvious choi
gravational
centrifugal
ce is to increase the gravitational force. Increased
forces can be modelled by subjecting the model to high
forces. By increasing the acceleration of gravity n times
16

and by decreasing the linear dimensions of the model by the same n
factor, equal stress levels at similar points will be produced.
Scaling Relationships
The scaling relationships pertinent to modelling waste clay
disposal are those involving: (a) geometry, (b) stress, (c)
consolidation, and (d) sedimentation.
Geometric scaling. Is simply a scaling factor n = Lp/Lm.
Consequently, area: Ap = n2 Am and volume: Vp = n
3Vm
where Lp, Ap & Vp = length, area, and volume of prototype
Lm, Am & Vm = length, area and volume of model
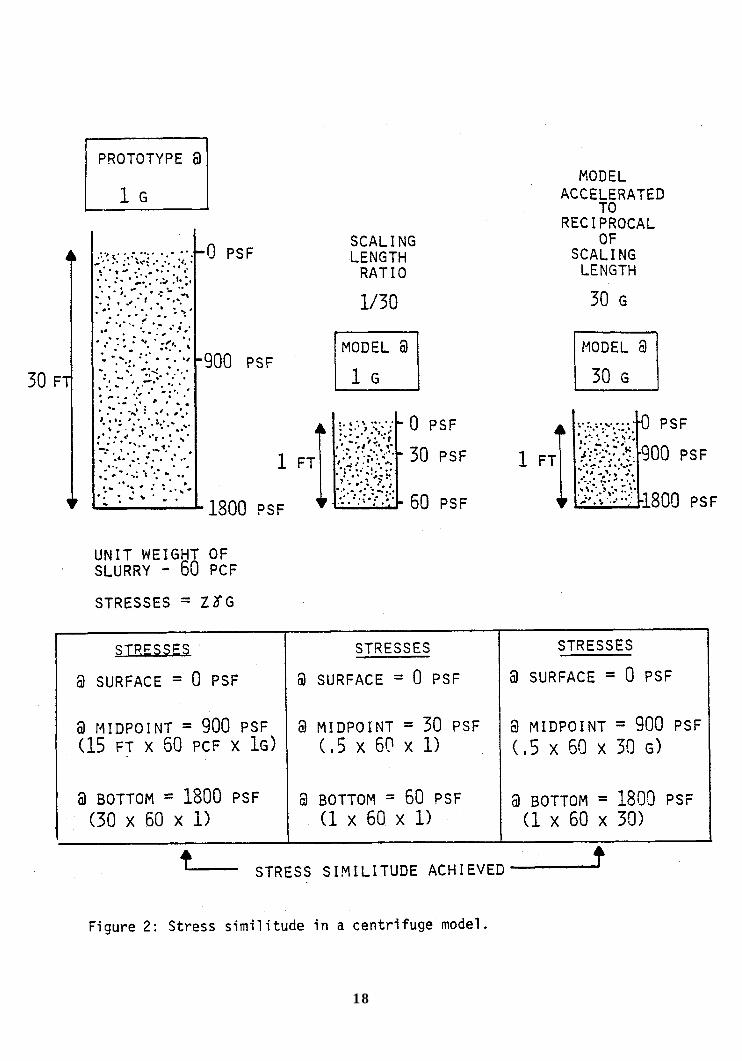
Stress. Similitude cannot be achieved in scale models without
increasing the unit weight, since stress = YZ, where Y = unit weight
of material, and Z = depth. However similitude can be achieved by
increased accelerations as γ = ρ.g (unit wt. = mass density
gravitational acceleration). Accordingly, the stress in a scaled
model will be in similitude if the gravitation acceleration is
increased correspondingly as illustrated in Figure 2.
Consolidation. As sedimentation ends, consolidation begins, with
consolidation being characterized by the compression of the
sedimented solid particles through the dissipation of pore water
pressures within the soil mass. During this phase, the effective
stresses are greater than zero. Since the slurry is made up of two
constituents, solids and liquids, the modelling requirement of
17
Gary Albarelli
Gary Albarelli
18

equal stress levels at corresponding points must apply to both
materials. Since the model slurry is identical to the prototype, and
assuming that the initial state of agitation of the slurry is similar,
then the permeability distributions in the model and prototype will be
equal.
The dissipation of excess pore water pressures due to self weight
consolidation may be analyzed using the general equation governing
seepage due to compression of the soil mass. This is given as
19

where subscripts p and m indicate prototype and model, and the alpha's
are as yet unknown scaling factor quantities.

develop in the model as in the prototype. This then indicates that the
permeabilities should be equal, and thus
aK = 1
These assumptions lead to
2 at = n
and substituting this relation back into t = tmat
2; n2 P
or t P
= n2 t,
This mea% that the time rate of consolidation in the model is
speeded up by the square of the scaling factor. Since n is also the
acceleration of the model, the rate varies as the square of
acceleration. Thus, at 85 g., a one year time span in the field will
take
WK’W
85' = 1.2 hours
in the centrifuge.
Herein lies the major benefit of centrifugal testing. Using this
modelling relationship provides a methodology of modelling consolidation
most efficiently, thereby allowing evaluation various disposal schemes
to completion.
Sedimentation. The initial settling of the waste clay particles is
imentat a sed
Law.
zero,
During I
a = 0
sedimentation and consolidation phases, it has been suggested that
sedimentation ends at solids contents of approximately 8 percent.
Newton's mechanical similarity definition suggests that the
is explicity proport ionality of all the forces acting in a system
ion process, and the rate can be approximated by Stoke's
this process, the effecti ve stresses are initially
. While it is impossible to separate precisely
21

required, i.e., a common scale factor should be applied to all the
forces that governs the modelled phenomenon. Often it is not possible
to satisfy this condition (Croce, et. al., 1984). In discrete settling;
gravitational forces, Fw, viscous (drag) forces; Fd, and buoyant forces,
Fb, govern the phenomena. Ideally,
p h- Fbp
wm Fdm Fbm
Using geometric scaling lp/lm = a, and centrifugal acceleration is
22
Gary Albarelli
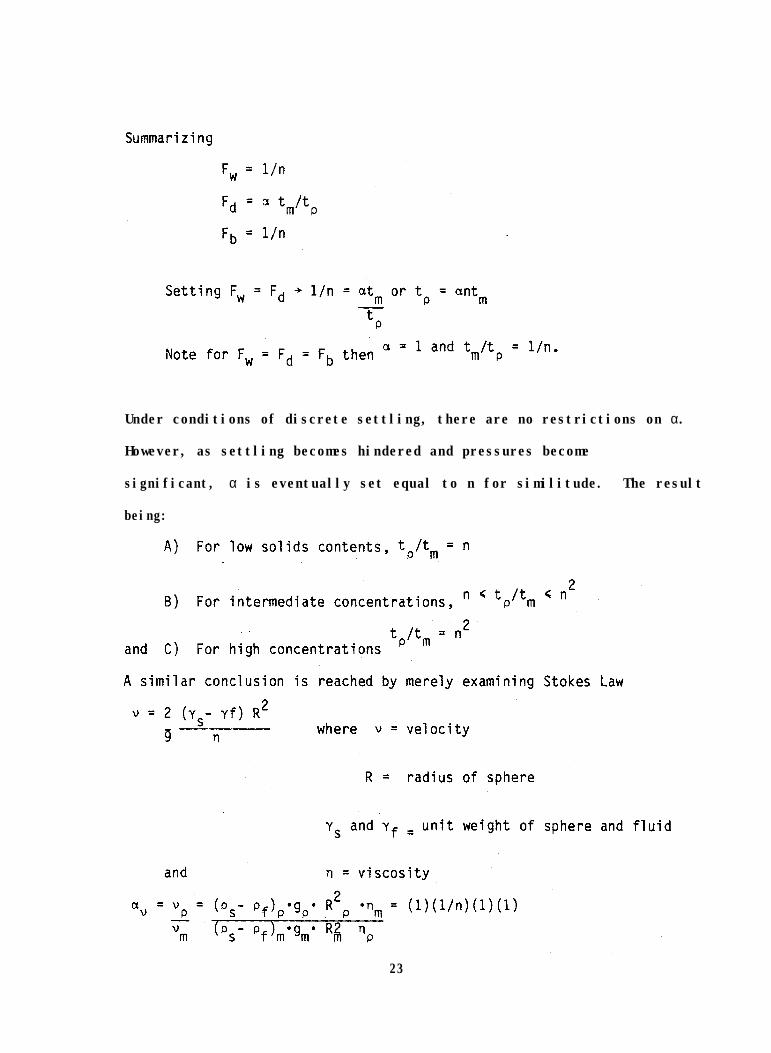
Under conditions of discrete settling, there are no restrictions on α.
However, as settling becomes hindered and pressures become
significant, α is eventually set equal to n for similitude. The result
being:
23
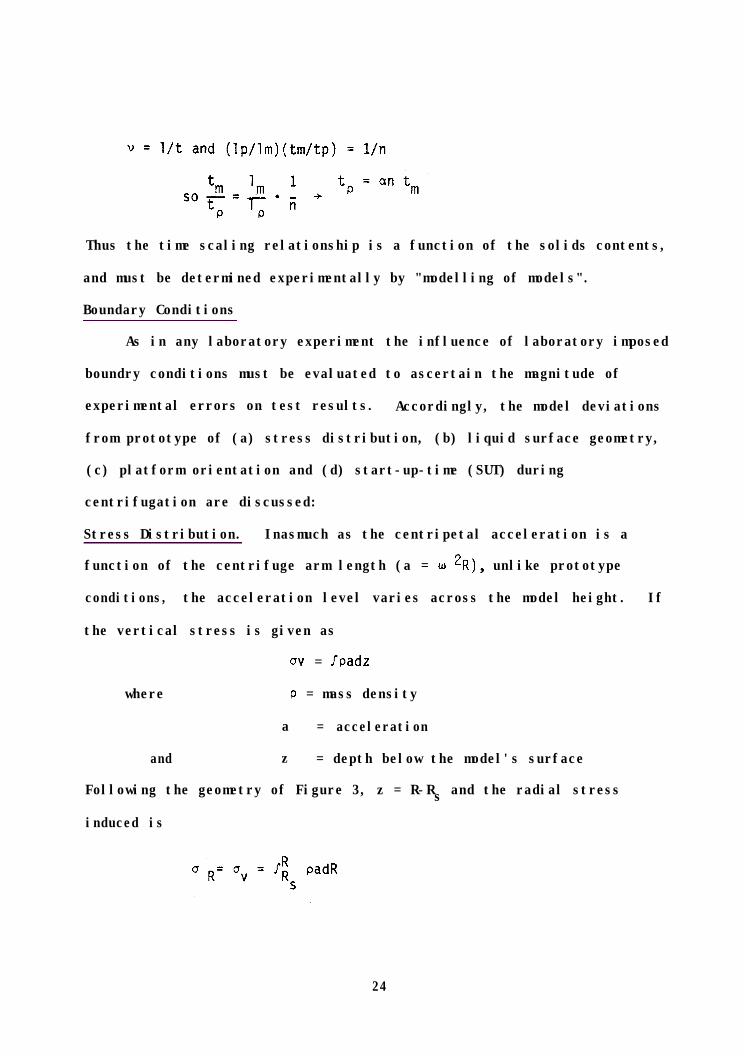
Thus the time scaling relationship is a function of the solids contents,
and must be determined experimentally by "modelling of models".
Boundary Conditions
As in any laboratory experiment the influence of laboratory imposed
boundry conditions must be evaluated to ascertain the magnitude of
experimental errors on test results. Accordingly, the model deviations
from prototype of (a) stress distribution, (b) liquid surface geometry,
(c) platform orientation and (d) start-up-time (SUT) during
centrifugation are discussed:
Stress Distribution. Inasmuch as the centripetal acceleration is a
function of the centrifuge arm length (a = w *R), unlike prototype
conditions, the acceleration level varies across the model height. If
the vertical stress is given as
(JV = Jpadz
where P = mass density
a = acceleration
and z = depth below the model's surface
Following the geometry of Figure 3, z = R-Rs and the radial stress
induced is
24
Gary Albarelli
Gary Albarelli

SAMPLE
I R
9 1 z
* I c- I
Figure 3: Plan Views of Rotating Sample
25

these limits are used since the stress is zero at the model's surface.
By multiplying and diving by g, this expression becomes
aR s = r; o"g*a/g dR
Since pg equals the prototpye unit weight, y, and a = w*R,
upon substitution we obtain
R yw*RdR
uR = 'R S 9
Integrating yields
yw2 R*- Rz
OR= 'v=- ( >
9 2
Hence this equation allows calculation of the stress level at any depth
within a centrifugal model. Rearranging and noting the z = R-R,, yields
OR Adz
R+Rs
cl 2
Since aR = C when R = RS and aR is a maximum when R = Rs+ z or
OR max
then the stress error, 5,
OR '
YW *-
= YU2 - z (2Rs + z) 29
s given by
')
*= 29 L (2R, + z) - 5' z (*Rs)
uR & OR&
29
i
Cancelling terms,
2RS t z - 2Rs -
2RS
26

which becomes
AU R Z -=-
'R 2Rs
Considering a 10 cm deep model (z = 10 cm) on a 1 meter radius
centrifuge, reveals a stress error,
AaR/ aR = 10/z (100) = 5%.
Liquid Surface Geometry. Figure 4 illustrates the forces acting on
a fluid during centrifugation in a vertical plane, specifically, (a)
weight = mass x earth's gravity (lg) or MG, (b) centripetal force =
mass x centripetal acceleration ( w 2R) or M w *R and (c) the
resultant of (a) and (b) = MP inclined at 8 . By definition, an
equipotential curve is one for which the total head remains surface
will be an equipotential curve. For Figure 4, then
FRdr f F,dz = 0
where FR = Mw2R
and Fz = -MG.
By substitution, M u 2Rdr - MGdz = 0 2
and integration yields F - Gz + C = 0 .
This is the equation of a parabola. That is to say, the liquid surface
in a centrifugal model is parabolic, whereas in the prototype it is
considered level.
By imposing the boundary conditions that 0 represents the model
bucket diameter than the boundary conditions of z are 0 and 0.
Accordingly, rearranging the equation in terms of z and eliminating C,
provides
w2R ' w2R ' D
D =- - 2G 2: Or D 2G
= & (RD2 - Ro2)
27

Figure 4: Forces Acting on a Fluid During Centrifugation
28

If we factor (RD2 - Ro2) to (RD + Ro) (RD - Ro) and note that R,, + R, =
3,, , where Rm is the distance to the mid-point of the model liquid
surface then:
RD - R, = GD
W2R m
Since w 2Rm is the acceleration level of a centrifugal model test, then
the difference in fluid surface level, RD - R" =AccDLeveT
For typical 60 g tests using a 14 cm diameter bucket, this will be a
total difference of j$ = 0.23 cm, or considering the mid-point, 0.11
cm.
Having considered the liquid surface shape in a vertical plane, it
is now appropriate to observe what effect the centrifuge rotation has on
the liquid surface slope in a horizontal plane. Since the model follows
a circular path as illustrated in Figure 5 the equipotential lines
across the model are curved. If the angle 8 denotes the angle between
the model centerline's radius and any other equal radius at another
point as the model,then 0 < Q < Qmax, where Omax = the subtended angle
to the model boundry.
Since acceleration is a vector, it will be parallel to the
centerline of any Q. To determine the difference in acceleration
between midpoint of the model and its boundary at the container edge, it
is simply
R-R cos emax
= AR
For a 1 meter centrifuge and model bucket of D = 14 cm, from geometry
Sin emax = D/2R = 0.07, and
'max = 4.0 deg
29

Figure 5: Geometric Parameters Used in Model Analysis.
30

thus the difference will be 100 - 100 Cos 4.0 = 0.25 cm. This
difference between the edge and the centerline of the model, will
correspond to a difference in acceleration level of (for a 60 g test)
. 60 - 100 - 0.25 x (60) = 0.15 g 100
thus, a difference of 0.15 g is a maxima at the shortest radius and
decreases as the interface settles (since D is a constant,
0 decreases).
Platform Orientation. Most geotechnical centrifuges are now
constructed with a pivoting or swing-up bucket. This allows the model
to be conveniently placed or constructed in the container under l-g,
earth gravity, conditions. Theoretically, during acceleration, the
bucket should rotate upward such that the resultant acceleration field
remains exactly perpendicular to the platform's surface. The resultant
acceleration is simply the vector sum of the l-g acceleration acting
vertically downward and the chosen horizontal or radial centrifugal
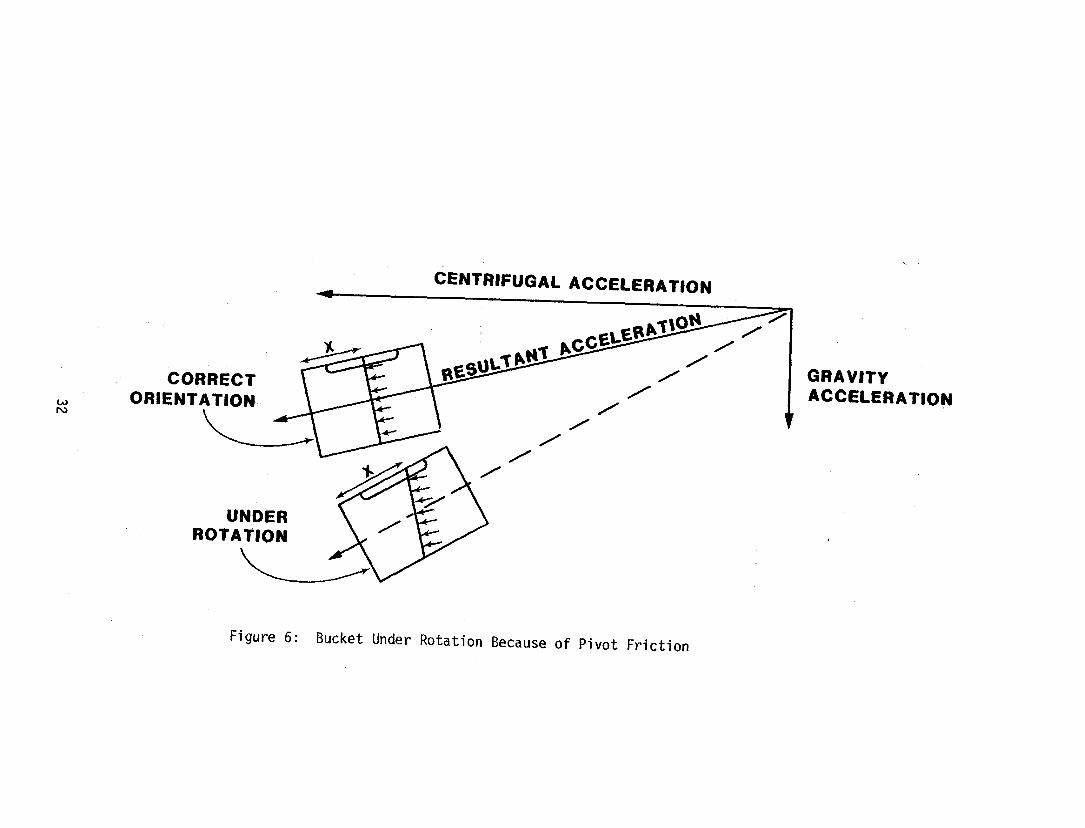
acceleration. In practice, unavoidable friction in the pivot bolts will
result in an under rotation of the bucket. This is shown to an
exaggerated degree in Figure 6. Such an under rotation in the
phosphatic slurry tests can result in a significant error. The solids-
supernatant interface will be displaced at the viewing windows, and the
height of solids will be over predicted. A 4 rrun error in this height
translates into an error of about 4% in the initial water content and as
high as 21% towards the end of consolidation.
Parabolic Liquid Surface and Platform Orientation Adjustments To
provide adjustments to the parabolic liquid surface and platform
31 31

orientation problems, Bloomquist, et. al., (1984) devised a method of
allowing the model container buckets to over rotate and then restrain
the over rotation, so a calibration can be performed. Over rotation is
provided by offsetting the pivot as illustrated in Figures 7a. and b.
Once the over rotation is achieved, some method is needed to restrain
the bucket at its correct position. This restraint is provided by a
restraining bucket and adjustable bolt as illustrated in Figure 7b.
The principal disadvantage to this method is that the centrifuge must be
stopped each time to adjust the bolt. However, once properly set, no
additional adjustment is required for the test devation. Of course a
different model or different acceleration, will require readjustment.
In the case of a consolidating waste clay, the center of gravity
translates towards the end of the bucket, increasing the upturning
moment. Consequently, the initial bolt adjustment is the only one
required.
The calibration proceeded to account for the parabolic liquid
surface and restraining bolt adjustment is accomplished by placing a
know volume of water in the centrifuge plexiglass bucket and adjusting a
marking scale on the container side to read the appropriate
height of water; i.e., 10 cm. The plexiglass bucket is then accelerated
to the proposed test acceleration. If the water level as measured from
a Polariod® photograph is too high, the bucket was under rotated, if
too low it has over rotated. By repetotive trials, the restraining bolt
can be properly adjusted.
Start-up Time. The start-up time (SUT) in centrifuge testing is
the elapsed time between start of rotation and achieving the desired
33
Gary Albarelli

Figure 7: Bucket Configurations for Orientation Adjustment
34

test acceleration. This may vary from 30 seconds to 10 minutes, depend-
ing on the magnitude of the acceleration and on the available power
supply. For nontime-dependent geotechnical modelling problems, such as
bearing capacity and slope stability for drained conditions, the start-
up time does not affect the results. However, for such processes as
sedimentation, large strain consolidation, and seepage analyses,
neglecting this period may substantially affect the results.
Figure 8 shows a plot of acceleration versus time. In this and
subsequent figures it has been assumed that the test acceleration ,of 10
g is reached in 1 minute and that the run-up slope is linear. Note the
ordinate axis is labeled from zero rather than from the 1 g. This is
common practice and does not introduce appreciable error in the
analysis.
Frequently the recording of model elapsed time is started at Point
P, with the start of centrifuge rotation. After some length of
centrifuging, T minutes, it would be in error to claim that the
prototype would be in an identical state after (T) (A)a minute (where A
is the test accelertion and a the scaling exponent). This is, of
course, because during the model start-up time the acceleration level
was not equal to A but was less. Alternatively, some researchers begin
recording the model elapsed time after the test acceleration level has
been reached, Point Q. This would result in an error in the opposite
direction.
The model elapsed time at which recording should be initiated lies
between Points P and Q and is a function of the exponent by which the
process being tested is governed. Bloomquist, et. al., (1984) have
35

36
found that in general for an acceleration level A for a process where
the time exponent is a , then recording of the elapsed time should begin
after a time equal to [a / (a + l)] (SUT).
In the case of consolidation phenomena where a = 2, if we assume
SUT = 120 set, then the elapsed time should begin at 0.667 (120) = 80
sec. In the case of sedimentation phenomena, where a = 1, then the
elapsed time should begin at 0.5 (120) = 60 sec. In practice,
application of these correct elapsed times depend upon the centrifugal
model test; for consolidation models lasting l,OOO+ minutes corrections
are trivial. Conversely, for sedimentation models lasting 10 minutes,
correct elapsed times are important.
37

CHAPTER III: EQUIPMENT, PROCEDURES, AND MATERIALS
UNIVERSITY OF FLORIDA GEOTECHNICAL CENTRIFUGE
The University of Florida geotechnical centrifuge has a one-meter
radius and 2,125 g - kg capacity; that is; a capacity of approximately
80 lbs. can be accelerated to 100 g's. For these centrifugal model
tests, the waste clays are placed inside a 14 cm diameter by 15.25 cm
high plexiglass container, which in turn is housed inside a swinging
aluminum bucket. A vertical slot in the aluminum bucket permits visual
observation of the model during flight. A photo-electric pick-off and
flash delay augment the system for photographic monitoring of the clay
surface interface. Figure 9 presents a schematic drawing of the
centrifuge.
CENTRIFUGE SPECIFICATIONS
The centrifuge used is a Rucker Model 57-2380 powered by via a 2-
horsepower, electric motor. Two rotating arms, 180 degrees apart, each
support a platform on which two samples may be mounted, thus permitting
simultaneous testing of four specimens. The distance from the axis of
rotation to the centroid of a platform is 34 1/2 inches (~1 meter).
A protective metal housing encloses the entire assembly. Access to
the platforms is possible through a swinging side door and hinged top
panel. A 14 by 16 inch removable, plexiglass viewport is located on the
left top-panel, which allows access to the sample, and provides the
window through which photographic records are made.
DATA ACQUISITION
Data acquisition is a photographic record obtained using a
stroboscope and PolariodQP camera. A strobe was selected over a high
speed camera and flash as in a typical test (257 rpm and 42 1/2 inches
39

SLIP RING
Figure 9: Schematic of Centrifuge and Camera Set-Up
40
radius, equaling 80 g units), a point on the periphery of the centrifuge
moves 1.14 inches in 1/1,000 of a second. This movement is too great
for an ordinary mechanical shutter to "stop." Electronic shutters will
work, but are extremely expensive and do not provide visual observation
of the sample in motion. However, a strobe light can deliver high
intensity light flashes of extremely short duration. For example, a
standard strobe can produce flash durations of one to three
microseconds. Hence, a Stoboslave Model 1539-A manufactured by General
Radio Company was used. By aiming the reflector at the sample and
manually adjusting the flash rate, the specimen can be made to appear
stationary, allowing observation and photographic recording.
Initially it was thought that a manual procedure for adjusting the
flash rate to correspond to the arm speed would be adequate. However,
the centrifuge does not maintain an exact speed setting. Instead, it
varies continuously. Factors that contribute to the minor fluctuations
included line voltage surges, mechanical play in the gears and belt, air
turbulence and harmonic vibrations. This means that the strobe has to
be continuously adjusted to maintain the sample at a particular
location. A second problem concerns the flash rate. At 257 rpm, the
strobe flashes 4.3 times per second. In order to prevent double
exposures, the camera shutter must be set at a speed which will open,
allow one flash and then close before the next flash occurs. While this
is possible, it means that only a few centrifuge speeds are usuable,
since most cameras have only five to seven available shutter speeds. In
addition, the fluctuation of the rotating arm would make photographing
the specimen a hit or miss proposition.
41

It was therefore necessary to make use of the strobe's external
trigger which bypasses the internal oscillator and flashes upon
reception of an external signal. One possible solution was to install a
mechanical triggering device and attach this to-the rotating arm. With
this arrangement, the strobe would flash when the circuit was completed
by the trigger. The sample would therefore remain optically stationary
regardless of any speed fluctuations. Several microswitch setups were
considered. However, since mechanical closure of contact points
triggers the flash, wear, adjustment, and alignment, problems are
made forforeseen. In addition, a new adjustment would have to be
different speeds; as the delay-time would be different.
A final decision was made to use a photo-electric pickoff (Model
1536-A), a Gen Rad accessory designed for the stobe. It obtains trigger
pulses from the moving object by reflected light and thus avoids
mechanical closure devices. The pickoff head contains a small lamp, a
light sensitive photocell and a lens. These convert abrupt changes in
the reflectivity of a moving surface into electrical impulses. The
signals are then amplified and received by the strobe unit. In order to
provide consistent triggering, a sharp discontinuity in reflectivity
must be used as a trigger point. A black (highly light absorbent) tape
was used as a background surface, and a small piece (2 mm wide) of
Scotch silver polyester film tape (No. 850) applied over it. When the
tape passes across the pickoff head, its internal light source is
reflected back into the unit to the photoelectric cell, and a one-volt
pulse is transmitted to the strobe. The pickoff was located on top of
42

the centrifuge adjacent to the main spindle. Here, the spindle consists
of a 1 1/2 inch diameter shaft extending about four inches above the
centrifuge housing. Both tapes were applied to this shaft and the
pickoff head was directed towards this area from a distance of several
inches.
While this set up provides excellent results, the problem
concerning multiple flashes and camera synchronization remained. One
other feature was also desired. Since four buckets, and thus four
samples may be tested simultaneously, both sets of samples should be
observable during operation. However, the pickoff is set to illuminate
only one arm a time. The pickoff can be manually moved until the other
arm's sample is in view but this is both time consuming and very
difficult to adjust accurately during machine operation.
A model 1531-P2 Flash Delay was acquired to solve these problems.
This accessory is designed to accept the pickoff impulse, and insert a
controlled amount of time delay between trigger pulses and the resulting
strobe flashes. Thus, while the pickoff remains stationary, the strobe
can be adjusted to flash at different times. This allows for very
accurate orientation of the illuminated sample. A second photo-electric
pickoff was installed to illuminate the opposite arm. For photographing
the sample, a manually operated single flash switch is provided. Once
the sample is aligned with the camera lens, the switch can be set to
this mode. The strobe will now flash only when the trigger button is
pressed. This feature completely eliminates the multiple exposure
problem.
43

THE CAMERA
The ability to obtain close-up, instant photographs during a test
sequence is the primary reason a Polaroid® camera was used. In
addition, much versatility is required in order to obtain accurate
photographs while the subject is moving at high speeds. For these
reasons, a Polaroid® model 600 SE camera was selected. The film used,
Type 667, is extremely fast (ASA 3,000), and thus provides excellent
photographs when used in conjunction with a strobe. The standard camera
comes with a 127 mm lens which has a minimum focusing distance of 3.5
feet. For the type of measurements to be made from the photograph
(reading to the nearest 1/2 mm), a close-up lens set was added.
Since the centrifuge vibrates during operation, the camera cannot
be mounted directly to the protective housing. A platform was anchored
to the ceiling joists directly over the viewport. Guy wires and
turnbuckles provided platform rigidity. A close-up camera mount was
inverted and attached to the platform using C-clamps. This allowed the
base to be easily adjusted as needed. A four foot long tube extends to
within one inch of the centrifuge housing. The camera attaches to an
adjustable mechanism which slides along the tube. This allows the
camera to be raised and lowered or moved horizontally three inches.
MODEL CONTAINER
Like most centrifuges, the University of Florida machine rotates in
a horizontal plane. The resulting centrifugal force, for all practical
purposes, radiates in a horizontal direction. If a prototype is to be
scaled down in size and then subjected to an accelerated force field, it
is important to maintain the proper orientation of the model during
44

flight. For example, if a 50 foot pipe column of slurry is to be scaled
to a one-foot model, then accelerated to 50 g's, the model must be
placed such that the one-foot dimension is horizontal or within the
plane of rotation. If this is not done, then equal stresses within the
model and the prototype will not be produced.
The University of Florida Centrifuge uses pivoted mounting
platforms. This design ensures that the acceleration field will only
change in magnitude, but not direction. The resultant acceleration
vector is always directed through the bottom of the sample. When the
slurry is introduced into the upright container, gravity is the only
body force acting. As the machine speed increases, the container swings
outward until it reaches a near horizontal position. There, with
centrifugal forces predominant, the sample may be observed and its
response recorded. The advantage of such a set-up is that the
centrifuge may be stopped and restarted without disturbing the sample.
The model container assembly designed consists of four individual
components:
1. Plexiglas Container
2. Aluminum Bucket
3. Pivot Bolt
4. Aluminum Bucket Housing
Plexiglas Container
The Plexiglas container; which contains the waste clay slurry, was
constructed from 6 in. OD, 1/4 in. thick, 6.0 in. lengths of tubular
Plexiglas. A 1/4 in. Plexiglas plate bonded to one end forms the
container. A metric scale, with millimeter divisions attached to the
45
Gary Albarelli

outside of the container, provides visual monitoring of clay slurry
interface heights. The empty containers weigh approximately 1.4 lbs.
(0.64 kg).
Aluminum Bucket
Since high stresses are developed in the centrifuge, the plexiglass
container alone would not be strong enough and some means of support and
protection was required. Accordingly, a tight fitting aluminum bucket
was selected; it would carry most of the in-flight stresses. An
aluminum pipe with an outside diameter of 6.563 inches and an inside
diameter of 6.063 inches was cut to a 10 inch length, and a 1/4 inch
plate heliarc welded to one end. A 1 x 4 inch cutout was made in the
lower side, such that the slurry and metric scale would be visible when
assembled. Two 3/4 inch diameter holes were drilled to accept the pivot
bolt. The aluminum bucket alone weighs six pounds.
Pivot Bolt
The aluminum bucket rotates upward into a horizontal position under
centrifugal loading. This vertical motion occurs only during starting
and stopping, the assembly remaining stationary with respect to the
pivot bolt during most of the test. It was felt that roller bearings or
bushings were not necessary. Instead, a 3/4 inch high strength steel
bolt, nine inches long, was used to provide the pivotable support.
Container pivot bolts are offset slightly from the center of the
aluminum buckets to insure that the buckets will always over rotate. A
restraining bracket attached to the bucket housing and an adjustable
bolt maintain the bucket in a position pre-determined for each
acceleration level. This design insures that the resultant acceleration
46
Gary Albarelli
Gary Albarelli
vector is always perpendicular to the model's ground surface. If the
pivot bolt passed through the center of the aluminum bucket, the
changing center of gravity of the sample (due to consolidation) would
cause bucket orientation, and hence, the acceleration vector, to change
(Bloomquist, et. al., 1984).
Aluminum Bucket Housing
The final component required for testing was the support structure
for the buckets. During initial centrifugal testing programs, a single
housing with accompanying bucket was mounted on each arm. To increase
the efficiency of future testing programs, a dual housing was mounted on
each arm; this permits four samples to be tested simultaneously. The
housings are built of l/4 inch aluminum alloy plate with heliarc welded
mounting platform. As an
inch rectangular steel bars
joints. These are bolted directly to the
added safety consideration, 1 inch X 3/8
connect opposing bucket housings.
INSTRUMENTATION
To determine accurately the acceleration levels of the centrifugal
models a redundant system of a tachometer and minature accelerometer is
used. Since a 2= ϖ r , a Power Instruments Model 1723 digital tachometer
is used to measure the revolutions per minute (RPM) of the spindle. A
photoelectric pick-off mounted on the spindle provides the input signal
to the tachometer and permits reading the rotational speed to ± 1 RPM.
By knowing the radius to the model centroid from the spindle axis, the
test acceleration can be easily calculated
as; a = (2.84 E - 05)(RPM)2 R where, R is in inches. For redundancy an
Entran model EGA-125F-250D miniature damped accelerometer
47
Gary Albarelli
is mounted on one of the aluminum buckets at a distance of 37.5 inches
from the center of rotation. (Because the center of gravity of the
sample is usually not at the same position of the accelerometer, an
operational effect must be calculated as illustrated in Figure 10). The
applied and output voltages to the accelerometer are conducted through a
32 track Superior Carbon Products, Inc. Model SK-2536-32 slip ring
assembly. Coin silver rings are used in the rotor assembly, while
silver graphite is used in the brush assembly. The excitation voltage
and read-out from the accelerometer is provided by a Doric Series 420
digital voltmeter which reads directly in g units.
When operating the centrifuge at high g levels, the safety of the
operator, other laboratory personnel, and the centrifuge becomes a major
consideration. In previous testing programs, this meant that testing
could be performed only while an operator was present which limited
testing to only eight to twelve hours per working day. Accordingly, an
electronic safety governor was designed and built to monitor the
acceleration voltage of the accelerometer and sense any abnormal
acceleration levels. The safety governor allows a predetermined
acceleration to be selected; and an appropriate deviation "window" of
operation set. In the event the g level rises or falls below the
operation "window", power to the centrifuge is interrupted and also to a
clock for noting the time of interruption. Typically an operation
window of ± 2 g's is used and continuous centrifuge operation of 50+
hours has been safely performed.
48

R 37,s WSn ACmTION = N,,RX N=&( 80 G = 72,6 G
Rs I
WI-GE N = TEST ACCELERATION LML
Figure 10: Calculation of offset acceleration for a 10.5 cm sample
49

TESTING PROCEDURES
The actual centrifugal model testing of the waste clays is a
straightforward, albeit time consuming procedure. Figure 11 presents a
flow chart of the procedures followed for these model tests, which shows
4 major events, e.g., (a) Waste Clay Preparation, (b) Centrifuge
Operation (c) Post-Test Operations and (d) Data Reduction.
Waste Clay Preparation
The Kingsford waste clay was received from IMC in 55-gal drums,
where upon 5 gal subsamples were placed underwater in sealed containers
prior to testing. The subsamples were thoroughly mixed with an 18 inch
auger bit or wire whip powered by a 1/2 in. electric power drill for
approximately 10 minutes prior to testing. An average solids content
was obtained (So = l/(l+w), w = water content) after 24 hours drying in
an 110° C oven. The solids content was adjusted upward or downward by
adding or siphoning off supernatant water, respectively. The material
was then re-mixed and the test solids content verified by a 24 hr. water
content determination.
In the cases of flocculant addition, sand/clay mixes, or capping
models, additional preparation was required. Usually the untreated
waste clay was placed inside the Plexiglas model container, mixed and
weighed to determine the proper height of clay required for the model.
Subsequently the prescribed flocculant dosage or amount of sand was
added to the clay, thoroughly mixed for approximately 1 minute, or if
required a cap was placed. A solids content sample was taken and the
final model height recorded.
50
Gary Albarelli

Waste Clay Preparation
A) Initial Solids Content
B) Special Preparation for Caps or Admixtures
Centrifuge Operation
A) Initial Adjustments/Safety ,
B) Acceleration
C) Photographic Monitoring
Post-Test Operations
A) Final Solids Contents
B) Vane Shear Analysis
C) SCR Profiles
Data Reductions
A) Model Heights
B) Solids Contents
Figure 11 Flow Diagram of Testing Sequence
51
Centrifuge Operation
Initial centrifuge preparati
maintenance of the gears, drive
debris was performed. Calculat
on consisting of preventative
system, and visual inspection for loose
ion of the offset acceleration to the
tachometer and accelerometer readings was determined, preflight
balancing of the arms and adjustment of the over-rotation adjustment
bolt performed. (See Parabolic Liquid Surface). The camera and close-
up lens were prepared. Next, the safety governor was adjusted for the
test acceleration. Subsequent to these pretest preparations, the
Plexiglas containers of waste clay were placed in the aluminum buckets,
and centrifugation initiated.
Photographic monitoring was initiated upon achieving the test
acceleration and continued on a geometric time progression; (i.e.,
1,2,4,8 ...minutes). An example of a photographic record is illustrated
in Figure 12, Photographic recording would continue until two
sequential photos indicated no additional interface movements.
Post-Test Operations
Upon completion of centrifugation, the Plexiglas containers would be
removed and a final solids content determined by over drying a small
sample. In some cases miniaturized vane shear tests were performed to
determine a shear strength profile. For some of the sand/clay mix and
capped models, corings using a 1/4 inch syringe were made to determine
solid content profiles, while sand/clay ratio (SCR) profiles were
determined by washing the cored sections through a No. 200 sieve.
52
Gary Albarelli
Gary Albarelli

Data Reduction
As the waste clay consolidates during a centrifugal model test, an
interface develops between the consolidating clay and supernatant
water. This interface is quite visible in the Polaroid® photographs as
previously illustrated in Figure 12. Accordingly, the average solids
content can be determined as presented in Appendix A;
In the case of a sand/clay mix the average total solids content, which
includes the sand can be determined as also presented in Appendix A:
Equation 3.2 assumes that the clay solids content is the same for both
the cap (if one exists) and the underlying clay or s/c mix. In the
event that the cap and underlying material are different a more general
solution is presented in Appendix B.
In cases of s/c mixes, the average effective clay solids content of
the clay fraction only, can be determined as is also presented in
Appendix B:
53
Gary Albarelli
Gary Albarelli
Gary Albarelli
Gary Albarelli
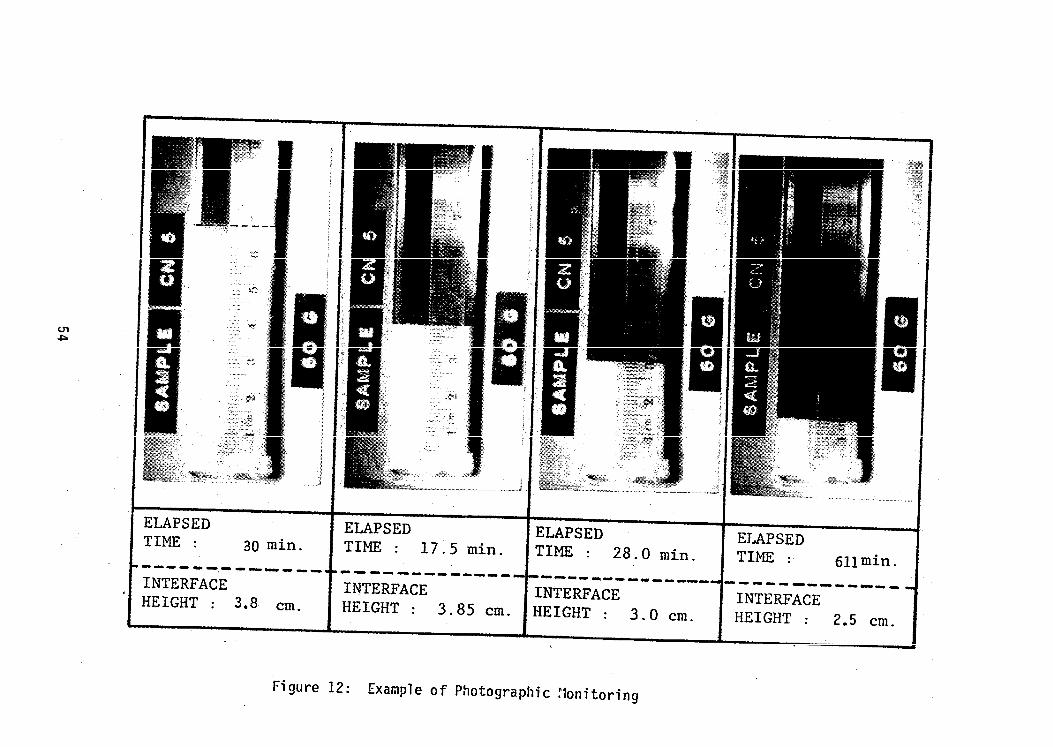

Two waste clays were used for different phases of the research
reported herein. Specifically, the flocculation studies were performed
using Noralyn clay (Bloomquist, 1982), while the sand/clay mix and
capping studies (McClimans, 1984) were performed on Kingsford clay.
Properties of these clays are shown in Table 3.
55


CHAPTER IV: PRESENTATION AND DISCUSSION OF RESULTS
INTRODUCTION
The centrifugal model testing consisted of over 60 tests on
Kingsford Clays (McClimans, 1984, Townsend & Bloomquist, 1983) with the
objectives of evaluating; (a) the time scaling exponent, "modelling of
models", (b) consolidation of sand/clay mixes, and (c) consolidation
of capped and uncapped waste clays. In addition, over 15 test results
on Noralyn clay (Bloomquist, 1982) evaluating the effects of
flocculating agents are reported for completeness in evaluating disposal .
techniques.
TIME SCALING RELATIONSHIP (MODELLING OF MODELS)
The objective of this model series was to confirm the modelling
exponent for scaling times from consolidation centrifugal model tests.
This is often referred to as modelling of models. The time relationship
between prototype and model is expressed in equation form as
t P
= natm
This equation not only relates prototype to model but may also be used
to relate model to model. This is done by performing tests at two (or
vels and comparing model times for equivalent
ights of interface and was the type of analysis
more) acceleration le
solids contents or he
performed during this series.
As previously presented in Chapter II, the time scaling
relationship is a function of the solids content and varies from a = 1
57

for sedimentation to a = 2 for consolidation. Several researchers,
including Mikasa and Takada (1973) and Croce (1982), have demonstrated
the N2 factor for consolidation. However, their initial solids contents
were substantially higher than those found in self weight settlement of
phosphatic clays. Similarily, Davidson and Bloomquist (1980) performed
a modelling of models on dilute (2-5%) Noralyn phosphatic clay slurry
and obtained a time scaling exponent of a=1 for the initial stages of
sedimentation. They also found that sedimentation ends when solids
contents exceed six to ten percent.
Table 4 summarizes the "modelling of models" tests, while Figures
13 and 14 display the solids content vs time relationships for the waste
clays. The series presented in Figure 13 consisted of accelerating
three models, 12, 8, and 6 centimeters high to 40, 60, and 80 g's,
respectively. The initial solids content for all three models was
14.6%. The duration of the tests varied with the longest (40 g's)
requiring 4,200 minutes. All reached approximately 21.3% final average
solids content. By selecting particular solids contents corresponding
elapsed times of each test, the time scaling exponent, CL, was determined
for the various solids contents using the equation (Note: this equation
presumes that a is independent of gravity)
tA(NA) a = tg (NgIa
The resulting exponents are shown in Figure 14. Similarily, Figure 15
presents the results of two models (KC60/6-0 and KC80-6/O) to confirm
the scaling relationship in Figure 14. For these two models the initial
solids content was 16.3 percent and initial model heights were 8, and 6
58


cm, respectively for 60 and 80 g acceleration levels. After 4,200 and
3,100 minutes respectively, both models achieved a final average solids
content of approximately 24 percent.
The results of these model tests confirm that, while the scaling
exponent is 1 for sedimentation and 2 for consolidation, there appears
to be a third state (hindered settlement) in which the exponent assumes
some intermediate value. For Kingsford clay, with solids contents
ranging from 14 to 19 percent, this exponent is approximately 1.6.
However, at approximately 19 percent the exponent rapidly increases to
2.0. By explanation, since only the waste clay interface is monitored
during the centrifugal test, the time exponent represents a composite of
"hindered settlement" plus "consolidation" zones within the model. As
these two zones merge, consolidation predominates and the theoretical
value of 2.0 is achieved. Since much of the consolidation has occurred
prior to merging of these two zones, the value of 2.0 is only achieved
at the final stages of the test. Thus from these considerations, it is
apparent that scaling up the centrifugal models to prototype times is an
incemental procedure and the appropriate time scaling exponent must be
used.
Prototype Tank Test (Model KC80 - 7.9)
While it is extremely rare to encounter prototype events which can
be used to compare centrifugal models, in July 1977, International
Minerals and Chemicals filled a 9 x 14 x 22 foot deep metal container
with Kingsford clay slurry. The initial solids content was 12.6% and
the initial height 20.75 feet. This material was left to self weight
settle for a period of 403 days, achieving a final solids content of
63
Gary Albarelli

21.2 percent. The advantageous aspects of this test in addition to it
being of prototype dimensions were: A) it was single drainage test,
i.e., the water could only flow vertically upward, B) the tank walls
were vertical, and C) the average percent solids was determined using
the volume change of slurry. Obviously, these conditions can be exactly
duplicated in a centrifugal model. Accordingly, model KC80-7.9
consisted of a 7.9 cm high model of Kingsford clay at 12.6% solids and
was accelerated to 80 g's for 2,500 minutes. (Consolidation actually
ceased after 1,470 minutes) Figure 16 presents a comparison between the
IMC tank test and the centrifugal model using a time scaling exponent
equal to 1.6. That is, 1 minute of model time is equivalent to (80)lo6
or 1,109 minutes of prototype time. The agreement is excellent, thereby
validating the "modelling of models" technique of determining scaling
exponents.
Self Weight Consolidation
An examination of all the centrifugal model tests summarized in
Table 4 reveal that the final solids content achievable is slightly
dependent upon the initial solids content and depth of the waste pond.
Typically, for waste ponds between 15.7 and 26.2 ft. deep, a final
solids content of approximately 21 to 24 percent will be achieved.
Using a time scaling exponent of 1.6, approximately 2,000 days (5.3
yrs.) will be required for self-weight consolidation. Thus alternative
reclamation methods become attractive.
SAND CLAY MIX EVALUATION
The objectives of this test series were to (a) evaluate the
benefits of sand/clay mix for reclamation, (b) establish the time
64
Gary Albarelli

Figure 16: Comparison of Centrifuge Model and IMC Tank Test

scaling exponent for sand/clay mixes, (c) evaluate the effect of the
sand:clay ratio (SCR), and (d) determine sand grain size effects (if
any) on consolidation. Accordingly, three SCR (1:1, 3:1, and 6:1) were
modelled centrifugally at 60 and 80 g's using various sand gradations as
summarized in Table 5.
S/C Time Scaling Exponent
Having developed the time scaling exponent for Kingsford waste
clay, two models (KC 60-O/8 and KC 80-O/6) were tested to determine this
scaling exponent for s/c mixtures. Model KC60-O/8 of 8 cm with a 6:1
sand/clay ratio and initial clay solids of 16.3 percent was accelerated
to 60 g's. (Figure 17 presents the grain size distribution curve for
the material used in these tests.) The total duration of this test was
about 500 minutes. The model had a final height of 6.0 cm and an
effective clay solids content of 24.0 percent. Model KC 80-O/6 of 6 cm
with a 6:1 sand/clay ratio and initial clay solids of 16.3 percent was
accelerated to 80 g's. The total duration of this test was about 400
minutes. The model had a final height of 4.5 cm and an effective clay
solids content of 24.3 percent. Figure 18 shows the relationship
between effective clay solids content and elapsed model time.
A modelling of models analysis was performed. A particular solids
content was chosen; the corresponding elapsed model time were noted.
Using the equation
66


68


the exponent x was determined for a range of effective clay solids
contents as presented in Figure 19.
As can be seen, it appears that no unique time relationship between
model and prototype exists for high ratio (6:1) sand/clay mixes. At
this time, we do not understand the phenomenon causing this decrepancy
in scaling exponents, but suspect it is attributable to segregation of
the sand and clay. While the lack of a time scaling exponent does not
jeopordize centrifugal modelling of sand/clay mixes for comparing
reclamation schemes, it does limit our abilities to estimate prototype
times!
SCR Effect
The data presented in Figure 20 illustrates the effect of SCR on
consolidation behavior. Models KC80-O/6 (1:1) and KC80-O/6 (6:1) were
6.0 cm high models of 1:1 and 6:1 SCR using a uniform sand size between
the No. 40 to No. 100 sieves and clay solids content of 16.0%. For
comparison, Model KC80-6/O was a 6.07 cm high model of untreated waste
clay at 16.30%. By accelerating these models to 80 g's, a prototype
pond 15.8 ft. deep was simulated. As shown in Figure 20, the 6:1 mix
settles most rapidly; however, the greatest reduction in height is
obtained for a 1:1 mix. Thus a tradeoff exists between consolidation
rate and final solids content. Obviously, as the SCR increases, the
volume of sand in the mix increases correspondingly at the expense of a
reduction in clay and water volume. If the SCR is high (6:1), the sand
being incompressible quickly achieves its densest packing and interference
between particles prevents further densification of the clay and less
consolidation is achieved than for the untreated waste clay (SCR = 0).
70
Gary Albarelli

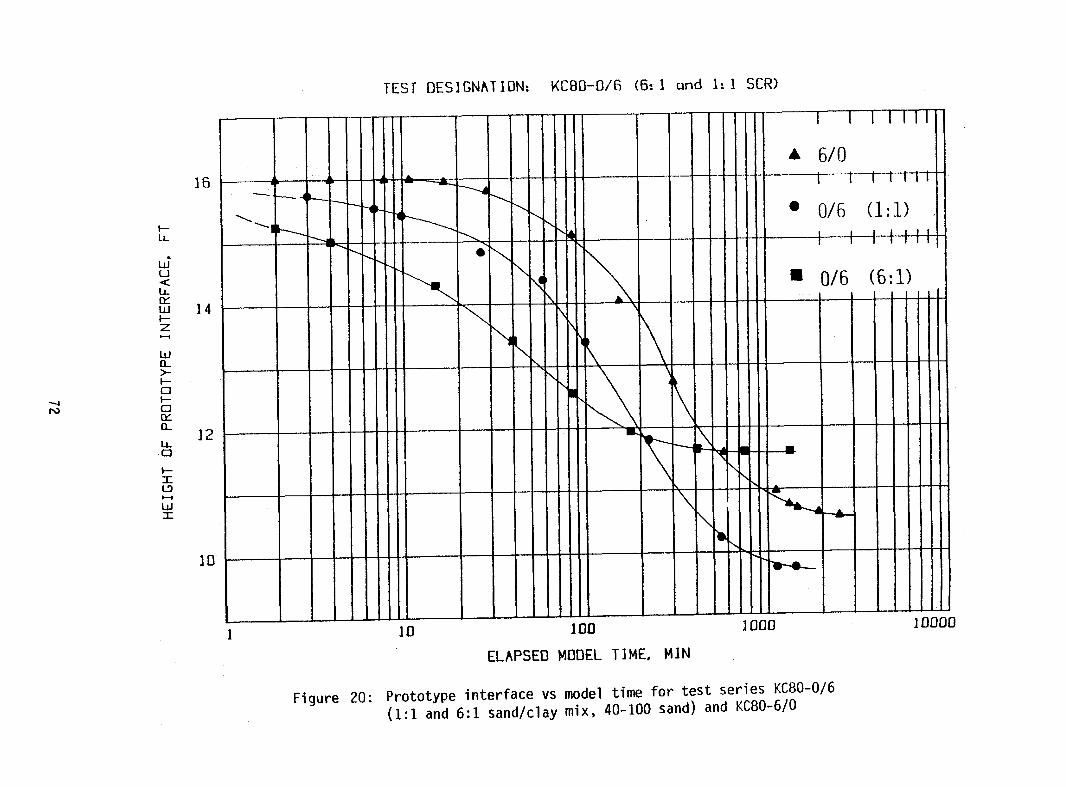

Figure 21 presents the relationship-between SCR and settlement, and
suggests that the optimum SCR is 1:1 or 2:1 and that SCR's greater than
3:1 will produce less consolidation. Closer inspection of Figure 21
reveals that the advantage of using a 1:1 s/c mix compared to virgin
clay results in a modest improvement in height reduction (37.5% vs
33.9%) or final clay solids content (24.9 vs 22.97). This result is
consistent; in that the buoyant unit weight of the 1:1 SCR is 13.05 pcf
(209.1 Kg/m3) compared with 6.96 pcf (111.50 Kg/m3) for the virgin
clay. Accordingly, this higher unit weight produces a higher effective
stress and consequently a high solids content.
Effect of Grain Size
During several of the capping tests (to be discussed later),
entrained sand in the overlying cap tended to segregate and move through
the underlying waste clay towards the bottom of the sample. (The
gradation curve for the sand used during these initial tests can be
found in Figure 17.) This segregation is a possible artifact of
centrifugal modelling and warranted investigation.
The primary advantage of centrifugal modelling is that prototype
stress levels can be modelled in a sample of reduced physical scale.
While acceleration increases the stress levels within a sample, it does
nothing to increase the shear strength of the clay slurry. A typical
waste clay is more than 90 percent water (by volume). When a sand grain
is introduced into the clay slurry and the sample is accelerated, the
weight of the individual grain will increase proportionally. The shear
strength will remain unchanged. While the shear strength of the slurry
may be sufficient to support the sand grain under earth's gravity (1 g),
73
Gary Albarelli

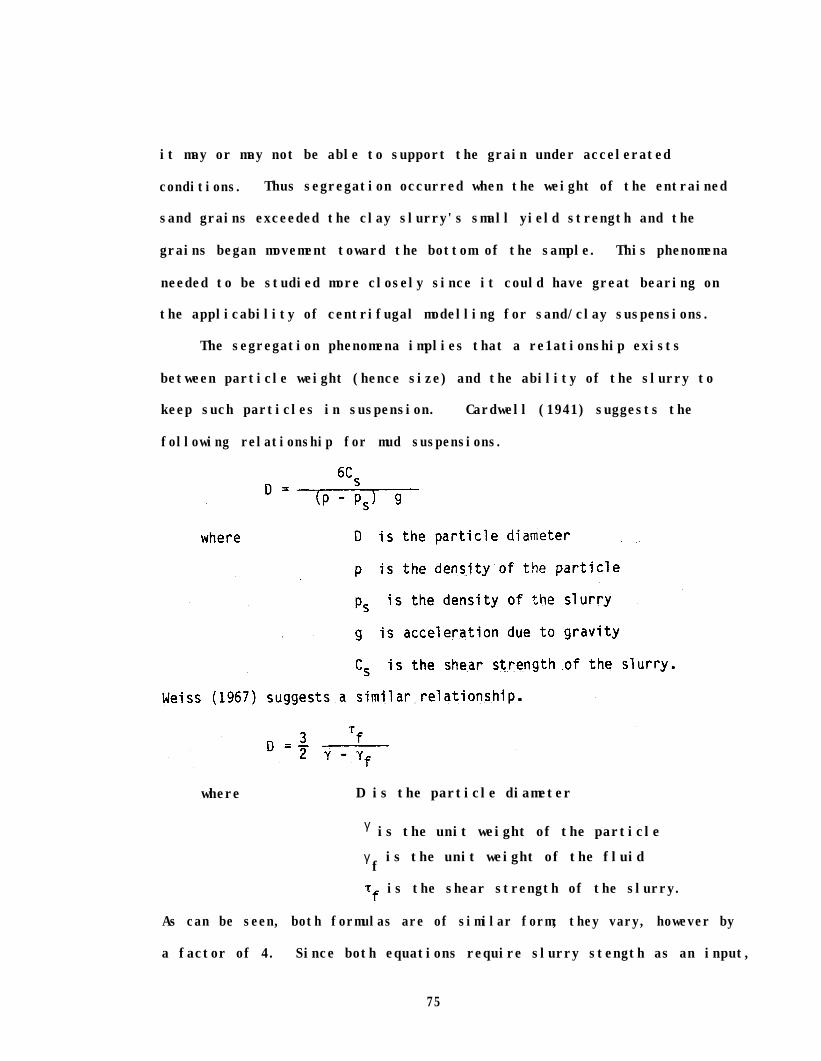
it may or may not be able to support the grain under accelerated
conditions. Thus segregation occurred when the weight of the entrained
sand grains exceeded the clay slurry's small yield strength and the
grains began movement toward the bottom of the sample. This phenomena
needed to be studied more closely since it could have great bearing on
the applicability of centrifugal modelling for sand/clay suspensions.
The segregation phenomena implies that a re1ationship exists
between particle weight (hence size) and the ability of the slurry to
keep such particles in suspension. Cardwell (1941) suggests the
following relationship for mud suspensions.
where D is the particle diameter
γ is the unit weight of the particle
γf is the unit weight of the fluid
-rf is the shear strength of the slurry.
As can be seen, both formulas are of similar form; they vary, however by
a factor of 4. Since both equations require slurry stength as an input,
75

a series of viscosity tests using a co- axial viscometer were
performed. Figure 22 presents these test results in terms of clay
solids content and the Bingham Yield Point (shear strength). From these
results (Figure 22) the relationships between maximum particle size,
solids content, and acceleration level are presented in Figures 23,24,
and 25 for both the Weiss and Cardwell equations. These results
indicate that the maximum particle size able to remain in suspension for
a slurry with a clay solids of 16 percent accelerated to 80 g is 0.004
mm (Cardwell) or 0.001 mm (Weiss). This implies that it is not possible
for particles larger than silt size (0.002 to 0.06 mm) to remain in
suspension when such a slurry is accelerated to 80 g.
To evaluate this hypothesis, a series of seven tests KC80-O/6 (1:1)
and KC80-O/6 (6:1) were performed; these tests also analyzed the effect
of sand/clay ratios on consolidation characteristics (discussed
earlier). Figures 26 and 27 present results for these 1:1 and 6:1
sand/clay mixes. Four different mix materials were tested: (1) sand
passing the No. 20 sieve (0.84 mm) but retained on the No. 40 sieve
(0.42 mm); (2) 40 to 100 (0.42 to 0.147 mm); (3) 100 to 200 (0.147 to
0.074 mm); (4) that material passing the No. 200 sieve (<0.074 mm).
Results for the 1:1 s/c mix tests indicate that grain size has a
small, but measureable effect on the final height of interface. After
analyzing the final results, however, it is difficult to say whether a
distinct relationship exists between reduction in interface height and
grain size. Interface height was reduced most by the 40 to 100 mix,
followed by the 100 to 200, 200 minus, and 20 to 40 mixes. While grain
size for each mix is different, the total weight of sand per unit volume
76


79


is equal. Therefore, the number of grains per unit volume must also be
different. The 20 to 40 mix would have the fewest grains per volume
while the 200 minus mix would have the most. These test results may
suggest that a variable relationship exists between grain size and
reduction in interface height. If sand grains are too large, there are
too few per unit volume to effect any major reduction in interface
height. If grain size is too small, interstitial water forces may
predominate; this, too, would prevent significant reductions in
interface height. The 1:1 mix test results suggest that the optimum
range of grain size falls between the No. 40 and No. 100 sieves.
Results of the 6:1 s/c mix tests suggest that grain size has a
different effect at high/sand clay ratios. Interface height was reduced
most by the 20 to 40 mix, followed by the 40 to 100 and 100 to 200
mixes. This implies that greater reductions in interface height may be
achieved by increasing grain size. These results would appear to
contradict the conclusions drawn from the 1:1 mix tests. It must be
remembered, however, that the volume of sand (per unit volume) is now
six times greater than the volume of clay. The volume of water has been
reduced by almost 25 percent. The sand is now beginning to dominate the
mix volume. With the 1:1 s/c mix, there were too few 20 to 40 sand
grains to effect much height reduction. With a 6:1 s/c mix, however,
there are now a sufficient number of grains in this size range to
achieve large reductions in interface height.
Upon completion of the centrifugal testing, each test was cored and
sectioned. After oven-drying and the calculation of total solids
contents, each sectioned sample was washed and the retained sand dried
83

and weighed. A vertical profile of sand/clay ratios could now be
developed. This information was necessary to test the applicability of
the equations suggested by Cardwell and Weiss and the shear strength
data provided in Figure 22. If earlier predictions were correct,
sand/clay ratios should increase with depth. This would imply that
shear strength was insufficient and that sand grains could no longer be
held in suspension.
Figures 28 and 29 present final sand/clay ratios versus depth for
both the 1:1 and 6:1 s/c mixes. For the finest sand fraction, some sand
was obviously lost (e.g. SCR < 1:1 or 6:1) due to the difficulty of wet
sieve analyses of fine sands. Nevertheless these results indicate that
the sand/clay ratio remains relatively constant with depth, which tends
to disprove the maximum grain size predictions made earlier. These
results indicate that segregation under accelerated conditions is not a
severe problem for homogeneous sand/clay mixes and confirm the
applicability of centrifugal modelling techniques. However, they shed
little light on the segregation problems associated with capped tests.
These problems will be more fully discussed in the next section.
CONSOLIDATION ENHANCEMENT BY CAPPING WITH SAND
As an alternative to using a s/c mix to increase the unit weight
and corresponding effective stresses to enhance consolidation, this test
series examined the effects of placing sand as a cap instead of
entrained as a mix. For perspective, a 1:1 s/c mix of a 10 ft. (3.05 m)
deep pond of 16% clay solids will contain sufficient sand for a 1 ft.
(0.32 m) cap of sand at 100 pcf (1602-kg/m3). Table 6 summarizes the
results of these sand capped models.
84


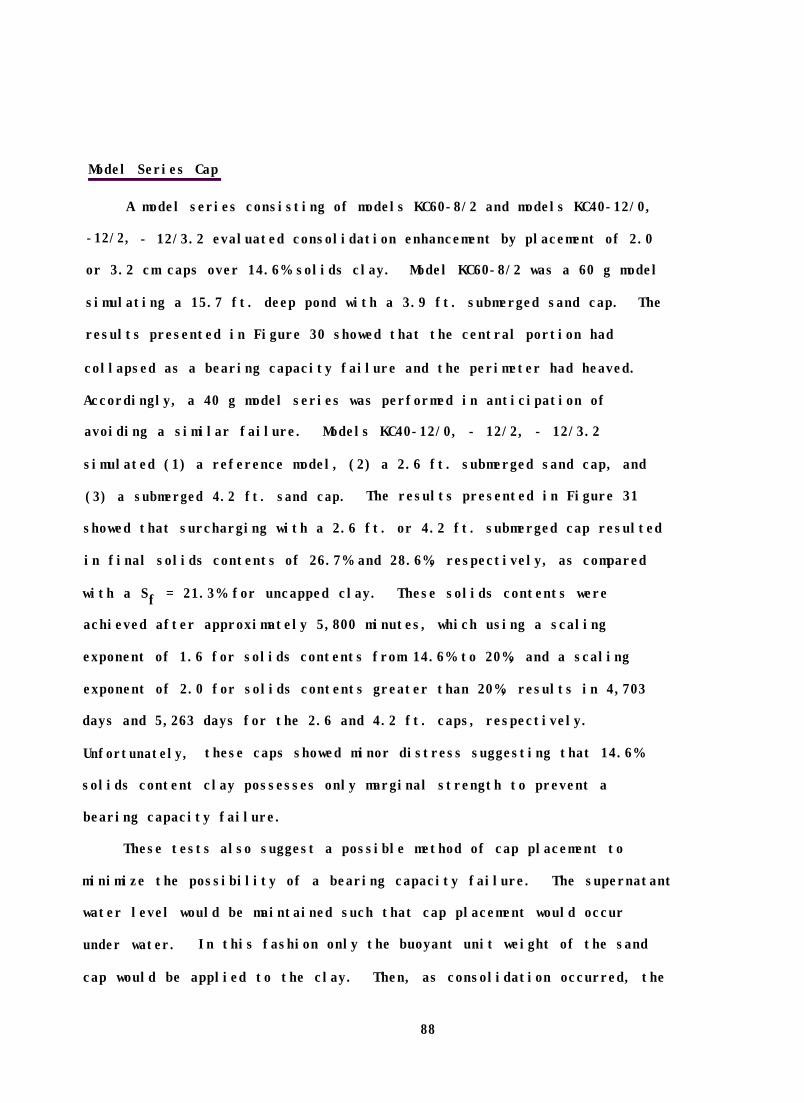
Model Series Cap
A model series consisting of models KC60-8/2 and models KC40-12/0,
-12/2, - 12/3.2 evaluated consolidation enhancement by placement of 2.0
or 3.2 cm caps over 14.6% solids clay. Model KC60-8/2 was a 60 g model
simulating a 15.7 ft. deep pond with a 3.9 ft. submerged sand cap. The
results presented in Figure 30 showed that the central portion had
collapsed as a bearing capacity failure and the perimeter had heaved.
Accordingly, a 40 g model series was performed in anticipation of
avoiding a similar failure. Models KC40-12/0, - 12/2, - 12/3.2
simulated (1) a reference model, (2) a 2.6 ft. submerged sand cap, and
(3) a submerged 4.2 ft. sand cap. The results presented in Figure 31
showed that surcharging with a 2.6 ft. or 4.2 ft. submerged cap resulted
in final solids contents of 26.7% and 28.6%, respectively, as compared
with a Sf = 21.3% for uncapped clay. These solids contents were
achieved after approximately 5,800 minutes, which using a scaling
exponent of 1.6 for solids contents from 14.6% to 20%, and a scaling
exponent of 2.0 for solids contents greater than 20%, results in 4,703
days and 5,263 days for the 2.6 and 4.2 ft. caps, respectively.
Unfortunately, these caps showed minor distress suggesting that 14.6%
solids content clay possesses only marginal strength to prevent a
bearing capacity failure.
These tests also suggest a possible method of cap placement to
minimize the possibility of a bearing capacity failure. The supernatant
water level would be maintained such that cap placement would occur
under water. In this fashion only the buoyant unit weight of the sand
cap would be applied to the clay. Then, as consolidation occurred, the
88
Gary Albarelli


water level could be slowly lowered, through a weir, progressively
increasing the effective surcharge on the clay.
Model Series Stage Sand Capping
Because of the observed failure when caps were placed on 14.6%
clays and success when caps were placed on approximately 20% clays,
this model series, consisting of adding sand caps in stages as the clay
achieved higher solids contents, was performed. This model series
consisted of models KC60-8/0, KC60-3.1/2.1, KC80-10/0, KC40-12/0, and
KC60-7/6.
Model KC60-8/0 consisted of accelerating at 60g's an 8 cm deep
model of clay solids at 14.6% for 2,700 minutes until a final solids of
21.1% was achieved. This model simulates self-weight consolidation of a
15.7 ft. deep waste clay pond until equilibrum was achieved after 1,312
days. Subsequently, a 1.3 cm cap was placed over the 21.1% clay and
reaccelerated to 60 g's for 1,300 minutes until a final solids content
of 26.5% was obtained. The second phase of this model simulates
placement of 2.6 ft. thick submerged sand cap over a 7.7 ft. deep waste
clay pond for 3,250 days.
Model KC60-3.1/2.1 is practially identical to the second phase of
model SSC-60-1, except that a 2.1 cm cap was placed over the 21.1%
solids for 1,310 minutes until a final solids content of 28.5% was
achieved under 60 g's. This model simulates placement of a 4.1 ft.
thick sand cap over a 6.1 ft. deep waste pond of 21.1% solids for 3,275
days achieving a 28.6 final solids content. These results are presented
in Figure 32.
Model KC80-10/0 consisted of accelerating at 80 g's a 10 cm deep
clay model of 14.6% clay solids for 2,460 minutes until self weight
91
Gary Albarelli


equilibrum of 24% solids was achieved. This condition simulated a 26.2
ft. deep waste clay pond which after 1,895 days achieves a self weight
solids content of 24%. At this time a 2 cm cap was placed on the clay
and reaccelerated to 80 g's for an additional 1,350 minutes until a
solids content of 30.4% was achieved. This condition simulated a 5.2
ft. cap placed on a 14.9 ft. deep pond of 24% solids for 6,000 days
achieving a solids content of 30.4%. Lastly, an additional 2 cm sand
cap creating a total of 4 cm cap was placed on the model and
reaccelerated to 80 g's for an additional 2,940 minutes which resulted
in a final solids content of 40.0%. This last phase simulates placement
of an additional 5.2 ft. cap over a 11.2 ft deep waste pond of 30.4%
waste clays. After 13,067 days a final solids content of 40% is
achieved. The results are presented in Figures 33A and 33B.
Model KC40-12/0 consisted of accelerating a 12 cm deep clay slurry
at 14.6% solids to 40 g's for 5,500 minutes achieving a final self-
weight consolidation solids content of 21.3% solids. Subsequently a 2
cm sand cap was placed over the 21.3% solids and the test continued at
40 g's for additional 3,000 minutes achieving a 26.7% final solids
content. This model replicates a 15.7 ft. deep waste pond which after
1,397 days consolidates to 21.3% solids. At this point a 2.6 ft.
submerged cap is placed on the clay and consolidation continues for
3,333 days until 26.7% solids is achieved.
Model KC60-7/6 involved placing a 6 cm cap over 7 cm of 23.8%
solids clay and accelerating to 60 g's for 2,350 minutes until a final
solids content of 37.0% is achieved. This model replicated placement of
an 11.8 ft. cap over an 18.4 ft. deep pond for 5,875 days until 37.0%
solids is achieved.
94

Sand Capping Summary
These results demonstrate that surcharging waste ponds by placement
of a sand cap greatly enhances consolidation and the final achieved
solids contents. Using the technique of stage capping; i.e.,
intermittently adding sand layers and thereby gradually increasing the
cap thickness, solids contents up to about 40%
KC80-10/0, KC60-7/6). Obviously, cap enhanced
method for achieving high solids contents.
were achieved (models
consolidation is a viable
Fortunately, the fear that a sand cap would
clogged and thus rendered useless by the waste
become immediately
clays forming an
impermeable barrier at the cap-clay interface was alleviated by these
model tests. In all cases, the water easily flowed from the clays
through the cap. Generally the water level would rise to approximately
5 ft, (prototype) above the clay interface; thus the thinner caps became
submerged, while the thicker caps were partially saturated. The
submergence of the thin caps decreased the effective stress by passing
from moist unit weights (107pcf) to a buoyant unit weight (44.6pcf).
While this submergence decreases the stress causing consolidation of the
underlying clay, it had the advantage of perhaps avoiding a bearing
capacity failure until the clays consolidated sufficiently to reach
supporting strengths. Thus a possible capping scenario would be to
place the sand caps in a submerged condition and controlling the capping
stress increase by draining the surface water, such that any bearing
capacity failure of the cap could be avoided.
An estimation of the data unfortunately reveals that times
achieve high solids contents by capping are rather lengthy; e.g., KC60-
7/6 required 5,875 days (16 years) to consolidate from 23.8% solids to
95

37.0% solids. Obviously as the solids content increases, the
permeability of the soil must decrease, thereby increasing the
consolidation times.
Maximum Cap Height vs Solid Content
An obvious drawback to capping is the careful consideration
required to place the maximum cap height possible without creating a
bearing capacity failure. Accordingly in addition to the sand capping
tests listed in Table 7, a series of tests was performed in which a 1.5
cm cap was placed over Kingsford Clay at 17.7% solids content and
accelerated in stages to 100 g's to observe at what acceleration level
surface distress of the clay surface was observed. These, plus tests
from Table 6 are presented in Table 7. Failure was usually observed as
an irregular shaped surface resulting where the center of the cap
migrated into the underlying soft clays. Because of the proximity of
the container walls, full failures with heaved clays was not observed
and the possibility exists that for thick caps, 3 cms+, the cap behaved
as a plug and failure could not occur due to restraint by the container
walls. Model test Spin-100 was designed to investigate specifically
bearing failure and consisted of a 1.5 cm cap accelerated in stages to
100 g's. The cap did not become submerged and a center depression and
irregular surface was observed. The calculated effective stress acting
at the clay surface was based upon buoyant (44.6pcf) or moist (107pcf)
unit weights. In some thicker models the phreatic surface was within
the sand cap, usually about 4 ft, (prototype) above the interface.
Figure 34 presents estimated dividing boundry between safe and
unfailed caps. Although the data is sparse and limited by container
side effects, it is felt that the boundry is a pseudo representation of
96
Gary Albarelli
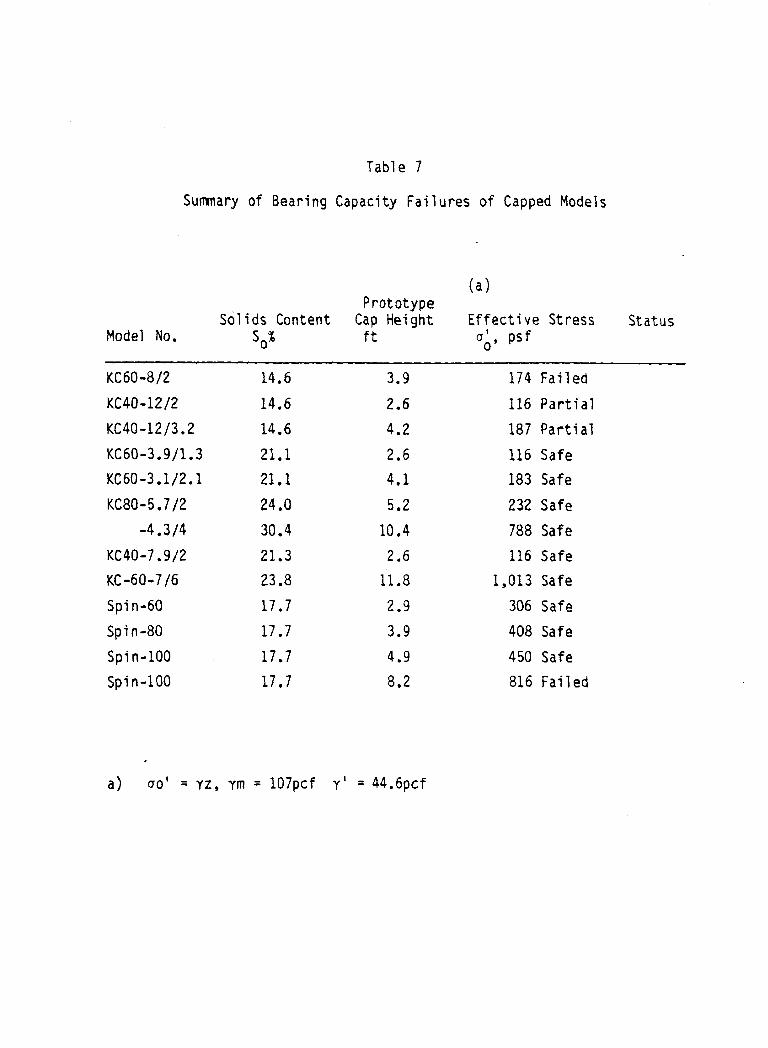
Table 7
Summary of Bearing Capacity Failures of Capped Models
(4 Prototype
Solids Content Cap Height Effective Stress Status Model No.
so% ft u1 o' Psf
KC60-8/Z 14.6
KC40-12/2 14.6
KC40-12/3.2 14.6
KC60-3.911.3 21.1
KC60-3.1/2,1 21.1
KC80-5.7/2 24.0
-4.3/4 30.4
KC40-7.9/2 21.3
KC-6007/6 23.8
Spin-60 17.7
Spin-80 17.7
Spin-100 17.7
Spin-100 17.7
,
a> uo' = Yz, Ym = 107pcf
3.9 174 Failed
2.6 116 Partial
4.2 187 Partial
2.6 116 Safe
4.1 183 Safe
5.2 232 Safe
10.4 788 Safe
2.6 116 Safe
11.8 1,013 Safe
2.9 306 Safe
3.9 408 Safe
4.9 450 Safe
8.2 816 Failed
Y’ = 44.6pcf
97


anticipated field performance. unfortunately application of this data
suggests at 21% solids (the end of self weight consolidation) an 8 ft.
sand cap unsubmerged could be placed without failure, which appears
somewhat high. We would welcome additional research in this area.
CONSOLIDATION ENHANCEMENT BY CAPPING WITH SAND/CLAY MIX
While the results presented in Table 6 reveal that solids contents
approaching 40% are possible by capping the pond with sand, sand/clay
mixes which could be pumped directly onto the clay ponds offers an
alternative capping material. This method of s/c mix caps not only
reduces the possibility of a bearing capacity failure during cap
placement, but also reduces the expense of cap placement. However
foreseeable draw-backs of this technique include: (a) to achieve the
same effective stress as a sand cap, a larger volume of s/c mix must be
placed, and (b) the permeability of the s/c mix is less than that for a
sand cap thus impeding drainage and lengthening consolidation times.
Accordingly this test series of s/c mix caps was undertaken, with
results summarized in Table 8.
Figure 35 provides a comparison between three tests with initial
model heights of 10.5 cm and solids contents of 16.3 percent, which were
accelerated to 80 g's. Two cap tests, KC80-6/4.5 (3:1) and -6/4.5 (6:1)
consisted of 4.5 cm caps of 3:l and 6:l s/c mix using 40-100 sand and
16.3% clay placed over 6.0 cm of waste clay. These are compared to a
10.5 cm homogeneous clay model KC80-10.5/0 (Table 4). Final results
indicate that capping provides no benefit in the reduction of interface
height. Indeed, as the unit weight of the cap increases, total
settlement decreases!
99


After completion of the centrifugal testing, the sand/clay samples
were cored and the final sand/clay ratio profiles are shown in Figure
36. As can be seen, the sand/clay ratios increase rapidly at about mid-
depth, which is indicative of the segregation phenomena. The entrained
sand has migrated through the capping layer and underlying waste clay
towards the bottom of the sample.
This information helps explain the results presented in Figure
36. Intuitively, one would expect a sample with a 6.1 sand/clay cap to
settle more than one with a 3:1 sand/clay cap or a homogeneous clay
sample. However, as the sand migrates through the sample, the initial
sample profile is in effect inverted. The sand is now at the bottom,
while the clay has been dispaced to the top of the sample. The
following section examines this segregation behavior.
S/C Mix vs S/C Cap Segregation Behavior
Figure 37 presents the results of centrifugal tests
[KC80-0/10.5(3:1 & 6:1) {Table -5}, and KC80-10.5/O{Table 4}] performed
on 3:1 and 6:1 (10.5 cm) sand/clay mixes (40-100). Figure 38 presents
the final sand/clay ratios versus depth for both samples. As can be
seen in Figure 38 no appreciable segregation was observed in these
homogeneous s/c mix models as the s/c ratios remained 3:1 and 6:1.
Conversely, the profiles presented in Figure 36 showed appreciable
segregation occurred for the s/c caps.
When a homogeneous sand/clay mix is accelerated, it is theorized
that individual sand grains are supported by underlying grains which, in
turn, are supported by the container bottom. The grains, in effect,
"stand" on lower grains. This action prevents appreciable migration.
Conversely, if a sand/clay cap at an equivalent sand/clay ratio is
102
Gary Albarelli

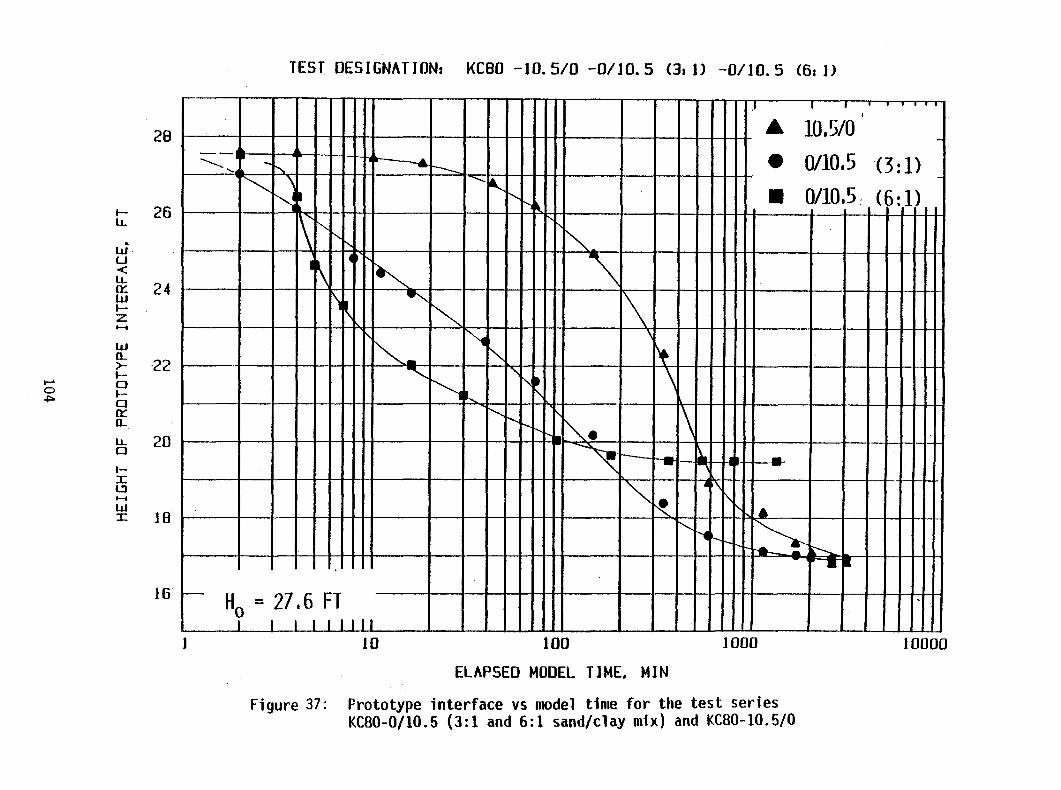


tested in a similar manner, the behavior is quite different. The grains
in the sand/clay cap are ultimately supported by the underlying soft
clay. If the shear strength of the clay is unable to support the
combined weight of the grains, the sand begins to move toward the bottom
of the sample and segregation occurs.
Segregation Phenomena
In an attempt to minimize segregation of the sand from the s/c mix
cap passing through the underlying clay, a capping test
[KC80-6/4.5 (6:1)] was performed on 6.0 cm of clay of 25.1 percent
solids. A 4.5 cm, 6:1 sand/clay (16.3 percent initial clay solids) was
used (see Figure 17 for the grain size distribution of the sand used).
Results are presented in Figure 39. Upon completion of the centrifugal
testing, the sample was cored and the sand/clay ratio profile was
plotted, and the results presented in Figure 40. Again, the sand/clay
ratio begins to increase rapidly at about mid-depth. The higher clay
solids content did not prevent segregation.
A second test [KC80-6.6/4 (6:1)] was performed in another attempt
to examine segregation. A 10.5 cm, 16.0 percent clay solids sample was
accelerated until self-weight consolidation was completed. A 6.6 cm,
24.0 percent clay solids sample resulted. This sample was capped with a
4.0 cm, 6:1 sand/clay cap (16.0% initial clay solids, 40-100 sand). The
sample was then reaccelerated to 80 g's and these results are also
presented in Figure 39.
letion of the centrifugal testing, the sample was cored
lay ratio profile was plotted in Figure 40. Unlike the
Upon comp
and the sand/c
previous test, this profile indicates high sand/clay ratios until
107
Gary Albarelli


approximately mid-depth. These values then rapidly decrease.
Segregation had not occurred!
Upon analyzing the initial conditions of these two tests, both
appear very similar; however, there is one important difference. In the
first test, the underlying clay (25.0% solids) was thoroughly mixed
before being placed in the container and capped. In the second test,
the underlying clay was capped after achieving self-weight consolidation
(24.0% solids); it was never remixed. Although the initital average
solids contents are very similar, only the undisturbed clay has
sufficient strength to support a cap. Remixing or remolding the clay
reduces this strength to the point where it is unable to support a cap
and segregati on then results as was observed during the first test.
Capping with Limited Segregation
Once the relationship between clay shear strength and segregation
was better understood, a series of sand/clay capping tests were
performed in which the segregation of sand was limited or controlled.
These tests were performed in a similar manner to test KC80-6.6/4.0
where no mixing of the clay was performed prior to capping and in which
the segregtion of sand was limited.
Three models of approximately 10.2 cm in height and 20.5
clay solids were accelerated at 80 g until self-weight consolidation was
percent
completed. This resulted in samples with an approximate final height of
7.5 cm and 26.6 percent clay solids [KC80-7.5/4 (1:1), (8:1), & (6:1)].
Each model was then capped with a 4.0 cm sand/clay cap of either 1:1,
3:1, or 6:1 sand/clay ratio. Actual phosphate sand tailings were used
(see Figure 41 for grain size distribution). The initial clay solids
109
Gary Albarelli


content for these caps was 12.7 percent. Each model was then
accelerated at 80 g's until interface movement had stabilized. The
models were then staged capped by placing an additional 2.0 cm sand/clay
cap of the same sand/clay ratio as the initial cap. The models were
then accelerated at 80 g's until interface movement had again
stabilized. Figure 42 presents the results of the 4.0 cm capping test
and Figure 43 presents the results of the additional staged 2.0 capping
tests.
Although the initial model height of the KC80-7.5/4.0 tests were
slightly different, the prototype interface/model time curves generally
parallel one another. Considering the small differences in initial
height, there is little difference in the final heights of the models.
The results of the KC80-7.5/4.0 + 2.0 capping tests indicate similar
results. The curves generally parallel one another and the differences
in final height can largely be attributed to differences in initial
height.
These test results summarized in Table 9 indicate that reduction in
interface height is relatively independent of the sand/clay ratio of the
overlying cap. As the sand/clay ratio increases, the unit weight of the
capping material increases and the surcharge on the underlying clay also
increases. This increase aids in the compression of the underlying cap
and therefore serves to increase its solids content. For example in
Table 9, a 18.4% increase in solids content occurred for the 1:1 s/c
mix, while a 32.3% increase occurred for the 6:1 s/c mix. This increase
in solids content, however, does not translate into a considerable
reduction in interface height when compared to Tower sand/clay ratio
111


capping tests. As the sand/clay ratio increases, the volume of
relatively incompressible sand also increases, which tends to negate any
reduction in interface height due to compression of the underlying clay.
After completion of the centrifugal tests, each sample was cored.
The profiles of effective clay and total solids content are presented in
Figure 44. The final sand/clay ratio profile is presented in Figure
45. While higher sand/clay ratio caps may not provide any real
reduction in interface height, they do increase the average solids
content of the underlying clay. The 6:1, 3:1, and 1:1 sand/clay caps
produced average clay solids contents in the underlying layer of 35.2,
32.2, and 31.5 percent, respectively. For reference, the initial clay
solids content of this layer (due to self-weight
capping was 26.6 percent.
Migration of the sand into the underlying clay was not a severe
problem. The initial clay solids content of the sand/clay caps (12.7%)
was insufficient to keep the sand in suspension, however. This is
consolidation) prior to
indicated by fluctuating sand/clay ratios down to approximately mid-
depth. A sand/clay ratio in excess of 19 was observed approximately 4
cm below the surface of the 6:1 sand/clay capping test. This is a
striking example of the segregation problems associated with low clay
solids sand/clay mixes under accelerated conditions.
Staged Capping with S/C Mix Caps
A comparison was made between the 4 cm 3:1 sand/clay capping
test [KC80-7.5/4 (3:1)] and a staged 2 cm plus 2 cm 3:1 capping test
[KC80-7.5/2+2 (3:1)]. A 7.5 cm, 26.6 percent clay solids sample was
capped with a 2.0 cm 3:l sand/clay cap (12.7% initial clay solids) and
115
Gary Albarelli


accelerated at 80 g's until interface movement had stabilized. It was
then capped with another 2.0 cm 3:1 sand/clay cap and again accelerated
the results of both the 4 cm and 2 cm plus 2 cm capping tests. For the 4
cm cap model, the height reduction was 22.1%, while for the staged 2 cm
plus 2 cm cap had a height reduction of 28.1%[17.9 + 10.2]. Thus,
greater reductions in interface height can be achieved when a staged
capping procedure is used. The total volume of capping material used
during each test was equal. However, the staged application of the 3:1
mix resulted in a final interface height approximately one foot lower
than that obtained with a single application. The obvious disadvantage
of the staged application is that it took approximately twice as long as
a single application of equivalent capping material.
Comparison of S/C Mix vs Capping
An examination of the centrifugal model data for s/c mix and capped
ponds presented in Tables 4, 5, 6 and 8 and summarized below, reveal the
hierarchy of consolidation magnitude as: (a) sand caps (staged),
(b) s/c mix cap (staged), (c) homogeneous s/c mix (1:1), and lastly (d)
treated waste clays.
Summary of Treatment Effects
118
at 80 g's until interface movement had stabilized. Figure 46 presents
Gary Albarelli


Considering that consolidation magnitudes are governed by the magnitude
of effective stress change, the purpose of a s/c mix is to increase the
unit weight and thereby the effective stress. Similarily, a cap
increases the effective stress by placing a surcharge on the underlying
clays. Accordingly, this section examines and compares the effective
stresses and consolidation enhancement induced by s/c mix or capping.
For these comparisons an illustrative example is posed.
Specifically, consider a waste pond 10 ft. deep for which the following
options for disposal are available
Case A: Fill the pond with untreated clay, So = 16%
Case B: Fill the pond with 2:1 s/c mix, SC = 16%
Case C: Instead of mixing sand to form a s/c mix as in
Case B, use the sand to form a cap with γs = 100 pcf. The amount of
sand in both Case B and C is equal.
Case D: Same as Case C, but the sand cap becomes
submerged causing the effective stress to be reduced due to buoyancy
effects on the cap, i.e., Y; = (100-62.4) = 37.6 pcf.
Case E: Using the same amound of sand, create a 3:1 s/c
mix as a cap over the underlying clay, as an alternative method for
capping with sand only.
These cases assume an unlimited supply of waste clays for filling the
pond; however, the sand used in the s/c mixes and caps is equal for al
appropriate cases. Appendix C provides the supporting calulations for
these comparisons.
Effective Stress Profile. Since the effective stress, 0: = af
(where γ' = buoyant unit weight, and z = depth), the Equations C-1 and
120
Gary Albarelli
Gary Albarelli

C-Z are the buoyant unit weights respectively for untreated clay and s/c
mix
untreated clay y' = Sv,(G-1)
S(l-G) + G (Eqn. C-l)
and s/c mix where G (clay) = G (sand)
y' = h,(SCR) (G-1)
G(l-S) + (l+SCR) (Eqn. C-2)
For example, considering a SCR = 2:1, G = 2.65, and S = 16%, the y
values for untreated clay and s/c mix are:
untreated clay Y' = (0.16)(62.4)(2.65-l) = 6.90 pcf Jo.l670
s/c mix Y' = (;.,16)(62.4)(2+1)(2.65.-1) = 18.3 pcf . 65(1-.16) + 0.16 (lt2)
Thus 265% increase in y' is achieved by a 2:l s/c mix.
Having determined the buoyant unit weights for untreated clay and
s/c mix, we now need to calculate cap height for cases C, D, and E. If
we now consider that the height of a sand cap that can be achieved by
using an equal amount of sand as a s/c mix is equal to the weight of
sand (W,) 5 ys ; then per unit depth of pond
W (Sand in s/c mix) = S yw G (SCR) S G(l-S) + S (l+SCR)
(Eqn. C-3)
and H,(Ht of cap) = Ws/ys where ys = unit wt. of cap (Eqn. C-4)
For example, placing the sand present in a 10 ft. deep pond filled with
a 2:l s/c mix as a cap with a ys = 100 pcf results in a 1.95 ft. cap
creating a surcharge (8) of 195 dsf as shown below:
121

For a cap composed of a s/c mix (Case E) the W, of sand available in for
the cap was given by Equation C-3, and the height/unit depth of pond for
the s/c mix cap (H,c) is given as Equation C-4
HSC = W,[G(l-S) + S(l+SCRC]/SGy,
where SCRC = sand/clay ratio of the cap
From these equations the effective stress profile as presented in
Table 10 can be calculated for Cases A through E. Likewise Figure 47
presents these profiles. An examination of the effective stress
profiles presented in Figure 47 reveals that sand capping (Case C)
provides the greatest effective stress and hence the greatest
consolidation. However, the effective stress profiles of the s/c mix
(Case B) compared with those of submerged sand caps (Case D) or s/c mix
caps (Case E) are mixed and no clear distinction of which provides the
greatest effective stress can be made.
Consolidation Magnitude. Since the magnitude of consolidation is
the desired result, by assuming the constitutive relationship for
effective stress-void ratio can be expressed as e = A: -B (Somogyi,
1979), then result in the consolidation magnitude (McVay, 1984) as shown
below: (also Appendix C).
122
Gary Albarelli

Table 10
Effective Stress Profiles for S/C Mix vs Capped 10 Ft. Waste Pond
y' clay
Case Pcf
A 6.90
6 18.26 C 6.90 D 6.90
E 6.90
CM*
ui
id
ion
Effective Stress, (J' (psf) @ Depths, z (Ft)
Y’ cap D clay
PC f w
10.0
10.0
100 8.04 37.6 8.04
22.99 2.94
l-i cap
ft o % 5'
0 0 0 34.5 0 0 0 91.3
1.96 0 196 21.7 1.96 0 73.7 94.7
7.06 0 162.3 114.9
EFFECTIVE STRESS PROFILES
10'
69.0
182.6
251.5
129.2
182.6
Figure 47 Comparison of Effective Stress Profiles for S/C Mix vs Capped 10 Ft Deep Waste Pond
123

In the case of homogeneous c?ays or s/c mix
Or AH = / Hf H $- dz
0
If Ae = eo-ef and ef = AZ", the de = e 0
- AyWB
Since 5 = Y'z, then Ae = e o- A(r'z) -'
-8
Finally, AH = 1 Hf
e-A(v'z) dz = 1 J Hf -6 ,,
i lteo I+e, Hi eo-A(&) dz
where Hi = top of pond depth corresponding to stress at e. and Hf = Hi t
depth of clay, Dc, in the pond
Integrating, AH = 1
-4 'oZ -
De,
l Leo (Hf- HiI
l+e,
Ay,l-62(1-8)H f
In the case of a capped pond, we can treat the cap as a surcharge and
ij= q + Y&, where q = Y' cap 'cap and Y$ zc are the buoyant unit
weight and depth of clay respectively.
de = e 6A(q+Ytz)-B and AH = 1 fzc e Then C
o- A(q+v'z)-' dz
l+eoZ i
where zi = surface elevation of clay beneath cap
and zc = zi + depth of clay in pond.
124
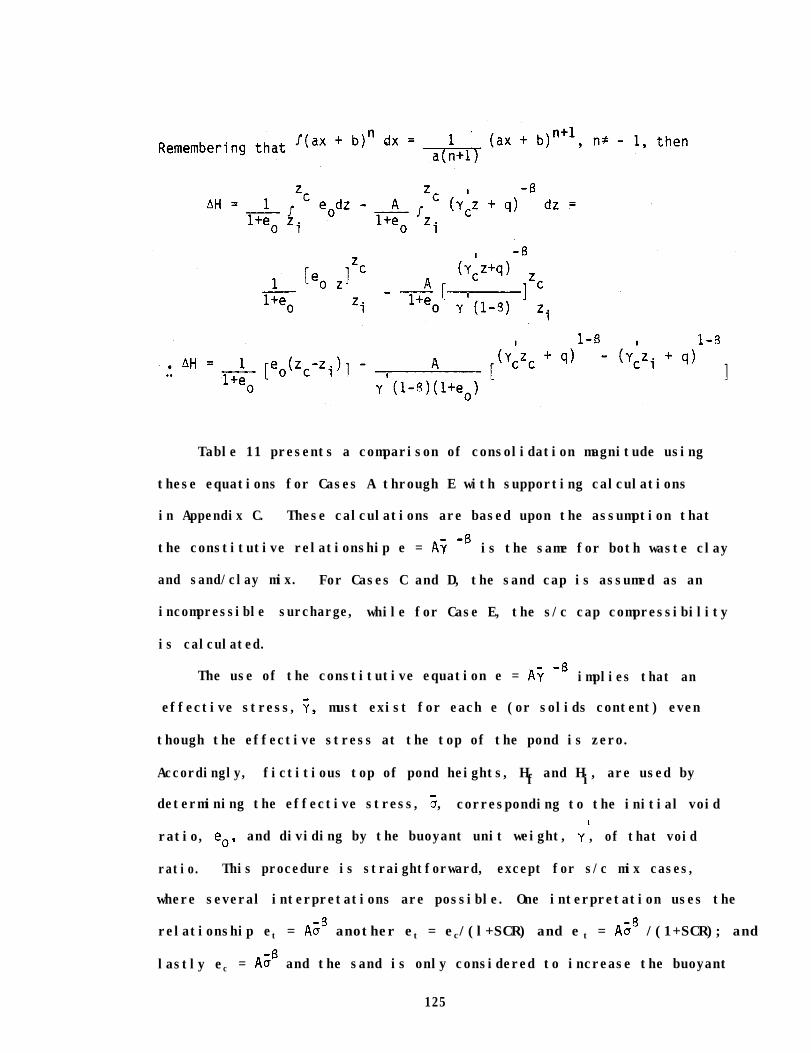
Table 11 presents a comparison of consolidation magnitude using
these equations for Cases A through E with supporting calculations
in Appendix C. These calculations are based upon the assumption that
the constitutive relationship e = A? -8is the same for both waste clay
and sand/clay mix. For Cases C and D, the sand cap is assumed as an
incompressible surcharge, while for Case E, the s/c cap compressibility
is calculated.
The use of the constitutive equation e = A? -6implies that an
effective stress, 7, must exist for each e (or solids content) even
though the effective stress at the top of the pond is zero.
Accordingly, fictitious top of pond heights, Hf and Hi, are used by
determining the effective stress, a, corresponding to the initial void
ratio, e,, and dividing by the buoyant unit weight, y', of that void
ratio. This procedure is straightforward, except for s/c mix cases,
where several interpretations are possible. One interpretation uses the
relationship et = AZ6 another et = ec/(l+SCR) and e t = A? /(1+SCR); and
lastly ec = AZ' and the sand is only considered to increase the buoyant
125

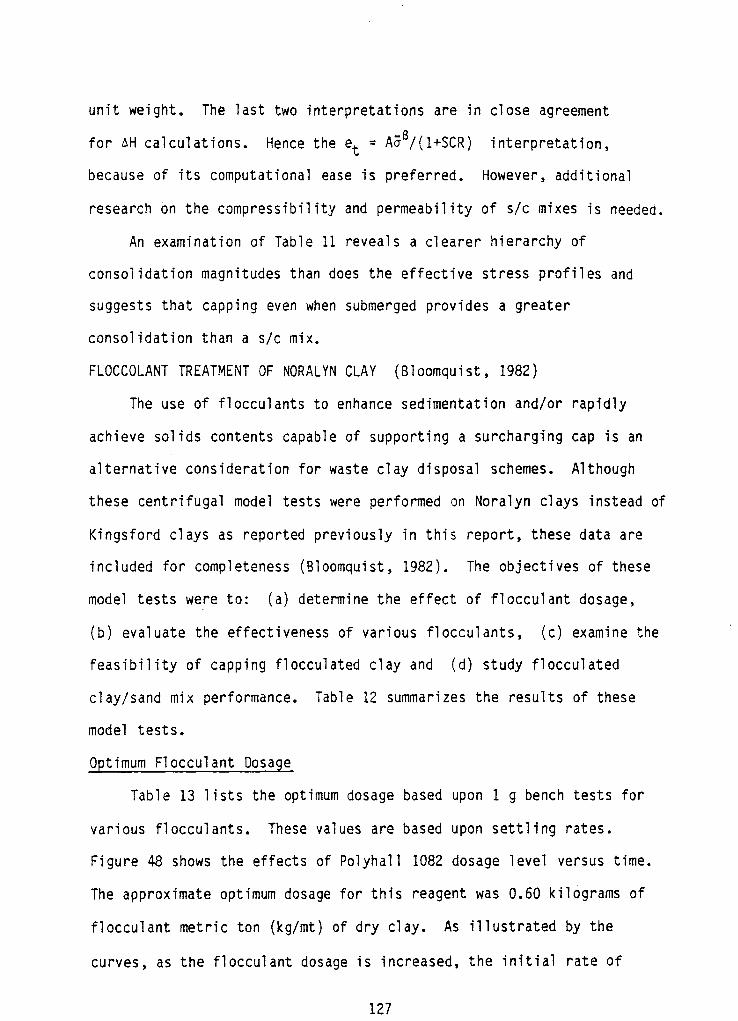
unit weight. The last two interpretations are in close agreement
for AH calculations. Hence the et = A@/(l+SCR) interpretation,
because of its computational ease is preferred. However, additional
research on the compressibility and permeability of s/c mixes is needed.
An examination of Table 11 reveals a clearer hierarchy of
consolidation magnitudes than does the effective stress profiles and
suggests that capping even when submerged provides a greater
consolidation than a s/c mix.
FLOCCOLANT TREATMENT OF NORALYN CLAY (Bloomquist, 1982)
The use of flocculants to enhance sedimentation and/or rapidly
achieve solids contents capable of supporting a surcharging cap is an
alternative consideration for waste clay disposal schemes. Although
these centrifugal model tests were performed on Noralyn clays instead of
Kingsford clays as reported previously in this report, these data are
included for completeness (Bloomquist, 1982). The objectives of these
model tests were to: (a) determine the effect of flocculant dosage,
(b) evaluate the effectiveness of various flocculants, (c) examine the
feasibility of capping flocculated clay and (d) study flocculated
clay/sand mix performance. Table 12 summarizes the results of these
model tests.
Optimum Flocculant Dosage
Table 13 lists the optimum dosage based upon 1 g bench tests for
various flocculants. These values are based upon settling rates.
Figure 48 shows the effects of Polyhall 1082 dosage level versus time.
The approximate optimum dosage for this reagent was 0.60 kilograms of
flocculant metric ton (kg/mt) of dry clay. As illustrated by the
curves, as the flocculant dosage is increased, the initial rate of
127


Table 13
Approximate Optimum Dosages for Reagents Tested.
REAGENT NAME TYPE
OPTIMUM DOSAGE
CHARGE KG/MT
POLYHALL 1082
POLYHALL 402~
PERCOL 455
PERCOL 351
PERCOL 919-2
PEO
JAGUAR c-13-s
POLYACRYLAMIDE ANIONIC 0.60
POLYACRYLAMIDE NONIONIC 0.75
POLYACRYLAMIDE CATIONIC 0.50
POLYACRYLAMIDE NONIONIC 1.00
POLYACRYLAMIDE ANIONIC 0.75
POLYETHYLENE OXIDE NONIONIC 1.25
GUAR GUM CATIONIC 1.25
129


settlement is substantially improved. However, as the dosage level
increased beyond optimum, the settlement rate declined. At an extremely
high dosage; i.e., 3 kg/mt, the benefits derived from the flocculant are
reduced considerably.
Figure 48 also demonstrates the effect of flocculant over non-
treatment on the final solids content. Although routine bench tests (1
g) have suggested that the final solids content achieved is reduced due
to the larger flocs, (Bloomquist, 1982) the centrifugal tests belie this
conclusion and show final solids contents of flocculated models only
slightly lower than non-flocculated models. When the flocculated clay
is subjected to field stress conditions, as provided in the centrifuge
the agglomerated flocs collapse to these higher solids content.
Nevertheless, in no model did the final solids content of a flocculated
clay equal or surpass that of untreated clay which means that
flocculants have a sedimentation rate advantage at the expense of a
lower final solids content.
Flocculant Agent Effectiveness
Figures 49 and 50 evaluate various flocculating agents at their
optimum dosages as determined from settling rates on 1-g bench tests.
These results suggest that the polyacrylamides (PAM), Polyhall and
lowed by polyethylenePercol, were the most effective flocculant fol
oxide (PEO) and guar gum. These results (Table
anionic flocculants are the most effective, fo
11) also show that
llowed by nonionics and
lastly cationic reagents. However the difference between flocculants is
quite small. Polyhall 1082 and Percol 91, the anionics achieved final
solids contents of 21.4 and 21.7%, respectively. The nonionics, Percol
351 and PEO achieved final solids contents of 21.5 and 20.9%,
131
Gary Albarelli

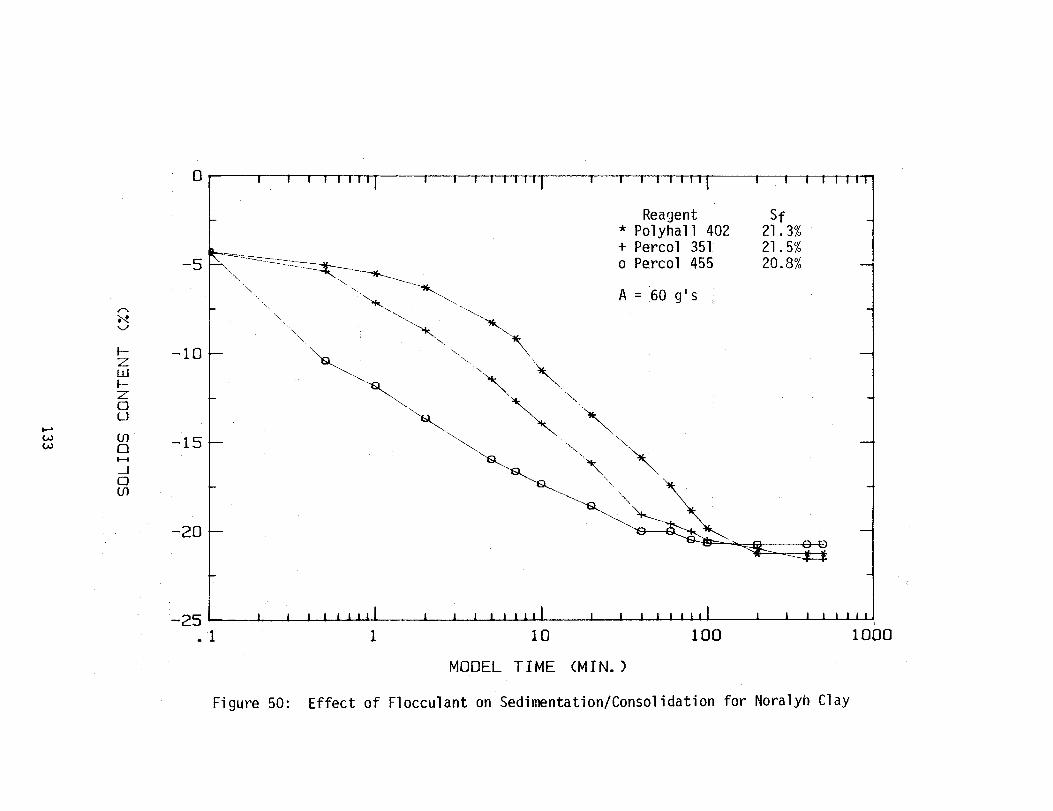

respectively. Percol 455 and Jaguar C-13-5, cationic reagents achieved
final solids contents of 20.8 and 20.4, respectively.
Flocculant/Sand Capping
Since capping low solids content clays (<15%) is unlikely due to
bearing capacity failures, a model series investigated the concept of
using flocculants to achieve rapidly a solids content capable of
supporting a subsequently placed sand cap. These results are presented
in Figure 51, which presents the results of two sand capping
additions. In one test a cap of 134 grams (equilvalent sand for a 2:1
SCR if mixed) was placed on the clay surface as soon as a solids content
of 15 percent was achieved. In another test, the sand cap was added
much later. As shown, the time of capping had only a minor effect final
solids content. Although some mixing of sand and clay occurred at the
interface, capping produced higher final solids contents than virgin or
treated lay without capping.
Flocculant/Sand Mixing
The concept of simultaneously mixing sand and clays to create a s/c
mix is a viable disposal technique, provided the clays are at a solids
content sufficient to entrap the sand and prevent segregation of the
sand from merely settling to the bottom. In this context, flocculants
can be used to achieve rapidly a clay solids content sufficient to
entrap the sand. Accordingly, Figure 52 provides a comparison between
non-flocculated, flocculated, and flocculated-sand entrapped waste
clays. As shown, no benefit in final solids content was derived by
mixing sand with flocculant treated clay. However, this scenario
provides simultaneous disposal of sand tailings and waste clay, while
the flocculant provides an additional time advantage.
134
Gary Albarelli
Gary Albarelli


CHAPTER V CONCLUSIONS
Based upon the testing methods and equipment, and soils tested, the
following conclusions are made:
1) Centrifugal modelling is a viable technique for examining prototype
waste clay disposal schemes. However, modelling of models is
essential for determining time scaling exponents, and segregation
potential must be evaluated in s/c mixes.
2) The time scaling exponent based upon modelling of models for
Kingsford clay is a function of clay solids content, and increases
from 1.6 at solids contents from 14 to 17%, to 2.0 at 20% solids.
3) Segregation of sand is not a major problem with s/c mixes when clay
solids contents >16 percent. This is true for s/c mix ratios
ranging from 1:1 to 6:1.
4) The descending order of disposal technique effectiveness in
achieving the highest final clay solids content is:
(a) Sand capping (staged)
(b) S/c mix capping
(c) S/c mix, 1:1 to 2:1
(d) Flocculants or untreated clay
However, the time required is in proportion to the final solids
content; e.g., highest solids contents require longest times.
5) When homogeneous s/c mixes are compared with untreated waste clays,
the greatest reductions in interface height are achieved with the
s/c ratio approximately 1:1. At s/c mix ratios exceeding 3:1, the
final interface height will be above that for comparable untreated
clay.
137

6) At low (1:1) s/c mix ratios, grain size has little effect on the
final interface height. At high (6:1) s/c mix ratios, the greatest
interface reduction is achieved with increasing grain sizes.
7) A threshold solids content exists below which the surface bearing
capacity is insufficient to support a cap. Remolding of the
underlying clay prior to cap placement has a detrimental effect on
the success of capping.
8) Reduction in interface height appear to be independent of the s/c
mix ratio. However, higher s/c ratios did produce higher clay
solids in the underlying clay layer.
9) Closed-form solutions for calculating final consolidation heights
were developed for quiescent clay ponds with and without a
surcharging cap.
10) The primary benefit of flocculants is increasing the rate of
sedimentation. Under prototype stress conditions, flocculated clay
achieves a final solids content slightly lower than untreated
clay. Capping flocculated clays produces major benefits, while
flocculated clay/sand mixes provided only a marginal benefit.
138

References
Ardaman & Associates (1982), "Evaluation of Phosphatic Clay - Disposaland Reclamation Methods; Vol. 1: Index Properties ofPhosphatic Clays; Vol. 2: Mineralogy of Phosphatic Clays,"FIPR Publication Nos. 02-002-003, 02-002-004, Bartow,Florida.
Araman & Associates (1984), "Laboratory Testing of Phosphatic Clays forReclamation of Phosphatic Waste Clay Pond by Capping - IMC Test Pit3," Report to University of Florida.
Barwood, H. L. (1962), "Mineralogy and Chemistry of the Clays," Phos.Clay Workshop FIPR Publ. 02-020-012.
Bloomquist, D. (1982), "Centrifuge Modelling of Large StrainConsolidation Phenomena in Phosphatic Clay Retention Ponds."Ph. D dissertation, University of Florida, Gainesville.
Bloomquist, D. G., Davidson, J. L., and Townsend, F. C., "PlatformOrientation and Start-up Time During Centrifuge Testing,"Geotechnical Testing Journal, GTJOOJ, Vol. 7, No. 4, December 1984,pp. 195-199.
Bromwell, L. G. and Oxford, T. P. (1977), "Waste Clay Dewatering andDisposal," ASCE Spec. Conf. on Geotechnical Practice for Disposalof Solid Waste Materials, Ann Arbor, Michigan.
Cardwell, W. T. (1941), "Drilling Fluid Viscosity," API Drilling &Production Practice [From Morgenstenm, N. 1965 ] "The Stability ofa Slurry Trench in Cohesionless Soils," Geotechnique, Vol. 15, No.4, December
Croce, P. (1982), "Evaluation of Consolidation Theories by CentrifugeModel Tests," MSc Thesis, University of Colorado, Boulder.
D'Appolonia, D. J. (1980), "Soil-Bentonite Slurry Trench Cutoffs," ASCEGED Jrn. Vol. 106 No GT4, April.
Davidson, J. L. and Bloomquist, D. (1980), "Centrifuge Modelling of theConsolidation/Sedimentation Process in Phosphatic Clays," EIES Rpt.245-W65, University of Florida.
Keen, P. W. (1982), "C F Industries, Inc. Sand/Clay Mix Experiment,"Phosp. Clay Workshop FIPR Publ. No. 02-020-012.
Lawver, J. E. (1982), "Progress Report No. 6: IMC-Agrico-Mobil SlimeConsolidation and Land Reclamation Study," IMC, Bartow, Florida.
Lawver, J. E. and Olson, S. I. (1982), "IMC-Agrico-Mobil Sand Cappingfor Waste Clay Consolidation," Phos. Clay Workshop FIPR Publ. No.02-020-012.
139
Gary Albarelli

Leitzman, R. A. (1982), "Brewster Phosphates Sand-Clay ReclamationMethod," Phos. Clay Workshop FIPR Publ. No. 02-020-012.
McClimans, S.A. (1984), "Centrifugal Model Evaluation of theConsolidation - Behavior of Sand/Phosphatic Clay Mixes," Master ofEngineering Report, University of Florida, Department of CivilEngineering, Gainesville, Florida.
McVay, M. C. (1984), Personal Communiction, University of Florida,Gainesville, Florida.
McLandon, J. T., Boyle, J. R. and Sweeney, J. W. (1983), "State-of-the-Art of Phosphatic Clay Dewatering Technology and DisposalTechniques," Vol. 2 FIPR Grant 81-02-017.
Martin, R. T., Bromwell, L. G. and Sholine, J. H. (1977), "Field Testsof Phosphatic Clay Dewatering," ASCE Spec. Conf. in GeotechnicalPractice for Disposal of Solid Waste Materials, Ann Arbor,Michigan.
Mikasa, M. and Takada, N. (1973), "Significance of Centrifugal ModelTests in Soil Mechanics," 8th ICSMFE Vol. 1, p 273.
Onoda, G (1977), "The Mechanism of Flocculation of Phosphatic Slimes,"Res. Rpt. to NSF Grant AER 76-24676.
Raden, D. J. (1982), "Estech, Inc. Plant Scale Disposal of PhosphaticClay - Flocculation With Sand Mix," Phos. Clay Workshop, FIPR Publ.No. 02-020-012.
Smelley, A. G. and Feld, F. L. (1979), "Flocculation Dewatering ofFlorida Phosphatic Clay Waste," USBM RI 8349.
Somogyi, F. (1979), "Analysis and Prediction of Phosphatic ClayConsolidation: Implementation Package," Bromwell Engr. Inc.,Lakeland, Florida.
Weiss. F. (1967). "Die Standicherheit Flussigkeitsgestutzter Erwande,"Bauingenieur-Parxis," Heft 70, Ernst,Xanthakos, Petros (1979, Slurry Walls,67].
Berlin and Munich, [fromMcGraw-Hill, New York, p.
140
Gary Albarelli

APPENDIX A
TOTAL SOLIDS CONTENT
Ww = weight of water .
WS = weight of sand
wC = weight of clay
,
HW = height of water
Hs = height of sand
Hc = height of clay
WT = total weight = W, + Ws + Wc
HT = total height = Hw + Hs + Wc
definition of intermediate solids content
weight of solids weight of solids + weight of interstitial water -
weight of water above interface
S it=k + wc + ws
+ \ c 's 'w - 'i
(A-1 1
initial clay solids content, So = wC
WC
solving for W,: WC so + w, so = WC
U-S,) ww =rwc M-2)
0
W sand/clay ratio, SCR = F
C
solving for Ws: WC SCR = W, (A-3)
weight of water above interface, Wi = AG (A) y,
assuming a unit area (A) = 1, Wi = AHy W
(A-4)
A-l
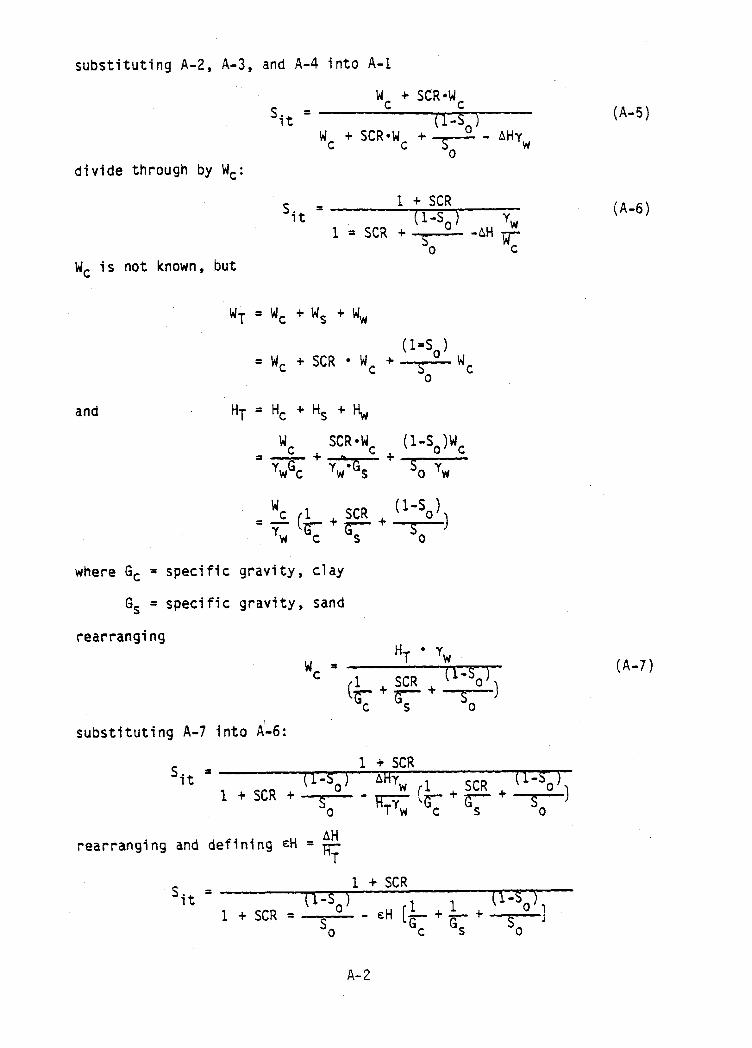
substituting A-2, A-3, and A-4 into A-l
S WC + SCR*W
C
it = (1 s 1 WC + SCR*Wc + - '
-Ty - *"rw
divide through by W,:
S = 1 + SCR it
1 A (l-S,) yw
SCR + T-- -*" WC W, is not known, but
WT = w, + w, + ww
= W, + SCR l WC +
and HT = H, + H, + Hw
J!& 1 U-So) Yw (G;+y+T+
where G, = specific gravity, clay
% = specific gravity, sand
rearranging
wc = HT l 'w
substituting A-7 into A-6:
S 1 t SCR
it =
rearranging and defining EH = iy
(A-5)
(A-6)
(A-7)
S 1 + SCR
it = (1 s 1 1 + SCR = -0 - (=O)
s E"$--f&f s ]
0 C S 0
A-2

simplifying and combining terms
s 1 + SCR f
it (1 s 1 #(A-8)
1 + SCR + (1-cH) F-$- - EH [$- + F] 0 C S
This equation may be used when the initial clay solids content, So, is
the same for both the sand/clay cap (if one exists) and the underlying
clay slurry. When the initial clay solids contents are different, a
more general equation may be found.
sand/clay cap
H,,, ‘& I *. . . .*. HCs, WCs
H wcc
SCR,, So,
cc'
underlying clay
layer (may also
include sand)
H wuw uw'
H wus us' SCR,, So,
H wuc UC'
height of cap, H, = H,, + H,, + H,,
height of underlying layer, H, = H,, + Hus + Hut
total model height, HT
tic = Hew + Hcs + Hcc =
=
Hu = Huw + Hus + Hut =
= H, + H,
W W,,*SCR, cc +
(l-S,, N,,
Tc 7w'Gs + So, 7,
p [& + yc + (lISOC)] C S oc
(A-9)
(A-10)
A-3

rearranging A-9 and A-10
and
w = $*Y, .
cc 1+---+ SCRc (1-sot)
Gc GB .n %c
w = .u ‘W UC 1 SCR
-+u+ (1-sue )
Gc Gs S UC
(A-U)
(A-12)
referring to A-l
si = wc + ws
WC + Ws + Ww - Wi
substituting WCC, Wuc, Sot, Sue, SCRc, and SCRu
W cc
+w uc + SCRcWcc + SCRUWuc (A-13) Si =
W cc
+W (1-soc ) (l'sou )
uc + SCR,W,,+ SCRuWuc +--s--Wcc + -7Wuc - AHor, oc ou
def i
and
SCR l-S,, ning a =k+.++-T
B=&+ SCR, l-S,,
c-T-+-x-
and substituting into A-13:
Hyyw H,,*Y~ HCyW HUYW a
+ - + SCRc Q 0
f SCRu T
Hcyw Huyw HCYW
a +-+ SCR - +
Huyw (1-soc) HCYW ('-sou) puyw
0 SCR -
ca u 0 +-S,,a+~ 0 - - AHy,
cancelling terms and rearranging:
Si = (l+SCR,) $
HU + (l+SCRU) B
(l+SCRc + -?+.I !$ (l+SCR/ :+-J $ - AH oc ou
where a = & C
A-4

B = k +.T + 2 (underlying clay)
EFFECTIVE CLAY SOLIDS CONTENT
definition of intermediate effective clay solids content:
weight of clay weight of clay + weight of interstitial
water-weight of water above interface
s. wC
ie =Jj +
wC I
c 'wowi (=O) Wc + .-4c - AH*G,
0
dividing through by WC:
s. = 1 le
(1-5O) AT
l+-s,-wc
referring to A-7
substituting into A-16
s. = 1 le
(1-sO) AH'YW 1 (-0)
1 '-3y'~'G;'q+-J
cancelling terms and rearranging I
(A-15)
s. = ie
A-5

rearranging further:
Again, this assumes that the initial clay solids content is the same for
the sand/clay cap and the underlying clay slurry. A more general
solution (similar to A-14) could be derived for the effective clay
solids content as well.
(For capped samples, an effective SCR should be calculated and used in
equations A-8 and A-17
SCRAVE = kCAp + HUNDERLYING CLAY
During a post-test analysis, the sample is cored and a relationship
may be determined between solids content and depth. If the total solids
solids content and SCR is known at a particular depth, the effective
clay solids content may also be calculated.
)


APPENDIX D
A slurry of some known initial concentration So is placed in the
Plexiglas container. An interface between the supernatant water and
the slurry surface develops and with time lowers. At any time, within
the container, there are two phases, solid and liquid. These may be
hypothetically separated for analysis.

The % solids by weight is defined as
W
sO = ij'x 190
t
Where So = initial solid concentration
so
so = wS
w, + ww
Solving for Ww
ws so + ww so = ws
W&l - so )
ww- s 0
(1)
The same analogy may be used in dealing with volumes rather than weights.
Since the area of the container A is constant, the volumes may be divided
by the container area to obtain heights. Thus; Ht = Hw + HS
A
HW
X
“5 V
where "t
= Total height of sample in container
“W = Height of water in container
“S = Height of solid in container
B-2

Hs H;A =Vs -=- Hw Hw l A c
W since in general yx = +
wx or Vx=-
X yX
Hs ws yw ws -= - -=-• Hw ys ’ Ww Ww G
where G, the specific gravity of the solids is defined by
Next, the effect of the supernatant water is included in the phase
diagram. At any time interval i, we have
SUPERNATANT WATER
INTERFACE
SLURRY :IATER '-'-
.-.- ._.-.-. -
SLURRY SOLID
A
HT-Hi
I(
Hi
where
Hi = height of interface at any time interval i
Since the supernatant is devoid of solids, we may write
si = ‘5
W7tY 1
(3)
B-3

where Si = solid concentration of the slurry at time i
W = weight of water below interface at tine i
w. 1
Solving for Wwi we have
W wi = ww - CHT 0 Hi) A YW
Substituting Equation 1 into the above yields;
Ws(1 w= s
- So)
wi (HT - Hi) A Yw
0
14 = ws (1 - so)
wi sO
ws (1 w= s
- so)
wi 0
- WT -Hi)A .&- S
tHt - Hi) Ws
HS G
Substituting this into equation (3)
‘5 'i= W(l-S) s 0 -
sO
(HT - Hi) 's + II
Hs G 's
Cancelling Ws yields
‘i= 1-S 1
0 HT-Hi +1 So - Hs G
(4)
B-4

It is now desireable to remove HS from the equation. Recalling
that:
H, = t$ - Hw
and
we have
HS = HT - HS ww G
w S
H W G
HT = HS + sw '
S
Ww G = H, (1 + -Q-- )
S
Also from before,
NW = ws (1 -Jo)
sO
Inserting this into the above,
HT =Hs l+ s L
Ws(l - so)
0
Or
HT H, =
1 + Gil - So)
sO
(5)
B-5

Substituting equation 5 into equation.4
'i 1 =
1 - so
HT - Hi
So - G HT
I
+1
1 + G(l - So)
sO
rearranging this
0 - c.;T-$ ( 1 + G ( ’ ;,“)i] +’
1
1 - HT - Hi HT - Hi
HT -Tp--
I +1
Multiplying top and bottom by So
si= s
' ( ' ios' [l - 'fl; "i]- "TH; :i i + So
Expanding terms
Si = 1 - So - HT - Hi + S
HT 0
B-6

This form is convenient to use, since the bracketed quantity is a
constant for a given test.
By knowing the initial concentration, So, the initial height of
slurry, HT, and the specific gravity of the solids, G, the solids
content, Si, when the interface is at height Hi may be determined.
Another useful relationship involves the void ratio and the percent
solids. All definitions and symbols refer to the portion of slurry
below the supernatant interface. By definition

e =“W
from equation (1)
Knowing the specific gravity and the percent solids at any time, the
void ratio can be computed.
B-8

Appendix C
Deviation of Unit Weights for Waste Clays and Sand/Clay Mixes
1) Unit weight of clay in terms of solids content
“w = Height of water
"c = Height of clay
WW = Weight of water
Hw WC = Weight of clay -T ww
1
wC Definition S = w + w Assumption W,+W, = 1 - S = WC Rc Ww = 1-S
1. 'W c
“W = (W/y,
Hc= S
ywGs
Definition: Yt = ww + WC
=
"t
= YWGS S(l-Gs)+GS
(1-s) + s = J@
0 ‘vSG ( i-i)GS+S
yW w s
y’=~t -yw = yWGS - yw = ywGs - Sy,(l-Gs) - Gsyw = Sv,(G,-1)
S(l-Gs) + .Gs S(l-Gs) + Gs S(l-Gs)+Gs
Equation C-l
C-l
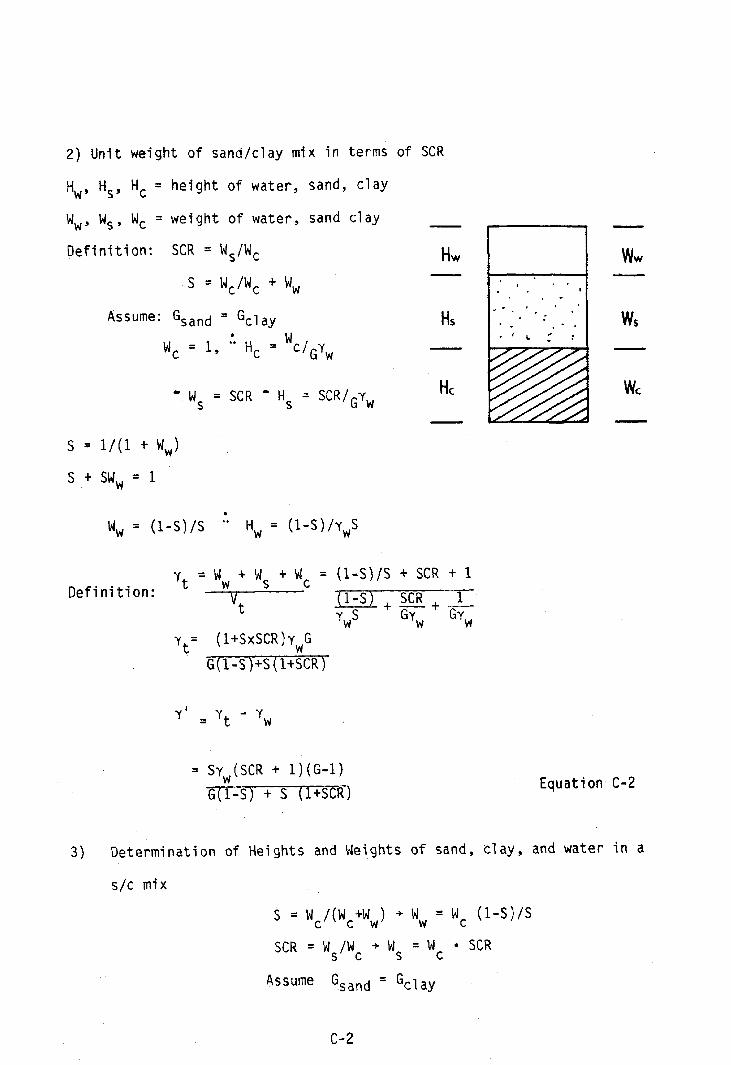
2) Unit weight of sand/clay mix in terms of SCR
H,, $9 H, = height of water, sand, clay
W w' WV WC = weight of water, sand clay
Definition: SCR = WJW,
S = WC/WC + ww
Assume: Gsand = Gclay
WC = 1, ' H, = 'c/Gy,
Hw
HS
- ws = SCR - Hs = SCR/Gyw
S = l/(1 + ww) .,
s + SW, = 1
ww = (I-s)/S '* Hw = (I-S)/u,S
Definition: -5 = ww t ws + WC =
Vt
yt= (l+SxSCR )Y,G
G(LS)+S(1+SCR)
= Sy,(SCR + l)(G-1)
G(l-S) + S (l+Scg)
(16)/S + SCR + 1
(1-s). SCR 1
yWs GY, + Gv,
WS
Equation C-2
3) Determination of Heights and Weights of sand, clay, and water in a
s/c mix
S = wc/(wc+ww) + ww = WC o-S)/S
SCR = ws/wc + ws = WC l SCR
Assufle !sand = Gclay
c-2

Calculation of Effective Stress Profile
Table C-1 presents the calculations of the effective stress
profiles for Cases A through E. These cases assume a waste pond of unit
depth, with an unlimited supply of waste clays. However, the sand used
in s/c mixes and caps is equal for all cases where appropriate.
Example: Determine the effective stress profile for 5 cases of a unit
deep pond


C-6


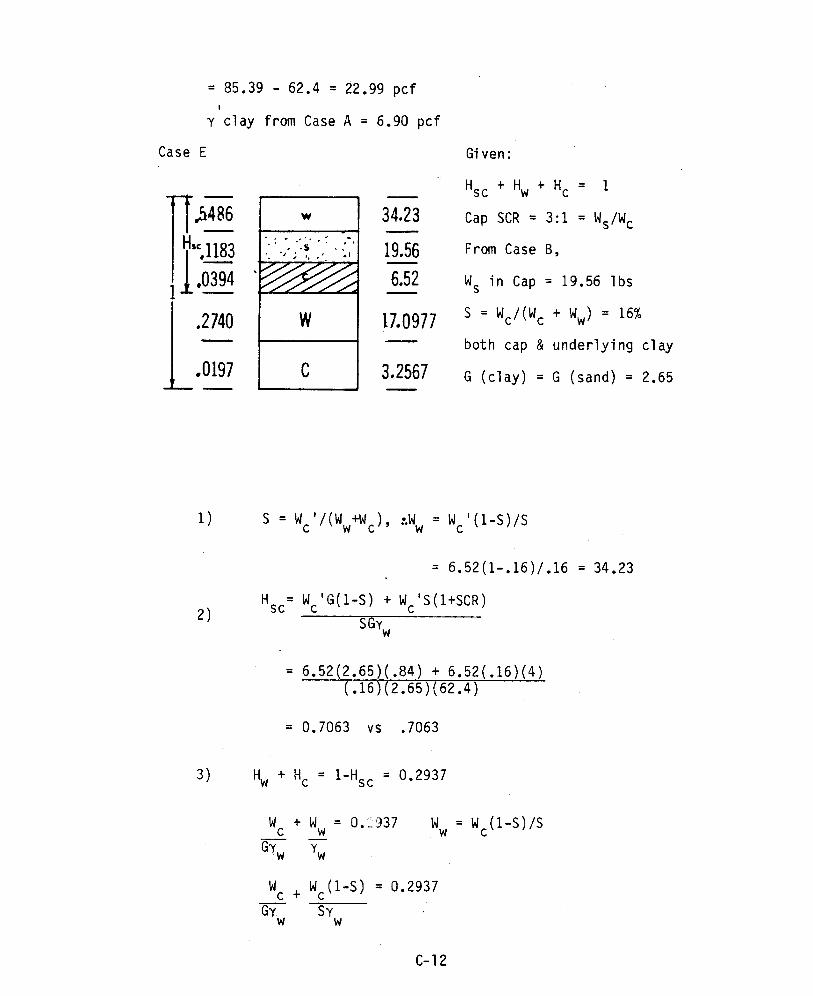

= .2937 (SGyw) WCS + WcG(l-s)
WC [S -+ G(l-S)
WC = .2937(.16)
1 = .2937 (SGY,)
1(2,65)(62.4) = 3.2567
.16 + 2.65 c.84)
Hc = 3.2567/62.4 = .0197
4) qq = W,(l-g/s = 3.2567(.84)/.16 = 17.0977
Hw = 17.0977/62,4 = 0.2740
Since a comparison between Case B (s/c mix) and Case C' (submerged cap)
reveals higher effective stresses at the surface for Case C' but lower
at the bottom, one might ask, which case causes the greater settlement?
Assuming the following model describes the effective stress/void
ratio relationship, calculate the total settlement
e = (l-S)Gs/S
Let A = 22, and S = 0.2
In the case of a s/c mix:
A@ = AH + AH = H Ae or AH = Hf 0 Ae dz
E-p-- 0
l+e o
'i
l+eo
If he = e. - ef and ef = A;-' then Ae = e. - A;,-'
, C-13

Since G = Y'Z, then he = e 0
- A(r'Z)-B
AH = Finally,
Hf e
Y+e
- A(Y'z)-' dz = 1 Hfe
Hi 5
0 - A(v'z)-"dz
0 I+e
_ ,Q'-f$l-6 Hf
0 Hi
0 I 1-u H
i = 1 (eo(Hf-t$) - Ayt-u[~f(l-fi) _ H (I-R) J)
l’eo r-B i
In the case of the sand cap, we can treat the sand cap as a surcharge ,
and
then,
a= ,
q + Y zc, where q = Y& and z C
Ae = e o- A(q + v'zc)-@ and
= depth of clay (H-zs)
AH= 1 5
I
-R e
0 - Ah+-& dz
l+e 0
Z. 1
Remembering that /(ax+b)"dx = atntll (ax+b)"", n*-1, then
AH= 1 Izceodz -
lteo
A /zc(V'z+q)-Bdz
l+e
'i 0
zC
Z. 1
= 1 feo4 - A (v'z+q)-B zC
Gq Z. 7 l+egv'Il-sT I Z.
7
*‘A/j = 1 Ceo~zc-2i >] - A
l+eo Y'(l-B)(lte r ' 0
c (Y ‘z,tq) 1-R - (Y IZi*q)l-B]
c-14

Calculations of Consolidation Magnitudes
From the previous equation we can calculate the consolidation
magnitude for s/c mix and capped waste ponds as presented in Table C-
2. These calculations are based upon the assumption that the
constitutive relationship e = A 'j -' is the same for s/c mix and waste
clay. For Cases C and D the sand surcharge, q, is incompressible, while
for Case E, the S/C mix cap compressibility is calculated. The use of
the constitutive equation e = AaBB implies an effective stress exists
for all void ratios, although the effective stress at the pond top is
zero. Accordingly a fictitious initial pond height, Hi, is used by
determining the effective stress, 3, corresponding to e. and dividing by
the buoyant unit weight of that void ratio.
C-15


Final pond height = 10 - 2.20 = 7.80 ft. A computer analysis using
Somogyi (1979) also calculated a final pond height = 7.80 ft, thus
verifying the procedure.
Case B 2:l S/C Mix SC = 16% Dp = 10 ft
For a s/c mix e total = e,/(l+SCR), thus et = 13.91/(1+2) = 4.63.
Since a = (e/A)** l/B, then z = (4.63/22)** - l/.2 = 2404.8 psf and
Hi = 2404.8/18.26 = 131.7 ft thus Hf = Dp t Hi = 10 + 131.7 = 141.7 ft.
Accordingly
AH = 1 (4.63(141.7-131.7) - 22(18.26)-2(141.70’8 - 131.7008]) 1+4.63 l-0.2
= 0.049 ft.
Final pond height = 10 - 0.049 = 9.95 ft.
Although the AH = 0.049 ft calculated above is quite correct,
an alternate calculation assumes only the clay is compressible and
the sand merely increases the buoyant unit weight, Y’. Thus
instead of a 10' deep pond, a pond consisting of 8.82 ft. of clay
and water having a Y’ = 18.26 pcf is considered and,
a = (13.91/22)**-l/.2 = 9.89 psf and Hi = 9.89/18.26 = 0.542 ft.
Thus Hf = 0.542 + 8.82 = 9.362 ft. and;
AH= 1 13.91+1
[13.91(9.362-0.542) - 22(18.26)-•2 x (1 - 0.2)
(9.3620e8 - 0.542°'8)] = 2.68 ft
C-17

The height of sand involved is 1.18 ft; hence the final pond height =
8.82-2.68+1.18 = 7.31 ft.
Lastly the procedure used by Somogyi (1979) redefines the
constitutive relationship in terms of the total void ratio, i.e.,
= A; -’ and a = [et(l+SCR)] **-1'B
l+SCR A et = ec/(l+SCR). Thus et
a = [4.63(1+2 Hence,
)I**( -l/0.2) = 9.97 psf and Hi = 9.97/18.26
22
= 0.546. Thus Hf = Hi t D = 0.546+10 = 10.546 and P
AH = 1 (4.63(10.546-0.546) - 22(18.26)-"'2 x 4.63+1 (1+2)(1-0.2)
[1O.546o’8 - 0.546°*8] = 2.80 ft
Therefore the final pond height = 10.0 - 2.80 = 7.20 ft, which was
calculated using Smogyi's (1979) program.
Case C Sand Cap
Since So = 16% of the underlying clays, then from Case A, e. =
13.91, Zi = 1.433 ft. However, since the sand cap for a 10' deep pond
is 1.96 ft thick (Table (10)) then zc = Zi+Dc = 1.433+8.04 = 9.473 ft,
and q = 196.0 psf.
AH = 1, [eo(Zc-Zi )l - A
l+eo v'(l-B)(lte,) '
[(y’zc+ d-* - (y’y+ p]
C-18

1 [13.91(9.473-1.433)] - 22 =
1+13.91 (6.9)(1-.2)(1+13.91)
[ (6.9)(9.473) + 196.0)“*8 - ((6.9)(1.433) + 196.0)“‘8] = 3.51 ft
therefore the final pond height is 8.04 - 3.51 + 1.96 = 6.49 ft.
Case D - Submerged Sand Cap
Since Case D is identical to Case C with the exception that the
sand cap has become submerged and thus q = 73.7 psf, then:
AH= 1 [ 13.91(9.473-1.433) ] - 1+13.91 (6.9)(1~~)(1+13.91)
[ ( (6.9)(9.473)+73.7)1-o’2_ ((6.9) ( 1.433)+73.7)1-o’21 = 2.87
Therefore the final pond height is 8.04-2.87+1.96 = 7.13 ft.
Case E S/C Mix Cap 3:l
For Case E, we must consider the AH of the s/c mix cap plus the
AH of the underlying clay, with account taken of the surcharge, q,
imposed by the s/c mix cap on the clay. Likewise as in Case B, several
alternatives are available for estimating e, and Hi of the s/c mix.
For a s/c mix et = ec/(l+SCR), thus et = (13.91)/(1+3) = 3.48.
Since s = (e/A)**l/fI, then a = (3.48/22)**(-l/0.2) = 10,134 psf, and Hi
= 10,134/22.99 = 440.8 ft. thUS Hf = Hi + Dcap = 440.6 + 7.06 = 447.86 ft
(see Table 11) accordingly,
AH = 1 [3.48(447.86-440.8) - 22(22.99)-Oo2 1+3.48 (1-0.2r X
C-19

If we consider that only the clay is compressible and the sand
merely occupies volume, then the 7.06 ft s/c mix cap consists of 0.39 ft
of clay, 5.49 ft of water and 1.18 ft of sand, with a buoyant unit
weight Y' of 22.99 pcf. Since the clay present in the s/c mix is at 16%
solids, then (T = (13.91/22)**(-l/0.2) = 9.89 psf and Hi = 9.89/22.99
= 0.43 ft and Hf= 0.43+0.39+5.49 = 6.31 ft
thus AH= 1 [ 13.91(6.31-0.43) -
1+13.91
(6.31°08 - 0.43008)]
= 2.09 ft
the final cap height will be 6.31-2.09+1.18 = 5.40 ft.
Alternatively, by considering the effective stress/void ratio
relationship in terms of total void ratio, then
3 = (et(l+SCR))**l/B = (3.48(1+3))**(-l/.2) = 9.89 psf.
A 22
Thus Hi = 9.8912'2.99 = 0.43 ft, and Hf of the cap = 0.43t7.06 = 7.49 ft.
AH = Then
1 [eo(Hf-Hi) - Ay'-' (Hfl-'- Hilm8)]
l+eo (I+SCR)(l-8)
= 1 [3.48(7.49-0.43) - 22(22.99)-“*2(7.490’8- 0.43008)] lt3.48 (1+3r(o.8)
= 1.80 ft.
The final cap height will be 7.06-1.80 = 5.26 ft.
The clay underlying the s/c mix cap will be 2.94 ft thick at 16%
solids content; thus 0 = (13.91/22)**(-l/.2) = 9.89 psf and
C-20

? = 9.89/6.90 = 1.433 ft. The value for zc will be 1.433+2.94 = 4.37 ft,
with a 162.3 surcharge.
Accordingly,
AH = 1 (eo(zc-zi > > - A
l+e, y’ (1-B) (l+eo) ’
[(v’z,+ q) 1-B
- (Y’Zif qpB 1
1 (13.91(4.37-1.43)) - 22 = lt13.91 (6.9)(1-0.2)(1+13.91)
[ (6.9(4.37)+162.3)Oo8- ((6.9)(1.43)+162.3)“*8] = 1.21 ft.
The final clay height will be 2.94-1.21 = 1.73 ft.
In summation, the final height of the pond will depend upon
which AH is selected for representing the s/c mix. Because the methods
using the 3:l S./C but with the sand removed or the 3:l s/c et used are
in close agreement, AH s/c mix = 1.80 for the et = .& ii8
relationship is selected as being representative. Thus the final pond
height will be AH s/c mix = 1.80 + AH clay = 1.21 = 3.01 ft; then the
final pond height is 6.99 ft.
C-21