«Recharging Greek Youth to Revitalize the Agriculture...
103
1 «Recharging Greek Youth to Revitalize the Agriculture and Food Sector of the Greek Economy» Final Report Sectoral Study 3. The Dairy Sector in Greece: Constraints and Opportunities for Existing Producers and Newcomers Athens, December 2015
Transcript of «Recharging Greek Youth to Revitalize the Agriculture...

1
«Recharging Greek Youth to Revitalize the Agriculture
and Food Sector of the
Greek Economy»
Final Report
Sectoral Study 3.
The Dairy Sector in Greece:
Constraints and Opportunities for Existing Producers and
Newcomers
Athens, December 2015

2
The Dairy Sector in Greece:
Constraints and Opportunities for Existing Producers and
Newcomers
Marianna PARPOUNA, Markos PSARRAKIS, Giorgos FOTIAS, Sofia THEODOROU,
Theofilos MASSOURAS, Anastasios AKTYPIS and Effie TSAKALIDOU
Laboratory of Dairy Research, Department of Food Science and Human Nutrition
Agricultural University of Athens, Athens, GREECE

3
Table of Contents
Summary ................................................................................................................................................. 6
Executive Summary ................................................................................................................................ 7
Chapter 1. The dairy sector in Greece: current status.............................................................................. 9
1.1. Introduction .................................................................................................................................. 9
1.2. The dairy sector at global and European level: prospects .......................................................... 10
1.3. Domestic dairy market ............................................................................................................... 11
1.3.1. Size of domestic dairy production .......................................................................... 12 1.3.1.1. Raw milk ............................................................................................................................................................................................... 14
1.3.1.2. Drinking milk ....................................................................................................................................................................................... 15
1.3.1.3. Yogurt, butter, cream and sour milk ................................................................................................................................................... 15
1.3.1.4. Cheese................................................................................................................................................................................................... 16
1.3.2. Size of domestic dairy market ................................................................................ 17 1.3.2.1. Drinking milk ....................................................................................................................................................................................... 17
1.3.2.2. Yogurt, butter, cream and sour milk ................................................................................................................................................... 18
1.3.2.3. Per capita consumption of main dairy products ................................................................................................................................ 20
1.3.2.4. Cheese................................................................................................................................................................................................... 21
1.3.2.5. Per capita consumption of cheeses ..................................................................................................................................................... 22
1.3.3. External trade of dairy products ............................................................................. 22 1.3.3.1. Imports evolution ................................................................................................................................................................................. 23
1.3.3.2. Exports evolution ................................................................................................................................................................................. 23
1.4. The demand for dairy products and cheeses ............................................................................... 25
1.4.1. General characteristics of the demand ................................................................... 25
1.4.2. Average monthly households’ expenditure for dairy products and cheeses .......... 26
1.4.3. Analysis of the consumers’ questionnaire .............................................................. 28 Chapter 2. The small, family dairies in Greece: an overview ............................................................... 30
2.1. Introduction ................................................................................................................................ 30
2.2. Legislation about small dairy processing units .......................................................................... 31
2.3. Distribution of small dairy enterprises ....................................................................................... 32
2.4. Greek PDO and traditional cheeses ............................................................................................ 39
2.4.1. Greek PDO cheeses ................................................................................................ 39
2.4.2. Traditional non-PDO Greek cheeses ...................................................................... 49 Chapter 3. e-Commerce ......................................................................................................................... 53
3.1. e-Commerce worldwide ............................................................................................................. 53
3.2. e-Commerce in Greece ............................................................................................................... 54
3.2.1. Households and Consumers ................................................................................... 54
3.2.2. Enterprises .............................................................................................................. 56 Chapter 4. Agrotourism and the dairy sector......................................................................................... 58
4.1. Agrotourism at global, European and Greek level ..................................................................... 58

4
4.2. Agrotourism and the Greek dairy sector .................................................................................... 58
4.3. Prospects for the development of agrotourism in Greece ........................................................... 59
Chapter 5. Education of prospective milk processors ........................................................................... 61
Chapter 6. Baron Michael Tossizza-Averoff Foundation Dairy: A Case Study ................................... 64
Chapter 7. Questionnaires: Existing producers and prospective newcomers ........................................ 67
7.1. Existing producers ...................................................................................................................... 67
7.2. Newcomers ................................................................................................................................. 70
Chapter 8. Conclusions.......................................................................................................................... 74
References ............................................................................................................................................. 80
ANNEX I ............................................................................................................................................... 82
EXEVUTIVE SUMMARY ................................................................................................................... 82
ANNEX II ............................................................................................................................................. 94
EXEVUTIVE SUMMARY ................................................................................................................... 94
5
Acknowledgments
The present work would have not been achieved without the help of a significant
number of people.
We are grateful to the faculty members in the Department of Agricultural Economics
and Rural Development at the Agricultural University of Athens, namely Prof. K. Tsiboukas,
Prof. P. Lazaridis, Assoc. Prof. A. Koutsouris, and Assist. Prof. S. Klonaris. Their guidance
and contribution have been instrumental in performing the study. We sincerely thank Prof. K.
Tsiboukas for his help with the Business Plans’ design, Prof. P. Lazaridis for providing us
with information regarding households’ expenditure, Assoc. Prof. A. Koutsouris for his
guidance in the chapter of Agrotourism and Assist. Prof. S. Klonaris for his help with the
questionnaires design.
We would also like to thank the scientific staff of ELOGAK (Hellenic Milk and Meat
Organization) and EFET (Hellenic Food Authority) for providing us with data and constant
feedback that were essential for specific tasks of our study.
Special thanks go to the dairy units’ owners for their cooperation and the time they took
for responding to the questionnaires designed in the context of the study.
In particular, we are grateful to Mr. Giorgos Tritos and Mr. Giorgos Tsombikos in the
Baron Michael Tossizza-Averoff Foundation for accepting us in their facilities and their
enthusiasm to guide us through the dairy unit and answer in a comprehensive and detailed
way to all our queries.
Last but not least, we are indebted to the “SNF – Stavros Niarchos Foundation” for
funding the study.

6
Summary
The aim of the present study was to shed light to constraints and opportunities for existing
producers and newcomers in the dairy sector in Greece. Towards this, we used existing
relevant studies as well as existing market data about the current status and the potential of the
dairy sector both at national and EU level. Additionally, we designed and completed
questionnaires in order to fingerprint the views and willingness of existing producers but also
newcomers to expand and invest, as well as questionnaires regarding consumer’s trends
towards existing and novel dairy products. We thus collected material, which include a
detailed fingerprint of the current status in the Greek dairy sector and its expanding potential,
a detailed fingerprint of the small, family dairy units as well as their know-how and capacity.
Moreover, we evaluated the potential of small dairy units to further develop (Business Plan I)
and we developed guideline procedures for newcomers for setting-up new businesses in the
dairy sector (Business Plan II).

7
Executive Summary
Greece has a long tradition in small ruminant farming, i.e. sheep and goat, and thus
sheep and goat milk production as a whole makes almost 60% of the total milk production
while the remaining 40% is cow milk. The sheep and goat livestock extents to 9.5 million
sheep and 4.5 million goats, compared to just 154.000 dairy cows. Primary milk production,
for all types of milk, is mainly concentrated in Central Macedonia and Thessaly. The major
part (90%) of sheep and goat milk produced in Greece is used for cheese making, while, the
main part of cow milk (80%) is used mainly as pasteurized milk and yogurt.
Nearly 80% of sheep and goat milk derives from small and family farms, which are
highly dependent on family labour, with almost 115.000 families engaged in farming and over
300.000 people working part- or full time in the primary dairy sector. The secondary dairy
sector, i.e. milk processing, comprises 53 big dairy companies processing >5000 tons of milk
per year and 671 SMEs or family dairy units processing <5000 tons of milk per year. They
process all types of milk produced in Greece, namely 730.589 tons of cow milk, 735.669 of
sheep milk, 350.871 tons of goat milk (data of 2013) into a big variety of products, with the
major ones being drinking milk, yogurt and cheese. The secondary dairy sector provides work
to a total of 11.802 employees.
Regarding import and export trade of dairy products, total imports (in quantity) showed
an upward trend between 2008 and 2010, followed by a slight decline till 2013, with cheese
ranking by far first. On the other hand, exports (in quantity) showed fluctuations between
2008 and 2013, with cheese and yogurt being the protagonists, showing at the same time an
upward trend.
The family expenditure share for milk and dairy products, within the food expenditure
as a whole, has remained almost stable over the last years, fact that reflects the important
position of dairy products in the dietary habits of the Greeks. Regarding milk, most
consumers prefer pasteurized milk while high-temperature pasteurized milk comes second,
claiming at the same time an increasing market share. The consumers’ preference in yogurt
mainly refers to strained yogurt and in particular yogurt from cow milk. With regards to
cheeses, the category of soft cheeses, which includes basically Feta cheese, ranks by far first
in consumers’ preferences, followed by hard and semi-hard cheeses, while at the same time
imported hard and semi-hard cheeses are becoming also popular, mainly because of their
lower prices. Still, the majority of the consumers choose Greek traditional and PDO cheeses.
It should be mentioned that Greece has worldwide the highest per capita cheese consumption
with almost 30 kg annually.

8
Joint concerns among all stakeholders of the dairy sector, i.e. farmers, dairy companies,
consumers, state authorities and investors, include further development of the dairy sector,
reduction of production costs and consumers’ prices, improving products’ quality, emphasis
on Greek traditional dairy products, extroversion, unemployment decline and sustainability.
Agrotourism has not developed sufficiently in the dairy sector despite the considerable
efforts made so far both by the tourism entrepreneurs and the relevant public authorities. The
“Greek Breakfast” initiative and the Baron Michael Tossizza - Averoff Foundation Dairy unit
are excellent but sporadic examples. Thus agrotourism has to be considered on a more
sustainable basis and in an integrated approach at national level.
The same is valid for the implementation of e-commerce in the dairy sector, despite the
fact that e-commerce, as a whole, is emerging in recent years as a growing trend mainly
among consumers and in lesser degree among Greek entrepreneurs. Dairy units, no matter big
or small, should seriously consider e-commerce as a tool for better promoting their products
and developing their business.
Stable economic and legislation environment along with faster and more efficient state
administrative procedures as well as integrated and well-coordinated educational curricula for
newcomers are considered as crucial prerequisites for giving vent and prospective to the
emerging tendency, especially among young people, to re-visit the agro-food sector in Greece
and in particular dairy farming and dairy processing.
To conclude, the comparative advantages for the “small” dairy “garden” of Greece,
which can and should act as the main levers of the Greek dairy sector as a whole are (a) the
goat milk, a unique product of high quality and quantity, especially the one produced by
autochthonous breeds under extensive and not intensive conditions, and (b) the indigenous
microbiota of the naturally fermented Greek dairy products, which is well preserved in the
Agricultural University of Athens.

9
Chapter 1. The dairy sector in Greece: current status
1.1. Introduction
The EU has as highly developed dairy sector that significantly contributes in the global
production of cow (25%), goat (18.6%) and sheep (18.4%) milk. At EU level, cow milk is the
dominant one (97%). The current oversupply of cow milk on the world market has driven
prices for milk low. The average milk price in EU fell by 19% from September 2014 to
September 2015, with increased production (EC, Milk Market Observatory 2015), while the
prospects for price rising are cloudy, among others, because of the world political insecurity.
In particular, the EU cheese exports declined by 26% from January to Aug 2015 and at the
same time prices have been forced down, largely due to the Russian import restrictions and
China’s import deceleration in skim milk powder by 26% during the first semester of 2015
(Eurostat ComExt, 2015). However, despite the apparent uncertainty in the global dairy trade,
some North European countries have invested to the EU quotas regime elimination since
April 2015 in order to increase milk production taking advantage of the rainy climate and vast
pastures. It is beyond doubt that there is a business conflict of interest (a) between EU
enterprises, with huge milk surpluses that are likely to increase after 2015 and domestic-
national ones to capture shares in the milk market and (b) between dairy enterprises and retail
chains, with a view on the part of supermarket dominance in the production and marketing of
milk through private label products (European Commission Conference, 2013).
On the other hand, Greece has a long tradition in small ruminant farming, i.e. sheep and
goat, and thus sheep and goat milk production as a whole makes almost 60% of the total milk
production while the remaining 40% is cow milk. The sheep and goat livestock extents to 9.5
million sheep, i.e. 12% of the EU total number, and 4.5 million goats, i.e. 48% of the EU total
number, compared to just 154.000 dairy cows, i.e. 0.6% of the EU total number. Dairy
activities in Greece, especially those related to small ruminant’s milk, have been traditionally
vital to the rural and the national economy as a whole, with almost 115.000 families engaged
in farming and over 300.000 people working part- or full time in the primary dairy sector, i.e.
raw milk production. Thus, despite the low contribution of Greece in cow milk production at
EU level, Greece is ranking 2nd at sheep and goat (as a whole) milk production in the EU,
being at the same time 4th and 5th at world level, respectively, and ranking 1st worldwide in the
per capita production of sheep and goat (as whole) milk. The major part (90%) of sheep and
goat milk produced in Greece is used for cheese making, with 21 cheeses having been
recognized as PDO (Protected Designations of Origin), which is the highest number of PDO
cheeses in the EU. Nearly 80% of sheep and goat milk derives from small and family farms
with an average herd size less than 100 animals. These farms are highly dependent on family
labour and usually lack mechanised milking systems, despite the reform efforts of recent
years. Still, sheep and goat breeding in Greece ensures income in mountainous and less
favored areas where alternative income sources are rather limited.
Regarding cow milk production in Greece, the major part (80%) is used for bottling,
mainly as pasteurized milk, and the rest in yogurt production. However, there is a high deficit
given that only 730.589 tons in 2013 while the domestic needs reached 1.3 million tons for
drinking milk as well as dairy products, mainly yogurt. Despite the EU limitations quotas
regime in cow milk production, Greece had never exceeded its own quotas. On the contrary,
there was a shrinkage in milk production sector with the cow breeders going down from
12.400 in 2000 to 3.680 in 2013. Meanwhile, in April 2015 the quotas regime has been
abolished, with international analysts being concerned about the impact of the non-quotas

10
regime on producer prices in the EU, with Greece asking for further support and control
measures by public interventions and at the same time reconsidering the role of cooperatives
and producer groups so as to better meet the new conditions.
The secondary dairy sector, i.e. milk processing, in Greece is well developed. It
comprises of 53 big dairy companies processing >5000 tons of milk per year and 671 SMEs
or family dairy units processing <5000 tons of milk per year. They process all types of milk
produced in Greece, namely 730.589 tons of cow milk, 735.669 of sheep milk, 350.871 tons
of goat milk (production data for 2013) into a big variety of products, with the major ones
being drinking milk, yogurt and cheese. In particular, the processing of sheep and goat milk,
which can be considered as the competitive advantage of the Greek dairy sector, is mainly in
the hands of SMEs and family dairy units. The dairy sector provides work to a total of 11.802
employees and makes 17,3% in production value of the food sector as a whole, which in turn
makes in value almost 1% of the Greek economy (GDP) from a total of 3.3% of the whole
rural sector’s participation to the GDP.
Thus, under the current conditions, the Greek dairy sector has become vulnerable to
international competition. Importing nations have set high quality standards which have to be
necessarily met by the exporting nations. The success of the Greek dairy industry now
depends on the production of milk of high quality to be converted to value added products,
mainly traditional and PDO cheeses. The critical point here is the need for proper
infrastructure to help maintaining the requested hygiene and the quality of milk and milk
products. Taking the above into account, the Greek dairy sector must be re-visited in a
sustainable perspective so as to be able to offer products of high added value and
competitiveness and also exploit its comparative advantages in milk production.
1.2. The dairy sector at global and European level: prospects
The dairy sector is of great importance to the EU and milk represents a significant part
(15%) of the EU agricultural output value. The EU main producers are Germany, France, the
United Kingdom, Poland, the Netherlands and Italy, which together account for almost 70%
of the EU production. Moreover, the EU plays a key role in the world dairy market as the
leading exporter of many dairy products, mainly cheese.
The medium-term prospects for milk and dairy commodities are promising mainly due
to the growth, at a steady pace, of the demand worldwide. Milk production is expected to
increase in all the main milk-producing regions of the world, including the EU. From 2016
onwards, milk deliveries in EU are expected to show a steady increase but at a pace slower
than before the abolition of the quota. Specifically, 158 million tons are expected to be
produced in 2024 i.e. 12 million tons more than 2014. The European milk deliveries are
expected to grow at a rate of 0,8% per year.
A higher consumption of dairy products is expected in several regions, such as India,
China, Africa and the Middle East, primarily due to changes in dietary habits and also to
population growth. However, this significant increase in consumption of dairy products does
not necessarily mean that these regions are going to increase imports, as the level of their
domestic production will be higher and therefore, they are expected to keep imports steady.
Overall, a 2% annual growth in world imports is expected. Regarding China, it is expected to
remain first in dairy products imports and this will account for 20% of the world imports by
2024.

11
Regarding cheese production, it is anticipated that in the EU it will reach by 2024 11
million tons, which is 1,15 million tons more than in 2014, and from this quantity only
350.000 tons are expected to be exported. Overall, the EU cheese exports could reach in 2024
approximately 1 million tons and could constitute 40% of the cheese world trade. As a result
of the large amounts of cheese being produced, EU is the world main producer of whey
powder (WP). Its production is expected to increase by 20%, reaching 2.5 million tons in
2024. The EU enjoys a strong position in world trade as the amount of WP traded worldwide
is up to 60%.
Over half of the EU dairy products traded are in the form of powders, as they offer the
easiest and cheapest way of transporting milk. Skimmed Milk Powder (SMP) production is
expected to reach 1.6 million tons by 2024. The EU exports approximately 50% of SMP
produced and accounts for more than 30% of the world trade. In 2014, production volumes of
Whole Milk Powder (WMP) and exports were increased, after five years of continuous
decline. A further slight production increase is expected over the outlook up to 840.000 tons
in 2024.
By 2024, butter production is expected to increase by 9% compared to 2014. However,
the EU is not competitive in this sector on the world market, so export potential is generally
limited. Most of the additional production will be absorbed domestically.
With regards to fresh dairy products, such as drinking milk and yogurt, their production
stagnated during the last decade. However, an increase of 3% in production is expected over
the next 10 years, mainly due to dynamic exports and the increase in consumption of cream as
well. Yogurt consumption could rise noticeably in the EU-N13 EU, Member States which
joined in 2004 or later, where it is, currently, still at relatively low levels.
The per capita intake of liquid milk has declined in recent years. However, population
growth will limit the fall in total consumption. In 2013, China absorbed 120.000 tons of EU
liquid milk, i.e. more than 20 % of EU exports. It appears that China could be a long-term
market opportunity, and that demand may even strengthen. By 2024, EU exports of fresh
dairy products could reach 1.6 million tons, which would represent around 3% of EU
production (European Commission, 2014).
Despite the above encouraging forecasts for the global dairy trade, the international
demand on milk products during 2014 and the first semester of 2015 decreased due to the
import ban in Russia and China. The world milk price fell below 0.30 USD (i.e. 0.26 euro)/
per kg of milk (June 2015). This affects the milk production worldwide. Additionally, the EU
quota system abolition has pushed milk supply despite the current low prices. Prices are
expected to enter a recovery phase in late 2015/early 2016 (IFCN, 2015).
1.3. Domestic dairy market
Milk production, at European level, refers, mainly, to cow milk production. However, in
Greece things are quite different as the production of sheep and goat milk makes almost 60%
of the total milk production while the remaining 40% is cow milk. Interestingly, the majority
of the goat milk produced in Greece is used, blended with sheep milk, for the production of
most PDO Greek cheeses. At the same time, Greek goat milk is being systematically exported
and most importantly in an un-controlled way to France for the production of French PDO

12
goat milk cheeses. This is not surprising at all. France has since decades understood the
nutritional and technological superiority of goat milk for cheese production. More than 30%
of the French PDO cheeses are produced exclusively from goat milk, no matter French origin
or not. Unfortunately, this is not the case for the Greek dairy sector, despite the quantity and
quality of the goat milk produced in this country.
Greeks hold first place in the per capita consumption of cheese worldwide. In particular,
Feta plays an important role in the Greek diet and it is linked with the significant domestic
production of goat and sheep milk. Moreover, one important aspect of sheep and goat farming
is that it ensures income to people in mountainous and disadvantaged areas, where alternative
sources of income are needed (https://mahitotekmirio.wordpress.com/).
Along with Feta cheese, Greek yogurt is the 2nd flagship of the Greek dairy sector.
Moreover, “Greek Yogurt”, i.e. strained yogurt prepared from cow milk, is dynamically
emerging around the globe in recent years. In this sense, Greek yogurt deserves a deeper look
about its nutritional and economic value, i.e. a challenge for the growth of the Greek dairy
sector. At this point it should be mentioned that since 2013, “wild” lactic acid bacterial strains
isolated from naturally fermented Greek dairy products and belonging to the ACA-DC
Collection (http://www.aca-dc.gr/) of the Laboratory of Dairy Research at the Agricultural
University of Athens, are being commercialized all over the world for the production of Greek
Yogurt, both in Greece and abroad. This indigenous treasure of the traditional Greek dairy
products along with the Greek goat milk can and should act as the levers of the dairy sector of
this country in the near, and not only, future.
The dairy sector is highly ranked in the domestic food market and it includes some of
the country’s largest food industries. Interestingly, however, a significant number of small
and medium-size dairy units, which are mainly dedicated to cheese production, are also
operating. These units operate at a limited scale covering mainly the needs of the local
markets. On the contrary, large industries have modern facilities, organized distribution
network and offer a wider variety of products. These companies represent a large share of the
milk market almost throughout the country. The dairy industry is complemented by a
remarkable number of companies that import dairy products. Moreover, some production
companies are also importing dairy products so as to enrich the range of the products being
offered.
1.3.1. Size of domestic dairy production
The most recent data available about the economic volume and value of Greek food
sector date back to 2009 (Thomaidou, 2014). According to this, the Greek food industry
covers 18,9% (EU average 12,3%) of all enterprises in the processing sector and ranks 1st
among all processing industries. At the same time, it employs 20,3% (EU average 13,5%) of
all employees in the processing sector, ranking again 1st among all processing industries.
Moreover, food industry ranks 1st in terms of production value, namely 20,4% (EU average
13,8%), and Gross Value Added (GVA), namely19,7% (EU average 11,3%), and 2nd in terms
of turnover, namely 20,2% (EU average 13,5%), among all processing industries (Thomaidou,
2014). The milk processing enterprises, which comprise 5,2% of all food industries,
employs14,5% (11.802 employees) of the food industry's total workforce (81.392 employees).
Correspondingly, the milk processing sector, in relation to the food industry as a whole,
accounts for 17,3% of the production value (1.770 million euro), the 15,5% of the GVA (516
million euro) and the 20% of the turnover (2.217 million euro). Furthermore, in the milk

13
processing sector, the labor productivity (GVA per employee) is 51,2 euro, the labor cost is
30 euro per employee and the investment costs 11 euro per employee (Thomaidou, 2014).

14
1.3.1.1. Raw milk
Total primary production of all types of milk has, in recent years, a small downward
trend. Indeed, as shown in Table 1.1, the quantities of cow and goat milk decreases from 2008
onwards, with the exception of 2012 for cow milk and 2013 for goat milk. On the contrary,
the production of sheep milk is growing, surpassing in 2013 even the production of cow milk.
It is worth mentioning that although the production of cow milk is higher than the production
of sheep or goat milk separately, the quantities of the latter two types of milk together
exceeded by far cow milk production, fact that demonstrates their significant contribution to
the dairy sector in Greece.
Table 1.1. Domestic production of milk by type of milk (2008-2013)
(in tons; ICAP, 2014)
Year Cow milk Sheep milk Goat milk Total
2008 787.222 692.394 412.086 1.891.702
2009 755.279 724.843 411.695 1.891.817
2010 759.595 728.625 390.681 1.878.901
2011 752403 739.557 369.777 1.861.737
2012 765.451 721.029 347.362 1.833.842
2013 730.589 735.669 350.871 1.817.129
Table 1.2. Incoming cow, sheep and goat milk (2008-2014)
(in tons; ELOGAK, 2015)
Year Cow milk Sheep milk Goat milk Total
2008 705.201 514.056 149.617 1.368.874
2009 685.000 546.693 156.756 1.388.449
2010 673.901 569.336 154.843 1.398.080
2011 641.767 539.120 135.519 1.316.406
2012 639.129 514.641 118.131 1.271.901
2013 608.533 538.627 125.731 1.272.891
2014 616.753 560.428 131.487 1.308.668
In Table 1.2, the evolution of incoming cow, sheep and goat milk is imprinted. At this
point it should be mentioned that as incoming milk is considered the quantity of milk
delivered in the processing units. The quantities of all types of milk and, hence, the total
production, fluctuated between 2008 and 2014. However, in 2014 the total production was the
highest during the last three years, reaching 1.308.668 tons.

15
1.3.1.2. Drinking milk
High-temperature pasteurized milk is the main competitive product of pasteurized milk.
This fact is reflected in Table 1.3 as it appears that the production of pasteurized milk is
decreasing continuously since 2010 while high-temperature pasteurized milk has an upward
trend from 2008 to 2012.
Table 1.3. Total domestic production of pasteurized milk, high- temperature pasteurized milk, UHT (Ultra High
Pasteurized) milk, condensed milk and various milk drinks (2008-2014) (in tons; ICAP, 2014)
Year Pasteurized
milk
High-temperature
pasteurized milk
UHT
milk
Condensed
milk
Various milk
drinks
2008 338.984 116.335 2.800 23.467 57.649
2009 340.679 126.004 3.000 22.570 52.101
2010 336.069 125.225 4.300 21.255 45.827
2011 329.855 138.139 5.000 20.456 38.051
2012 324.106 164.309 4.900 11.508 54.215
2013 284.156 157.262 5.500 8.138 49.652
2014 (forecast) 295.000 146.000 5.000 7.000 46.000
The temporal decrease in production of pasteurized milk is mainly associated with the
parallel increase of high-temperature pasteurized milk, which is easier to distribute, store and
manage due to longer shelf life, i.e. can be stored in the freeze not open for 21-40 days or 4
days after opening. It is worth mentioning that a relatively small number of large-size
companies are involved in the production of pasteurized milk as the costs of transportation
and delivery are high, due to short shelf-life. Hence, the small production units serve mainly
the local market of the region where they operate.
The production volume of UHT (Ultra High Pasteurized) milk is very low compared to
other categories of milk. It is kept at room temperature for a long time. This specific type of
milk is used mostly by various professionals, e.g. restaurants, hotels etc. Domestic production
in recent years ranged between 5.000-5.500 tons (Table 1.3). Regarding condensed milk, the
total domestic production declined in recent years, recording significant drop from 2012
onwards. Moreover, the production of various milk drinks, such as chocolate milk and milk
with coffee or strawberry flavor, showed fluctuations in recent years.
1.3.1.3. Yogurt, butter, cream and sour milk
Yogurt has a significant position in the Greek dairy industry. It ranks first in exports of
the Greek dairy industry. However, as Table 1.4 presents the domestic production of yogurt
showed a gradual decline from 2008 to 2010. The next two years, namely 2011-2012,
production stagnated close to 95.000 tons. Interestingly, in 2013, signs of recovery appeared
and the production volume amounted 98.100 tons.
16
Table 1.4. Domestic production of industrial yogurt, butter, cream and sour milk from 2008 to 2014
(in tons; ICAP, 2014)
Year Industrial yogurt Butter Cream Sour milk
2008 102.289 1.200 8.400 7.679
2009 97.147 1.106 8.500 6.555
2010 95.307 1.093 8.500 6.628
2011 95.868 1.014 8.300 6.216
2012 95.648 1.341 9.300 6.208
2013 98.109 1.132 10.000 5.072
2014 (forecast) 102.000 1.200 10.500 4.500
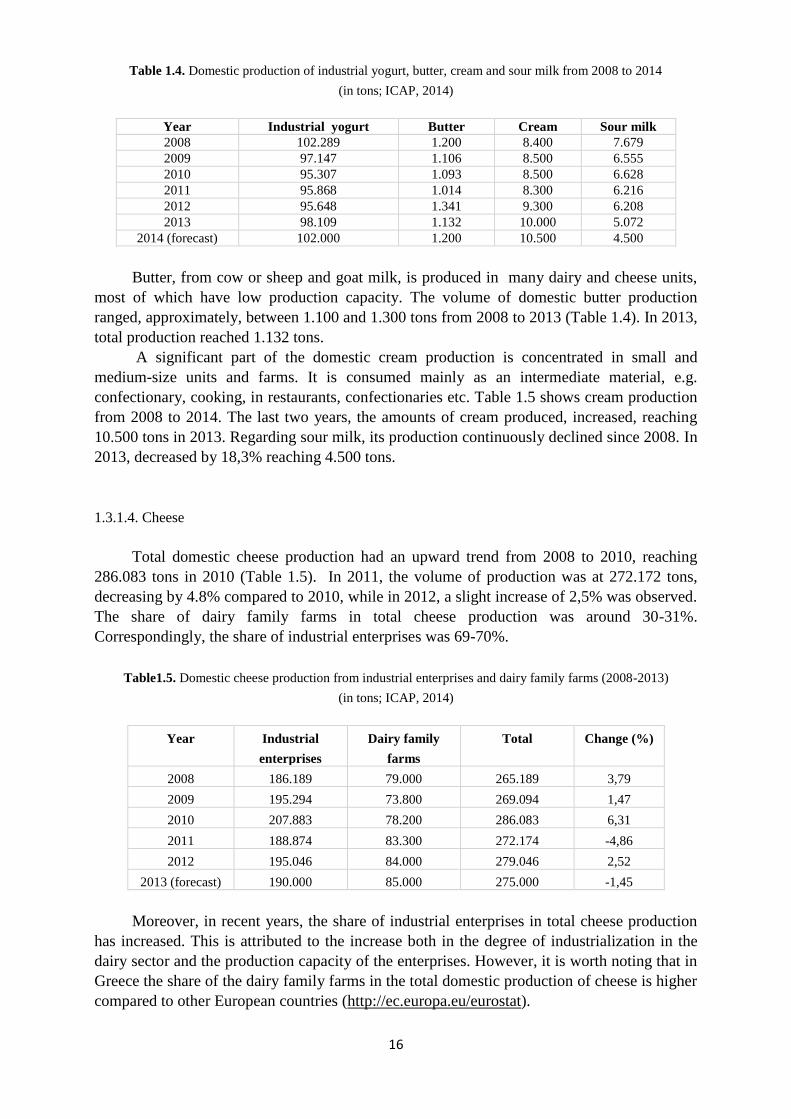
Butter, from cow or sheep and goat milk, is produced in many dairy and cheese units,
most of which have low production capacity. The volume of domestic butter production
ranged, approximately, between 1.100 and 1.300 tons from 2008 to 2013 (Table 1.4). In 2013,
total production reached 1.132 tons.
A significant part of the domestic cream production is concentrated in small and
medium-size units and farms. It is consumed mainly as an intermediate material, e.g.
confectionary, cooking, in restaurants, confectionaries etc. Table 1.5 shows cream production
from 2008 to 2014. The last two years, the amounts of cream produced, increased, reaching
10.500 tons in 2013. Regarding sour milk, its production continuously declined since 2008. In
2013, decreased by 18,3% reaching 4.500 tons.
1.3.1.4. Cheese
Total domestic cheese production had an upward trend from 2008 to 2010, reaching
286.083 tons in 2010 (Table 1.5). In 2011, the volume of production was at 272.172 tons,
decreasing by 4.8% compared to 2010, while in 2012, a slight increase of 2,5% was observed.
The share of dairy family farms in total cheese production was around 30-31%.
Correspondingly, the share of industrial enterprises was 69-70%.
Table1.5. Domestic cheese production from industrial enterprises and dairy family farms (2008-2013)
(in tons; ICAP, 2014)
Year Industrial
enterprises
Dairy family
farms
Total Change (%)
2008 186.189 79.000 265.189 3,79
2009 195.294 73.800 269.094 1,47
2010 207.883 78.200 286.083 6,31
2011 188.874 83.300 272.174 -4,86
2012 195.046 84.000 279.046 2,52
2013 (forecast) 190.000 85.000 275.000 -1,45
Moreover, in recent years, the share of industrial enterprises in total cheese production
has increased. This is attributed to the increase both in the degree of industrialization in the
dairy sector and the production capacity of the enterprises. However, it is worth noting that in
Greece the share of the dairy family farms in the total domestic production of cheese is higher
compared to other European countries (http://ec.europa.eu/eurostat).

17
1.3.2. Size of domestic dairy market
1.3.2.1. Drinking milk
Pasteurized cow milk is the most important category both in terms of quantity and
value. Domestic production of fresh pasteurized cow milk covers the needs of Greek market,
while imports and exports are limited. Pasteurized milk production, and respectively the
domestic consumption, is reducing continuously since 2010, as mentioned previously (Table
1.3). In 2012, the domestic production reached 324.106 tons, while in 2013 decreased even
more amounting 284.156 tons. According to market estimates, the largest part of total sales of
pasteurized milk is performed via supermarkets, while small points of sale, such as
neighborhood dairies, participate with a valuable percentage, about 25-30%. The value, in
wholesale prices, of pasteurized milk was estimated at 285 million euro for 2013.
High-temperature pasteurized milk has higher profit margins, since its technical
characteristics allow more appropriate planning of stores supplies. Moreover, the distribution
chain management is less costly. Domestic consumption of high-temperature pasteurized milk
increased between 2008 and 2011. In 2013, the quantities consumed amounted 255.000 tons
(Table 1.6). The value, in wholesale prices, of high-temperature pasteurized milk market was
estimated at 280 million euro for 2013.
Table 1.6. Domestic high-temperature pasteurized milk market (2008-2014)
(in tons; ICAP 2014)
Year Consumption
2008 235.200
2009 248.300
2010 255.000
2011 260.000
2012 240.000
2013 255.000
2014 (forecast) 248.000
Despite the dynamic growth of domestic production of high-temperature pasteurized
milk, an important part of the marketed quantity is imported. Moreover, it should be
mentioned that in recent years, private label products have a strong presence in this category
of milk with a continuously growing market share. Some of them are produced abroad on
behalf of super-market chains. The share of private label products is estimated, in retail
market, around 20-25%.
Regarding UHT milk, consumption shows fluctuations since 2008 (Table 1.7),
amounting 22.600 tons in 2013. Most of the domestic demand relates to the professional use,
about 2/3, while the rest is traded through retail stores for domestic use. Moreover, domestic
demand for UHT milk is covered, mainly, by imports. The degree of import penetration is
formed, overtime, in high levels, reaching 77-80% over the last two years. The value of this
market is estimated to have reached the level of 21 million euro at wholesale prices in 2013.
Table 1.7. Domestic UHT milk market (2008-2014)

18
(in tons; ICAP 2014)
Year Production Imports Exports Apparent consumption
2008 2.800 20.990 83 23.707
2009 3.000 21.500 300 24.200
2010 4.300 25.000 500 28.800
2011 5.000 21.000 400 25.600
2012 4.900 19.000 350 23.550
2013 5.500 17.500 400 22.600
2014 (forecast) 5.000 17.000 350 21.650
The total domestic market of condensed milk is presented in Table 1.8. In particular,
this category includes evaporated and sweetened milk, which is consumed in very small
quantities, and it is mainly imported. The significant reduction that is observed in the size of
the apparent consumption since 2011 comes mainly from the decrease in the professional
consumption, e.g. confectioneries, cafes, as the consumption in retail, i.e. supermarkets, does
not present variations on annual basis. In 2013, the value of condensed milk market, in
wholesale prices, is estimated that reached 200 million euro, including the quantities available
at retail, i.e. super markets, and those distributed to caterers.
Table 1.8. Domestic condensed milk market (2008-2014)
(in tons; ICAP, 2014)
Year Production Imports Exports Apparent consumption
2008 23.467 100.363 1.961 121.869
2009 22.570 99.004 1.686 119.888
2010 21.255 110.0001 1.140 130.115
2011 20.456 126.000 1.280 145.176
2012 11.508 120.000 1.400 130.108
2013 8.138 94.500 1.100 101.538
2014 (forecast) 7.000 94.000 1.000 100.000
1.3.2.2. Yogurt, butter, cream and sour milk
Total domestic yogurt consumption has shown downward trend in recent years (Table
1.9). In 2013, yogurt consumption was estimated at 80.000 tons, i.e. -3,8% compared to 2012.
Domestic production covers the largest part of the demand. According to estimates, the share
of private label product in retail market (traded through super-markets chains) is notable and
estimated at around 13-15%. The value in wholesale prices of domestic yogurt market is
estimated at approximately 220 million euro in 2013.
Table 1.9. Domestic yogurt market (2008-2014)
(in tons; ICAP, 2014)

19
Year Production Imports Exports Apparent consumption
2008 102.289 13.411 23.468 92.232
2009 97.147 14.565 22.015 89.697
2010 95.307 14.996 23.087 87.216
2011 95.868 14.674 24.924 85.618
2012 95.648 15.425 27.849 83.224
2013 98.109 16.262 34.320 80.051
2014 (forecast) 102.000 16.600 40.000 78.600
The domestic butter market is prevailed by imports (90%) and shows small annual
fluctuations. In recent years, the volume of consumption varied between 10.000-11.000 tons
(Table 1.10). “Professional butter use”, i.e. bulk butter in boxes, melted or condensed, used by
various professionals, covers more than 80% of total domestic consumption. Butter for retail
is available, mainly, through supermarkets and covers a small proportion of the total domestic
consumption. According to estimates, the total value of domestic butter market fluctuated in
the amount of 55 million euro in 2013 in wholesale prices.
Table 1.10. Domestic butter market (2008-2014)
(in tons; ICAP, 2014)
Year Production Imports Exports Apparent consumption
2008 1.200 10.280 270 11.210
2009 1.106 10.429 59 11.476
2010 1.093 9.628 156 10.565
2011 1.014 11.086 127 11.973
2012 1.341 8.919 101 10.159
2013 1.132 10.088 326 10.894
2014 (forecast) 1.200 10.500 350 11.350
The apparent cream consumption ranges at 35.000-36.000 tons since 2012 (Table 1.11).
Approximately, 80-85% of the total consumption is related to processing/professional use
while the remaining part is directed to retail. The total value of domestic cream market was,
according to estimates, €70 million (in wholesale prices), in 2013.

20
Table 1.11. Domestic cream market (2008-2014)
(in tons; ICAP, 2014)
Year Production Imports Exports Apparent consumption
2008 8.400 15.417 262 23.555
2009 8500 28.099 1.238 35.361
2010 8.500 31.241 524 39.217
2011 8.300 37.898 241 45.957
2012 9.300 26.707 462 35.545
2013 10.000 26.713 815 35.898
2014 (forecast) 10.500 26.800 850 36.450
The category sour milk and milk-based drinks, includes products, such as sour milk
(plain and with fruit juices), drinks based on milk and yogurt (or yogurt culture) with added
fruit juices or flavor, flavored milk and drinks based on milk ingredients and flavor or fruit
juice.
Table 1.12. Domestic sour milk and milk-based drinks market (2008-2014)
(in tons; ICAP, 2014)
Year Production Imports Exports Apparent consumption
2008 7.679 6.545 404 13.820
2009 6.555 7.116 990 12.681
2010 6.628 4.992 2.925 8.695
2011 6.216 2.759 797 8.178
2012 6.208 1.998 893 7.313
2013 5.072 1.610 678 6.004
2014 (forecast) 4.500 1.500 650 5.350
The total domestic market of drinks based on milk records a downward trend since
2008. In particular, in 2013 domestic consumption was estimated at about 6.000 tons (Table
1.12). Furthermore, it is noteworthy that imports cover a significant part of the total
consumption. The value of this particular market is estimated in wholesale prices at around 7
million euro in 2013.
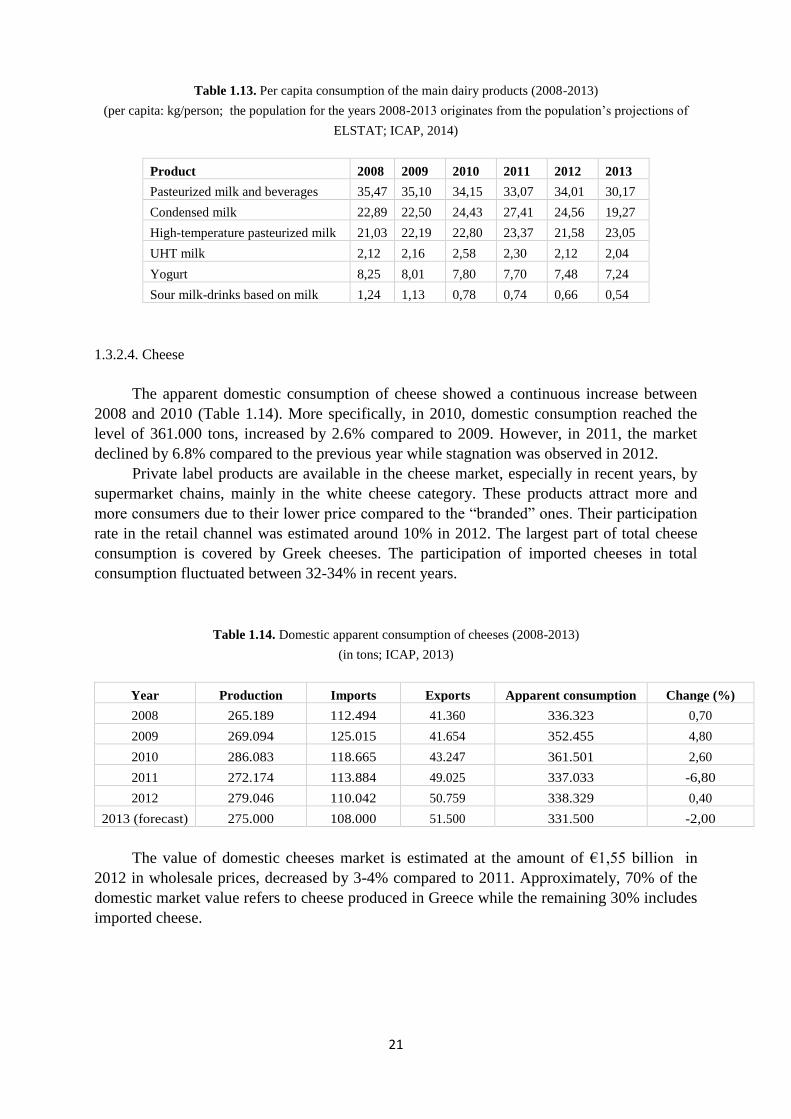
1.3.2.3. Per capita consumption of main dairy products
Table 1.13 presents the per capita consumption of the main dairy products, i.e. all types
of milk, yogurt, sour milk and drinks based on milk. However, butter and cream are not
included as their biggest part is available in processing companies for professional use.
Moreover, in order to calculate the per capita consumption of condensed milk, the quantities
were converted into equivalent quantities of drinking milk at a rate of 2.1.
Pasteurized milk ranks by far first in the consumption (kg/person) of the main dairy
products and is followed by condensed milk and high-temperature pasteurized milk. The per
capita yogurt consumption shows a continuous decline from 2008 to 2013, reaching in 2013
7,24 kg/person.
21
Table 1.13. Per capita consumption of the main dairy products (2008-2013)
(per capita: kg/person; the population for the years 2008-2013 originates from the population’s projections of
ELSTAT; ICAP, 2014)
Product 2008 2009 2010 2011 2012 2013
Pasteurized milk and beverages 35,47 35,10 34,15 33,07 34,01 30,17
Condensed milk 22,89 22,50 24,43 27,41 24,56 19,27
High-temperature pasteurized milk 21,03 22,19 22,80 23,37 21,58 23,05
UHT milk 2,12 2,16 2,58 2,30 2,12 2,04
Yogurt 8,25 8,01 7,80 7,70 7,48 7,24
Sour milk-drinks based on milk 1,24 1,13 0,78 0,74 0,66 0,54
1.3.2.4. Cheese
The apparent domestic consumption of cheese showed a continuous increase between
2008 and 2010 (Table 1.14). More specifically, in 2010, domestic consumption reached the
level of 361.000 tons, increased by 2.6% compared to 2009. However, in 2011, the market
declined by 6.8% compared to the previous year while stagnation was observed in 2012.
Private label products are available in the cheese market, especially in recent years, by
supermarket chains, mainly in the white cheese category. These products attract more and
more consumers due to their lower price compared to the “branded” ones. Their participation
rate in the retail channel was estimated around 10% in 2012. The largest part of total cheese
consumption is covered by Greek cheeses. The participation of imported cheeses in total
consumption fluctuated between 32-34% in recent years.
Table 1.14. Domestic apparent consumption of cheeses (2008-2013)
(in tons; ICAP, 2013)
Year Production Imports Exports Apparent consumption Change (%)
2008 265.189 112.494 41.360 336.323 0,70
2009 269.094 125.015 41.654 352.455 4,80
2010 286.083 118.665 43.247 361.501 2,60
2011 272.174 113.884 49.025 337.033 -6,80
2012 279.046 110.042 50.759 338.329 0,40
2013 (forecast) 275.000 108.000 51.500 331.500 -2,00
The value of domestic cheeses market is estimated at the amount of €1,55 billion in
2012 in wholesale prices, decreased by 3-4% compared to 2011. Approximately, 70% of the
domestic market value refers to cheese produced in Greece while the remaining 30% includes
imported cheese.

22
1.3.2.5. Per capita consumption of cheeses
The apparent domestic cheese consumption records, generally, an upward trend, ranging
in 30 kilos per person in recent years (Table 1.15). However, data are not fully comparable as
the population data for 2011-2012 are based on the ELSTAT 2011 census (population
projections) while for the previous years on the ELSTAT 2001 census.
Table 1.15. .Per capita consumption of cheeses (2008-2012) (ICAP, 2013)
Year Cheese consumption (Kg/person)
2008 29,99
2009 31,3
2010 31,98
2011 29,8
2012 29,97
In Table 1.16, the per capita consumption of cheese, per product category, is presented.
Regarding cheeses of domestic production, the category including ‘Feta, Telemes, Soft
Cheeses’ shows overtime and by far the highest per capita consumption. The category
‘Kefalotyri, Kaseri, Semi-Hard, Gravieres’ ranks second.
In 2012, the purchase of standardized cheeses was estimated at 44.000 tons, covering
13% of the total cheese consumption, which was nevertheless 8% than the sales of 2011. The
advantages of standardized products in comparison to unpacked ones concern aspects, such as
practicality, safety and time saving. The standardized products' prices are higher than those of
the unpacked ones, which justifies the decline in these products' consumption in 2012 (ICAP,
2013).
Table 1.16. Per capita consumption of cheese per product category (2008-2012) (ICAP, 2013)
.
1.3.3. External trade of dairy products
Category 2008 2009 2010 2011 2012
Cheeses of domestic production (kg/person)
Feta, Telemes, Soft Cheeses 13,97 13,86 14,11 14,16 14,2
Kefalotyri, Kaseri, Semi-Hard, Gravieres 3,63 3,97 4,89 3,39 4,22
Whey cheeses 2,33 2,35 2,47 2,16 1,97
Melted cheeses 0,02 0,02 0,02 0,02 0,02
Total A 19,96 20,20 21,48 19,73 20,22
Imported cheeses (kg/person)
Semi-Hard (Gouda, Edam, Emmental etc) 5,27 5,79 5,56 5,48 4,78
Hard (Grana, Regato) 2,71 2,79 2,57 2,44 3,19
Other (Blue Cheese, Roqueford, Grated, Melted, Cheese toast) 0,84 1,26 1,09 0,84 0,73
Soft and cream cheese 1,22 1,26 1,28 1,31 1,05
Total B 10,03 11,10 10,50 10,07 9,75
Total of domestic consumption 29,99 31,30 31,98 29,80 29,97

23
1.3.3.1. Imports evolution
Total imports (in quantity) of dairy products showed an upward trend in 2008-2010.
After a temporal decline in 2011-2012, a slight increase by 1,6% was observed in 2013 (Table
1.17). The value of imports amounted 357,8 million euro in 2013, compared to 329,6 million
euro in 2012 (8,5% increase). Concerning the countries the products were imported from,
Germany covered 47,8% of the total imported quantities, followed by the Netherlands
(12,3%) and Hungary (9,1%) (ICAP, 2014).
Table 1.17. Imports of dairy products by category (2008-2013)
(in tons;1provisional data; ICAP, 2014)
Product category 20081 20091 20101 20111 20121 20131
Total milk 260.638 263.902 331.290 301.829 238.674 239.242
Sour milk (UHT) 15.417 28.099 31.241 37.898 26.707 26.713
Total yogurt 13.411 14.565 14.996 14.674 15.425 16.262
Other fresh milk products 6.545 7.116 4.992 2.759 1.998 1.610
Whey and other products 8.463 7.952 6.742 6.547 6.499 9.125
Total butter 10.280 10.429 9.628 11.086 8.919 10.088
Grand Total 314.755 332.063 398.890 374.793 298.222 303.130
Cheeses imports, in quantity, showed, in general, a continuous upward trend in previous
years (Table 1.18), reaching in 2009 125.015 tons. However, the three last years they declined
(-4% in 2011/2010 and -3,4% in 2012/2011) down to110.000 tons in 2012. The value of total
imports reached 406,5 million euro in 2011 and 391,4 million euro in 2012, reduced by 3,7%.
Regarding imports by cheese type, the biggest volume regards “semi-hard cheeses” followed
by “hard cheeses” and “soft cheeses”. Concerning the countries the cheeses were imported
from, Germany covered 32,9% and the Netherlands 30,1% of imports (ICAP, 2013).
Table1.18. Imports of cheeses by category
(in tons; 1provisional data; ICAP, 2013)
Cheese type 20081 20091 20101 20111 20121
Semi-hard cheeses 59.069 65.228 62.846 61.924 53.914
Hard cheeses 30.356 31.428 29.096 27.630 35.972
Soft cheeses 13.650 14.138 14.455 14.844 11.883
Other cheeses 9.419 14.221 12.268 9.486 8.273
Total imports 112.494 125.015 118.665 113.884 110.042
1.3.3.2. Exports evolution
Exports of dairy products showed fluctuation during 2008-2013 (Table 1.19). In 2013,
the quantities exported, amounted to 46.672 tons (increased by 21.4% compared to 2012),
presenting the highest value in the last six years. Concerning the countries the products were

24
exported to, the United Kingdom absorbed the 18,3% of the exports, followed by Italy
(17,7%), Bulgaria (11,6%) and Cyprus (8,2%) (ICAP, 2014).
Table 1.19. Exports of dairy products by category (2008-2013)
(in tons; 1provisional data; ICAP, 2014)
Product category 20081 20091 20101 20111 20121 20131
Total quantity of milk 2.602 3.144 3110 2.924 2.660 2.954
Sour milk (UHT) 262 1.238 524 241 462 815
Total quantity of yogurt 23.468 22.015 23.087 24.924 27.849 34.320
Other fresh milk products 404 990 2.925 797 893 678
Whey and other products 5.060 13.565 11.822 10.095 6.474 7.579
Butter 270 59 156 127 101 326
Grand total 32.066 41.011 41.624 39.108 38.439 46.672
Yogurt ranks first in the dairy sector exports. Indeed, yogurt exports (Table 1.19)
showed an upward trend over the period 2010-2013, reaching in 2013 34.320 tons. This
particular year, exports reached a top and won 73.5% of the total dairy exports share.
Cheeses exports (Table 1.20) have enduring rise in recent years. More specifically, in
2012, total exported quantities amounted 50.759 tons, showing an annual increase of 3.5%.
The category “Feta and Telemes” had the largest share of exports accounting 68.5% of the
total exports in 2012. The second largest category, based on exports volume, is “hard and
semi-hard cheeses”. This category includes Graviera, Kefalograviera, Kefalotiri and Pecorino
type cheeses. Exports of these products accounted 16.4% of the total cheese exported
quantities in 2012. “Fresh whey cheeses”, which mainly, include Anthotyro and Myzithra and
“other fresh cheeses”, mainly Manouri, accounted for only 1.7% of the total exports in 2012.
The value of exports amounted 237.5 million euro in 2011 and 274 million euro in 2012,
increasing thus by 15.4%. . Concerning the countries the cheeses were exported to, Germany
absorbed 32% of the exports, followed by the United Kingdom (12,2%), Cyprus (11,3%) and
Italy (9,2%) (ICAP, 2013).

25
Table 1.20. Exports of cheeses by category
(in tons; 1provisional data; ICAP, 2013)
Year 20081 20091 20101 20111 20121
Feta and Telemes 28.773 29.469 32.963 34.029 34.766
Hard and semi-hard cheeses 9.158 8.810 7.614 11.473 8.339
Whey fresh cheeses and other fresh cheeses 521 556 698 675 869
Other cheeses 2.908 2.819 1.972 2.848 6.785
Total exports 41.360 41.654 43.247 49.025 50.759
1.4. The demand for dairy products and cheeses
1.4.1. General characteristics of the demand
Dairy products are a staple food for the Greeks as they are consumed on a daily basis.
Hence, there is relatively low elasticity regarding selling prices and available consumers’
income. However, in recent years, consumers’ choices are significantly influenced by the
price of the various brand products available in the market. Also, the demand for dairy
products is affected by the availability of competing and substitute products that are offered at
a lower price. Further factors that affect consumers include:
Specific features of products, e.g. taste, quality, nutritional value, shelf-life, packaging
etc.
Easy access to sales points
Technological development and improvement, e.g. high- temperature pasteurized milk
is, for example, easier to be transferred to remote geographical areas. With regards to
cheese, the demand is higher for low fat cheeses or with less salt.
Modern lifestyle and healthy diet, e.g. probiotic yogurt, functional dairy products, low
calorie cheese
Advertisement, which greatly influences the demand attracting consumers towards
specific brands or new types of products.
Age profile of the population, e.g. certain types of dairy products are being primarily
consumed by younger people, e.g. chocolate milk, and children
An important trend in the food marketplace is the growing penetration of private label
products, which is expected to grow further in the near future. The primary advantage of
private label products is the price, which is lower than this of the brand-name products. This
revulsion is mostly attributed to the consumers' reduced purchasing capacity due to the
economic crisis. Moreover, the consumers consider these products are of quality and not at all
disadvantages compared to the respective brand-name ones. Particularly in the dairy sector,
the preference towards private-label products concerns mainly yogurt and UHT milk,
produced either in Greece or abroad. On the contrary, the penetration of private label products
is not easy in some dairy products' categories, such as "fresh" pasteurized milk, due to the
products' short expiration date and the consumers' preference towards the brand-name ones in
this category.

26
Table 1.21. Price index of consumer of dairy products and cheeses (2008-2013)
(Base year 2009-100; ICAP, 2013)
Product 2008 2009 2010 2011 2012 2012
(first 7 months)
2013
(first 7 months)
Feta 97,91 100,00 101,78 103,06 104,19 103,86 105,43
Hard cheeses 101,76 100,00 101,22 104,84 106,04 106,18 105,96
Pasteurized milk 109,24 100,00 98,15 104,52 108,00 108,10 107,88
Chocolate milk 99,29 100,00 99,83 103,56 104,91 105,06 105,91
Preserved milk 100,00 100,00 100,8 101,39 101,91 101,83 99,45
Yogurt 100,87 100,00 96,48 98,00 100,83 100,49 102,32
Other dairy products 99,30 100,00 97,62 97,71 98,07 98,43 96,58
Butter 98,64 100,00 100,83 104,92 107,18 107,59 105,60
Food and non-alcoholic
beverages
98,13 100,00 100,06 103,18 104,73 104,99 105,49
The price index of consumer, which is presented in Table 1.21, increased in almost all
categories of products during 2010-2012. Pasteurized milk and yogurt recorded the biggest
rise in 2012 compared to 2011, namely 3.3% and 2.9%, respectively.
The category “other dairy products” includes cream, whipped cream and desserts based
on milk. Moreover, it should be mentioned that a key feature of cheeses demand is that the
consumers’ choices are based mainly on the type, category or geographical area of origin of
cheese and less on a specific company brand.
1.4.2. Average monthly households’ expenditure for dairy products and cheeses
Table 1.24 presents the average monthly households’ total expenditure, the food
expenditure and the total expenditure for dairy products and cheeses. The total expenditure,
on a monthly basis, declined from 2008 to 2014, almost by 30%. However, this significant
drop is not observed in food expenditure and total expenditure for dairy products and cheese
as in this case was a decrease of only 13%.
It is worth mentioning that the share of the total expenditure for dairy products and
cheese in the food expenditure has remained almost stable between 2008 and 2014, ranging
from 17% to 18%, fact that is justified by the important position of dairy products and cheeses
in the Greeks’ dietary habits.

27
Table 1.22. Average monthly households’ total expenditure (in euro), expenditure for food, dairy products and
cheeses and % share of dairy products and cheeses in food expenditure (2008-2014)
(ELSTAT: Family Planning, 2008-2014)
Year Total
expenditure
Food
expenditure
Total expenditure for
dairy products and cheeses
% share of dairy products and
cheeses in food expenditure
2008 2.117,67 326,71 59,36 18,17
2009 2.065,11 335,38 59,15 17,64
2010 1.956,42 330,81 56,88 17,19
2011 1.824,02 334,51 58,16 17,39
2012 1.637,10 311,60 55,52 17,82
2013 1.509,39 290,96 52,45 18,03
2014 1.460,52 283,90 51,23 18,04
The average monthly expenditure per household, for specific categories of dairy
products, is shown in Table 1.25. The largest part of the expenditure relates to the purchase of
pasteurized milk by far while the expenditure for yogurt is, also, high compared to the other
dairy products.
Table 1.23. Average monthly households’ expenditure (in euro) for dairy products, by category (2008-2014)
(ELSTAT: Family Planning, 2008-2014)
Year Dairy products
expenditure
Pasteurized
milk
Condensed and
powdered milk
Yogurt Other dairy
products
Butter
2008 30,98 15,43 5,04 7,56 2,41 0,55
2009 30,23 14,49 4,99 7,90 2,32 0,53
2010 28,32 13,31 4,40 7,72 2,28 0,59
2011 28,78 13,94 4,20 7,76 2,18 0,71
2012 27,78 14,30 3,74 7,22 1,90 0,63
2013 26,53 13,63 3,25 7,08 1,89 0,68
2014 26,96 13,78 3,45 7,45 1,56 0,72
The average households’ expenditure for purchasing cheeses, on monthly basis, is listed
in Table 1.26. Between 2008 and 2014, the amount of money spent by households has
reduced, reaching in 2014 its lowest level (24,27 euro per month).
The households’ expenditure is related, primarily, to purchasing soft cheeses and
secondarily hard cheeses. The average monthly expenditure for low-fat cheeses, during this
period, is very low. However, the three last years (2012-2014), the purchase value increased.
Table 1.24. Average monthly households’ expenditure (in Euro) for cheeses, by category (2008-2014)
(ELSTAT: Family Planning, 2008-2014)

28
Year Cheeses expenditure Soft cheeses Hard cheeses Low-fat cheeses
2008 28,38 16,10 11,45 0,82
2009 28,92 16,34 11,64 0,93
2010 28,56 15,75 11,83 0,99
2011 29,38 16,40 11,96 1,02
2012 27,74 15,69 11,28 0,77
2013 25,92 14,57 10,53 0,83
2014 24,27 13,77 9,57 0,93
1.4.3. Analysis of the consumers’ questionnaire
In the context of the present study, a questionnaire was constructed aiming at
investigating and recording current preferences and expectations of consumers with regards to
dairy products. A total of 83 questionnaires were filed based on either on-line or in-person
responses. Although the sample cannot be considered representative, some interesting
findings came up.
In particular, 60% consume pasteurized cow milk. Although 76,3% had never drunk
goat milk, 2,5% consume goat milk on a daily basis. Moreover, 56,8% purchase milk
produced from small local dairy units, while 10% choose private label milk. Interestingly,
75,6% do not choose milk with added bioactive (functional) components (Figure 1.1).
Figure 1.1. Consumption of milk with added bioactive components
With regards to yogurt, 65,8% of the consumers prefer strained yogurt (Figure 1.2a).
Moreover, 66,7% do not consume yogurt enriched with beneficial bacteria (probiotic), 50%
prefer yogurt made from cow milk and 50% purchase yogurt produced by small local dairy
units (Figure 1.2b) and 70% have never consumed sour milk.

29
Figure 1.2. Yogurt consumption (a) per type of yogurt and (b) per type of production unit
Regarding cheese, 53% consume traditional Greek cheeses, 45,8% consume Greek and
imported cheeses while only 1,2% exclusively choose imported cheeses. As expected, Feta
cheese ranks first (60% of consumers) followed by Graviera, Kefalotyri and Kasseri.
Interestingly, 58,5% consume cheese made from goat milk at least 1-2 times per month
(Figure 1.3a). Moreover, 62% are willing to pay more for a traditional Greek cheese from
goat milk (Figure 1.3b) while 59,2% believe that goat milk cheeses are more beneficial to
human health compared to cow or sheep milk ones (Figure 1.3c). Finally, 60% of the
consumers are interested in the product traceability, i.e. geographical area of origin,
production date, details of the producer etc., while 90% are interested both in the quality
assurance systems of manufacturing and the quality standards certification of the dairy
products.
Figure 1.3. Cheese consumption (a) goat milk cheeses, (b) willingness to pay more for traditional goat
milk cheeses and (c) cheese health benefits assumption per type of milk used.
30
Chapter 2. The small, family dairies in Greece: an overview
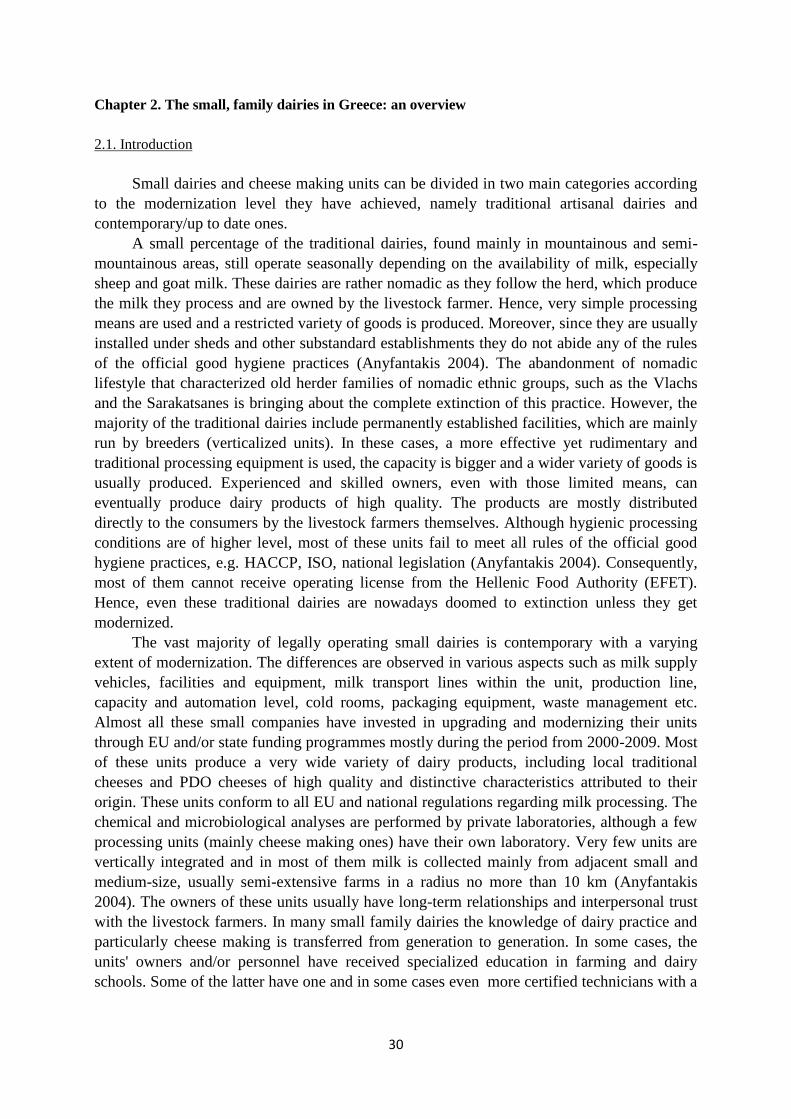
2.1. Introduction
Small dairies and cheese making units can be divided in two main categories according
to the modernization level they have achieved, namely traditional artisanal dairies and
contemporary/up to date ones.
A small percentage of the traditional dairies, found mainly in mountainous and semi-
mountainous areas, still operate seasonally depending on the availability of milk, especially
sheep and goat milk. These dairies are rather nomadic as they follow the herd, which produce
the milk they process and are owned by the livestock farmer. Hence, very simple processing
means are used and a restricted variety of goods is produced. Moreover, since they are usually
installed under sheds and other substandard establishments they do not abide any of the rules
of the official good hygiene practices (Anyfantakis 2004). The abandonment of nomadic
lifestyle that characterized old herder families of nomadic ethnic groups, such as the Vlachs
and the Sarakatsanes is bringing about the complete extinction of this practice. However, the
majority of the traditional dairies include permanently established facilities, which are mainly
run by breeders (verticalized units). In these cases, a more effective yet rudimentary and
traditional processing equipment is used, the capacity is bigger and a wider variety of goods is
usually produced. Experienced and skilled owners, even with those limited means, can
eventually produce dairy products of high quality. The products are mostly distributed
directly to the consumers by the livestock farmers themselves. Although hygienic processing
conditions are of higher level, most of these units fail to meet all rules of the official good
hygiene practices, e.g. HACCP, ISO, national legislation (Anyfantakis 2004). Consequently,
most of them cannot receive operating license from the Hellenic Food Authority (EFET).
Hence, even these traditional dairies are nowadays doomed to extinction unless they get
modernized.
The vast majority of legally operating small dairies is contemporary with a varying
extent of modernization. The differences are observed in various aspects such as milk supply
vehicles, facilities and equipment, milk transport lines within the unit, production line,
capacity and automation level, cold rooms, packaging equipment, waste management etc.
Almost all these small companies have invested in upgrading and modernizing their units
through EU and/or state funding programmes mostly during the period from 2000-2009. Most
of these units produce a very wide variety of dairy products, including local traditional
cheeses and PDO cheeses of high quality and distinctive characteristics attributed to their
origin. These units conform to all EU and national regulations regarding milk processing. The
chemical and microbiological analyses are performed by private laboratories, although a few
processing units (mainly cheese making ones) have their own laboratory. Very few units are
vertically integrated and in most of them milk is collected mainly from adjacent small and
medium-size, usually semi-extensive farms in a radius no more than 10 km (Anyfantakis
2004). The owners of these units usually have long-term relationships and interpersonal trust
with the livestock farmers. In many small family dairies the knowledge of dairy practice and
particularly cheese making is transferred from generation to generation. In some cases, the
units' owners and/or personnel have received specialized education in farming and dairy
schools. Some of the latter have one and in some cases even more certified technicians with a

31
specialization in dairy processing (university degree) (Goussios et al. 2014). Some of the
aforementioned small processing companies have a cooperative status.
Small dairy enterprises process both bovine (cow and water buffalo) and small
ruminants (sheep and goat) milk. Therefore most of them produce a wide and diverse range of
dairy products, including traditional and PDO cheeses made from sheep and goat milk,
including Feta cheese.
Small-size companies trade their products directly, mainly through the local and
secondly to the regional market (retailers, super-markets and catering companies e.g. hotels,
taverns, restaurants and pastry shops) or collaborate with networks of representatives,
intermediaries and wholesalers. Interestingly, trading via own contacts and loyal customers
brings higher profits than trade at national level through networks of wholesalers and large
retail chains. Some companies have even their own retail shops (Goussios et al. 2014). The
territorially orientated marketing allows small companies to take advantage of their PDO and
traditional products and their high quality and to withstand competition from larger units that
can benefit from economies of scale.
A number of small dairy companies export their products, mostly to the EU, however in
limited quantities and without any particular promotion strategy. Their attempts to expand in
the European market are usually based on personal relations with retailers, family networks or
acquaintances with Greek diaspora communities. Moreover, some small companies are
participating in international food fairs and exhibitions and thus gain access to the European
marketplace (Goussios et al. 2014). Consequently, although some dairy products, especially
cheeses and the "Greek yogurt" are highly appreciated abroad and regarded as a central
element of the Mediterranean diet", the individual, non-consolidated and sporadic attempts
towards business relationships establishment within the EU marketplace as well as the lack of
strategy to promote the specific collective attributes of the Greek traditional and PDO dairy
products are obstacles for the small producers to capture a greater share of the value created in
the international value chain.
2.2. Legislation about small dairy processing units
According to the recently voted (22.12.2014) Decision 3724/162303 (FEK 3438/
B/2014; national measures and deviations in foods of animal origin on application of the EU
regulations 852/2004 and 853/2004), dairy processing units with capacity less than 500
kilograms of milk per day are regarded as small. The aforementioned legislation sets rules
concerning both the operation of the processing unit and the compliance with the hygiene
standards (a more flexible application of HACCP in particular). These rules are less strict than
those set by the regulations 852/2004 and 853/2004, yet effective in avoiding any possible
contaminations.
In the Decision, it is also stated that “own production of dairy products in the livestock
farm” is the production of dairy products at a manufacturing sites within the limits of the
livestock farm for the purpose of commercializing these products to the final consumer
through the local market (public markets, producers’ markets). It is clearly stated that own
producing livestock farms’ operation is subjected to the competent veterinary authorities, the
milk comes exclusively from the livestock farm itself and the daily processed quantity of milk
should not exceed the limit of 300 kg. Finally, the Decision describes the permitted

32
differentiations in the processing sites, equipment and practices of processing units and
livestock farms that produce “milk-based products with traditional characteristics”.
Regarding association entities that help dairy units, especially the small ones, to protect
and promote their products, unfortunately no data about currently existing entities could be
found. However, the respective legislation is in power since 2013 and it is anticipated that it is
matter of time but also willingness from the side of producers to take advantage of this.
In particular, as Milk Producer Organization (MPO) [Decision 2133/101443 (FEK
2226/20013)] is defined a private legal entity that has legally been established with the
initiative of livestock breeders and producers of all types of milk and milk products and it is
aiming at one or more of the following targets, namely (a) ensuring that the production is well
planned and adjusted to the demand, especially concerning quantity and quality, (b) gathering
options about the offer and disposal at the market of its members' products, (c) optimizing
production costs and stabilizing producer's prices. Each MPO must have a minimum number
of members and a minimum marketable production quantity, which are well defined but may
differ depending on the administrative region. Finally, unions of MPOs can also be
established from one or more MPOs with jurisdiction to act on behalf of its members.
Furthermore, Inter-Professional Organizations (IPO) in the dairy sector [Decision
2133/101443 (FEK 2226/20013)] is defined a non-profitable private legal entity established
on the basis of cooperation among milk producers and other professionals related with the
dairy sector, i.e. processing, products distribution and trade. These IPO must be mainly active
within the field of its members’ activities, covering at least 1/3 of the production and
utilization of the raw milk in its activity area. IPOs can act at regional and national level on
behalf of their members as described in the EU Regulation 1234/2007 (Article 123, Paragraph
4c). These actions include (a) improving the knowledge and transparency concerning the
dairy production and marketplace, (b) coordinating the dairy products' disposal at the market,
(c) promoting milk and dairy products consumption, (d) analysis of export potential, (e)
conduction of studies on the promotion of the production of dairy products that respond to the
market's needs and the consumers' preferences, (f) establishing a fair competition environment
extending from the raw material production throughout to distributors and retailers, (g)
supporting the sustainable development of the dairy sector through the promotion of
innovation and applied research projects, (h) pursuing methods and practices for the
enhancement of product safety and animal welfare, (i) developing methods for improving
product quality, (j) exploiting and promoting the potential of organic farming and of products
with quality and geographical indications, (k) promoting the integrated and environment-
friendly production methods.
.
2.3. Distribution of small dairy enterprises
In total, 793 milk and dairy products facilities are licensed by EFET (www.efet.gr), 766
of which are processing units and 27 packaging companies. On the other hand, according to
ELOGAK (2015) (Hellenic Milk and Meat Organization) the number of the existing milk
processing units for the year 2014 is 724. Unfortunately, it was not made possible to clarify
the reasons for this discrepancy. According to STAKOD 2008 (Statistical Classification of
Economic Activities), which is harmonized with NACE Rev 2 classification system of the

33
EU, these enterprises fall within the class "Dairy Production" (code number 10.5) and the
subclass "Operation of Dairies and Cheese Making Units" (code number 10.51).
In 2014, 558 enterprises processed annually less than 1000 tons of milk (ELOGAK),
which stands for the 77% of the total number of dairy enterprises, 113 processed between
1000 and 5000 tons and 53 processed more than 5000 tons (Figure 2.1).
These enterprises can be divided in the following sub-categories: (a) enterprises with the
production of cheeses as exclusive or main activity, (b) enterprises with the production of
dairy products other than cheese as exclusive or main activity, (c) agricultural cooperatives
which either produce exclusively dairy products or they produce a variety of agricultural
products including dairy products and (d) enterprises from the wider food industry that have
expanded in a lesser degree to the dairy production.
Figure 2.1. Distribution of dairy units in Greece according to the annually incoming quantity of milk
(in tons; ELOGAK, 2015)

34
Table 2.1. Total quantities of the annually delivered cow, sheep and goat (primary production) by the producers
per administrative region (2014) (ELOGAK, 2015)
Administrative region Cow milk Sheep milk Goat milk
Attica 7.925 5.913 944
North Aegean 1.654 34.897 3.811
Western Greece 19.150 98.170 14.821
Epirus 17.289 49.688 7.138
Thessaly 93.401 104.083 20.890
Ionian Islands 147 4.786 1.512
Crete 233 42.731 3.552
Eastern Macedonia and Thrace 102.955 28.275 9.927
Wectern Macedonia 26.530 33.338 7.824
Central Macedonia 300.403 79.405 29.777
South Aegean 16.232 856 1.073
Peloponnese 4.610 34.506 20.695
Central Greece 26.600 21.512 4.558

35
Figure 2.2. Geographical distribution of Dairy Enterprises in Administrative regions of Attica (Athens Prefecture –Piraeus Prefecture), Central Greece (Phocis-Phthiotis),
Thessaly (Karditsa-Trikala), Central Macedonia (Thessaloniki-Imathia) and Eastern Macedonia and Thrace) according to the annually incoming quantity of milk(in tons;
ELOGAK, 2015)

36
Figure 2.3. Geographical distribution of Dairy Enterprises in Administrative regions of Western Macedonia (Grevena-Florina), Epirus (Arta-Preveza), Crete (Heraklion-
Chania), Ionian Islands (Corfu- Kefallonia), North Aegean (Lesbos-Samos), South Aegean (Dodeanesse-Cyclades), Peloponnese (Argolis-Corinthia) and Western Greece
(Achaea-Aetolia-Acarnania) according to the annually incoming quantity of milk (in tons; ELOGAK, 2015)

37
Table 2.2. Total quantities of the annually incoming cow, sheep and goat milk in the processing units
per regional unit (in tons; ELOGAK, 2015)
Regional unit Cow
milk
Sheep
milk
Goat
milk
Regional
unit
Cow
milk
Sheep
milk
Goat
milk
Athens 173.288 13.957 3.447 Florina 450 2.708 385
Eastern Attica 43.560 4.799 1.354 Kozani 2.112 3.039 1.049
Western Attica 1.318 1.456 286 Arta 37 41.135 4.134
Piraeus 600 0 0 Thesprotia 0 2.471 480
Boeotia 281 549 127 Ioannina 12.487 36.685 6.295
Euboea 86 1.731 689 Preveza 5.489 762 50
Evrytania 0 237 61 Heraklion 107 13.802 671
Phocis 0 1.842 670 Lasithi 0 1.964 209
Phthiotis 2.873 7.447 1.800 Rethymno 89 17.425 1.766
Karditsa 566 628 119 Chania 38 9.693 914
Larisa 114.310 68.795 14.990 Zakynthos 0 32 6
Magnisia 10.616 20.259 2.299 Corfu 229 99 8
Trikala 25.150 43.988 7.824 Kefallonia 380 4.332 1.420
Thessaloniki 63.438 35.236 15.395 Lefkada 0 9 0
Chalkidiki 1.327 16.569 9.922 Chios 1.361 7 555
Kilkis 25.674 2.555 1.157 Lesbos 0 46.242 4.833
Pella 9.787 10.567 2.001 Samos 316 30 62
Pieria 5.910 5.521 1.006 Dodecanese 1.199 71 51
Serres 26.700 1.355 496 Cyclades 15.043 783 1.010
Imathia 1.856 7.649 1.844 Argolis 1.022 6.617 4.570
Drama 14.891 2.566 810 Arcadia 299 17.018 7.315
Evros 15.547 4.143 2.160 Corinthia 328 2.751 1.096
Kavala 278 2.471 3.065 Laconia 29 4.587 5.402
Xanthi 25.021 8.008 2.491 Messinia 0 3.950 493
Rodopi 1.309 2.570 514 Aetolia-Acarnania 0 33.162 2.625
Grevena 617 4.492 1.371 Achaea 8.397 32.562 9.464
Kastoria 0 219 7 Elis 2.940 8.899 723
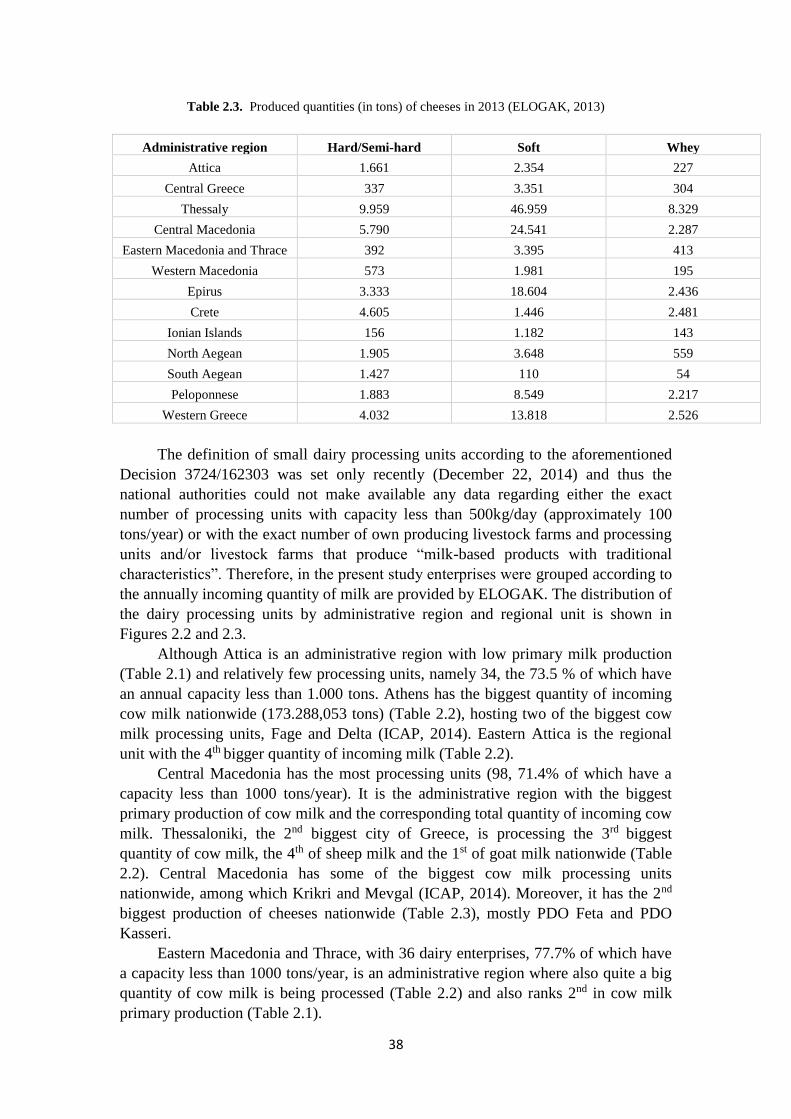
38
Table 2.3. Produced quantities (in tons) of cheeses in 2013 (ELOGAK, 2013)
Administrative region Hard/Semi-hard Soft Whey
Attica 1.661 2.354 227
Central Greece 337 3.351 304
Thessaly 9.959 46.959 8.329
Central Macedonia 5.790 24.541 2.287
Eastern Macedonia and Thrace 392 3.395 413
Western Macedonia 573 1.981 195
Epirus 3.333 18.604 2.436
Crete 4.605 1.446 2.481
Ionian Islands 156 1.182 143
North Aegean 1.905 3.648 559
South Aegean 1.427 110 54
Peloponnese 1.883 8.549 2.217
Western Greece 4.032 13.818 2.526
The definition of small dairy processing units according to the aforementioned
Decision 3724/162303 was set only recently (December 22, 2014) and thus the
national authorities could not make available any data regarding either the exact
number of processing units with capacity less than 500kg/day (approximately 100
tons/year) or with the exact number of own producing livestock farms and processing
units and/or livestock farms that produce “milk-based products with traditional
characteristics”. Therefore, in the present study enterprises were grouped according to
the annually incoming quantity of milk are provided by ELOGAK. The distribution of
the dairy processing units by administrative region and regional unit is shown in
Figures 2.2 and 2.3.
Although Attica is an administrative region with low primary milk production
(Table 2.1) and relatively few processing units, namely 34, the 73.5 % of which have
an annual capacity less than 1.000 tons. Athens has the biggest quantity of incoming
cow milk nationwide (173.288,053 tons) (Table 2.2), hosting two of the biggest cow
milk processing units, Fage and Delta (ICAP, 2014). Eastern Attica is the regional
unit with the 4th bigger quantity of incoming milk (Table 2.2).
Central Macedonia has the most processing units (98, 71.4% of which have a
capacity less than 1000 tons/year). It is the administrative region with the biggest
primary production of cow milk and the corresponding total quantity of incoming cow
milk. Thessaloniki, the 2nd biggest city of Greece, is processing the 3rd biggest
quantity of cow milk, the 4th of sheep milk and the 1st of goat milk nationwide (Table
2.2). Central Macedonia has some of the biggest cow milk processing units
nationwide, among which Krikri and Mevgal (ICAP, 2014). Moreover, it has the 2nd
biggest production of cheeses nationwide (Table 2.3), mostly PDO Feta and PDO
Kasseri.
Eastern Macedonia and Thrace, with 36 dairy enterprises, 77.7% of which have
a capacity less than 1000 tons/year, is an administrative region where also quite a big
quantity of cow milk is being processed (Table 2.2) and also ranks 2nd in cow milk
primary production (Table 2.1).

39
In Thessaly (79 processing units, 60.7% of which have a capacity less than 1000
tons/year) the majority of sheep milk is produced and the biggest quantities of sheep
milk nationwide are being processed. Particularly, Larisa is ranking 1st in incoming
sheep milk and also 2nd in goat milk and 2nd in cow milk. Thessaly is actually the
administrative region with the biggest production of cheeses (Table 2.2) and has one
of the biggest cheese making units nationwide, namely Tyras AE. According to data
from ELOGAK (2010), it accounts for the 33% of the national production of PDO
Feta cheese, with use of 85% of sheep and goat’s milk local production. Especially in
Thessaly, Feta accounts for the 95% of the production of all PDO cheeses.
Epirus, with relatively few processing units (namely 33, 75.7% of which with a
capacity less than 1000 tons annually) is also an administrative region with big
incoming quantities of sheep and goat milk. Particularly, Ioannina comes 4th in
processing of sheep milk nationwide (Table 2.2). Epirus has the 3rd biggest production
of cheeses nationwide (Table 2.3), mostly PDO Feta.
Peloponnese, with quite many dairy processing units (namely 79, in the 75.9%
of which less than 1000 tons/year are being processed) has quite noticeable quantities
of annually incoming sheep and goat milk (Table 2.2).
In Western Greece (72 dairy enterprises, 70.8% of which process less than 1000
tons of milk annually) ranks 2nd in sheep milk production nationwide, the processing
activity of sheep and goat milk is notably high, especially in Aetolia-Acarnania and
Achaea, with the latter being 4th in processing of sheep milk nationwide (Table 2.2).
Central Greece (63 dairy enterprises, 92% of which with capacity less than 1000
tons/year) and Western Macedonia (38 dairy enterprises, 89.4% of which with
capacity less than 1000 tons/year) seem to be the administrative regions with the
lowest dairy processing activity concerning the mainland of Greece (Table 2.2).
Crete is an insular administrative region with many processing units, namely 91,
with 85.7% of them processing less than 1000 tons annually. It is an administrative
region with quite notable sheep milk production (Table 2.1) and processing activity,
particularly in Rethymno (Table 2.2).
North Aegean is an insular administrative region with a significant sheep milk
production and quite many processing units (namely 63, with 77.7% of them having
annual capacity less than 1000 tons), with the vast majority of them being in Lesbos.
The existence of so many processing units there corresponds with the incoming
quantities of sheep and goat milk in this regional unit. Lesbos actually comes 2nd in
processing of sheep milk nationwide (Table 2.2).
South Aegean (45 processing units, 75.5% of which with capacity less than
1000 tons/year) and Ionian Islands (namely 17, the 94.1% of them having capacity
less than 1000 tons/year) have relatively small incoming quantities of milk in their
processing units, which makes sense if the relatively small size of these insular areas
is taken into account. Interestingly though, the incoming quantities of cow milk in
Cyclades are quite big (Table 2.2).
2.4. Greek PDO and traditional cheeses
2.4.1. Greek PDO cheeses

40
In the context of the EU Regulation 510/06 21, Greek cheeses are certified with
the Protected Designation of Origin (PDO). The produced quantities of the Greek
PDO cheeses for the years 2012 and 2013 are shown in Table 2.4. The geographical
distribution of Greek PDO cheeses is shown in Figure 2.5. As it is shown in Figure
2.4, PDO cheeses have always been accounting for the 50% more or less of the total
industrial production of cheeses. PDO Feta accounted every year for the 90% more or
less of the total PDO cheeses production (Table 2.4).
Table 2.4. Produced quantities (in tons) of PDO cheeses for the years 2008-2014 (ELOGAK, 2015)
PDO cheese 2008 2009 2010 2011 2012 2013
Feta 91.734 95.367 101.175 92.484 86.567 94.765
Kasseri 2.516 2.633 3.964 3.134 2.773 2.527
Kefalograviera 2.205 2.165 2.408 2.539 2.511 2.304
Graviera Kritis 1.261 786 1.247 1.294 1.732 1.759
Graviera Naxou 645 819 1.003 874 968 1.031
Manouri 1.010 1.079 1.006 896 840 925
Kalathaki Limnou 472 436 203 359 506 401
Ladotyri Mytilinis 193 237 188 317 497 413
Katiki Domokou 271 449 388 317 389 455
Galotyri 370 285 263 232 175 220
Sfela 83 54 70 92 86 75
Xynomyzithra Kritis 10 4 31 45 36 43
Batzos 55 68 34 47 26 26
Formaella Arachovas 2 0 1 6 22 26
Pichtogalo Chanion 8 6 20 22 21 18
Anevato 17 9 12 18 11 14
Kopanisti 31 35 31 39 2 5
San Michali 48 50 101 46 0 21
Graviera Agrafon 0 0 0 0 4 0
Xygalo Sitias 0 0 0 0 0 0
Metsovone 0 0 0 0 0 0
Total 100.931 104.482 112.115 102.841 97.164 105.083

41
Figure 2.4. Participation of PDO cheeses in the total industrial production of cheese (2008-2012)
(ICAP, 2013)
Figure 2.5. The geographical distribution of Greek PDO cheeses
Feta (Decision 313025/1994 in FEK 8/B/1994, 101/B/1994) is a soft white
PDO cheese ripened in brine prepared from sheep milk or mixture of sheep with up to
30% goat milk. It is produced in the continental parts of the administrative regions of

42
Attica, Central Greece, Western Greece, Peloponnese, Thessaly, Epirus, Western
Macedonia, Central Macedonia, Easter Macedonia and Thrace and from the regional
unit of Lesbos. There are totally 241 processing units licensed to produce, pack and
standardize PDO Feta cheese, located as shown in Figure 2.6. Moreover, there 13
enterprises licensed only to pack, standardize and trade (3 in Attiki, 2 in Imathia, and
one in each of the regional units of Evros, Euboea, Thessaloniki, Kilkis, Magnisia,
Pieria, Phthiotis and Heraklion) and 35 enterprises licensed only to trade Feta cheese
(21 in Attiki, 3 in Larisa, 2 in Thessaloniki and one in each of the regional units of
Evros, Imathia, Karditsa, Kilkis, Kozani, Corinthia, Rethymno, Xanthi and Pella)
(Agrocert, 2014).
A small rise in its produced quantity was observed in 2010 and was followed by
a small decline until 2013, when a small rise was observed again. PDO Feta cheese is
produced in significantly bigger quantities comparing to the other PDO cheeses
(Table 2.4). Feta accounts for over 40% of the consumption in Greece. It is a staple
food in Greece that accompanies almost every kind of meal and it is used in a number
of Greek recipes (Goussios et al. 2014). Feta has been subjected to fierce competition
from white Feta-type cheeses from Northwest Europe. In 1996, the EU recognized
Feta as a Greek PDO product and provided for an adjustment period of 5 years for the
other member states that produced “Feta” type cheeses (based on cow milk).
Germany, Denmark and France made an appeal to the European Court against the
decision of the Commission, claiming that Feta is a "generic" product, which involves
basic manufacturing practices found in all Balkan countries under different
nominations. In 1999, the European Court cancelled the issuance of this appellation.
Under the 1070/99 Regulation, Feta had been removed from the list of European
PDOs. After new appeals from the Greek side, it was decided in 2003 to renew the
Greek Feta PDO label (Regulation 1829/2002). The main arguments in favor of the
“Greek” Feta were as follows: (a) Feta has been produced in Greece since antiquity
(according to historical sources) from sheep and goat milk and according to the
perceptions of European consumers, (b) Feta is associated with Greece, (c) Feta
manufacturing processes were codified in Greece much earlier than abroad and (d)
production of Greek Feta covers more than 60% of the total cheese production in
Greece (80% of total production of cheeses from sheep and goat milk). All these
prove the close relationship of the Greek territory and Feta cheese in its natural and
cultural environment, predominantly in mountainous areas and semi-arid rocky
mountains (Goussios et al. 2014). Shortly after the second issuance of the PDO Feta
to Greece, the German and the Danish government as well as German, Danish and
French producers’ organizations made again an appeal to the Tribunal of the
European Community against the Regulation 1829/02. In 2005, he Court ruled in
favor of the certification of the designation of Greek origin. Dairy industries
producing Feta type cheeses in EU member countries had a transition period up until
2007 to completely eliminate the word “Feta” from the labeling of their products.

43
Figure 2.6. Geographical distribution in regional units of processing units licensed to produce, pack and
standardize PDO Feta (www.agrocert.gr)
Kasseri (Decision 313027/1994 in FEK 8/B/1994, 101/B/1994 as amended by
Decision 379116/200 in FEK 949/B/2000) is a semi-hard yellowish PDO cheese from
sheep milk or mixture of sheep with up to 20% goat milk. It is produced in the
administrative regions of Western and Central Macedonia and in the regional units of
Drama Kavala, Xanthi and Lesbos. There are totally 38 processing units licensed to
produce, pack and standardize Kasseri, located as shown in Figure 2.7. Moreover,

44
there is one unit only standardizing PDO Kasseri in Arta, Epirus, 12 enterprises that
are licensed only to pack, standardize and trade Kasseri (7 in Attiki, 2 in Magnisia and
one in each of the regional units of Aetolia-Acarnania, Boeotia and Karditsa) and 13
enterprises only licensed to trade Kasseri (10 in Attiki, and one in each of the regional
units of Thessaloniki, Larisa and Xanthi) (Agrocert, 2014). A quite significant rise
was observed in the production of Kasseri in 2010, but ever since it has been steadily
falling (Table 2.4). This cheese is particularly prevalent in the northern mainland of
Greece, where it is produced.
Figure 2.7. Geographical distribution of processing units licensed to produce, pack and standardize
PDO Kasseri (www.agrocert.gr)
Kefalograviera (Decision 313032/1994 in FEK 8/B/1994, 101/B/1994) is a
hard white to yellowish PDO cheese made from sheep milk or mixture of sheep with
up to 10% goat milk. It is produced in the administrative regions of West Macedonia
and Epirus and in the regional units of Aetolia-Acarnania and Evrytania. There are
totally 38 processing units licensed to produce, pack and standardize Kefalograviera,
located as shown in Figure 2.8. Moreover, there are 14 enterprises licensed only to
pack, standardize and trade Kefalograviera (8 in Attiki, 2 in Magnisia and one in each
of the regional units of Boeotia, Karditsa Thessaloniki and Pella) and 11 enterprises
licensed only to trade Kefalograviera (9 in Attiki, one in Thessaloniki and one in
Larisa). The production of Kefalograviera has remained relatively steady throughout
the years (Table 2.4).

45
Figure 2.8. Geographical distribution of processing units licensed to produce, pack and standardize
PDO Kefalograviera (www.agrocert.gr)
Graviera Kritis (Decision 313047/1994 in FEK 16/B/1994) is a hard yellowish
PDO cheese from sheep milk or mixture of sheep with up to 20% goat milk. It is
produced in the administrative region of Crete. There are totally 19 processing units
licensed to produce, pack and standardize this PDO cheese, located as shown in
Figure 2.9. Moreover, there are 12 enterprises licensed only to pack, standardize and
trade Graviera Kritis (6 in Attiki and one in each of the regional units of Aetolia-
Acarnania, Boeotia, Heraklion, Karditsa, Magnisia and Rethymno) and 8 enterprises
licensed only to trade Graviera Kritis (5 in Attiki, 2 in Thessaloniki and one in
Heraklion) (Agrocert, 2014). Although a significant fall in Graviera Kritis production
was observed in 2009, the produced quantities are rising steadily ever since (Table
2.4).
Figure 2.9. Geographical distribution of processing units licensed to produce, pack and standardize
PDO Graviera Kritis (www.agrocert.gr)
Graviera Naxou (Decision 313071/1994 in FEK 23/B/1994) is a hard
yellowish PDO cheese made from cow milk or mixture of cow with up to 20% sheep
and goat milk. It is produced in the island of Naxos, regional unit of Cyclades. There
are totally 3 processing units licensed to produce, pack and standardize this Graviera
Naxou. Moreover there are 8 enterprises licensed only to pack, standardize and trade
it (6 in Attiki, 1 in Boeotia and 1 in Magnisia) and one enterprise in Larisa only

46
licensed to trade Graviera Naxou (Agrocert, 2014). The production of this cheese rose
significantly until 2010, then a slight fall was noticed in 2011 and it has been rising
again ever since (Table 2.4).
Manouri (Decision 313028/1994 in FEK 8/B/1994 and 101/B/1994) is a soft
white PDO cheese made from the whey of either goat, sheep or mixture of goat with
sheep milk with an addition of sheep or goat milk or their cream. It is produced in the
administrative regions of Central Macedonia, Western Macedonia and Thessaly.
There are totally 29 processing units licensed to produce, pack and standardize
Manouri located as shown in Figure 2.10. Moreover there are 10 enterprises licensed
only to pack, standardize and trade it (4 in Attiki, 3 in Magnisia, 2 in Boeotia and one
in Aetolia-Acarnania) and 12 enterprises only licensed to trade Manouri (9 in Attiki,
and one in each of the regional units of Arta, Thessaloniki and Kilkis) (Agrocert,
2014). The production of Manouri has remainer relatively steady throughout the
years, although a small fall was noticed from 2011 and on (Table 2.4).
Figure 2.10. Geographical distribution of processing units licensed to produce, pack and standardize
PDO Manouri (www.agrocert.gr)
Kalathaki Limnou (Decision 313044/1994 in FEK 16/B/1994) is a soft white
PDO cheese ripened in brine from sheep milk or mixture of sheep with up to 30%
goat milk. It is produced in Limnos Island, regional unit of Cyclades. There are totally
3 processing units licensed to produce, pack and standardize Kalathaki Limnou.
Moreover, there is one enterprise in Chalkidiki licensed only to pack, standardize and
trade it and 2 enterprises (one in Thessaloniki and one in Attiki) licensed only to trade
Kalathaki Limnou (Agrocert, 2014).The production of Kalathaki Limnou decreased
significantly in 2010. This fall was followed by a small rise, the production reached
its higher quantities in 2012 and it fell significantly again in 2013 (Table 2.4).
Ladotyri Mytilinis (Decision 313058/1994 in FEK 25/B/1994 and FEK
101/B/1994) is a hard white to yellowish PDO cheese from sheep milk or mixture of
sheep with up to 30% goat milk. It is produced in Lesbos Island, regional unit of
Lesbos. There are totally 10 processing units licensed to produce, pack and
standardize Ladotyri Mytilinis. Moreover, there are 4 enterprises licensed only to
pack, standardize and trade Ladotyri Mytilinis (3 in Attiki and one in Boeotia) and 2
enterprises in Thessaloniki licensed only to trade Ladotyri Mytilinis (Agrocert, 2014).

47
The produced quantities of Ladotyri Mytilinis have been relatively steady until 2010
and a quite significant increase was observed in 2012 (Table 2.4).
Katiki Domokou (Decision 313048/1994 in FEK 16/B/1994 and FEK
101/B/1994) is a soft white spreadable PDO cheese from goat or mixture of goat with
sheep milk. It is produced in the plateau of Orthys, Domokos district, regional unit of
Phtiotis. There are totally 2 processing units licensed to produce, pack and standardize
Katiki Domokou (Agrocert, 2014). A significant increase of Katiki Domokou
production was observed in 2009 remaining relatively steady ever since (Table 2.4).
Galotyri (Decision 313031/1994 in FEK 8/B/1994 and FEK 101/B/1994) is a
soft white spreadable PDO cheese from goat, sheep or mixture of goat with sheep
milk. It is produced in the administrative regions of Thessaly and Epirus. There are
totally 2 processing units licensed to produce, pack and standardize Galotyri, located
as shown in Figure 2.11. Moreover, there is one enterprise in Attiki licensed only to
trade Galotyri (Agrocert, 2014). The production of Galotyri has been decreasing
steadily from 2008 and only a small rise was noticed in 2013 (Table 2.4).
Figure 2.11. Geographical distribution of processing units licensed to produce, pack and standardize
PDO Galotyri (www.agrocert.gr)
Sfela (Decision 313051/1994 in FEK 25/B/1994) is a semi-hard white to yellow
PDO cheese ripened in brine from either goat, sheep or mixture of goat with sheep
milk. It is produced in the regional units of Messinia and Lakonia, administrative
region of Peloponnese. There are totally 5 processing units licensed to produce, pack
and standardize Sfela in Messinia (Agrocert, 2014). The production of Sfela has been
always restricted to very small quantities that have remained relatively steady
throughout the years (Table 2.4).
Xynomyzithra Kritis (Decision 313051/1993 in FEK 18/B/1994 and
101/B/1994) is a soft white PDO cheese made from the whey of either goat or sheep
or mixture of goat with sheep milk. It is produced in the administrative region of
Crete. There are totally 7 processing units licensed to produce, pack and standardize
this PDO cheese (5 in Rethymno and 2 in Heraklion). Moreover, there is one
enterprise in Heraklion licensed only to pack, standardize and trade and one enterprise
in Attiki licensed only to trade Xynomyzithra Kritis (Agrocert, 2014). Xynomyzithra
is produced in small quantities. A rise was observed in 2010 and ever since
production remained relatively steady (Table 2.4).
Batzos (Decision 313057/1994 in FEK 25/B/94 and 101/B/94) is a semi-hard to
hard, white to yellowish PDO cheese ripened in brine from goat, sheep or mixture of

48
goat with sheep milk. It is produced in Western and Central Macedonia (regional units
of Thessaloniki, Chalkidiki, Kilkis, Imathia, Pieria, Pella, Florina, Kozani, Kastoria,
Grevena) and in Thessaly (regional units of Larisa, Trikala, Karditsa, Magnisia).
There are 14 processing units in total licensed to produce, pack and standardize
Batzos, located as shown in Figure 2.12. The produced quantities of Batzos have
remained relatively steady until 2012, when a decline was observed (Table 2.4).
Figure 2.12. Geographical distribution of processing units licensed to produce, pack and standardize
PDO Anevatocheese (www.agrocert.gr)
Formaella Arachovas Parnassou (Decision 313063/1994 in FEK 25/B/1994)
is a semi-hard yellowish PDO cheese from either goat or sheep or mixtures of goat
with sheep milk. It is produced in Arachova Parnassou district, regional unit of
Boeotia. There are totally 10 processing units licensed to produce, pack and
standardize Formaella Arachovas Parnassou. Moreover, there are 2 enterprises
licensed only to pack, standardize and trade Formaella Arachovas Parnassou (one in
Attiki and one in Phthiotis) (Agrocert, 2014).Formaella Arachovas Parnassou had
been produced in minor quantities until 2012, when a rise was observed (Table 2.4).
Pichtogalo Chanion (Decision 313062/1994 in FEK 24/B/1994) is a soft white
to whitish spreadable PDO cheese from goat, sheep or mixture of goat with sheep
milk. It is produced in the regional unit of Chania, administrative region of Crete.
There is only one processing unit licensed to produce, pack and standardize
Pichtogalo Chanion (Agrocert, 2014).Pichtogalo Chanion had been produced in very
small quantities until 2010,when an increase was observed and ever since they have
remained steady (Table 2.4).
Anevato (Decision 313160/1994 in FEK 24/B/1994) is a soft white PDO cheese
from goat, sheep or mixture of goat with sheep milk. It is produced in the regional
unit of Grevena (Western Greece) and in Voio County of the regional unit of Kozani
(Western Greece). There are totally 5 processing units licensed to produce, pack and
standardize (4 in Grevena and 1 in Kozani) and one enterprise in Kozani licensed only
to pack, standardize and trade Anevato (Agrocert, 2014). The produced quantities
have remained steady ad low throughout the years (Table 2.4).
Kopanisti (Decision 313046/1994 in FEK 16/B/1994 and 101/B/1994) is a soft
yellowish to grayish salty spreadable PDO cheese from either cow or sheep or goat
milk or mixtures of them. It is produced in the regional unit of Cyclades. There are
totally 4 processing units licensed to produce, pack and standardize and one enterprise
in Boeotia licensed only to pack, standardize and trade Kopanisti (Agrocert, 2014).

49
Kopanisti had been always produced in small quantities but since 2012 the production
significantly declined to minor quantities (Table 2.4).
San Michali (Decision 313069/1994 in FEK 23/B/1994 and 101/B/1994) is a
hard white to yellowish PDO cheese from cow milk. It is produced in the island of
Syros, regional unit of Cyclades. There are totally 2 processing units licensed to
produce, pack and standardize and one enterprise in Attiki licensed only to trade San
Michali (Agrocert, 2014). The production of San Michali had been low, in 2010 the
quantities became double as much as before and the next year the quantities went
back to their former levels. No production was observed in 2012 and a very small
production returned in 2013 (Table 2.4).
Graviera Agrafon (Decision 313045/1994 in FEK16/B/1994 and 101/B/1994)
is a hard yellowish PDO cheese from sheep milk or mixture of sheep with up to 30%
goat milk. It is produced in Agrafa district, regional unit of Karditsa. There is only
one enterprise licensed to produce, pack and standardize Graviera Agrafon (Agrocert,
2014). Only in 2012 a minor quantity of Graviera Agrafon was produced (Table 2.4).
Xygalo Sitias (Decisions C312/2010 and L200/2011) is a soft white spreadable
PDO cheese from goat, sheep or mixture of goat with sheep milk. It is produced in the
district of Sitia, regional unit of Lasithi. No enterprise produced Xygalo siteias in
2014, according to ELOGAK. No production of Xygalo Sitias has been recorded by
ELOGAK (Table 2.4).
Metsovone (Decision 313070/1994 in FEK 23/B/1994) is a semi-hard to hard
yellow to sepia smoked PDO cheese from cow milk or mixture of cow with up to 20%
sheep and goat milk. It is produced in Metsovo County, regional unit of Ioannina. No
enterprise produced Metsovone in 2014, according to ELOGAK. No production of
Metsovone has been recorded by ELOGAK (Table 2.4).
2.4.2. Traditional non-PDO Greek cheeses
In Greece, a significant number of traditional cheeses are being currently
produced (Table 2.5), although none of them is designated with the recently enshrined
appellation "milk-based product with traditional characteristics" (Decision
3724/162303 in 22.12.2014). Besides, no dairy product in Greece has been designated
with any of the appellations of "Protected Geographical Indication, PGI" or
"Traditional Specialties Guaranteed, TSG", although many of these products fulfill
the requirements or could take actions in order to fulfill them. It should be pointed out
that the areas in Greece with the wider variety of PDO and traditional non-PDO
cheeses produced are the Islands, namely North Aegean Islands, the Cyclades, the
Dodecanese and Crete.

50
Table 2.5. Traditional non-PDO cheeses
Cheese Milk Geographical
origin
Cheese Milk Geographical
origin
Anthotyros sheep and
goat whey and
milk
Mainland of
Greece and
Crete
Skyriano sheep and
goat
Skyros island
(Euboea,
Attica)
Klotsotyri sheep and
goat
buttermilk
Epirus and
Thessaly
Tsakisti
Myzithra
Limnou
sheep and/or
goat
Limnos
(N.Aegean)
Myzithra sheep and/or
goat and/or
cow milk and
whey
Nationwide Melichloro
Limnou
sheep and
goat
Limnos (N.
Aegean)
Telemes sheep and/or
goat and/or
cow
Mainland of
Greece
Dermatotyri
Samou
sheep and
goat
Samos
(N.Aegean)
Tsalafouti sheep and
goat
Agrinio
(Aetolia-
Acarnania)
Armogalo
Samou
goat Samos (N.
Aegean)
Tyrogliata sheep Pindos (Epirus) Pityano Chiou sheep or
sheep and
goat
Chios (N.
Aegean)
Victoria cow Macedonia Kathoura
Ikarias
sheep or goat Ikaria (N.
Aegean)
Nivato
Verdikousas
goat Verdikousa
(Elassona,
Larisa)
Mastelo cow Chios (N.
Aegean)
Touloumotyri sheep and/or
goat
Macedonia,
Epirus, North
Aegean
Sitaka sheep and/or
goat
Kasos and
Karpathos
(Dodecanese)
Formaella
Kalavryton
sheep and
goat
Kalavryta
(Achaia)
Ellaiki Kasou sheep or goat Kasos
(Dodecanese)
Oudra sheep or goat
whey
Epirus Manouli
Karpathou
sheep or
sheep and
goat
Karpathos
(Dodecanese)
Gais Pontou cow Kilkis and
Thessaloniki
Possias Ko or
Krasotyri
sheep and/or
goat
Kos
(Dodecanese)
Percharotyri
Pontou
cow Kilkis and
Thessaloniki
Armeksia
Androu
sheep and/or
goat
Andros
(Cyclades)
Metsovella sheep and
goat and cow
Metsovo
(Ioannina)
Malaxia
Androu
sheep and/or
goat
Andros
(Cyclades)
Metsovana cow Metsovo
(Ioannina)
Volaki cow Tinos and
Andros
(Cyclades)
Vlachotyri sheep and/or Metsovo Petroto sheep and/or Tinos and
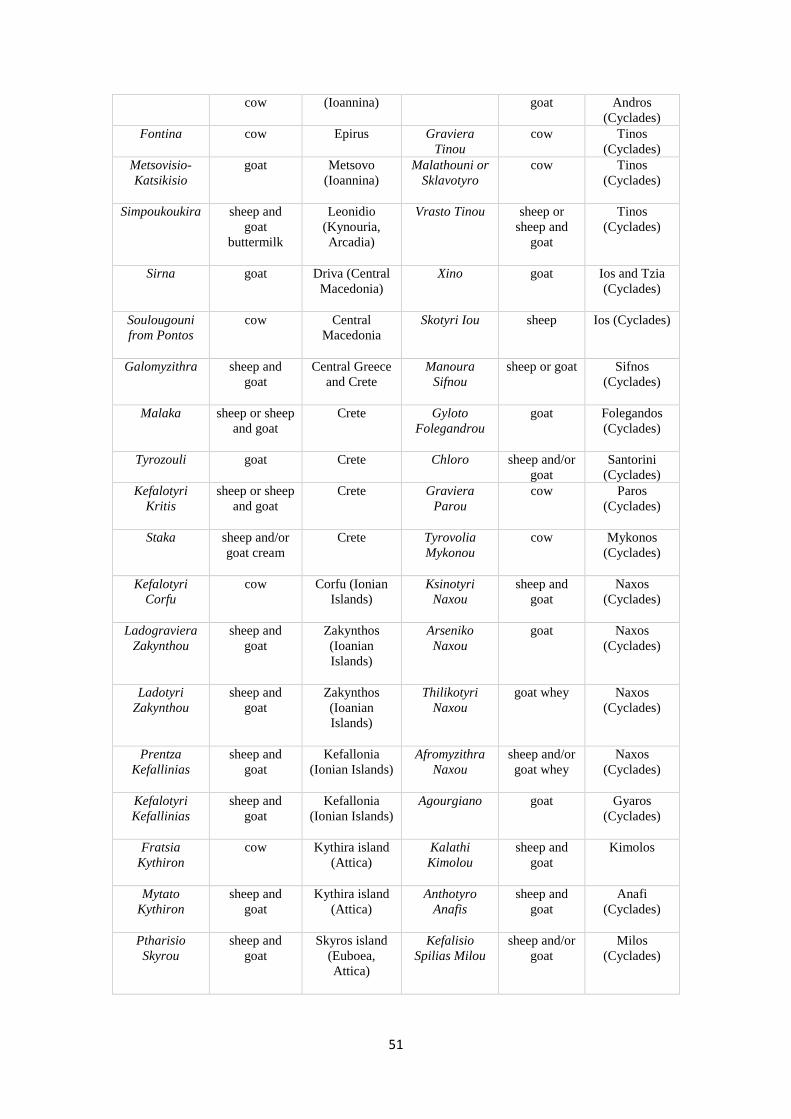
51
cow (Ioannina) goat Andros
(Cyclades)
Fontina cow Epirus Graviera
Tinou
cow Tinos
(Cyclades)
Metsovisio-
Katsikisio
goat Metsovo
(Ioannina)
Malathouni or
Sklavotyro
cow Tinos
(Cyclades)
Simpoukoukira sheep and
goat
buttermilk
Leonidio
(Kynouria,
Arcadia)
Vrasto Tinou sheep or
sheep and
goat
Tinos
(Cyclades)
Sirna goat Driva (Central
Macedonia)
Xino goat Ios and Tzia
(Cyclades)
Soulougouni
from Pontos
cow Central
Macedonia
Skotyri Iou sheep Ios (Cyclades)
Galomyzithra sheep and
goat
Central Greece
and Crete
Manoura
Sifnou
sheep or goat Sifnos
(Cyclades)
Malaka sheep or sheep
and goat
Crete Gyloto
Folegandrou
goat Folegandos
(Cyclades)
Tyrozouli goat Crete Chloro sheep and/or
goat
Santorini
(Cyclades)
Kefalotyri
Kritis
sheep or sheep
and goat
Crete Graviera
Parou
cow Paros
(Cyclades)
Staka sheep and/or
goat cream
Crete Tyrovolia
Mykonou
cow Mykonos
(Cyclades)
Kefalotyri
Corfu
cow Corfu (Ionian
Islands)
Ksinotyri
Naxou
sheep and
goat
Naxos
(Cyclades)
Ladograviera
Zakynthou
sheep and
goat
Zakynthos
(Ioanian
Islands)
Arseniko
Naxou
goat Naxos
(Cyclades)
Ladotyri
Zakynthou
sheep and
goat
Zakynthos
(Ioanian
Islands)
Thilikotyri
Naxou
goat whey Naxos
(Cyclades)
Prentza
Kefallinias
sheep and
goat
Kefallonia
(Ionian Islands)
Afromyzithra
Naxou
sheep and/or
goat whey
Naxos
(Cyclades)
Kefalotyri
Kefallinias
sheep and
goat
Kefallonia
(Ionian Islands)
Agourgiano goat Gyaros
(Cyclades)
Fratsia
Kythiron
cow Kythira island
(Attica)
Kalathi
Kimolou
sheep and
goat
Kimolos
Mytato
Kythiron
sheep and
goat
Kythira island
(Attica)
Anthotyro
Anafis
sheep and
goat
Anafi
(Cyclades)
Ptharisio
Skyrou
sheep and
goat
Skyros island
(Euboea,
Attica)
Kefalisio
Spilias Milou
sheep and/or
goat
Milos
(Cyclades)

52

53
Chapter 3. e-Commerce
3.1. e-Commerce worldwide
Due to the extensive dissemination of the internet worldwide, electronic
commerce (e-commerce) has quickly spread among businesses and households. There
are significant differences regarding the degree of acceptance of e-commerce among
various regions of the world, with Asia and the Pacific region being the leaders in
terms of e-commerce purchase activity. Europe has the lowest performance
worldwide in terms of e-commerce users for purchase actions. The same is valid
regarding the intention for e-commerce use in the near future, especially when
compared with Asia and the Pacific region, the Middle East, Africa and Latin
America (Nielsen, 2015). According to the same survey, the sales of liquid milk
between 2013 and 2014 in China increased by 91%, with 2% being carried out
through e-commerce. Reasons for the increase of on-line shopping for Fast Moving
Consumer Goods (FMCG) in the Asia-Pacific region include the rapid pace of
urbanization, low labor costs and food safety concerns. On-line Consumer Packaged
Goods (CPG) sales has been driven by the enthusiasm and shopping ingrained
behavior of Millennials (21-34 year of age) and Generation X (35-49) who grew up in
the era of digital technology. These two categories are most willing to use e-
commerce in the future and thus they should be targeted by every company dealing
with food (Nielsen, 2014). The intention of the consumers is depicted in Figure 3.1.
Figure 3.1. Intention of the consumers for buying and browsing in 2014 (Nielsen, 2014)
Food products in which the e-commerce suits the most are those that meet
specific consumer needs, such as those having beneficial characteristics for human
health along with fresh or minimal processed foods. Price is also an important factor
that should be considered especially under the current economic crisis conditions.
Products with high profit margins and high price to weigh ratio are well suited for e-
commerce. General strategies for e-commerce success include:
1. Insist on reliability and meeting the consumer's needs

54
2. Ease of use
3. Targeting specific market consumers
4. Easy receiving orders, payments and carefully planned distribution
E-commerce should form an innovative communication and commercial
practice for companies that aim to increase their sales both locally and internationally.
Unfortunately, however, some companies are not always open to implement major
changes or innovations in practices regarding marketing and distribution.
Basic targeting for food companies, especially local SMEs, should be the
information interface for the locality and the traditional identity of their products,
while innovative products should be highlighted as well. The successful
communication of this combination will give higher added value to the company's
products, competitive advantage and will encourage the trust of consumers. On the
other hand, the two main reasons of failure to create a successful e-commerce
business is the inability of the operators to provide users with basic accessibility and
usability features (Bodini and Zanoli, 2009).
3.2. e-Commerce in Greece
3.2.1. Households and Consumers
According to the Greek Statistical Service ELSTAT (2014), in the first quarter
of 2014 for a sample of 4.129 private households, with equal number of members and
at least one of them in the age group 16-74, it was shown that e-commerce had an
important growth. Consumers who have made on-line purchases in 2014 increased by
9.3% compared to 2013 and this accounts today for the 29.5% of internet users. From
one purchase per month in 2013 there was an increase to three purchases per two
months in 2014. Moreover, there was an increase of about 10% in total number of
product categories purchased this period (Table 3.1).
Table 3.1. Internet users making online purchases (%) (ELSTAT, 2014)
The number of women using the internet to purchase products or place orders through
has been increasing since 2010. Therefore, the difference between men and women
has decreased down to 6.6% in 2014 (Table 3.2).
Table 3.2. Electronic purchases leaf base from 2010-2014 (ELSTAT, 2014)
2010 2011 2012 2013 2014
Men Women Men Women Men Women Men Women Men Women
65,20% 34,80% 60,70% 39,30% 56,90% 43,10% 55,80% 44,20% 53,30% 46,70%
Year 2008 2009 2010 2011 2012 2013 2014
On-line purchases (%) 13,7 16,2 18,4 23,6 26,9 27,0 29,5

55
Overall, the percentage of consumers’ profiles making on-line purchases by
gender, age group and educational level are shown in Figure 3.2. In terms of
education, among low educational level group the rate was doubled from 4.1% to
9.5% between 2012 and 2014. For the medium educational level group, i.e. graduates
of secondary education and training institutes, the on-line activities remained rather
stable ranging from 40.2% in 2012 to 38.7% in 2014.
Figure 3.2. Share in e-commerce per gender, age group and educational level in 2014 (Nielsen, 2014)
In terms of growth, products or food and grocery services had a remarkable
growth in 2012 compared to 2011, namely by 25%. This was the 4th best class
development after the medical drugs (increase by 36.1%), the clothing sector & sports
equipment (increase by 28%) and e-learning material (increase by 27.5%). The
market share of food and grocery items in 2012 reached 6.5% of the total on-line
shopping.
No growth was however observed in the first quarter of 2014, in contrast to the
medical drugs and the clothing sector, which grew in 2013 more rapidly, namely by
101.9% and 41%, respectively. The same survey (ELSTAT, 2014) for the first quarter
of 2014 showed that 73.3% of the consumers preferred domestic enterprises to make
electronic transactions while 40.0% preferred EU countries and 21.0% countries
outside the EU. Interestingly, 3.9% of the consumers did not know the origin of the
vendors.
Although transactions via credit cards, in general, do not necessarily overlap
with e-commerce transactions, it is worth to note that, according to data from Greek
financial institutions, e.g. banks, after the imposition of the capital controls in Greece,
more than 1.1 million new credit cards were issued in the period June-August 2015
and the use of more than 11 million credit cards in total has tripled. In 2014, the use of
credit cards represented 1 euro for every 33 euro of purchase, much lower than in the
EU, which is 1 euro for every 6 euro of purchase, and this difference is estimated to
have fallen significantly since the implementation of capital controls. The use of

56
credit cards in the food market jumped to 234% over the same period. Moreover, after
the implementation of capital controls, the Greek companies operating through e-
commerce experienced problems with payments and receipts (97%), problems in
production and distribution of goods (64%), an inability to use payment methods,
such as PayPal (61%), and they claim that 29% of their clients refuse to pay cash
(ELSTAT, 2014).
3.2.2. Enterprises
The use of information technologies, including personal computer, internet
access and websites from a total of 23.098 businesses, is illustrated in Figure 3.3 for
the years 2013 and 2014. A total of 20.578 enterprises had internet access while
14.287 had their own website. In a survey of ELSTA ELSTAT (2014), which
included 23.098 enterprises, the total turnover amounted 219.830.219,941 euro, with
the electronic sales totaling 3,504,355,491 euro for 2132 businesses, banks being
excluded. Moreover, 9.23% of the enterprises received electronic orders
corresponding to 1.59% of the total turnover, an increase of 9.12% compared to 2013
regarding the number of companies and 1.21 % regarding the turnover rate. In 2014,
companies made less on-line purchases, i.e. 13.66%, compared to 2013 (18.14%).
Figure 3.3. Computer use, internet access, use of websites from all Greek companies (%) (ELSTAT,
2014)
From the questionnaire used in the present study, on the query whether they
have a website or use on-line advertisement, among the 69 dairy units’ owners 73.9%

57
confirmed the use of a website. Among them, 54% claimed that the website had a
positive effect on their business, 36% did not see any significant difference and 10%
did not notice any improvement.

58
Chapter 4. Agrotourism and the dairy sector
4.1. Agrotourism at global, European and Greek level
Agrotourism is a specific practice of rural tourism and thus a significant
development strategy of disadvantaged areas in the European Union. Agrotourism
contributes, among others, to the improvement of farmers’ income, the promotion of
entrepreneurship, the restrain of the rural population in the place of residence and the
trade of agricultural products (www.minagric.gr). One of the main objectives of
agrotourism is to preserve the physical environment and in this sense proper planning
is a prerequisite for a smooth development.
Globally, the US has the most long-term development path of agrotourism that
appeared during the 1960s. Moreover, remarkable growth is observed in China, Japan
and Australia. At European level, the development of agrotourism is a guiding policy
of the EU and as a result many European producers implement agrotourism practices
and generate big revenues (Kazantzidou, 2014). It is implemented with great success
over the past 30 years and is constantly evolving and improving. Nowadays, the
number of agrotourism units exceeds 600.000, fact that proves the positive attitude of
most European countries towards the development of agrotourism (Tsapaki, 2011).
In Greece, agrotourism developed substantially in recent years, namely, from
1991 onwards, by applying tourism investments in the framework of the structural
policy of the EU and in particular with the Community Initiatives, Leader I, II and
Leader plus. The main body in Greece for agrotourism development is the public
sector. Local authorities can also play important role due to their broader experience
and knowledge about rural areas. However, decisive factor in the development of
agrotourism is the private initiative (Kazantzidou, 2014). Unfortunately, there are no
official figures regarding agrotourism businesses in Greece. However, according to
estimates, there are 2.500-4.000 companies (www.chania-info.gr).
The classification of a business as an agrotourism one presupposes the
acquisition of the special agrotourism brand. It is a brand with a specific logo awarded
by the Ministry of Economy, Development and Tourism (www.minagric.gr). The new
institutional framework for the operating conditions of agrotourism in Greece has
been completed, since the relevant legislation was passed in August 2015 by the
Greek parliament. However, according to professionals of the sector, there are many
issues to be further discussed and solved as a clear delimitation of agrotourism objects
is needed (www.agronews.gr).
4.2. Agrotourism and the Greek dairy sector
The gastronomic wealth of Greece, with the wide variety of traditional products,
is an integral part of quality and comprehensive provision of agrotourism.
Agrotourism can contribute to the enhancement and the promotion of local products
with marks of quality and brand.
With regards to the Greek dairy sector, it should be mentioned that the dairy
units providing agrotourism activities are not officially registered. Unfortunately,

59
there are no data regarding their number or location. So far, neither the Ministry of
Economy, Development and Tourism nor any public body has ever published any
official list including these specific units. However, the better organization of this
sector is necessary and the competent bodies should take this into consideration.
At this point it is worth mentioning the initiative of the Hellenic Chamber of
Hotels for the “Establishment and promotion of the Greek breakfast”. This is a highly
innovative action designed and implemented in 2010 and plays an important role in
promoting local cheeses and other dairy products of each region along with a number
of other traditional products. Through the implementation of the “Greek breakfast’’
initiative, the visitor has the opportunity to taste a variety of excellent local cheeses,
traditional yogurt, goat and sheep milk, sour milk and butter that are locally produced.
It is anticipated that the visitor who tastes the local products will look for and
purchase regularly the ones he/she liked the most. Furthermore, the aim of the
initiative “Greek breakfast’’ is not only to enable the visitors to experience the
abundant gastronomic richness of Greece but also give the consumers the opportunity
to meet producers and to come in contact with the domestic dairy production
(www.greekbreakfast.gr).
Furthermore, an essential part of agrotourism is that the farmer-entrepreneur
provides visitors an authentic and first-hand experience regarding food production
practices. Thus, the agrotourist would be able to visit a dairy plant and participate, for
example, in the process of cheese-making, production of yogurt and other dairy
products. This way, the visitor is able to source in place the products of his choice
while the unit can have retail sales of the products contributing to their promotion.
In addition, cooperation and coordination between tourism entrepreneurs and
representatives of the primary and secondary food sector in each region seems to be
necessary. The exchange of experience along with collective actions will contribute to
the improvement of services for the benefit of all.
4.3. Prospects for the development of agrotourism in Greece
The Ministry of Economy, Development and Tourism has recently announced
the National Strategic Reference Framework (NSRF) 2014-2020, which is expected to
significantly contribute to the development of agrotourism. Specifically, the new
program covers several strategic areas of action, including the agri-food sector and
tourism contributing, thus, to the modernization of existing micro and small
businesses but also to the development of healthy startup companies
(www.aftodioikisi.gr).
Agrotourism is considered a sector with growth potential and can be an
alternative approach in the development of entrepreneurship in rural areas combined
with sustainable development. In Greece, there is an untapped potential that can create
a particular model of agrotourism in many regions. This potential refers to
authenticity and uniqueness in all forms and expressions (www.in.gr).
Despite all the constraints mentioned above, the Tossizza-Averoff Foundation
dairy unit located in Metsovo, Epirus can be considered as a shining role model of
agrotourism in. Besides milk processing and production of well known and popular

60
dairy products, e.g. the Metsovone cheese, the unit offers guided tours throughout the
production facilities telling the history of the traditional cheese manufacture
techniques and ending up with tasting and purchasing the fine cheeses produced there.
At least 10.000 visitors each year live the unforgettable experience in the “Katogi
Hotel”of the Tossizza-Averoff Foundation, strengthening the local community with
other activities as well. Chapter 6 of the present work is dedicated to this unit as an
intriguing case study in the dairy sector in Greece.
61
Chapter 5. Education of prospective milk processors
The prospective milk processors in Greece can either attend long term training
programmes or short term seminars carried out by official state educational
institutions. Occasionally, short term seminars are even organized by private
educational entities.
Dairy Vocational School of Ioannina (Galaktokomiki EPAS Ioanninon).
The School operates in the context of the Organization of Agricultural Vocational
Education Training and Employment (O.G.E.E.K.A "Dimitra"), which is an
organization supervised by the Ministry of Agriculture and Food of the Hellenic
Republic aiming at fulfilling the rural populations' needs for education, vocational
training and information. The 2-year studies are attended by 60 students per academic
year. The curriculum involves both theoretical courses, e.g. Dairy Science and
Technology, Dairy, Agricultural Economy, Food Hygiene and Safety, Dairy
Processing Units Equipment, Informatics on Dairy Practice, as well as practical
training at the cheese dairy plant of the School. Particular emphasis is given on
provision of knowledge on design, installation, equipment selection and operation of a
contemporary dairy processing unit regardless the size. Moreover, special attention is
paid to issues concerning proper packaging, e.g. legislation, methods, materials etc,
hygienic production of safe milk-derived aliments and hygiene and safety at the
workplace .
Through a range of practical courses, the students are trained on all stages of the
manufacturing technology for a wide variety of Greek cheeses, both PDO and non-
PDO traditional ones, and other dairy products, and on performing all necessary
chemical and microbiological analyses of milk and dairy products. The School
receives on a daily basis 400-700 kg of cow and/or sheep and/or goat milk, i.e.
approximately 40-45 tons/year, which are used for the practical training of the 2nd
year students. More than 50% of the produced dairy products are consumed at the
School's restaurant by the students themselves, a big part (2-2,5 tons/year) is granted
to charitable foundations and only a small percentage (maximum 10%) is used for the
School's public relations and the staff.
The education is supplemented with extra-curriculum workshops and lectures
given by acknowledged scientists and professionals. Furthermore, 1-day or several-
days educational visits at dairy processing units or food exhibitions are organized.
Finally, educational visits in the context of the implementation of EU programmes are
organized, such as the Lifelong Learning Programme "Leonardo da Vinci".
Students eligible for the School are graduates of at least the first class of the
compulsory Secondary Education. Priority is given to young people with parents
having farming as the primary occupation, or with at least one year working
experience in posts relevant to dairy processing, or originating from mountainous,
sylvan or border areas and finally students belonging to special categories, e.g.
families with more than three children. All students have access to the School's
dormitory with free accommodation and meals.
Nowadays, the vast majority of the applicants have completed all classes of
compulsory education and even some cases of higher education graduates have been
reported. Until 2010, the applications did not exceed the number of 80, while in some

62
school periods only one class with 30 students or less operated. From 2011 onwards,
applications gradually increased, with 150, 170, 210 and 180 applications in the years
2011, 2012, 2013 and 2014, respectively, which proves both the attractiveness of the
specific curriculum as well as School's reputation and recognition.
American Farm School. It is a non-profit educational institution, with 2
schools, namely the general high school and the vocational high school, both offering
high quality secondary education with a holistic and contemporary approach,
cultivating at the same time the environmental awareness.
Concerning the vocational high school educational programme, students with
completed primary education are eligible. A post-secondary optional year-long course
for further training is available for the graduates that is called provision
apprenticeship. The graduates of this school receive a 3rd level specialty degree. Apart
from the theoretical education, many laboratories are used for the practical training,
which are based on an experiential learning under normal working conditions,
enabling students to better assimilate the theory. A special emphasis is also given to
English and computer skills. There are 6 study directions, with one on dairy
processing entitled "Food and Drinks Technology Technician". Besides the standard
courses offered in the context of the school's educational programme, students
attending the aforementioned direction take extra courses and practical training in the
laboratories of Food Technology and Dairy Science and Technology.
The students have the opportunity to participate in EU mobilization
programmes, so as to visit similar schools around Europe, where they can take extra
practical training and even participate in international fairs. They also have the
opportunity to participate in educational programmes in Texas, participate in the
student-exchange programme "4-H" in the US and attend summer programmes in
several Universities in the US.
The vast majority of the students of the vocational high school are boarder
students that have received either a full or a partial scholarship. All students can eat at
the school's restaurant, which provides four meals daily in very low prices. The
ingredients used for the meals mainly derive from the school's laboratories and
training farm.
In the context of the American Farming School a Level 2 Lifelong Learning
Center operates as well, which is a certified organization by the National
Qualification Certification Agency and Vocational Guidance (E.O.P.E.E.P) that is
supervised by the Greek Ministry of Education. It carries out open educational
programmes that follow the school's principles for qualitative experiential education.
The topics that are relevant with the dairy education are the following; Food
Technology, Biosafety, Rural Finance and Administration. In the context of the first
topic, three different seminars are available: Milk Processing (all products apart from
cheese), Amateurish Cheese making and Professional Cheese making. Attendants of
the seminar of Professional Cheese making have the opportunity to participate in
exams for the acquisition of the Certified Cheese Making Technician Certificate. The
second topic involves seminars that concern not only milk production and dairy
technology but also other issues of interest in the agribusiness sector, namely e-
Commerce of farm products, Standardization of farm products, Costing of farm
products, Agrotourism and Countryside tourism, Export Trade and Opening, and

63
Management of Agribusiness. All the aforementioned programmes last one semester,
either spring or winter and almost all of them are organized every year upon payment.
Aristotle University of Thessaloniki. Every year, Seminars of Theoretical and
Practical Cheese Making are organized in the context of a Lifelong Learning
Programme, upon payment. The aim of this open programme is to train participants in
cheese manufacturing and to deepen in issues concerning good industrial practices.
Special attention is given to problems and defects so as to avoid any possible failures
in the final product. Attendants also receive special training in the manufacturing of
traditional Greek dairy products, such as traditional Greek yogurt, white brine cheeses
(Feta and Teleme), whey cheeses (Myzithra, Anthotyro, Manouri), Graviera,
Kefalotyri etc. The participants are also trained in the necessary microbiological and
chemical analyses of milk and dairy products.
The seminars are carried out in two courses, A and B. Course A with 36 hours is
manly focusing on theoretical aspects of dairy science and technology. Course B with
64 hours on the other hand includes practical training. Successful completion of
course A or certified adequate knowledge in dairy products technology are required
for attending course B. A training certificate is obtained upon attending both courses
and succeeding in the final exams.
Institute of Agricultural Sciences. It is a public entity under the auspices of
Ministry of Rural Development and Food and manages the Legacy of IFIGENIA
SYNGROS. It contributes to the development of Greek Agriculture by offering
training in specific agricultural topics. Concerning the dairy sector, it organizes every
year theoretical seminars in Dairy Technology and Cheese making. The seminars are
open and last 120 hours and are upon payment. Further two fast track seminars (80
hours) on "Business planning in Agricultural sector" and "Marketing of Agricultural
Products" are also of interest for the dairy sector applicants.
Agricultural University of Athens. So far, the Agricultural University of
Athens is occasionally organizing educational seminars at random intervals. The most
recent seminar concerning the dairy sector was carried out from September 30th to
October 23rd, 2013, under the title "Milk Processing Units". Totally, 94 people
attended this seminar. Another interesting seminar entitled "e-Commerce in
Agricultural Products' Promotion", was carried out from September 30th to October
12th.

64
Chapter 6. Baron Michael Tossizza-Averoff Foundation Dairy: A Case Study
Description. Baron Michael Tossizza-Averoff Foundation is a legal body, to
which the homonym dairy belongs. It is a private-law charitable foundation run by a
7-member management board. It was founded in 1987 by Evanglos Averoff-Tositsas
and its original composition was set by the founder himself. In the context of the
foundation also belong other operational entities, such as the Tositsa student
dormitory for students from Metsovo in Kifissia, Athens, the Folk Art Museum of
Metsovo and Evangelos Averoff Art Gallery in Metsovo. The headquarters of the
Foundation are in Athens, 9 Kolokotroni Str., while the dairy is located in the town of
Metsovo, regional unit of Ioannina. Metsovo is a mountainous region in an altitude of
1160 meters. The dairy employs 13 people and processes 7-8 tons/day of cow milk
throughout the year, 500-600 kg/day of sheep milk when available and 500-600
kg/day og goat milk when available.
History and Tradition. The Baron Michael Tossizza-Averoff Foundation
Dairy was founded in 1956 by Evangelos Averoff by using funds from the legacy of
Michael Tossizza, who was a rich heirless Greek emigrant in Switzerland. His vision
was not just simply create jobs for the local people but to operate a dairy that would
have the form of a cheese making school, setting thus an example to the local cheese
makers. Evangelos Averoff supported young people of Metsovo, coming from
families with a long tradition in livestock breeding and cheese making, to attend
cheese making schools in Italy. Many of the apprentices of the foundation's dairy
established their own dairies in the region of Epirus. Even nowadays this tradition is
still alive; Mr. Tzompikos Giorgos, the head cheese maker of the dairy, whose
grandfather was a livestock breeder and who showed from his childhood years an
inclination towards his ancestor's activities, was chosen to become the next head
cheese maker at the age of 15 by his predecessor. He was fully funded from the Baron
Michael Tossizza-Averoff Foundation to attend the American Farm School in
Thessaloniki, Greece, and afterwards a cheese making school in Regina, Italy, before
returning back to the Baron Michael Tossizza-Averoff Foundation Dairy.
Products. The dairy produces five different kinds of cheeses and also butter.
The cheeses that emerged as the crosslink of Greek traditional practices and
traditional Italian manufacturing techniques, brought in Metsovo from the scholar
cheese makers, were Metsovone, a smoked Pasta Filata cheese named after the Italian
Provolone cheese, and Metsovana, the famous extra hard Italian cheese Parmiggiano
paraphrased in Greek as Parmezana. The cheese makers, who firstly manufactured
these cheeses, had chosen to apply techniques similar to the corresponding Italian
ones because they believed that their requirements fitted to the produced milk in the
mountainous district of Metsovo. Metsovone. It is a smoked Pasta Filata cheese from
cow milk, rarely mixed with less than 5% of goat milk. It is produced all year around.
It is important to mention that although Metsovone was designated as PDO cheese in
1994, six years later the dairy requested the cancellation of the PDO appellation, since
it was the only unit allowed to produce this cheese. According to its specifications,
the milk should be obtained exclusively from herds around the town of Metsovo.
However, the milk produced in this area is often not sufficient for the capacity of the
dairy unit, i.e. possessing daily 7-8 tons of cow milk into Metsovone, and in that cases
65
milk from adjacent villages is also obtained. Metsovana. It is an extra hard cheese
prepared exclusively from cow milk with a ripening time of 2 years and usually
produced from May to September. Graviera. It is a hard cheese exclusively produced
from sheep milk, usually produced May to July. Metsovella. It is a semi-hard cheese
made from 80% sheep milk, 10% goat milk and 10% cow milk. It is usually produced
from December to April. Gidisio-Metsovisio. It is a chevre-type cheese prepared
from goat milk rarely mixed with less than 5% of sheep milk. It is usually produced
from January to July. Butter. It is made exclusively cow milk.
The products from the Baron Michael Tossizza-Averoff Foundation dairy enjoy
reputation and recognition from the very first years of production, both at local and
national level. In particular, Metsovone is one of the most well known and cherished
Greek traditional cheeses, with a fame exceeding the limits of the country. Mr.
Tzompikos claims that the fame of the dairy's products is due to the uniqueness of
their organoleptic characteristics. More specifically, he attributes this uniqueness to
two basic parameters, namely milk quality and manufacturing techniques.
Milk quality is the most important parameter. The milk used comes from
animals that are bred in Metsovo and in the adjacent villages of Anilio and Votonosi,
all belonging to the municipality of Metsovo. When the vegetation is at its best, the
animals are grazing in a wide variety of pastures rich in herbs. These herbs contain
aroma compounds that confer to milk particular tasting notes, which are then
transferred to the final product. Moreover, Mr. Tzompikos himself has full
supervision of the animal herds. Moreover, he often performs qualitative analyses of
the supplementary feed given to the animals during the months with forage shortage.
Furthermore, he makes sure that all these animals are always in perfect hygienic and
health conditions. As a result, very few milk batches are found with more than 8.000
total viable bacteria counts. Additionally, the incoming milk has a very good yield,
which is attributed to the local breeds' genetic potential regarding protein content. In
particular, the % protein content is (a) in cow 3,6, (b) in goat 4,4-4,5 and (c) in sheep
4,8-5,2, during winter time, and 5,9-6,45 during summer for milk from mixed herds.
For all the above reasons, the dairy buys the milk in quite satisfying prices, namely
1,12 €/kg for sheep milk, which is normally priced 0,93 €/kg on average (ELOGAK,
2014), 0,60 €/kg for goat milk, which is normally priced 0,56 €/kg on average
(ELOGAK, 2014) and 0,65 €/kg for cow milk, which is normally priced 0,43 €/kg on
average (ELOGAK, 2014). It should be pointed out that Mr. Tzompikos was
concerned about the fact that more and more breeders tend to replace a big part of
their animals with non-autochthonous Greek breeds, altering thus the typical quality
features of the final products of the unit.
The applied manufacturing techniques are a result of the traditional practices
that have been developed over the years in combination with all the contemporary
developments in cheese making. The rennet and the starter cultures used are own-
produced.
Key of success. The success of the dairy can be attributed to the full
exploitation of the funding provided by the Baron Michael Tossizza-Averoff
Foundation and the direct link between the products with the area of Metsovo as a
whole. Metsovo is a picturesque mountainous town surrounded by beautiful natural
landscapes, which has always been a pole of attraction for tourists, both from Greece

66
and abroad. It also has some interesting sites, such as the Folk Art Museum, the
Evangelos Averoff Art Gallery, three old monasteries well preserved, the Averoff
Winery and Averoff Botanical Garden. Moreover, it is very close to the city of
Ioannina and other towns and villages of Epirus that also attract tourism. It is also an
attractive spot for winter sports enthusiasts with ski resort as well as mountain routes
passing through the town. Furthermore, Metsovo is famous for its restaurants that are
offering exceptional local traditional dishes and roasted meat from local herds. The
dairy's connection with the touristic activity of Metsovo is particularly strong:
The vast majority of the restaurants are obtaining their dairy products from the
foundation's dairy and this is indicated in the menu
A number of hotels serve dairy products from the foundation's dairy at the
breakfast. Pretty interesting is the case of Katogi Averoff Hotel, which, apart
from serving these products, it is also affiliated with the "Greek Breakfast"
initiative
There are a number of shops, the majority of which are located in the central
square of Metsovo, a well-known touristic traffic crossroad. The shops sell
traditional food products, mostly hylopites (the local pasta), cheeses and cold
cuts. Most shops are selling the cheeses from the foundation's dairy
The aforementioned, in combination with the fact that the dairy is open to
tourists and any other kind of visitors strengthen the dairy's connection with its
cultural environment, the area's traditional cuisine and gastronomy, and the local
hospitality services, which are all aspects of agrotourism activity. Thus, the dairy not
only promotes and sells its own products but it also becomes a vital pilar for the
development of a continuously growing tourist activity with multiple benefits for the
local economic and social development, namely agrotourism. According to Mr.
Tzompikos, the biggest part of the dairy’s products is sold to the local retailers and
retailers and supermarkets in the administrative region of Ioannina. Limited quantities
are distributed mostly to retailers and supermarkets in the rest of Greece. Minor
quantities are being exported to the EU, through "Ergon", a local brand that promotes
Greek traditional products both in Greece and abroad. The recognition of the dairy's
products is that big, that the dairy does not have any costs for the promotion of these
products at the top shelves of big supermarket chains. As Mr. Tzompikos claims, the
products themselves are an advertisement for the dairy.
Financial data. According to Mr. Tzompikos, Baron Michael Tossizza-Averoff
Foundation Dairy is profitable, with 90% of the profits deriving from Metsovone
cheese. In particular, this cheese brings profit of 1 €/kg. Metsovisio-Katsikisio is the
2nd most profitable product, followed by Metsovella, Graviera and finally Metsovana.
Conclusions. The dairy's success to reach the market both at local and national
level, its connection with the local (agro) touristic activity and its products'
recognition having premium characteristics closely affiliated to its mountainous origin
make Baron Michael Tossizza-Averoff Foundation Dairy a successful dairy enterprise
that could set an example to other dairies in a country with extended mountainous
regions.

67
71.1
17.8
2.28.9
0
10
20
30
40
50
60
70
80
<2 2-10 10-43 >43
%
(a)
43.8
28.8
13.7
4.19.6
0
10
20
30
40
50
%
(b)
Chapter 7. Questionnaires: Existing producers and prospective newcomers
For the needs of the present study, two questionnaires were composed, one
addressing existing dairy units and one prospective newcomers to the dairy sector.
The first one was completed mostly via phone contacts and in a lesser degree through
personal contacts, while the second one exclusively via internet, i.e. e-mails, social
media and targeted web sites. A major problem with the first questionnaire was the
reluctance to answer. Moreover, although a significant number (56) of existing dairy
unit owners requested the dispatch of the questionnaires to their personal or company
e-mail due to lack of time for a phone interview, only 7 of them actually responded.
Thus, the sample was at the end relatively small.
7.1. Existing producers
The questionnaire included a range of queries regarding both the current status
of the unit as well as plans and willingness to further develop. Out of the 724 existing
dairy units in Greece (ELOGAK, 2014), 73 responded eventually to the questionnaire,
which makes 10,08% of the total, a rather sufficient ratio to ensure the reliability of
the results. The majority were owners of small enterprises, with capacity <1000
tons/yea, that produce only a limited variety of dairy products.
According to the results, 71,1% of the milk processing units have an annual
turnover of <2 million euro and 88,9% <10 million euro (Figure 7.1a), which are all
considered small enterprises according to the EU legislation (EU Recommendation
2003/361). The majority of the surveyed processing units processed a small annual
quantity of milk, namely 43,8% have a maximum capacity of 400 tons/year while
28,8% a capacity from 400-1000 tons/year (Figure 7.1b).
Figure 7.1. Distribution of dairy enterprises according to (a) the annual turnover (in million euro) and (b)
the annual capacity (in tons)
Concerning the origin of the incoming milk, 87,5 % of the units obtain the milk
needed from livestock breeders and only 12,5 % are own producers. Among the units
that buy milk, 86,1% buy it from livestock breeders within the regional unit where the

68
21.9
28.8
15.1
119.6
5.5
2.71.4
2.71.4
0
5
10
15
20
25
30
35
1 2 3 4 5 6 7 8 9 10
%
number of product categories
dairy is located, 37,5% from livestock breeders outside their regional unit and 4,2%
from the EU. The last units usually are of bigger capacity.
Regarding starter cultures, 87,3% buy the starter cultures used from dedicated
companies abroad while only 12,7% use their own cultures. Interestingly, 56,7% are
positive towards the perspective to use starter cultures that have been isolated from
Greek traditional dairy products, while 23,9% and 19,4% rather hesitate or are
completely negative, respectively. It should be noted that the Laboratory of Dairy
Research at the Agricultural University of Athens has a dairy starter cultures
collection and several strains of this collection are currently commercialized
worldwide for yogurt production.
The majority of the enterprises produce only a limited number of dairy products
categories, namely 21,9% produce only one category, e.g. cheeses only, 28,8% two
categories, e.g. cheese and butter, while 1,4% ten categories, e.g. drinking milk,
butter, yogurt, chocolate milk, cream, rice pudding, sour milk, milk-based desserts,
cheeses and PDO cheeses (Figure 7.2).
Figure 7.2. Dairy enterprises according to the number of product categories
The majority of the dairy units owners with capacity <400 tons per year believe
that their distribution network is not adequate and it needs to be expanded, unlike the
rest, who believe that it is adequate enough (Table 7.1).
Table 7.1. Adequacy of the company's distribution network
Annual capacity (in tons) Adequate Not adequate
<400 33.9% 66.1%
>400 60% 40%
Most dairy units’ owners are being paid by their customers in a short period of
time and they also pay their suppliers quite soon (Figure 7.3). In the question whether
there have been cases that their customers did not pay them at all, 36,6% answered

69
31.9
36.2
24.6
7.2
45.7
38.6
10
5.7
0
5
10
15
20
25
30
35
40
45
50
immediately 3 months 6 months > 6 months
%
payment(customers)
payment(suppliers)
that this happens very often, 53,5% answered it happens very few times and only in
9,9% cases this had never occurred.
Figure 7.3. Time of payment by customers and to suppliers
While 73,9% of the dairy enterprises have a website, 54% claim that it helped
them to promote their products. The majority, namely 79,5%, advertise their
companies and products, with 56,2% mostly through their websites and a small
percentage through other means.
Almost half (48,3%) of the dairy enterprises with a capacity <400 tons/year and
66,7% of the dairy enterprises with an annual capacity of 400-1000 tons, claim that
they have moderate vacant capacity. Concerning those with a capacity of 1000-2500
tons annually, 50% claim that they have no vacant capacity at all, while 30% have
moderate vacant capacity. None of the dairy units with capacity > 2000 tons/year
claim that they use little or very little of their equipment's capacity.
Concerning the way the entrepreneurs evaluate themselves the infrastructure of
their units, 23,9% believe that this is very satisfying and 28,2% satisfying enough,
39,4% moderate and 8,5% not adequate enough. The opposite is recorded concerning
the way they evaluate the level of their own know-how, since 34,7% claim that this is
perfect, 41,7% very good, 18,1% mediocre and only 4,2% not adequate enough.
Towards the query about the impact of the recent financial crisis in Greece,
56,1% of the entrepreneurs claim that they have been affected either very little or not
been affected at all. However, 39,7% said that they have been significantly affected
or even affected to such as degree that are intending to suspend the enterprise's
operation. Only a 4,1% claimed that the financial crisis affected them positively.
Among the entrepreneurs, 51,5% expressed their willingness to cooperate with
other entrepreneurs of the dairy sector, while the rest were either negative or had
reservations. This latter observation is indicative of the entrepreneur's suspiciousness
towards cooperative ventures and it explains the reason why Greece lacks inter-
professional organizations. Among the dairy units that expresses interest in
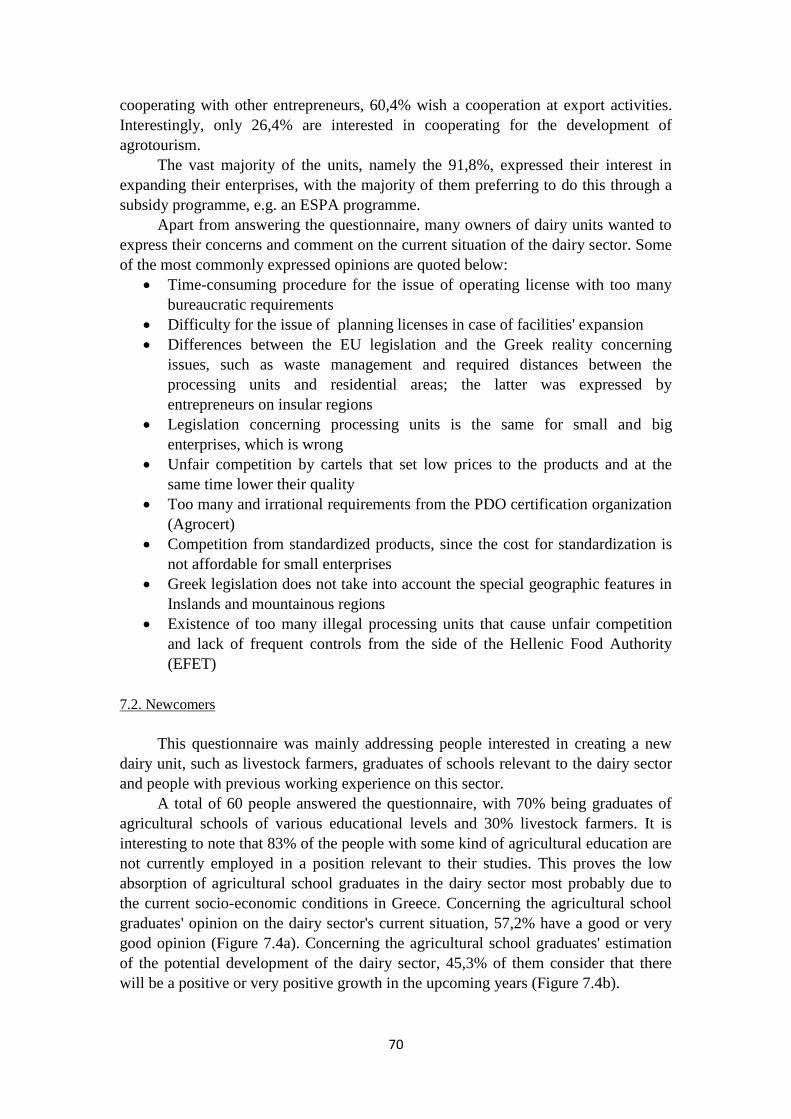
70
cooperating with other entrepreneurs, 60,4% wish a cooperation at export activities.
Interestingly, only 26,4% are interested in cooperating for the development of
agrotourism.
The vast majority of the units, namely the 91,8%, expressed their interest in
expanding their enterprises, with the majority of them preferring to do this through a
subsidy programme, e.g. an ESPA programme.
Apart from answering the questionnaire, many owners of dairy units wanted to
express their concerns and comment on the current situation of the dairy sector. Some
of the most commonly expressed opinions are quoted below:
Time-consuming procedure for the issue of operating license with too many
bureaucratic requirements
Difficulty for the issue of planning licenses in case of facilities' expansion
Differences between the EU legislation and the Greek reality concerning
issues, such as waste management and required distances between the
processing units and residential areas; the latter was expressed by
entrepreneurs on insular regions
Legislation concerning processing units is the same for small and big
enterprises, which is wrong
Unfair competition by cartels that set low prices to the products and at the
same time lower their quality
Too many and irrational requirements from the PDO certification organization
(Agrocert)
Competition from standardized products, since the cost for standardization is
not affordable for small enterprises
Greek legislation does not take into account the special geographic features in
Inslands and mountainous regions
Existence of too many illegal processing units that cause unfair competition
and lack of frequent controls from the side of the Hellenic Food Authority
(EFET)
7.2. Newcomers
This questionnaire was mainly addressing people interested in creating a new
dairy unit, such as livestock farmers, graduates of schools relevant to the dairy sector
and people with previous working experience on this sector.
A total of 60 people answered the questionnaire, with 70% being graduates of
agricultural schools of various educational levels and 30% livestock farmers. It is
interesting to note that 83% of the people with some kind of agricultural education are
not currently employed in a position relevant to their studies. This proves the low
absorption of agricultural school graduates in the dairy sector most probably due to
the current socio-economic conditions in Greece. Concerning the agricultural school
graduates' opinion on the dairy sector's current situation, 57,2% have a good or very
good opinion (Figure 7.4a). Concerning the agricultural school graduates' estimation
of the potential development of the dairy sector, 45,3% of them consider that there
will be a positive or very positive growth in the upcoming years (Figure 7.4b).
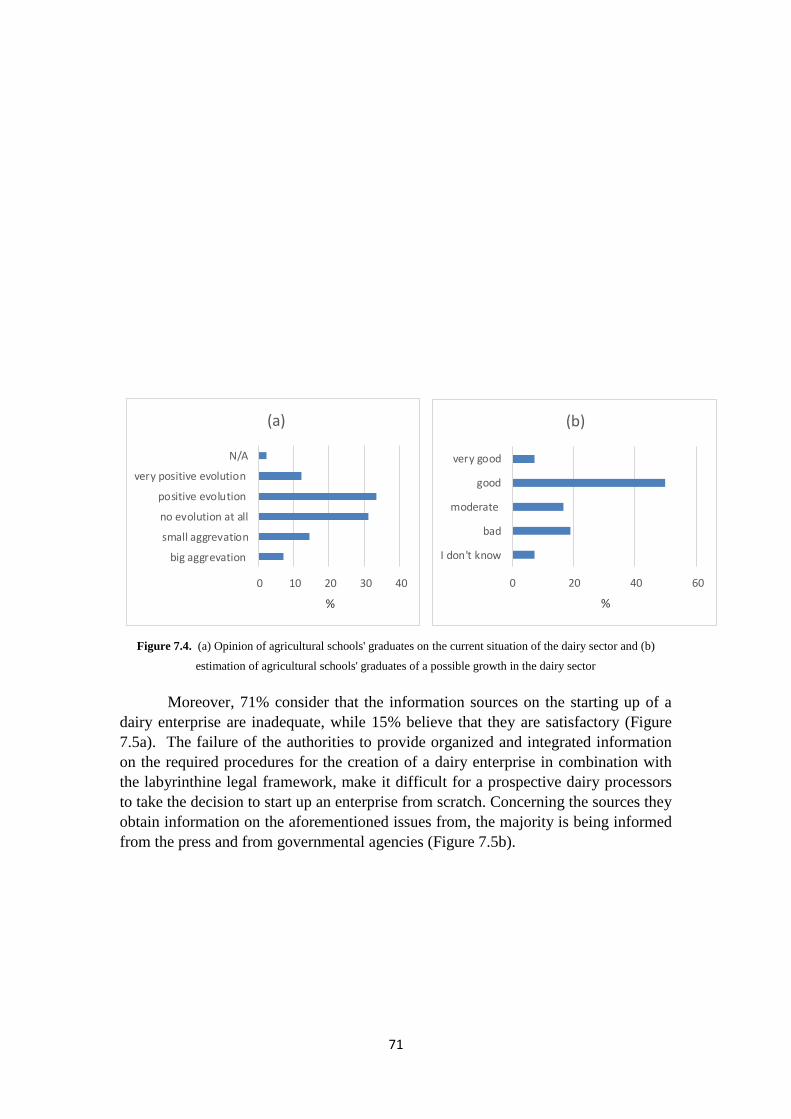
71
0 10 20 30 40
big aggrevation
small aggrevation
no evolution at all
positive evolution
very positive evolution
N/A
%
(a)
0 20 40 60
I don't know
bad
moderate
good
very good
%
(b)
Figure 7.4. (a) Opinion of agricultural schools' graduates on the current situation of the dairy sector and (b)
estimation of agricultural schools' graduates of a possible growth in the dairy sector
Moreover, 71% consider that the information sources on the starting up of a
dairy enterprise are inadequate, while 15% believe that they are satisfactory (Figure
7.5a). The failure of the authorities to provide organized and integrated information
on the required procedures for the creation of a dairy enterprise in combination with
the labyrinthine legal framework, make it difficult for a prospective dairy processors
to take the decision to start up an enterprise from scratch. Concerning the sources they
obtain information on the aforementioned issues from, the majority is being informed
from the press and from governmental agencies (Figure 7.5b).

72
0 20 40 60 80
I do not know
incomplete
satisfactory
N/A
%
(a)
18.6
37.2
15.3
27.2
1.7
0
5
10
15
20
25
30
35
40
1- 3 days 1 week 1 month > 1 month N/A
%
Figure 7.5. (a) Existing informative sources on the required procedures for the starting up of a dairy
enterprise and (b) sources of information on issues concerning the starting up of a dairy enterprise
It is interesting to mention the results of a former study, where livestock
breeders were questioned how much the starting up of a small dairy enterprise would
cost; 64,5% of them estimate that the costs range between 50.000 to 350.000 euro
(Psarrakis et al., 2015).
Concerning previous experience in attending training seminars, 64,4% have not
attended any. Among the rest who have attended one or more seminars, 85% believe
that it helped them in enriching their knowledge on issues concerning the dairy sector
as a whole. Moreover, 37,2% consider that the ideal duration of a training seminar is
one week, while 27,2% believe that it should last longer than a month (Figure 7.6).
Finally, 46% believe that the most important limiting factors for the starting up of a
dairy enterprise are financial, namely the personal deficit of money, the inability to
get the approval for a bank loan and the unstable financial situation of the Greek
economy.
Figure 7.6. Opinion on the ideal duration of a training seminar
0 10 20 30 40
the press
other sources
I do not get informed
professionals of the…
governmental agencies
social media
%
(b)

73

74
Chapter 8. Conclusions
1. Summary consideration of capacity and prospects in agriculture and food
sector
The dairy sector in Greece is well developed. It comprises of 53 big dairy
companies processing >5000 tons of milk per year and 671 SMEs or family dairy
units processing <5000 tons of milk per year. They process all types of milk produced
in Greece, namely 730.589 tons of cow milk, 735.669 of sheep milk, 350.871 tons of
goat milk (production data in 2013) into a big variety of products, with the major
ones being drinking milk, yogurt and cheese. In particular, the processing of sheep
and goat milk, which can be considered as the competitive advantage of the Greek
dairy sector, is mainly in the hands of SMEs and family dairy units. The dairy sector
provides work to a total of 11.802 employees and makes 17,3% in production value of
the food sector as a whole, which in turn makes in value almost 1% of the Greek
economy (GDP) from a total of 3.3% of the whole rural sector’s participation to the
GDP.
With appropriate interventions, the Greek dairy sector has all prospects for a
significant growth in the near future. These innervations include:
Full use of the current vacant capacity of units by increasing production
and availability of milk
Modernization of the infrastructure of dairy units, especially of the
SMEs and family units
Full implementation of good practices and quality assurance procedures
during milk processing
Reinforce the marketing and distribution networks, and development of
e-commerce
Focusing on the production of dairy products of high added value, such
as traditional and PDO products, e.g. cheeses, as well as specialty and
innovative products, e.g. functional dairy products
Strengthening the agrotourism
Simplified procedures regarding licensing for installing a unit
Implementing recent legislative regulations regarding dairy professional
and inter-professional organizations
2. Accessibility and attractiveness (or discouragement) as youth employment
opportunity, for youth new to farming and those with experience
The dairy sector in Greece is currently employing 11.802 employees.
Interestingly, for a high number of graduates from dedicated University Department
the access is rather limited. This is due to the excessive number of this type of
graduates compared to the positions available in the big dairy companies and also the
fact that big dairy companies try to maintain operational costs lows. At the same time,
SMEs and family dairy units do not often employ dairy scientists basically for cost
reasons as well.

75
However, the last 5 years and due to the economic crisis in Greece, there is an
emerging tendency, especially among young people, to re-visit the agro-food sector in
Greece and in particular dairy farming and dairy processing. In this sense, we
consider that the current project is of significant importance for Greece.
3. Consumer habits and growth potential as well as export potential
The share of the expenditure for milk and dairy products within the food
expenditure as a whole has remained almost stable between 2008 and 2014, fact that
reflects the important position of dairy products in the dietary habits of the Greeks.
Regarding milk, most consumers prefer pasteurized milk while high-temperature
pasteurized milk comes second in quantity, claiming at the same time an increasing
market share. The consumers’ preference in yogurt mainly refers to stained yogurt
and in particular yogurt from cow milk. With regards to cheeses, the category of “soft
cheeses”, which includes basically Feta cheese, ranks by far first in consumers’
preferences followed by “hard and semi-hard cheeses”, while at the same time
imported hard and semi-hard cheeses are becoming also popular, mainly because of
their lower prices. Still, the majority of the consumers choose PDO/PDI Greek
cheeses, with goat milk cheeses being very appealing because of the so-called
functional properties.
Feta cheese, as the worldwide well known flagship of Greek cheeses, and the
Greek yogurt, which is dynamically emerging around the globe in recent years, can
and should be used as precursors for the promotion of other Greek traditional and
PDO dairy products and facilitate their access in the international markets. Although
Greece is a small dairy “garden” in terms of quantities, it should exploit the high and
particular quality of sheep and goat milk to produce specialty dairy products.
4. Regional considerations
Primary milk production in Greece is mainly concentrated in Central Macedonia
and Eastern Macedonia and Thrace (cow milk), Thessaly and Western Greece (sheep
milk) and Central Macedonia and Thessaly (goat milk). With respect to big dairy
units, these are mainly concentrated in the regional units of Attica (Athens) and
Thessaloniki. On the other hand, SMEs and family dairy units are spread all over the
country, while traditional and PDO cheeses, mainly produced from sheep and goat
milk are deriving both from the mainland, such as mountainous areas mainly the
Pindos sierra (Grevena, Ioannina and Trikala) and the Mount Olympus (Larisa and
Pieria), and the islands mainly Crete and Lesvos. Taking the above into account, we
designed two Business Plans, namely (a) one for the further development of an
existing dairy unit using as an example the region of Arcadia in Peloponnese, which
ranks 1st in sheep and 2nd in goat milk production in Peloponnese, and (b) one for
newcomers in the dairy sector using the Island of Lesvos as an example.
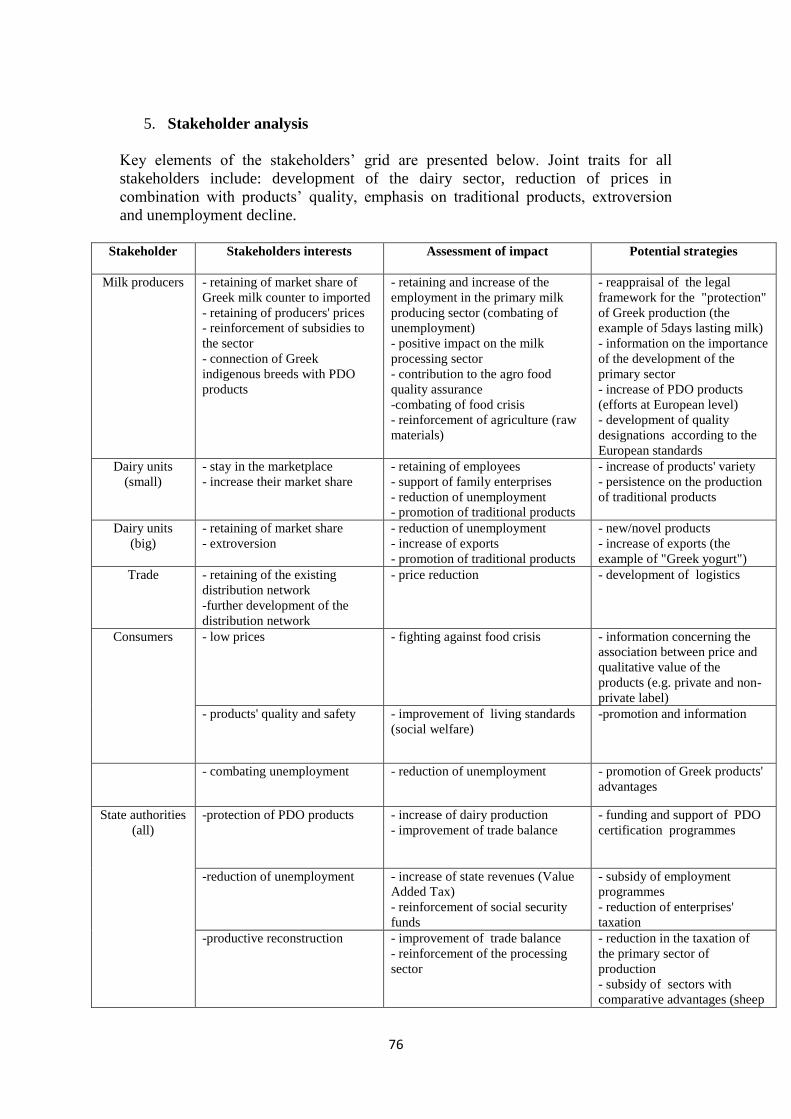
76
5. Stakeholder analysis
Key elements of the stakeholders’ grid are presented below. Joint traits for all
stakeholders include: development of the dairy sector, reduction of prices in
combination with products’ quality, emphasis on traditional products, extroversion
and unemployment decline.
Stakeholder Stakeholders interests Assessment of impact
Potential strategies
Milk producers - retaining of market share of
Greek milk counter to imported
- retaining of producers' prices
- reinforcement of subsidies to
the sector
- connection of Greek
indigenous breeds with PDO
products
- retaining and increase of the
employment in the primary milk
producing sector (combating of
unemployment)
- positive impact on the milk
processing sector
- contribution to the agro food
quality assurance
-combating of food crisis
- reinforcement of agriculture (raw
materials)
- reappraisal of the legal
framework for the "protection"
of Greek production (the
example of 5days lasting milk)
- information on the importance
of the development of the
primary sector
- increase of PDO products
(efforts at European level)
- development of quality
designations according to the
European standards
Dairy units
(small)
- stay in the marketplace
- increase their market share
- retaining of employees
- support of family enterprises
- reduction of unemployment
- promotion of traditional products
- increase of products' variety
- persistence on the production
of traditional products
Dairy units
(big)
- retaining of market share
- extroversion
- reduction of unemployment
- increase of exports
- promotion of traditional products
- new/novel products
- increase of exports (the
example of "Greek yogurt")
Trade - retaining of the existing
distribution network
-further development of the
distribution network
- price reduction - development of logistics
Consumers - low prices - fighting against food crisis - information concerning the
association between price and
qualitative value of the
products (e.g. private and non-
private label)
- products' quality and safety
- improvement of living standards
(social welfare)
-promotion and information
- combating unemployment - reduction of unemployment - promotion of Greek products'
advantages
State authorities
(all)
-protection of PDO products - increase of dairy production
- improvement of trade balance
- funding and support of PDO
certification programmes
-reduction of unemployment - increase of state revenues (Value
Added Tax)
- reinforcement of social security
funds
- subsidy of employment
programmes
- reduction of enterprises'
taxation
-productive reconstruction - improvement of trade balance
- reinforcement of the processing
sector
- reduction in the taxation of
the primary sector of
production
- subsidy of sectors with
comparative advantages (sheep

77
and goat breeding)
-fair competition rules - price reduction
- starting up of new enterprises
- stricter controls
- improvement of legislation
-protection of the environment - diversified touristic development
- harmonization with EU
- institutionalization of
righteousness rules
Banking system
/ Investors
- healthy business financing - stability of banking system - more rational loaning criteria
- repayment ability of loans - reduction of interest rates
- facilitating repayment (due to
the financial crisis)

78
6. Synergies with other sectors and sectoral studies
It goes without saying that the dairy sector, i.e. milk processing, goes hand in
hand with the primary milk production. On the other hand though, in a globalized
economy environment, other sectors, such as product marketing and promotion as
well as distribution practices and networks, are of fundamental importance. Last but
not least, research & development, performed either in house or in collaboration with
research groups in Universities and Research Center, is worldwide acknowledged as a
vital development tool. The Greek dairy sector has to comprehend that all these
synergies are needed for a sustainable growth at EU and international level.
Regarding other sectorial studies, several are being performed at regular time
intervals in Greece. The most important ones have been used for data mining in the
present study, namely those by ICAP, ELOGAK, ELSTAT and IOBE. Moreover, the
EU funded project “LACTIMED Promoting Mediterranean Dairy Products”, which
is currently running under the coordination of the French ANIMA Investment
Network with 3 Greek partners involved, namely the University of Thessaly, the
Union of Hellenic Chambers of Commerce and Industry and the Hellenic Ministry of
Rural Development and Food, is expected to deliver valuable information about the
dairy sector in Greece.
7. Implications for agrotourism
Agrotourism with regards to the dairy sector has not developed sufficiently
despite the considerable efforts made so far from both by the tourism entrepreneurs
and the relevant public authorities. However, agrotourism is considered a sector with
a high growth potential and can be an alternative approach in the development of
entrepreneurship in rural areas combined with sustainable development. The more
systematic and better organized supply of local and traditional dairy products to
touristic units, such as hotels, restaurants and retail stores, is needed. Both existing
dairy units as well newcomers have to take the option of agrotourism more seriously
and adapt their business accordingly.
8. Implications for e-commerce
In Greece, e-commerce, as a whole, is emerging in recent years as a growing
trend mainly among consumers and in lesser degree among Greek entrepreneurs. This
is also valid for the food sector. As in the case of agrotourism, dairy units, no matter
big or small, should seriously consider e-commerce as a tool for better promoting
their products and developing their business.
9. Analysis of imports and opportunities for Greek-produced substitutes

79
Relatively large amounts of cow milk are imported in Greece, mainly either as
high-temperature pasteurized milk or condensed milk. Regarding cheese, imports of
semi-hard and hard cheeses are steadily increasing in recent years. It is true that, in
contrast to sheep and goat milk, Greece is deficient in cow milk production, and this
is mainly used either as drinking milk or yogurt. In this sense, production of cow milk
should increase so as to allow cow milk processing to products that are currently
imported. However, it should be seriously discussed and debated whether
investments towards this option should be a priority at national economic and social
level compared to investments in the field of sheep and goat milk and the traditional
products thereof.
10. Prerequisites to entrepreneurial success (critical success factors)
Stable legislation and economic environment
Faster and efficient state administrative procedures
Implementation of quality and safety assurance systems in milk processing
Constant up-dating in processing techniques following the progress of dairy
science and technology
Connection of the PDO and traditional products with their origin in terms of
qualitative characteristics as the basic pillar of marketing strategy
Participation of dairy SMEs in dairy intra- and inter-Professional
Organizations for coordination in matters of product marketing and promotion
Continuous up-dating on new trends on consumers' preferences
Participation in national and international food exhibitions, so as to both
acquaint foreign markets their products and explore possible export potentials
Promotion of products at a local level with a view to connect with the
agrotourism sector
11. Recommendations for consideration in the implementation phase
According to our opinion there is practically one major recommendation
regarding the implementation phase, which regards the establishment, in collaboration
with the Agricultural University of Athens, of infrastructures and curricula for
educating newcomers in the dairy sector. This effort will be only successful if it is not
again a sporadic one but part of an integrated and well-coordinated effort at national
level. That means, operational synergies with similar initiatives as well as continuous
follow-up, supervision and constant evaluation are needed.

80
References
1. Anyfantakis M. (2004) Cheese making. Athens, Stamouli Editions
2. Bodini A., Raffaele Z. (2009) Competitive factors of the agro-food e-commerce.
113rd EAAE Seminar “A resilient European food industry and food chain in a
challenging world”, Chania, Crete, Greece
3. ELOGAK (2015) Personal Communication
4. ELSTAT (2014) Survey on information technologies and communication by
households 2014
5. European Commission Report (2014) Prospects for EU agricultural markets
and income 2014-2024
6. European Commission, Milk Market Observatory (2015) Latest update
11.11.2015
7. European Commission, Eurostat (ComExt) (2015) Latest update 10.11.2015
8. European Commission Conference (2013) The EU dairy sector developing
beyond 2015. Brussels, Belgium 9. Goussios D., Tsiboukas K., Anthopoulou T., Vasileiadis A., Gaki D. (2014)
Developing the typical dairy products in Thessaly. Diagnosis and local strateg.
Lactimed Promoting Mediterranean Dairy Products, European Union, ENPI
CBCMED Cross-border Cooperation in the Mediterrannean
10. ICAP Sector Study (2013) Cheeses
11. ICAP Sector Study (2014) Dairy Products
12. IFCN Supporter Conference (2015) 13th Dairy Conference in Minneapolis, US
13. Kazantzidou S. (2014) Diploma Thesis “Agrotourism and its development at
European, National and Greek level. Case study: The area of Zagorochoria in
Ioannina” Department of Engineering, Country Planning and Development,
Aristotle University of Thessaloniki, Thessaloniki, Greece
14. Nielsen (2014) e-Commerce: Evolution or Revolution in the Fast-moving
Consumer
15. Nielsen (2015) The Future Of Grocery (e-Commerce, Digital Technology And
Changing Shopping Preferences Around The World)
16. Psarrakis M. (2015) Master thesis “Study on the sustainability of small dairy
units” Department of Food Science and Human Nutrition & Department of
Animal Sciences and Aquaculture, Agricultural University of Athens, Athens,
Greece
17. Thomaidou F. (2014) Food and Beverage Industry: Facts and Figures.
Foundation for Economic and Industrial Research (IOBE)
18. Tsapaki C. (2011) Diploma Thesis “Agrotourism in Greece and in Europe”
Department of Organization and Business Administration, Piraeus University,
Piraeus, Greece
Websites
www.ogeeka-dimitra.org.gr/eisagogi/tee_ioanninon (last time visited on 15/11/2015)
www.efet.gr (last time visited on 23/11/2015)
www.agrocert.gr (last time visited on 24/11/2015)
www.ec.europa.eu/eurostat (last time visited on 25/11/2015)
https://mahitotekmirio.wordpress.com (last time visited on 28/11/2015)
www.aftodioikisi.gr (last time visited on 28/11/2015)
www.agronews.gr (last time visited on 28/11/2015)
www.chania-info.gr (last time visited on 28/11/2015)
www.greekbreakfast.gr (last time visited on 28/11/2015)
www.in.gr (last time visited on 28/11/2015)

81
www.statistics.gr (last time visited on 28/11/2015)
www.minagric.gr (last time visited on 29/11/2015)
http://afs.edu.gr/ (last time visited on 25/11/2015)
http://diaviou.auth.gr/dairy_products (last time visited on 25/11/2015)
http://www.ige.gr/ (last time visited on 25/11/2015)
http://www.tositsa-foundation.gr/ (last time visited on 20/11/2015)

82
ANNEX I
Business Plan I for a Medium Scale Dairy Unit
«Further Development of an Existing Medium Scale Dairy Unit»
EXEVUTIVE SUMMARY
(Detailed data are presented in the respective PPT file)
1. Introduction
The present Business Plan (BP) is part of the study entitled «The Dairy Sector
in Greece: Constraints and Opportunities for Existing Producers and Newcomers»
performed by the Laboratory of Dairy Research at the Agricultural University of
Athens. The BP focuses on guidelines for existing small dairy units for further
development either independently or by creating local cooperatives. We have chosen
as location example the Prefecture of Arcadia in Peloponnese, so as to be applied
with few modifications in similar areas in Greece. The BP includes the steps and
procedures needed in order to operate a viable and profitable dairy company. In order
to evaluate the size and the conditions of setting up the company, we used existing
data as these are described in our main study and also data deriving from the
questionnaires conducted in our study addressing both existing dairy units and
consumers. The company is able to exploit 1.560 tons of milk annually, with a total
production of 448,8 tons of dairy products, in facilities of 250 m2 located in a 2000 m2
site and with 15 employees. The funds required for the establishment of the company
amount 531.100 euro and will be covered from own funds and short-term loans.
2. Aim of BP & Company’s general purpose
In our main study, it was shwon that the potential of sheep and goat milk in
Greece is high and thus it is anticipated that the further processing of sheep and goat
milk into both traditional and new or innovative products can result in major benefits
for the Greek economy. This is evidenced mainly by the export potential of the PDO
Feta cheese and also yogurt, and in lesser degree of the rest Greek PDO cheeses. One
major goal of the company is to focus on cheese prepared from goat milk. Its should
be stressed that Greece is the first country in the world in the per capita production of
goat milk, however, no distinct or specialty goat milk cheese of high added value is
produced. In particular, in Arcadia the quantity of the annually incoming goat milk
amounted 5.387 tons in 2014, with 131.487 tons being the total quantity at national
level. Moreover, the exploitation of the goat milk produced in the above area, the
qualitative diversification of products with emphasis on the Mediterranean and
healthy lifestyle, enhanncent of consumers’ perception regarding goat milk products,
as well as environmental considerations regarding production, are additional key
goals.
3. Description of company

83
The company will produce annually 448,8 tons of dairy products by processing
1.560 tons of milk. The distinctive name of the company is «Dairy Arcadia SA» and
the legal form of S.A., i.e. joint-stock company. According to the Greek STAKOD
(Statistical Classification of Economic Activities), the industry activity code is 155.1
Dairy. The dairy unit is located in a 2.000 m2 site in the Municipality of Mantinia,
Prefecture of Arcadia, and thus in the center of Peloponnese. The personnel to be
hired is presented in Table 1.
Table 1. Personnel
Working Position Staff Qualifications Experience (years)
General manager 1 Economic Studies > 8
Product manager 1 Food Technologist > 5
Marketing 1 Marketing Studies > 5
Accountant 1 Accounting studies > 2
Cheese-makers 4 Technological education > 3
Drivers 3 Licensed for cars > 3.5 tons > 3
Sales, commercial manager 3 University or Technological education > 4
Cleaning staff 1 No experience needed
Total 15
4. Location, Infrastructure and Products
We have considered the following factors as the most important regarding the
georgaphical location of the company (a) the total milk production in the specific
region, focusing on sheep and goat milk, (b) the milk availability in the nearby areas,
(c) the number of other dairy units operating in the area and (d) the production
capacity of the particular region’s dairy units, opposed to the corresponding of the rest
regions. The region of Arcadia meets all the above criteria, as it is situated in the
center of Peloponnese and also produces the biggest quantity of sheep milk compared
to the rest regions of Peloponnese, which together with goat milk will be the main raw
material for the unit. Moreover, its location facilitates milk collection and product
delivery at reduced transportation costs. Arcadia is also between two main urban
centers, i.e. Athens and Patras, which are important and big markets for the food
sector. Finally, it is close to the region of Messinia, which is a well-known touristic
destination.
In order for the company to be competitive in the dairy market, the incoming milk
should be fully utilized by the unit. This will be achieved by careful selection of the
products, supply of the raw material from farmers under contract, financial incentives
to the farmers for the procurement of raw material throughout the year, e.g. by

84
applying alternately estrus to the herd, and, finally, better production time
management throughout the year.
The products of the unit are shown on Table 2. PDO Feta will represent the
largest share of the produced cheese volume, approximately 66% of the total cheese
production and 33.94% of the total production. Chevre type soft goat cheese is
anticipated to reach high prices. This, combined with the lower production costs, as
goat milk is almost 40% cheaper than sheep milk, is expected to enhance the profits of
the company. Graviera cheese and also yogurt, both made from cow milk, have been
chosen for extending the operation time of the unit throughout the year, since sheep
and goat milk are seasonable. All products will be available in suitable packaging in
retail stores, tourism sector stores, caterers and delicatessen stores.
Table 2. Product description
Product Cow
milk
Sheep
milk
Goat
milk
Description
(FDC)*
PDO %
of products
PDO Feta Yes Yes Art.83 Yes 33,94
Graviera Yes Art.83 No 8,43
Graviera Yes Art.83 No 4,08
Chevre type Soft Yes Art.83 No 3,79
Chevre type Ripened Yes Art.83 No 1,26
Yogurt Yes Art.82 No 16,86
Yogurt Yes Art.82 No 16,86
Deserts Pudding Yes Art.84 No 14,76
* FDC: Food and Drinks Code
The production steps per product type are described in Figure 1. Total quality
control system will be implemented throughout the production chain. The company
has the appropriate technological equipment that allows diversification when needed.
The range of products enables operation 12 months a year, total of 312 days, since
when no goat and sheep milk are available, the production focuses on products from
cow milk, thus expanding business profitability.

85
Milk collection
1560 tones;
Sheep Milk 52,56%
Goat milk 23,72%
PDO Feta
70% sheep milk
30% goat milk
Graviera
100% sheep milk
Chevretype fresh
100% goat milk
Ripened Chevre
type
100% goat milk
Yogurt traditional 100% sheep milk
Cow milk
23,72%
Graviera
100% cow milk
Yogurt
100% cow milk
Desert
100% cow milk
Figure 1. General Operational Plan of the Dairy Unit

86
5. Marketing Plan
SWOT analysis
Table 3. SWOT Analysis
Internal Environment (company)
Strengths (S) Weaknesses (W)
Flexible production process
Careful selection of the product mix
Longer lifespan for cheese products as well as
fewer (and less) returns
Organoleptic characteristics
Under contracts supply of milk
Seasonality of milk production
High costs of initial installation
Returns management costs
External Environment (market)
Opportunities (O) Threats (T)
State funding for SMEs subsidize extensions
projects
Growing confidence in Greek traditional
products
Growing trend Mediterranean diet and health
food
The PDO indication offers added value
products (Goodwill)
Great bargaining power of buyers
Low purchasing power of consumers due to the
economic situation of the country
Significant competition in dairy products
Difficulties in obtaining funds from banks
PORTER Analysis
Threat of New Entry: Entering a new business in the dairy industry is not
considered to face difficulties with the condition that it is able to obtain the requisite
quantity of milk. The required capital to the supply of the raw material is considered a
critical factor for the investment.
Threat of Substitutes: Milk and dairy products are not threatened by other
substitutes because they are an integral part of the daily diet. Special foods, such as
low-lactose dairy products, are not of concern for the general public due to the low
frequency of lactose intolerance (Bulhões, 2007).
Bargain Power of Suppliers: The bargaining power of domestic farmers is
particularly small with regards to the milk price. The goat milk bargaining power of
suppliers is usually less than for sheep milk because goat milk is processed into goat
products, but to a lesser extent is mixed with sheep milk to give added value products,
such as PDO Feta. Fresh cow milk, after the recent EU quota system abolition, is
expected to bring significant price fall and further weaken the negotiation power of

87
cow farmers. Sheep milk price in 2014, formed in the weighted average, was 0,90
euro/kg, which is 40% higher than this of goat milk.
Bargain Power of Buyers: The supermarket chains procure large quantities and
contribute, also, to the recognition of a product, thus constituting very important
markets for every business. Bargaining power of supermarkets is very high as it is
primarily determined by the ability they have to distribute almost the highest
percentage of food handling from their chains.
Rivalry Among Existing Competitors: The dairy market as a whole is a highly
competitive market. The larger companies’ bargaining power is considered high
especially regarding distribution channels and collection of the raw material. On the
contrary, for the SMEs, which operate with small portions, i.e. 1% -2% of the total
cheese production, and are spread throughout the country have lower bargaining
power.
Strategy
The company will be active in a growing market and try to gain benefit
advantage over competitors through high quality and innovative products as well as
locality. The levels of strategy include:
1. Corporate level: wide penetration target, with market share growth through
attracting of customers
2. Business Units Strategy: by achieving competitive advantage through product
differentiation
3. Operation detailed strategy through the marketing and sales
Growth strategy for PDO Feta, Graviera, Yogurt, Desserts
Diversification strategy for fresh and ripened Chevre type goat cheese
Differentiation (Level Operations) internet marketing, Search Engine
Optimization (SEO) and e-Commerce
Marketing mix
The operation detailed strategy will be implemented by the 4P marketing tools,
i.e. Product, Place, Price and Promotion.
Product: Emphasis will be given to creating quality products through know-
how in dairy technology by recruiting a skilled and qualified food scientist for the
position of the Production Manager as well as experienced cheese makers.
Brand name: The brand name «Dairy Arcadia SA» differentiates the
company’s products from competition and strengthens locality.
Packaging: Packaging should offer protection towards damage, recognition and
differentiation, being at the same time user friendly and appealing to consumers. The
products’ packaging will be as follows: (a) PDO Feta in metal containers of 8 Kg and
plastic tuppers of 400g, (b) Graviera in plastic vacuum pouch of 10Kg, (c) Fresh goat
cheese in plastic vacuum pouch of 250g and (d) yogurt and deserts in plastic cups of
240g.

88
Place: The distribution of the products will be mainly B2B but there will be
also the possibility for consumers to buy directly from a dedicated shopping area in
the factory’s site (B2C) or through the company’s website.
Price: The selection of the company's products billing method will be a
different pricing strategy depending on the type and the competition, i.e. (1) low price
strategy for Graviera from cow milk and yogurt from cow milk, (2) competitive price
strategy for PDO Feta, Graviera from sheep milk, yogurt from sheep milk and deserts
from cow milk, (3) high price strategy for Chevre type soft from goat milk and
Chevre ripened from goat milk. The selling prices of products in wholesale are
presented in Table 4.
Promotion: Advertising on TV and radio stations in the Peloponnese region
along with internet advertising are the main channels for promotion. TV and radio are
still important sources of information and they address a mass audience, especially in
the countryside. The promotion via internet will be implemented in three ways,
namely content marketing, paid marketing and social media marketing.
Table 4. Selling prices in wholesale
Product Price (euro / Kg) Product Price (euro / Kg)
PDO Feta 5,5 Chevre type ripened 12,0
Graviera (sheep milk) 8,0 Yogurt traditional (sheep milk) 3,0
Graviera (cow milk) 7,0 Yogurt (cow milk) 2,0
Chevre type fresh 11,0 Desert (cow milk) 3,2
6. Start-up procedure and Project Timeline
The establishment of a dairy unit may last several months due to complex legal
requirements. The whole procedure can be done exclusively at local Citizens Service
Centers (KEP) and should include submission of a complete file containing the
following:
Establishment application /operation licensing
Topographical chart of the plot (in scale 1:500)
Ground plan of the installations including with detailed description of the
spaces
Enumeration table and description of the technical equipment, devices and
instruments with an outline of their location in the space
Technical description report of the unit's function
Flow chart for the production of each product, the daily capacity, the raw
materials, the final products as well as a report of PDO products (if produced)
Preliminary approval for the establishment and approval for environmental
provisions
Waste management report
For the start-up of the enterprise, 12 months are required and it will totally take 18
months until its full operation, as it can be seen in Table 5.

89

90
Table 5. Business Plan Implementation Timetable
M1* M2 M3 M 4 M5 M6 M7 M8 M9 M10 M11 M12 M13 M14 M15
Establishment
of the Legal
Scheme
Rooms &
infrastructure
development
Equipment
establishment
H/R
recruitment
Collaboration
with suppliers
Selling
products
network
organization
Website
creation
Certification
"Hellenic"
Enterprise
ISO 22000
certification
* M: month
7. Financial analysis and Business Assessment
Business start-up costs
Due to the current conditions in Greece, the company was designed so as not to
use bank loans regarding to the initial installation. The start-up’s costs of 531.100
euro will be fully covered by share capital. This amount is invested one year before
the company’s operation. The capital required for the annual running of the business
amounts 1.200.000 euro, which mainly goes for the milk supply. For the first two
years, this capital will be supplemented with a sort term bank loan, less than 100.000
euro per year and with an interest rate of 8.25%, which, under the current conditions,
it is possible to be disbursed (basic scenario).
In an alternative scenario, with the unit‘s establishment relying either on a private
investor or on producers’ collective effort, the state subsidy option should be
considered. The funding, under the national rural development program, can reach
65% of the installation costs. A realistic final funding is estimated at 37.28%, i.e.
198.000 euro. Significant improvement in the cash flow observed from the first year
is a positive sign which enables the company to virtually eliminate its bank loans.

91
Evaluation of the investment
After the 1st year, the smooth establishment of the company's baseline scenario
consistently yields large profits and at the end of the 2nd year the company distributes
dividends of 20% to the shareholders (Figure 2).
-100.000 €
- €
100.000 €
200.000 €
300.000 €
400.000 €
500.000 €
1st Year 2nd Year 3rd Year 4th Year 5th Year
EBT
EAT
Dividents paid
Figure 2. Earnings After Taxes (EAT), Earnings Before Taxes (EBT), Dividends paid annually
(basic scenario)
Sales are calculated with a growth rate of 8% and 6% for the 2nd and 3rd year,
respectively (Figure 3), while the percentage of returned products considered as Fast Moving
Consumer Products (FMCG; e.g. yogurt, desserts) is 9%.
- €
500.000 €
1.000.000 €
1.500.000 €
2.000.000 €
2.500.000 €
1st Year 2nd Year 3rd Year 4th Year 5th Year
Sales
CGS
Gross Margin
Figure 3. Sales, Cost of Goods Sold and Gross Margin (basic scenario)

92
Data on profitability Return on Total Assets (ROTA) and Earnings After Taxes (EAT)
are shown in Figure 4. We observe that the return of capital is consistently high throughout
the five years yielding high profits to shareholders.
-1,48%
20,81%20,11%
23,68%
20,32%
0,00%
16,11%15,41%
18,06%
15,44%
-5,00%
0,00%
5,00%
10,00%
15,00%
20,00%
25,00%
1st Year 2nd Year 3rd Year 4th Year 5th Year
ROTA (EBIT/ΤΑ)
EAT (EAT/Eqty)
Figure 4. Return on Total Assets (ROTA), Earnings After Taxes (EAT) (basic scenario)
Τhe net present value at decade level is 1.500.598 euro with a 8.25% discount rate and
the repayment period is less than 6 years, namely 5,18 years (Table 6), while the detailed
Balance Sheet is depicted in Table 7.
Table 6. Indicators of investment evaluation (basic scenario)
Indicators of investment evaluation
NPV* 511.100 €
NPV 10 years 445.320 €
NPV 20 years 1.500.598 €
IRR** 5 -7,30%
IRR 10 14,71%
IRR 20 20,01%
Payback period (years) 5,18
*NVP: Net Present Value; **IRR: Internal Rate of Return

93
Table 7. Five year Balance Sheet (in euro) (basic scenario)
Year 0 1st Year 2nd Year 3rd Year 4th Year 5th Year
Assets 531.100
€
1.317.649
€
1.455.751
€
1.640.496
€
1.908.503
€
2.169.941
€
Net Fixed Assets
(FA)
511.100
€ 485.960 € 460.820 € 435.680 € 410.540 € 385.400 €
Inventories (INV) 193.688 € 195.291 € 196.759 € 198.255 € 199.766 €
Receivables (AR) 638.001 € 799.640 € 817.024 € 869.174 € 869.174 €
Cash 20.000 € 0 € 0 € 191.033 € 430.533 € 715.600 €
Liabilities and
Equity
531.100
€
1.317.649
€
1.455.751
€
1.640.496
€
1.908.503
€
2.169.941
€
Capital (Cap) 531.100
€
1.210.000
€
1.210.000
€
1.210.000
€
1.210.000
€
1.210.000
€
Inventories (INV) 0 € 178.988 € 374.279 € 641.858 € 902.865 €
Loans (L) 52.310 € 10.966 € 0 € 0 € 0 €
Payables (AP) 55.339 € 55.797 € 56.217 € 56.644 € 57.076 €
WORKING
CAPITAL 20.000 € 724.040 € 928.168 €
1.148.599
€
1.441.318
€
1.727.465
€
8. Conclusions
This BP aims to be a profitability model for the above dairy unit in the dairy
sector. The unit’s design effort was based on the utilization of sheep and goat milk so
as to manufacture high quality products. The large untapped potential of the Greek
dairy production in the countryside should be highlighted and used in order to restart
the Greek economy as well as to create new jobs. Due to the financial crisis that
Greece is going through and as the company does not use bank loans, it might, at first,
seem difficult to gather the necessary funds. However, this could be achieved through
collective efforts of the local communities and the producers. The economic
performance of the operation is due to the manufacturing of well-known products,
such as PDO Feta and Graviera, fast moving products, i.e yogurt, as well as new
products, e.g. Chevre type goat cheese. The company in order to sustain the
profitability should try to develop products that have high earnings by using cheaper
raw materials, such as goat milk, and replacing, in time, some products having smaller
profit margins. The company operating this way will manage to achieve the objectives
initially set.

94
ANNEX II
Business Plan II for a Small Scale Dairy Enterprise
«Guidelines to Newcomers for Setting- up a New Business in the Dairy Sector»
EXEVUTIVE SUMMARY
(Detailed data are presented in the respective PPT file)
1. Introduction
The present Business Plan (BP) is a part of the study entitled «The Dairy Sector
in Greece: Constraints and Opportunities for Existing Producers and Newcomers»
performed by the Laboratory of Dairy Research at the Agricultural University of
Athens. The BP focuses on guidelines to newcomers for setting-up new businesses in
the dairy sector, using as an example the Island of Limnos in the North Aegean Sea,
so as to be applied in similar areas in Greece properly revised if needed. All
procedures, which are essential for the installation and operation of a small dairy unit
in Limnos, capable to exploit 500 l of milk per day, are described step by step. The
unit has 5 employees, facilities of 200 m2 and is installed in a 400 m2 site. The
investment costs amount 164.000 euro and the cash flows 115.290 euro/year. For the
needs of the BP, data and information from the above mentioned study as well as the
results from 3 questionnaires conducted forwards the aim of this study have been
used.
2. Aim of BP & Company’s general purpose
One of the main goals of the dairy unit is to exploit the local raw milk in order
to reveal and promote the value of the local traditional products. By using the sheep
and cow milk produced in this area, the company will help enhancing the Greek
primary sector at local level. A further significant goal is to produce high quality
biological and traditional products, so as to promote the Mediterranean diet and the
healthy way of life. Finally, the protection of the environment is also a priority by
installing waste management procedures.
Towards the aim of the current BP, three main goals are anticipated to be
achieved, namely:
To encourage newcomers’ willingness in starting-up business in the
dairy sector
To enhance the promotion of Greek traditional products
To boost the efforts against unemployment of youngsters in Greece
3. Description of company
Α small and flexible structure is suggested, in order to fulfill all company’s
needs. Information regarding size, educational level and expertise of the personnel is
shown in Table 1. Due to its small size, the company cannot afford an accountant or a

95
legal adviser as permanent personnel, and thus these services will be outsourced,
under the supervision of the Director General. The enterprise's legal form is general
partnership (OE) and falls into sector 155.1 according to the Greek Statistical
Classification of Economic Activities (STAKOD).

96
Table 2. Personnel requirements
Working Position Staff Qualifications Experience (years)
Product manager 1 Food Technologist > 5
Cheese-makers 2 Technological education > 3
Drivers 1 Licensed for >3.5 ton < 3
Cleaning staff 1 - -
Total 5
4. Products and infrastructure
The unit will use both cow and sheep milk produced in the Island of Limnos. It
should be noticed that the milk produced in Limnos can cover all needs. In particular,
the company will need, daily, 500 liters of milk, quantity that can be supplied by 2
cattle breeders (10 cows each ) and 2 sheep breeders (100 sheep each). The products
of the company are shown in Table 2.
Table 2. Description of products
Product Cow milk Sheep milk Description (FDC) * PDO **
Sheep yogurt YES Art. 82 NO
Cow yogurt YES Art. 82 NO
Kefalotyri YES Art. 82 NO
Myzithra-Anthoriro YES Art. 82 NO
Cream YES Art. 82 NO
Rice pudding YES Art. 82 NO
* FDC: Food and Drink Code; ** PDO: Product with Designation of Origin
The company has 3 production lines: (a) yoghurt, (b) cheese and (c) cream and
rice pudding. The required equipment costs amount 85.000 euro. The covered
facility’s area totals 200 m2 and includes the manufacturing zone, cold rooms,
ripening rooms and other minor spaces. The construction is of industrial type and the
required means of transport (3 vehicles) are proprietary. The key of the company's
success is that all products are distributed as packaged products. This way, the
company increases the variety of products, so as to meet the customers’ demands.
Depending on the demand, the company can slightly modify each product, e.g.
different kind and weight of package, different tastes in creams etc. The modification
can be achieved with the existing equipment without any significant increase in the
production costs. The ISO 22000 is deemed to be very important for the company not
only for product safety and hygiene but also because it makes the products more
attractive, as this was emerged from the consumers’ questionnaires we have collected.

97
The selection of the specific products was based on the following criteria:
Cream and rice pudding
o They have big profit margin, as it can be seen in the Annex (PPT file).
o They require low cost equipment (1.400 euro) and with some minor
adjustments several similar products, e.g. cream with different flavors,
light products, cream with jelly etc., can be also manufactured
o They are considered traditional products and part of the Greek diet
Kefalotyri
o The production of a hard cheese, such as Kefalotyri, allows the enterprise
to increase its products' variety, by including Myzithra and Anthotyro,
which are produced from the whey obtained during Kefalotyri production,
decreasing at the same time the production costs of Kefalotyri by 25%
o With the same equipment, a wide variety of hard and soft cheeses can be
produced, both PDO and non-PDO, depending on demand
Yogurt
o It is a traditional product highly popular not only in Greece but also abroad
o It requires low cost equipment (4.500 euro)
The option for a bigger variety of products, namely 9 codes, is based on the
fact that the unit is located on an island hosting a big number of tourists and other
visitors every year and can thus exploit the opportunity to deliver products to local
touristic units, e.g. hotels, restaurants, retailers, etc. This way, the unit establishes tight
links with the area's touristic activity and more specifically with the emerging and
economically promising sector of agrotourism. If needed, the unit has the ability to
produce differentiated products depending on the demand.
5. Marketing strategy & SWOT Analysis
The Marketing Mix is the policy and the strategy that the dairy unit must follow,
so as to achieve its general and specific goals. The marketing mix includes 4P
(Product-Price-Place-Promotion). The small dairy unit chooses to produce products
that are not appealing to the big-scale companies (Table 3). It focuses on products
differentiation, so as to offer products that attract different targeting groups, i.e. to
B2B (Business to Business) and B2C (Business to Consumer). The company is
targeting the Niche Market, so as to satisfy specific needs of consumers, e.g.
traditional yogurt. These market segments are not suitable for mass consumption and
for this reason they are not preferred by the big companies. Via this strategy the
company avoids the intense competition with the big and powerful companies and
covers needs of a market, which is “forgotten” by other producers. In order to achieve
a successful entrance in the market, the company must proceed to market’s
segmentation, targeting and positioning. Market segmentation is a key marketing
tool, which separates the potential customers in different categories. The following
segmentation is done by taking into consideration mainly the psychographic criteria
of the consumers and not necessarily other, such as financial criteria. The SWOT
analysis is presented in Table 4.

98
Advertising of the company and the products will be performed via a website,
including an electronic selling platform. Interestingly, according to the questionnaire
of the present study that was addressing existing dairy units in Greece, it was shown
that 73,9% of them have a website, none an electronic selling platform though.
Table 3. Product Targeting
Products B2C B2B
Lines (5)
Codes (10)
Eld
erly
To
uri
sts
Ch
ild
ren
Pre
fere
nce
on
Gre
ek
pro
du
cts
Pre
fere
-
nce
o
n
loca
l
pro
du
cts
P
astr
y
sho
ps
and
bak
erie
s
Ho
tels
–
rest
aura
nts
Traditional sheep
milk yogurt
200 g (plastic pot) + + + + + +
900 g (clay pot) + + + +
Cow milk yogurt 200 g (plastic container) + + + + + +
Cheeses Kefalotyri (5kg) + + + + + +
Anthotyro (1 kg) + + + + + +
Myzithra (1 kg) + + + + +
Cream Plain (200 g) (plastic pot) + + + + + + +
Flavored (200 g) (plastic
pot)
+ + + + + + +
Rice pudding Rice pudding (200 g)
(plastic pot)
+ +
Flavored (200 g) + + + + + +
Table 4. SWOT Analysis
Internal Environment (company)
Strengths (S) Weakness (W)
Production flexibility
o Possible to produce different products
o Possible to produce differentiated
products
Low investment capital
Small waste quantities
Farmers with low negotiation power
Non innovative products
Seasonality of sheep milk
Products with limited shelf life
External Environment (market)
Opportunities (O) Threats (T)

99
Positive image of traditional products in recent
years
Lack of competitors regarding very similar
products
Products are part of Mediterranean diet
Strong negotiation power of buyers
Similar traditional products are offered, also, by
major firms
Indirect competition by relevant products
Consumers’ purchasing power is reduced
constantly
6. Start-up Procedure and Project Timeline
The business start-up procedure of a milk processing unit in Greece is quite time
consuming due to complex legal requirements and procedures. However, in recent
year, the whole procedure can be exclusively done at local Citizens Service Centers
(KEP). The procedure begins with the preparation and submission of a folder that will
be examined and testified by the relevant authorities. This should include:
Application for establishment and operation licensing, which is issued by the
respective authority or KEP
Topographical chart of the plot in scale 1:500
Ground plan of the installation with detailed description of all spaces
Enumeration table and description of the technical equipment and instruments
with an outline of their location
Report of the technical description of the unit's function
o Production flow chart for each single product
o Daily capacity
o Raw material
o Final product
o Report of PDO products, if produced
Pre-approval of the unit's siting and environmental terms approval (Ministry
of Environment, Physical Planning and Public Works)
Report on waste management
For the start-up of the enterprise 12 months are required and it will totally take
18 months to achieve full operation (Figure 1).
7.
Figure 1. Start-up Timeline

100
7. Financial analysis and Business Assessment
Business start-up costs
For the establishment of the unit a 164.000 euro loan will be required. The pay-out will
be completed in the following 20 years with 6% interest rate. The interest amortization dose is
stable, namely 14.312 euro annually. The charge with the interest for 20 years is 122.240 euro
and the borrower will pay 286.240 euro totally. The possible financing means are through
equity capitals, through bank loan, which is particularly difficult under the current economic
crisis in Greece and requires collateral mortgage or savings, through individual investors, e.g.
Business angels or through Greek or EU funding programmes, e.g. the ESPA Programme.
According to the outcome of the newcomers’ oriented questionnaire performed in the context
of our study, the majority of the prospective newcomers in the dairy sector expressed their
interest in starting up a business with the support by this type of programmes.
Cash flows (in euro)
Income: 310.594
Expenses: 195.304
Cash flows: 115.290
From our questionnaire addressing existing dairy units, it was noticed that the small
dairy units have relatively low negotiation power against medium- or big-scale ones. In
particular, the majority of them pay immediately or within 3 months their suppliers, while
they are paid by their clients within 3-6 months. From the latter, it was presumed that, apart
from the initial investment, the entrepreneur will require to have in the company's circulatory
capital an analog of at least 6 months, approximately 100.000 euro, in case the unit does not
have easy access to bank loan.
Evaluation of the investment
1st (basic) hypothesis (100% sales from the very first year)
If the repayment of the initial invested capital is accomplished during the 3rd year of
operation, the enterprise is evaluated positively and thus from the 3rd year are given dividends
(Figure 2).

101
Figure 2. Investment capital repayment time
Table 5. NPV & IRR ratios (1st basic hypothesis)
* NPV: Net Present Value; ** IRR: Internal Rate of Return (%)
2nd (alternative) hypothesis (reduced sales for the first years)
In the case that the sales are 40% for the 1st year, 60% for the 2nd and 100% for
the 3rd, the enterprise will be depreciating the invested capital during the initial 4
years and the NPV and IRR indicators are positively evaluated.
Figure 3. Income, expenses and cash flows for the 2nd hypothesis
Table 6. NPV & IRR ratios (2st hypothesis)
* NPV: Net Present Value; ** IRR: Internal Rate of Return (%)
5 years 8 years 15 years
NPV* 131778 492290 807935
IRR** 49 69.25 70.2
5 years 8 years 15 years
NPV* 28521 389000 704600
IRR** 16.4 47.4 49.8
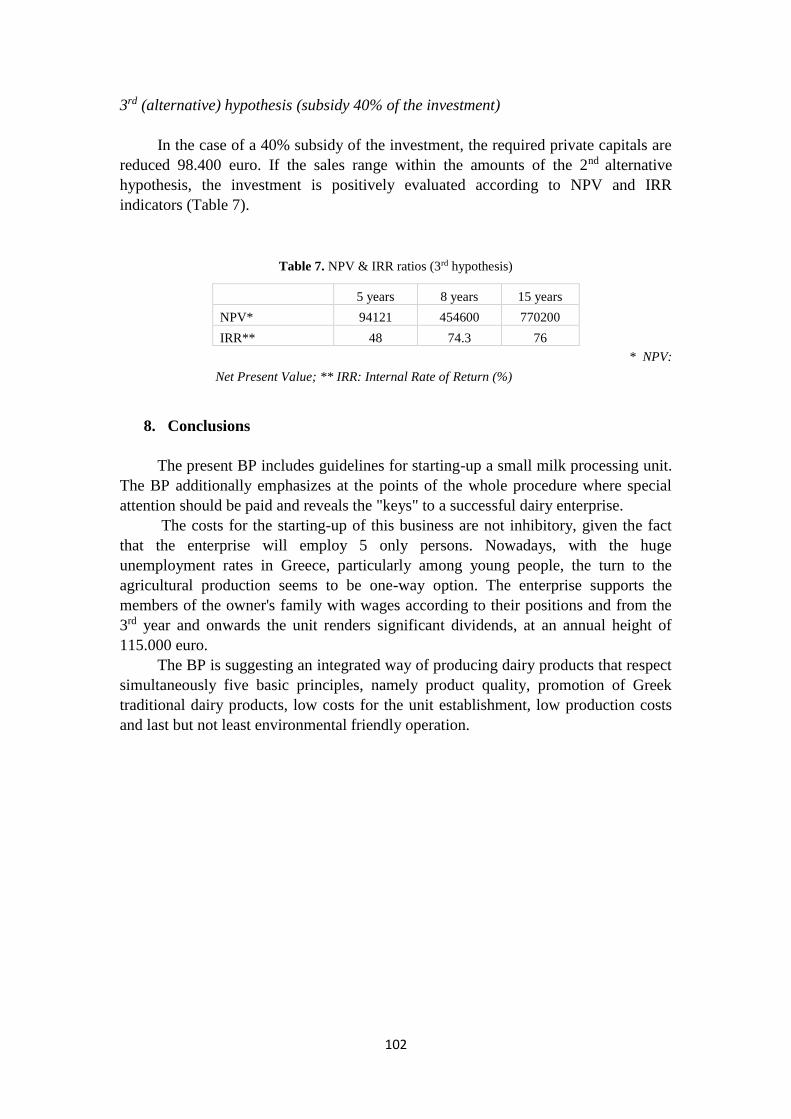
102
3rd (alternative) hypothesis (subsidy 40% of the investment)
In the case of a 40% subsidy of the investment, the required private capitals are
reduced 98.400 euro. If the sales range within the amounts of the 2nd alternative
hypothesis, the investment is positively evaluated according to NPV and IRR
indicators (Table 7).
Table 7. NPV & IRR ratios (3rd hypothesis)
* NPV:
Net Present Value; ** IRR: Internal Rate of Return (%)
8. Conclusions
The present BP includes guidelines for starting-up a small milk processing unit.
The BP additionally emphasizes at the points of the whole procedure where special
attention should be paid and reveals the "keys" to a successful dairy enterprise.
The costs for the starting-up of this business are not inhibitory, given the fact
that the enterprise will employ 5 only persons. Nowadays, with the huge
unemployment rates in Greece, particularly among young people, the turn to the
agricultural production seems to be one-way option. The enterprise supports the
members of the owner's family with wages according to their positions and from the
3rd year and onwards the unit renders significant dividends, at an annual height of
115.000 euro.
The BP is suggesting an integrated way of producing dairy products that respect
simultaneously five basic principles, namely product quality, promotion of Greek
traditional dairy products, low costs for the unit establishment, low production costs
and last but not least environmental friendly operation.
5 years 8 years 15 years
NPV* 94121 454600 770200
IRR** 48 74.3 76

103