SHRM Poll: The Ongoing Impact of the Recession—Health Industry August 28, 2012.
Upload
shrmCategory
view
1.090download
1
SHRM Poll: The Ongoing Impact of the Recession—State and Local Government
June 4, 2012

SHRM Poll: The Ongoing Impact of the Recession—State and Local Government ©SHRM 2012 2
The Ongoing Impact of the Recession:State and Local Government
Introduction
Key Findings
Organizations’ Financial Health
Hiring
Recruiting Challenges
Demographics
Methodology
SHRM Poll: The Ongoing Impact of the Recession—State and Local Government ©SHRM 2012 3
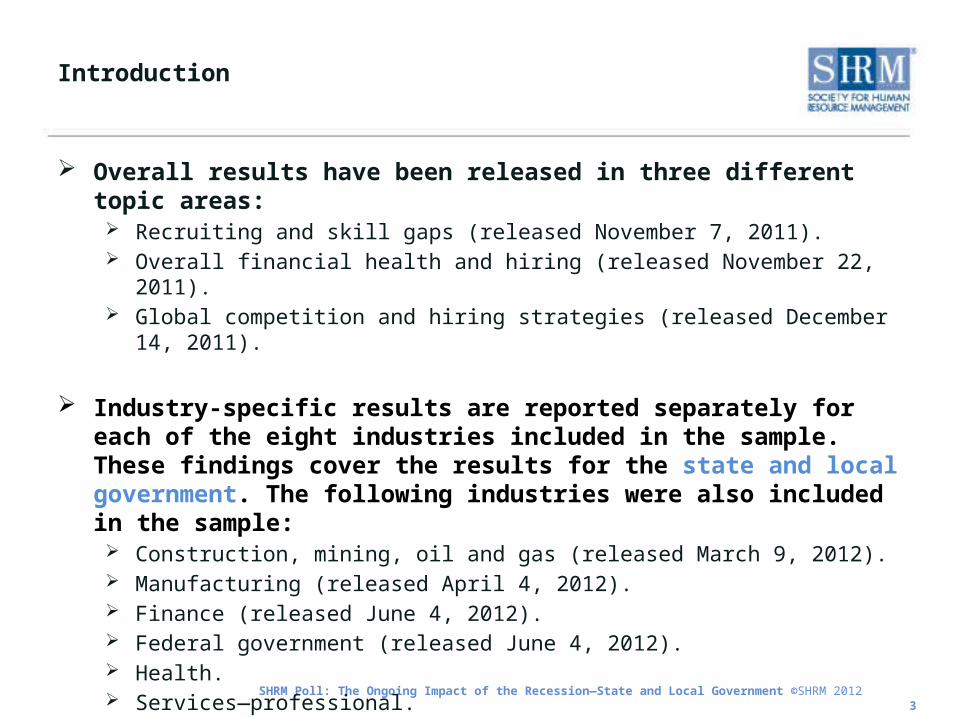
Introduction
Overall results have been released in three different topic areas: Recruiting and skill gaps (released November 7, 2011). Overall financial health and hiring (released November 22, 2011). Global competition and hiring strategies (released December 14, 2011).
Industry-specific results are reported separately for each of the eight industries included in the sample. These findings cover the results for the state and local government. The following industries were also included in the sample: Construction, mining, oil and gas (released March 9, 2012). Manufacturing (released April 4, 2012). Finance (released June 4, 2012). Federal government (released June 4, 2012). Health. Services—professional. High-tech.
SHRM Poll: The Ongoing Impact of the Recession—State and Local Government ©SHRM 2012 4
Key Findings: Organizations’ Financial HealthState and Local Government
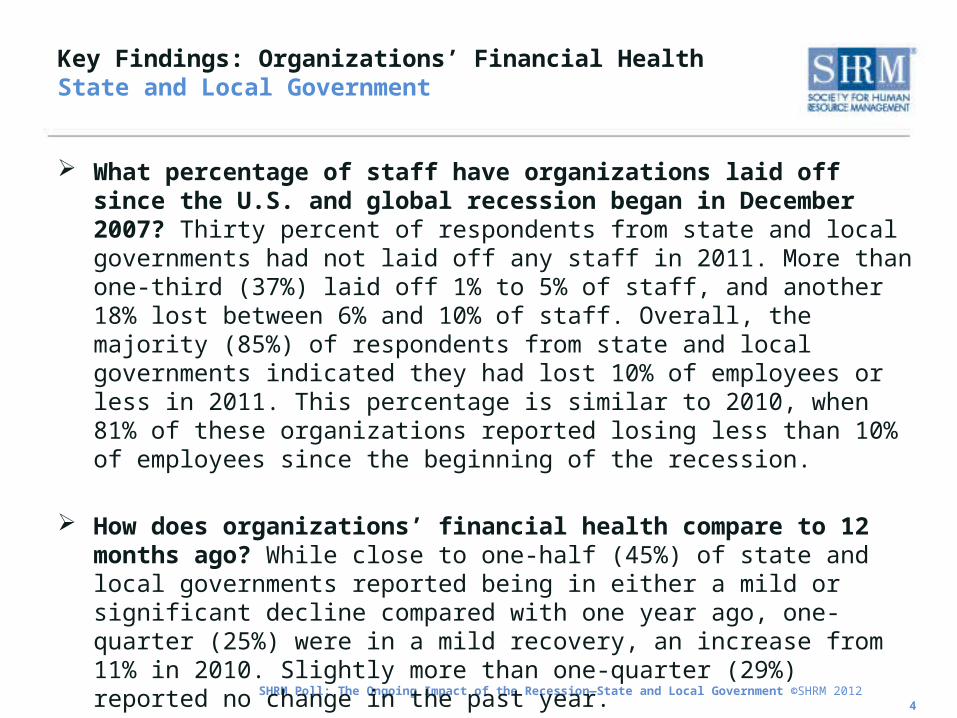
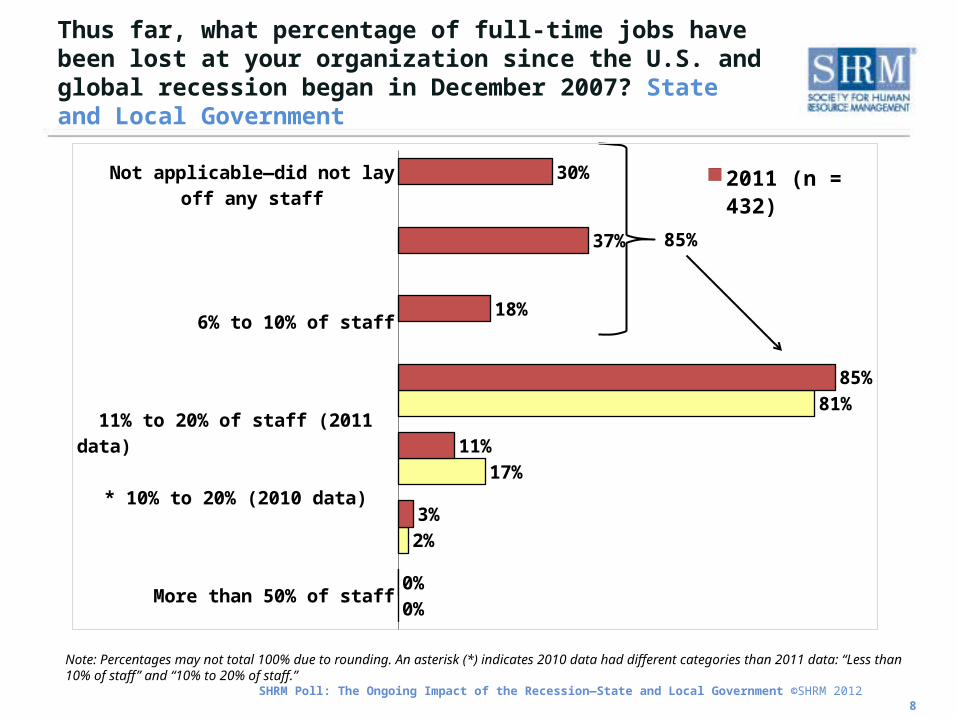
What percentage of staff have organizations laid off since the U.S. and global recession began in December 2007? Thirty percent of respondents from state and local governments had not laid off any staff in 2011. More than one-third (37%) laid off 1% to 5% of staff, and another 18% lost between 6% and 10% of staff. Overall, the majority (85%) of respondents from state and local governments indicated they had lost 10% of employees or less in 2011. This percentage is similar to 2010, when 81% of these organizations reported losing less than 10% of employees since the beginning of the recession.
How does organizations’ financial health compare to 12 months ago? While close to one-half (45%) of state and local governments reported being in either a mild or significant decline compared with one year ago, one-quarter (25%) were in a mild recovery, an increase from 11% in 2010. Slightly more than one-quarter (29%) reported no change in the past year.

SHRM Poll: The Ongoing Impact of the Recession—State and Local Government ©SHRM 2012 5
Key Findings: HiringState and Local Government
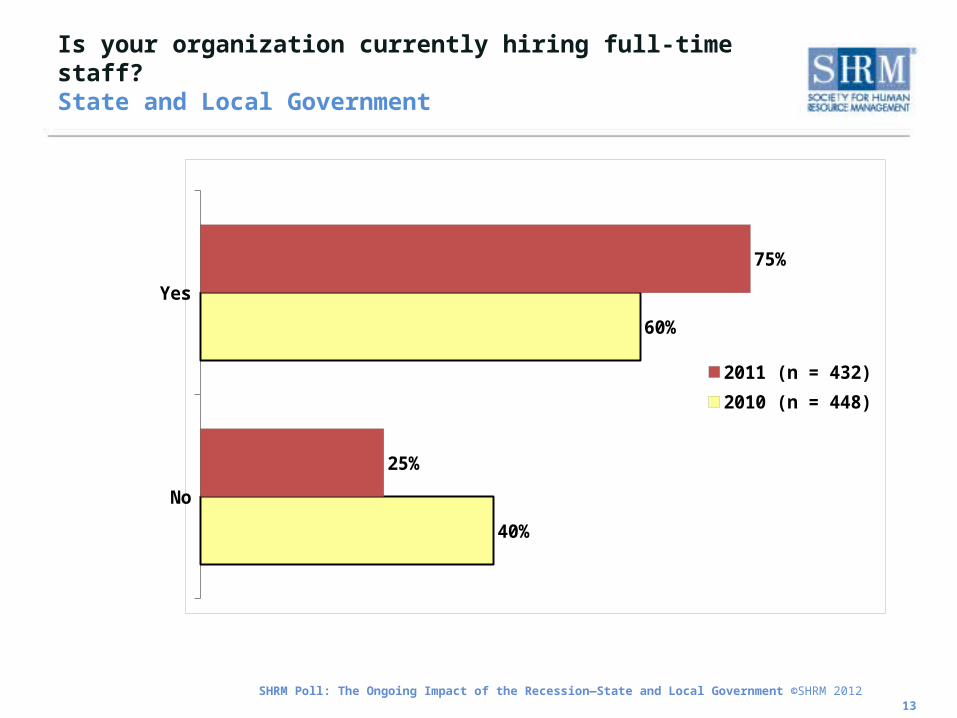
Are organizations hiring? Three-quarters (75%) of respondents from state and local governments were hiring—an increase from 60% in 2010. The majority (80%) of those who are hiring are recruiting nonmanagement hourly employees, and two-thirds (66%) are hiring nonmanagement salaried employees. Just over one-half (54%) are hiring other management-level employees, and about one-quarter (28%) are hiring executive or upper management staff.
Are organizations creating new positions or replacing jobs lost? In 2011, the majority (80%) of state and local governments were hiring direct replacements of jobs lost since the recession began, an increase of 19 percentage points compared with 2010 (61%). Fewer organizations were hiring for completely new positions in 2011 (12%) than in 2010 (28%).
SHRM Poll: The Ongoing Impact of the Recession—State and Local Government ©SHRM 2012 6
Key Findings: Recruiting ChallengesState and Local Government
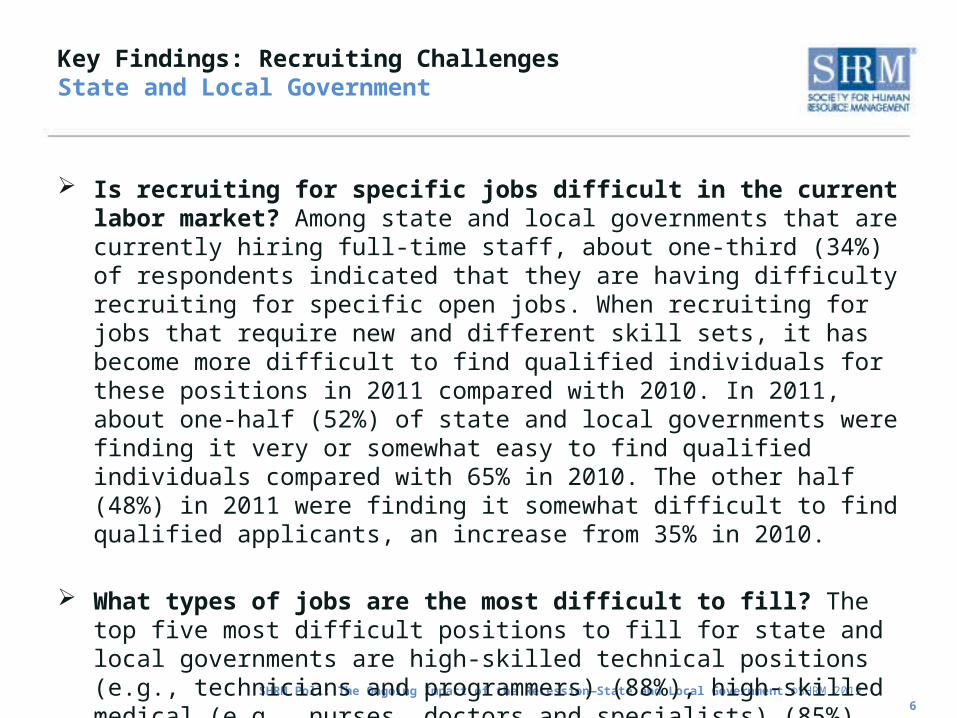
Is recruiting for specific jobs difficult in the current labor market? Among state and local governments that are currently hiring full-time staff, about one-third (34%) of respondents indicated that they are having difficulty recruiting for specific open jobs. When recruiting for jobs that require new and different skill sets, it has become more difficult to find qualified individuals for these positions in 2011 compared with 2010. In 2011, about one-half (52%) of state and local governments were finding it very or somewhat easy to find qualified individuals compared with 65% in 2010. The other half (48%) in 2011 were finding it somewhat difficult to find qualified applicants, an increase from 35% in 2010.
What types of jobs are the most difficult to fill? The top five most difficult positions to fill for state and local governments are high-skilled technical positions (e.g., technicians and programmers) (88%), high-skilled medical (e.g., nurses, doctors and specialists) (85%), engineers (83%), scientists (80%), and managers and executives (71%).
SHRM Poll: The Ongoing Impact of the Recession—State and Local Government ©SHRM 2012 7
Organizations’ Financial Health
The Ongoing Impact of the Recession:State and Local Government
SHRM Poll: The Ongoing Impact of the Recession—State and Local Government ©SHRM 2012 8
More than 50% of staff
21% to 50% of staff
11% to 20% of staff (2011 data) * 10% to 20% (2010
data)
10% or less (2011 data) *Less than 10% (2010
data)
6% to 10% of staff
1% to 5% of staff
Not applicable—did not lay off any staff
0%
2%
17%
81%
0%
3%
11%
85%
18%
37%
30% 2011 (n = 432)
2010 (n = 454)
Thus far, what percentage of full-time jobs have been lost at your organization since the U.S. and global recession began in December 2007? State and Local Government
Note: Percentages may not total 100% due to rounding. An asterisk (*) indicates 2010 data had different categories than 2011 data: “Less than 10% of staff” and “10% to 20% of staff.”
85%

SHRM Poll: The Ongoing Impact of the Recession—State and Local Government ©SHRM 2012 9
Thus far, what percentage of full-time jobs have been lost at your organization since the U.S. and global recession began in December 2007? State and Local Government
Federal government (50%)Finance (45%)
…are more likely tohave had NO layoffs
than...
Construction, mining, oil and gas (20%)Manufacturing (21%)
State and local government (30%)Services—professional (30%)
High-tech (29%)
Comparisons by industry
The federal government and the finance industry are more likely to have had no layoffs compared with the construction, mining, oil and gas; manufacturing; state and local government; professional services; and high-tech industries.
The construction, mining, oil and gas; manufacturing; professional services, and high-tech industries are more likely to have lost 21% to 50% of staff compared with state and local governments.
Construction, mining, oil and gas (17%)Manufacturing (14%)
Services—professional (10%)High-tech (9%)
…are more likely tohave lost 21% to 50% of staff
than...State and local government (3%)
Note: Only statistically significant differences are shown.

SHRM Poll: The Ongoing Impact of the Recession—State and Local Government ©SHRM 2012 10
In relation to the U.S. and global recession, would you say your organization's overall financial health is declining or recovering compared with 12 months ago?State and Local Government
In a significant decline
In a mild decline
No change compared with 12 months ago
In a mild recovery
In a significant recovery
22%
41%
25%
11%
1%
13%
32%
29%
25%
1% 2011 (n = 431)
2010 (n = 451)
SHRM Poll: The Ongoing Impact of the Recession—State and Local Government ©SHRM 2012 11
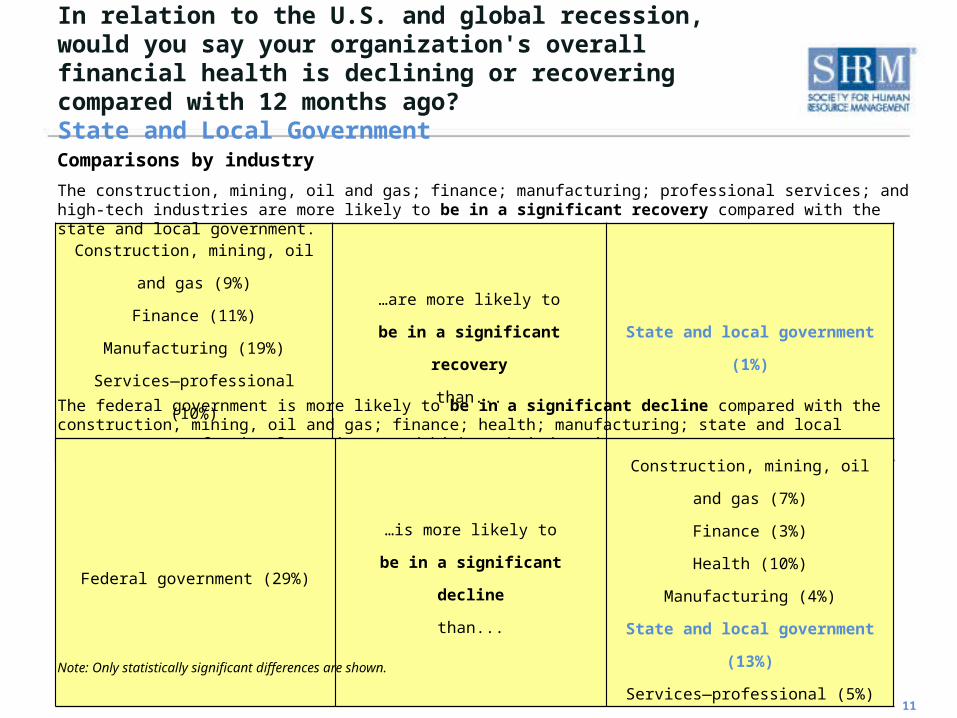
In relation to the U.S. and global recession, would you say your organization's overall financial health is declining or recovering compared with 12 months ago?State and Local Government
Construction, mining, oil and gas (9%)Finance (11%)
Manufacturing (19%)Services—professional (10%)
High-tech (14%)
…are more likely tobe in a significant recovery
than...State and local government (1%)
Comparisons by industry
The construction, mining, oil and gas; finance; manufacturing; professional services; and high-tech industries are more likely to be in a significant recovery compared with the state and local government.
The federal government is more likely to be in a significant decline compared with the construction, mining, oil and gas; finance; health; manufacturing; state and local government; professional services; and high-tech industries.
Federal government (29%)…is more likely to
be in a significant declinethan...
Construction, mining, oil and gas (7%)Finance (3%)Health (10%)
Manufacturing (4%)State and local government (13%)
Services—professional (5%)High-tech (4%)
Note: Only statistically significant differences are shown.
SHRM Poll: The Ongoing Impact of the Recession—State and Local Government ©SHRM 2012 12
Hiring
The Ongoing Impact of the Recession:State and Local Government
SHRM Poll: The Ongoing Impact of the Recession—State and Local Government ©SHRM 2012 13
Is your organization currently hiring full-time staff? State and Local Government
No
Yes
40%
60%
25%
75%
2011 (n = 432)2010 (n = 448)

SHRM Poll: The Ongoing Impact of the Recession—State and Local Government ©SHRM 2012 14
At what level(s) is your organization hiring?State and Local Government
Executive/upper management (e.g., CEO, CFO)
Other management (e.g., directors, managers)
Nonmanagement salaried employees
Nonmanagement hourly employees
28%
54%
66%
80%
Note: n = 319. Percentages do not total 100% due to multiple response options. Only respondents whose organizations were currently hiring full-time staff were asked this question.
SHRM Poll: The Ongoing Impact of the Recession—State and Local Government ©SHRM 2012 15
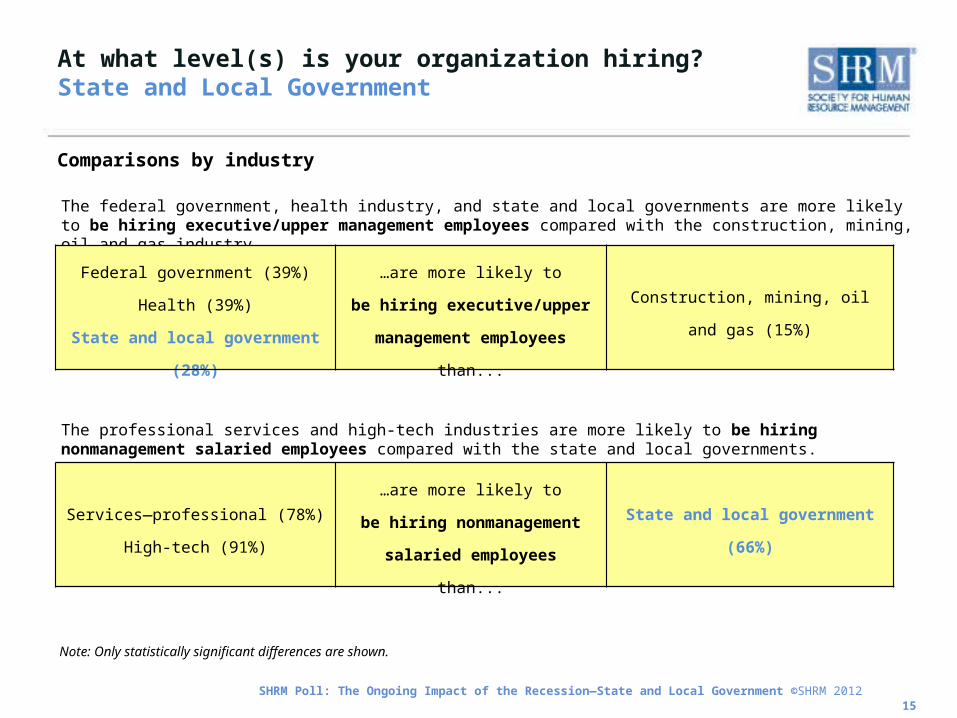
At what level(s) is your organization hiring?State and Local Government
Comparisons by industry
The professional services and high-tech industries are more likely to be hiring nonmanagement salaried employees compared with the state and local governments.
Services—professional (78%)High-tech (91%)
…are more likely tobe hiring nonmanagement salaried
employeesthan...
State and local government (66%)
The federal government, health industry, and state and local governments are more likely to be hiring executive/upper management employees compared with the construction, mining, oil and gas industry.
Federal government (39%)Health (39%)
State and local government (28%)
…are more likely tobe hiring executive/upper management employees
than...
Construction, mining, oil and gas (15%)
Note: Only statistically significant differences are shown.
SHRM Poll: The Ongoing Impact of the Recession—State and Local Government ©SHRM 2012 16
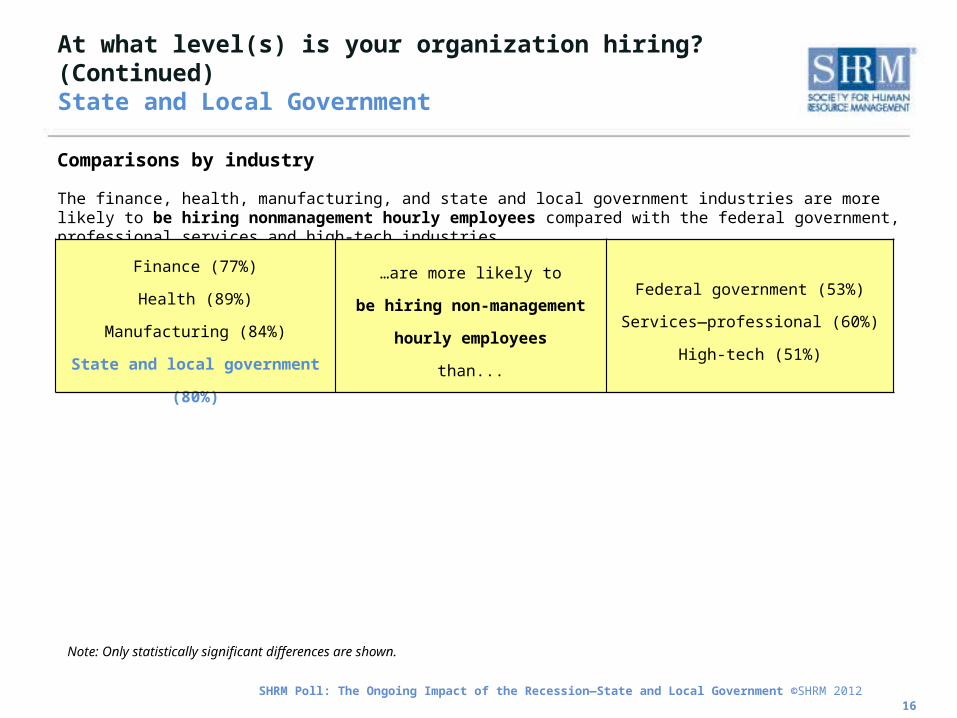
At what level(s) is your organization hiring? (Continued)State and Local Government
Comparisons by industry
The finance, health, manufacturing, and state and local government industries are more likely to be hiring nonmanagement hourly employees compared with the federal government, professional services and high-tech industries.
Finance (77%)Health (89%)
Manufacturing (84%)State and local government (80%)
…are more likely tobe hiring non-management hourly
employeesthan...
Federal government (53%)Services—professional (60%)
High-tech (51%)
Note: Only statistically significant differences are shown.

SHRM Poll: The Ongoing Impact of the Recession—State and Local Government ©SHRM 2012 17
Which of the following best describes, in general, the nature of full-time positions your organization is currently hiring?State and Local Government
Note: Only respondents whose organizations were currently hiring full-time staff were asked this question.
Direct replacements of jobs lost (e.g., due to layoffs, attrition) since the recession began
New duties added to jobs lost (e.g., due to layoffs, attrition) since the recession began
Completely new positions
61%
11%
28%
80%
8%
12%
2011 (n = 316)2010 (n = 250)
SHRM Poll: The Ongoing Impact of the Recession—State and Local Government ©SHRM 2012 18
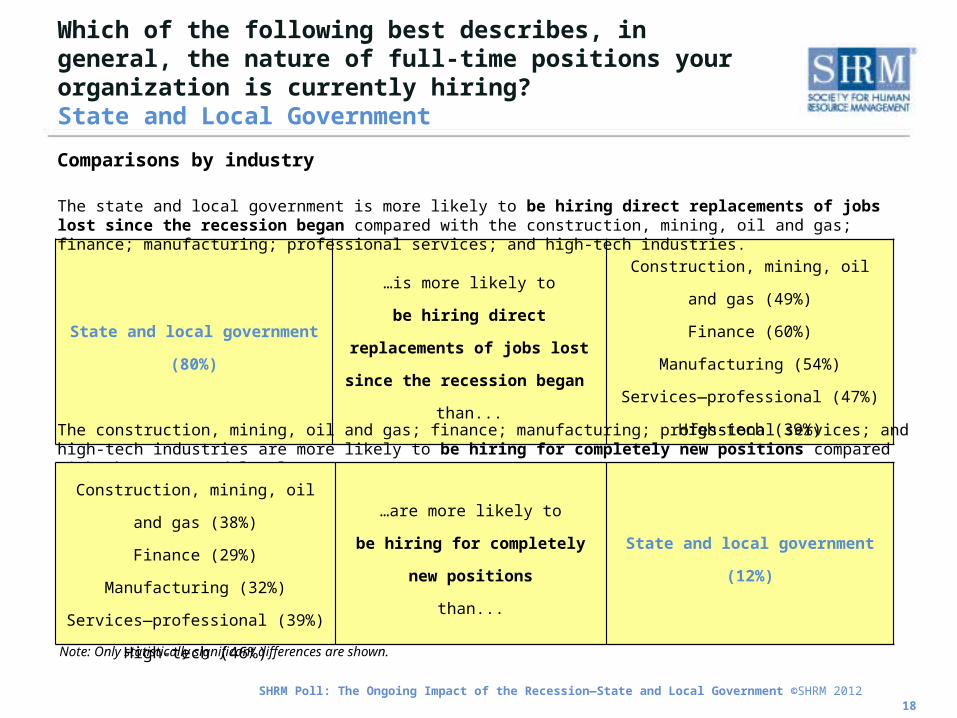
Which of the following best describes, in general, the nature of full-time positions your organization is currently hiring?State and Local Government
State and local government (80%)
…is more likely tobe hiring direct replacements of jobs
lost since the recession began than...
Construction, mining, oil and gas (49%)Finance (60%)
Manufacturing (54%)Services—professional (47%)
High-tech (39%)
Comparisons by industry
The state and local government is more likely to be hiring direct replacements of jobs lost since the recession began compared with the construction, mining, oil and gas; finance; manufacturing; professional services; and high-tech industries.
The construction, mining, oil and gas; finance; manufacturing; professional services; and high-tech industries are more likely to be hiring for completely new positions compared with the state and local governments.
Construction, mining, oil and gas (38%)Finance (29%)
Manufacturing (32%)Services—professional (39%)
High-tech (46%)
…are more likely tobe hiring for completely new
positionsthan...
State and local government (12%)
Note: Only statistically significant differences are shown.
SHRM Poll: The Ongoing Impact of the Recession—State and Local Government ©SHRM 2012 19
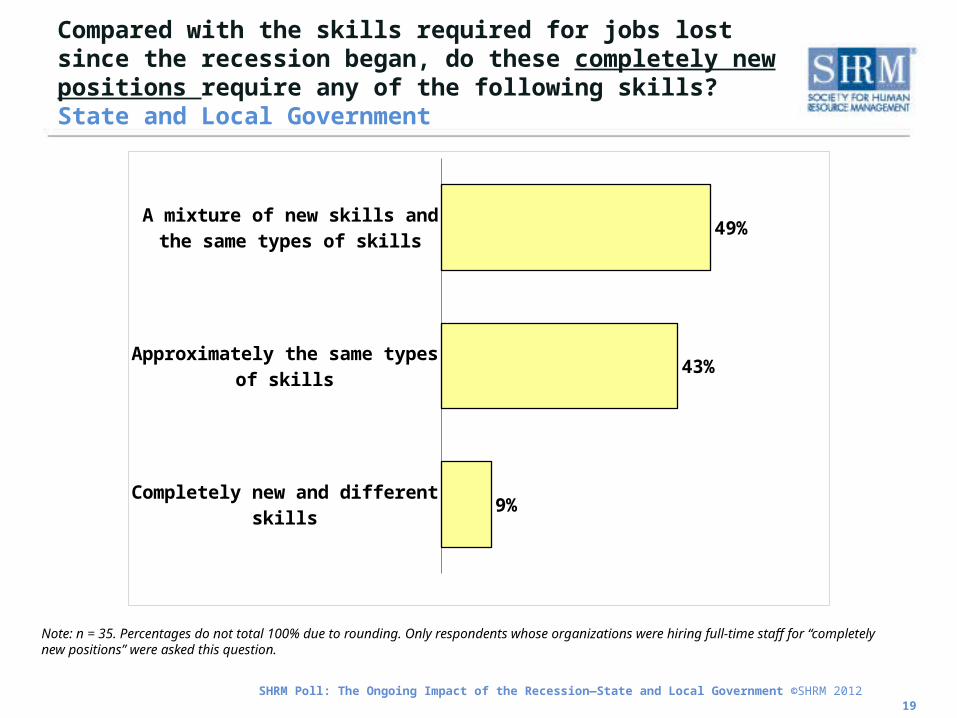
Compared with the skills required for jobs lost since the recession began, do these completely new positions require any of the following skills?State and Local Government
Note: n = 35. Percentages do not total 100% due to rounding. Only respondents whose organizations were hiring full-time staff for “completely new positions” were asked this question.
Completely new and different skills
Approximately the same types of skills
A mixture of new skills and the same types of skills
9%
43%
49%

SHRM Poll: The Ongoing Impact of the Recession—State and Local Government ©SHRM 2012 20
Recruiting Challenges
The Ongoing Impact of the Recession:State and Local Government
SHRM Poll: The Ongoing Impact of the Recession—State and Local Government ©SHRM 2012 21
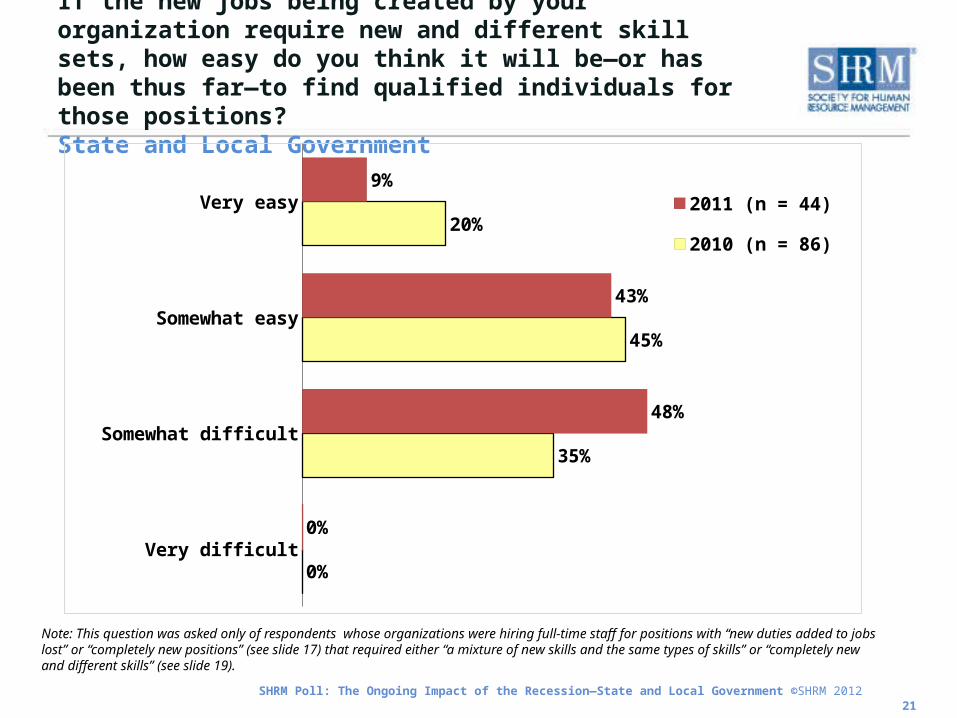
If the new jobs being created by your organization require new and different skill sets, how easy do you think it will be—or has been thus far—to find qualified individuals for those positions?State and Local Government
Note: This question was asked only of respondents whose organizations were hiring full-time staff for positions with “new duties added to jobs lost” or “completely new positions” (see slide 17) that required either “a mixture of new skills and the same types of skills” or “completely new and different skills” (see slide 19).
Very difficult
Somewhat difficult
Somewhat easy
Very easy
0%
35%
45%
20%
0%
48%
43%
9%2011 (n = 44)
2010 (n = 86)

SHRM Poll: The Ongoing Impact of the Recession—State and Local Government ©SHRM 2012 22
In general, in the current labor market, is your organization having a difficult time recruiting for specific jobs that are open in your organization?State and Local Government
Yes; 34%
No; 66%
Note: n = 302. Respondents who answered “Don’t know” were excluded from this analysis. Only respondents whose organizations were currently hiring full-time staff were asked this question.

SHRM Poll: The Ongoing Impact of the Recession—State and Local Government ©SHRM 2012 23
In general, in the current labor market, is your organization having a difficult time recruiting for specific jobs that are open in your organization?State and Local Government
Construction, mining, oil and gas (51%)Finance (49%)
Manufacturing (68%)Services—professional (57%)
High-tech (71%)
…are more likely tobe having difficulty recruiting for
specific jobs that are open in their organization
than...
State and local government (34%)
Comparisons by industry
The construction, mining, oil and gas; finance; manufacturing; professional services; and high-tech industries are more likely to be having difficulty recruiting for specific jobs compared with the state and local governments.
Note: Only statistically significant differences are shown.

SHRM Poll: The Ongoing Impact of the Recession—State and Local Government ©SHRM 2012 24
Do you believe that your organization is facing global competition (i.e., competition from other countries) for jobs that your organization is having difficulty filling?State and Local Government
Yes; 4%
No; 96%
Note: n = 96. Respondents who answered “Don’t know” were excluded from this analysis. Only respondents whose organizations were having a difficult time recruiting for certain types of jobs were asked this question.

SHRM Poll: The Ongoing Impact of the Recession—State and Local Government ©SHRM 2012 25
Do you believe that your organization is facing global competition (i.e., competition from other countries) for jobs that your organization is having difficulty filling?State and Local Government
Construction, mining, oil and gas (34%)Federal government (28%)
Health (27%)Manufacturing (27%)
Services—professional (21%)High-tech (42%)
…are more likely tobelieve that their organization is
facing global competitionthan...
State and local government (4%)
Comparisons by industry
The construction, mining, oil and gas; federal government; health; manufacturing; professional services; and high-tech industries are more likely to believe that their organization is facing global competition compared with the state and local governments.
Note: Only statistically significant differences are shown.
SHRM Poll: The Ongoing Impact of the Recession—State and Local Government ©SHRM 2012 26
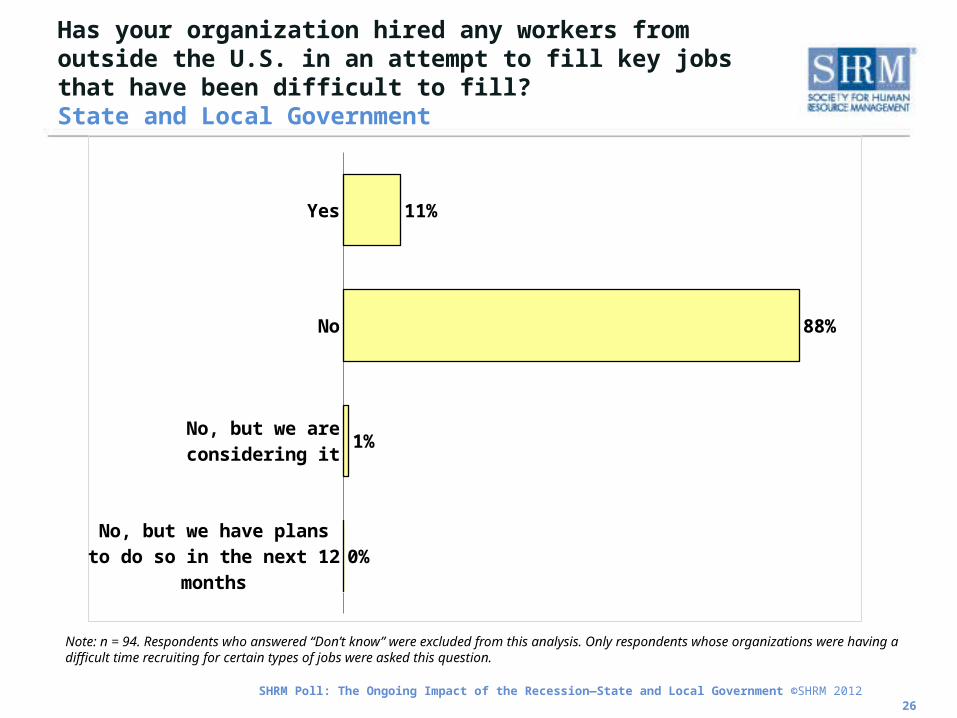
Has your organization hired any workers from outside the U.S. in an attempt to fill key jobs that have been difficult to fill?State and Local Government
No, but we have plans to do so in the next 12 months
No, but we are considering it
No
Yes
0%
1%
88%
11%
Note: n = 94. Respondents who answered “Don’t know” were excluded from this analysis. Only respondents whose organizations were having a difficult time recruiting for certain types of jobs were asked this question.

SHRM Poll: The Ongoing Impact of the Recession—State and Local Government ©SHRM 2012 27
Has your organization hired any workers from outside the U.S. in an attempt to fill key jobs that have been difficult to fill?State and Local Government
Construction, mining, oil and gas (31%)High-tech (50%)
…are more likely tohave hired workers from outside the U.S.
than...State and local government (11%)
Comparisons by industry
The construction, mining, oil and gas, and high-tech industries are more likely to have hired workers from outside the U.S. in an attempt to fill hard-to-fill jobs compared with state and local governments.
Note: Only statistically significant differences are shown.
SHRM Poll: The Ongoing Impact of the Recession—State and Local Government ©SHRM 2012 28
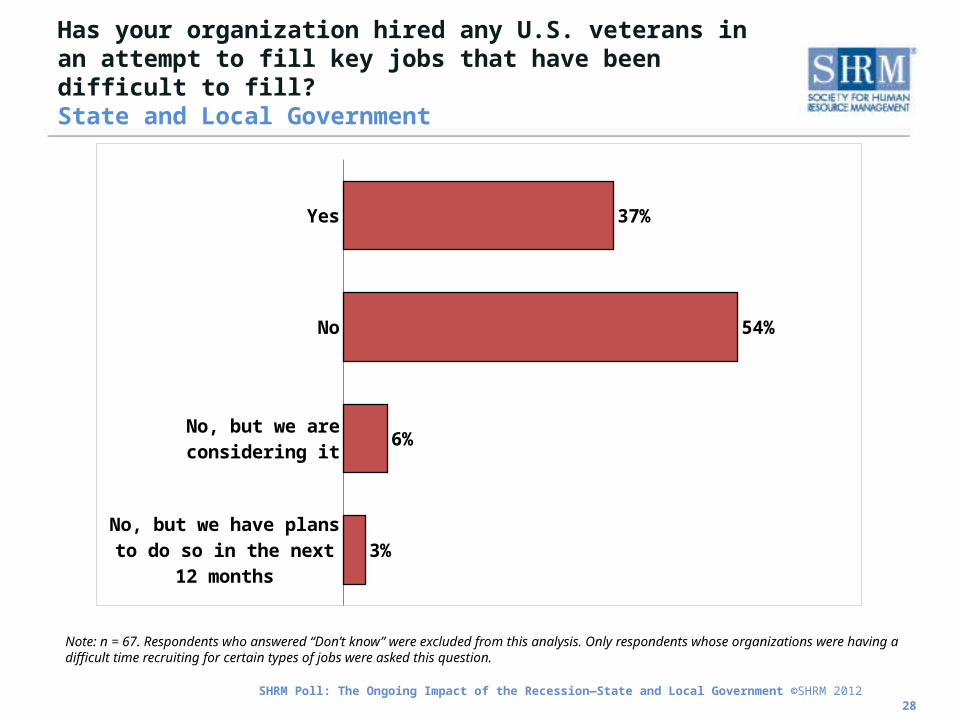
Has your organization hired any U.S. veterans in an attempt to fill key jobs that have been difficult to fill?State and Local Government
No, but we have plans to do so in the next 12 months
No, but we are considering it
No
Yes
3%
6%
54%
37%
Note: n = 67. Respondents who answered “Don’t know” were excluded from this analysis. Only respondents whose organizations were having a difficult time recruiting for certain types of jobs were asked this question.
SHRM Poll: The Ongoing Impact of the Recession—State and Local Government ©SHRM 2012 29
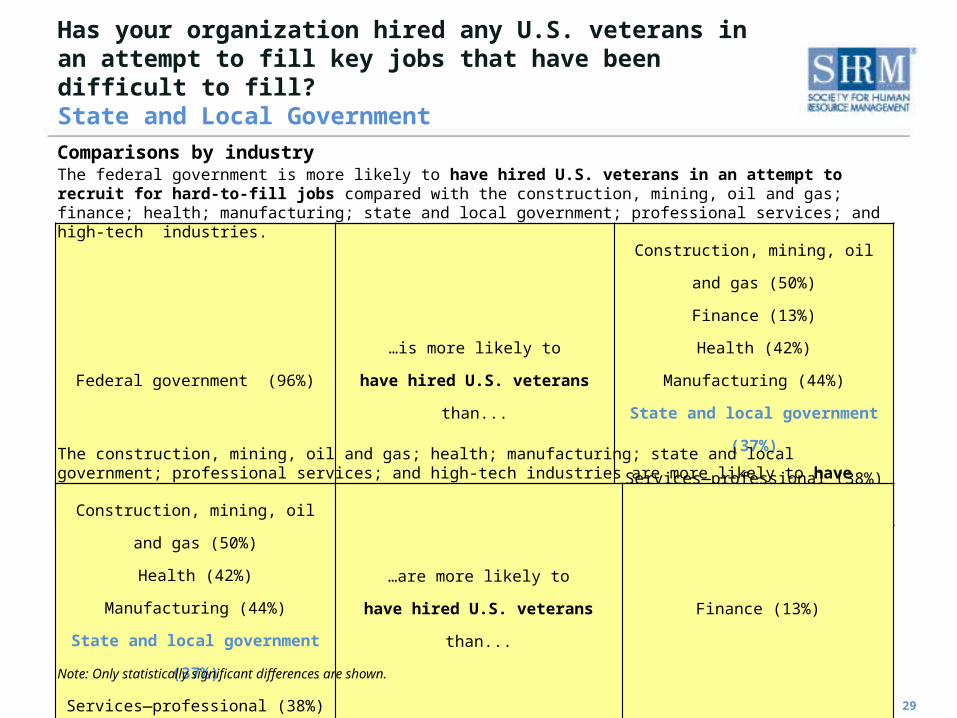
Has your organization hired any U.S. veterans in an attempt to fill key jobs that have been difficult to fill?State and Local Government
Federal government (96%)…is more likely to
have hired U.S. veteransthan...
Construction, mining, oil and gas (50%)Finance (13%)Health (42%)
Manufacturing (44%)State and local government (37%)
Services—professional (38%)High-tech (34%)
Comparisons by industryThe federal government is more likely to have hired U.S. veterans in an attempt to recruit for hard-to-fill jobs compared with the construction, mining, oil and gas; finance; health; manufacturing; state and local government; professional services; and high-tech industries.
The construction, mining, oil and gas; health; manufacturing; state and local government; professional services; and high-tech industries are more likely to have hired U.S. veterans in an attempt to fill hard-to-fill jobs compared with the finance industry.
Construction, mining, oil and gas (50%)Health (42%)
Manufacturing (44%)State and local government (37%)
Services—professional (38%)High-tech (34%)
…are more likely tohave hired U.S. veterans
than...Finance (13%)
Note: Only statistically significant differences are shown.

SHRM Poll: The Ongoing Impact of the Recession—State and Local Government ©SHRM 2012 30
In general, what basic skill/knowledge gaps do job applicants have in your industry?State and Local Government
Other
Technical (computer, engineering, mechanical, etc.)
History/geography
Humanities/arts
Foreign languages
Science
English language (spoken)
Reading comprehension (in English)
Mathematics (computation)
Government/economics
Writing in English (grammar, spelling, etc.)
6%
1%
4%
4%
6%
8%
22%
24%
24%
41%
56%
Note: n = 78. Percentages do not total 100% due to multiple response options. Only respondents whose organizations were having a difficult time recruiting for certain types of jobs were asked this question.

SHRM Poll: The Ongoing Impact of the Recession—State and Local Government ©SHRM 2012 31
In general, what applied skill gaps do job applicants have in your industry?State and Local Government
Other
Diversity
Creativity/innovation
Lifelong learning/self-direction
Information technology application
Ethics/social responsibility
Teamwork/collaboration
Oral communications
Leadership
Written communications
Professionalism/work ethic
Critical thinking/problem solving
10%
20%
24%
26%
26%
26%
33%
36%
43%
46%
49%
53%
Note: n = 90. Percentages do not total 100% due to multiple response options. Only respondents whose organizations were having a difficult time recruiting for certain types of jobs were asked this question.

SHRM Poll: The Ongoing Impact of the Recession—State and Local Government ©SHRM 2012
Specific Job Categories Organizations Having Difficulty RecruitingState and Local Government
Customer service representatives (n = 68)
Administrative support staff (n = 92)
Hourly laborers (n = 65)
Drivers (n = 36)
HR professionals (n = 61)
Accounting and finance professionals (n = 72)
Skilled trades (e.g., electricians, carpenters) (n = 51)
Managers and executives (n = 80)
Scientists (n = 20)
Engineers (n = 53)
High-skilled medical (e.g., nurses, doctors, specialists) (n = 32)
High-skilled technical (e.g., technicians, programmers) (n = 72)
14%
16%
21%
28%
46%
56%
61%
71%
80%
83%
85%
88%
Note: Chart represents “somewhat difficult” and “very difficult” responses. “Not applicable” responses were excluded from this analysis. Only respondents whose organizations were having a difficult time recruiting for certain types of jobs were asked this question. No statistics are provided for job categories where the n is less than 20; therefore, the job categories of “production operators” (n = 19) and “sales representatives” (n = 8) were excluded from this analysis.
32
SHRM Poll: The Ongoing Impact of the Recession—State and Local Government ©SHRM 2012 33
Demographics
The Ongoing Impact of the Recession:State and Local Government
SHRM Poll: The Ongoing Impact of the Recession—State and Local Government ©SHRM 2012
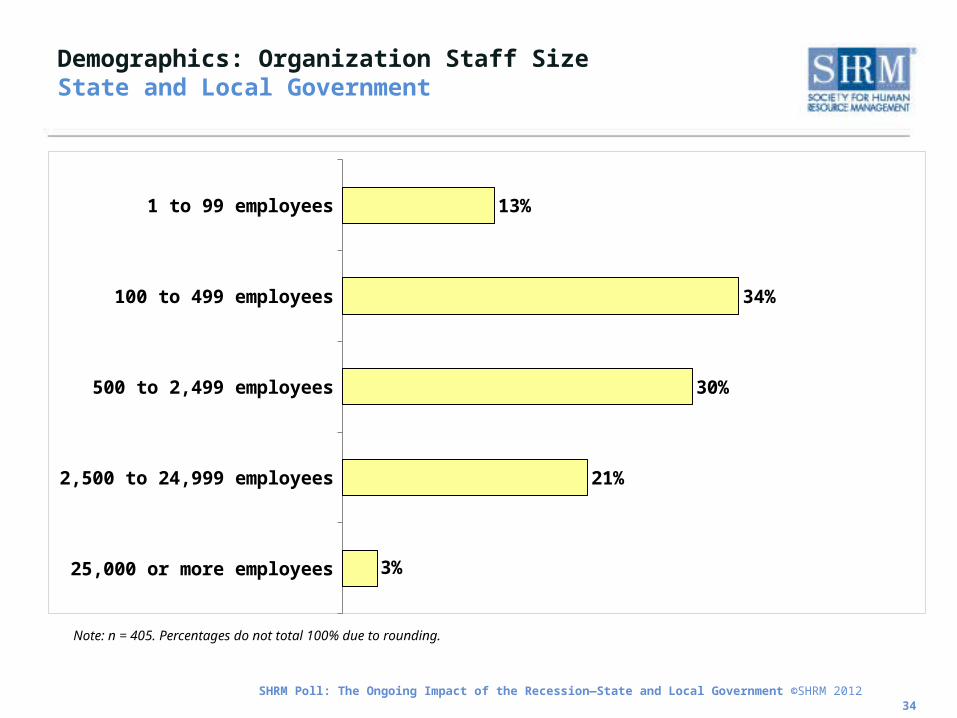
Demographics: Organization Staff SizeState and Local Government
25,000 or more employees
2,500 to 24,999 employees
500 to 2,499 employees
100 to 499 employees
1 to 99 employees
3%
21%
30%
34%
13%
34
Note: n = 405. Percentages do not total 100% due to rounding.

SHRM Poll: The Ongoing Impact of the Recession—State and Local Government ©SHRM 2012
Demographics: OtherState and Local Government
35
U.S.-based operations only 100%
Multinational operations 0%
Single-unit organization: An organization in which the location and the organization are one and the same
63%
Multi-unit organization: An organization that has more than one location 37%
Multi-unit headquarters determines HR policies and practices 55%
Each work location determines HR policies and practices 1%
A combination of both the work location and the multi-unit headquarters determine HR policies and practices
44%
Is your organization a single-unit organization or a multi-unit organization?
Are HR policies and practices determined by the multi-unit corporate headquarters, by each work location or both?
Does your organization have U.S.-based operations (business units) only or does it operate multinationally?
n = 417 n = 418
n = 151
Corporate (companywide) 76%
Business unit/division 16%
Facility/location 8%
n = 153
What is the HR department/function you responded for throughout this survey?

SHRM Poll: The Ongoing Impact of the Recession—State and Local Government ©SHRM 2012
SHRM Poll: The Ongoing Impact of the Recession:State and Local Government
Response rate = 15%
Sample composed of 432 randomly selected HR professionals from state and local governments in SHRM’s membership
Margin of error +/-5%
Survey fielded August 18-September 2, 2011
36
Methodology
For more poll findings, visit www.shrm.org/surveys
Follow us on Twitter: http://twitter.com/SHRM_Research
Project leader:
Tanya A. Mulvey, survey research analyst, SHRM Research
Project contributors:Mark Schmit, Ph.D., SPHR, vice president, SHRM ResearchEvren Esen, manager, SHRM Survey Research Center
Copy editor:
Katya Scanlan, SHRM Knowledge Integration