Recent Trends ofDesert Tortoise Populations in the … · PAUL STEPHEN CORN $5 . Recent Trends...
10
PAUL STEPHEN CORN $5 Recent Trends of Desert Tortoise Populations in the Mojave Desert by Paul Stephen Corn! U.S. Fish and Wildlife Service National Ecology Research Center 4512 McMurry Avenue Fort Collins, Colorado 80525 Abstract. The desert tortoise, Gopherus agassizii (Cooper), was listed as threatened in the Mojave Desert in 1990. Important factors for the listing were severe recent mortality in tortoise populations and a general decline throughout this century. Recent trends in tortoise populations were examined by plotting total captures of adult and juvenile tortoises from 2,6-krn 2 study plots, rather than by mark-and-recapture population estimates. Changes in relative abundance oftortoises were greatest among large tortoises in the western Mojave Desert, which may reflect high levels of human disturbance, and among small tortoises, which may reflect either lower ability of searchers to detect small tortoises or greater mortality of tortoises during drought conditions in 1986-90, or both factors. Further collection of data on population trends is needed, particularly in years withhigher-than-average precipitation. Retention of the threatened status ofthe tortoise is a conservative strategy for the conservation of natural resources but should be reassessed when additional data are available. Key words: Drought, Gopherus agassizii, human disturbance, population analysis, size. The status of the desert tortoise, Gopherus agassizii, has been followed for several years. Woodbury and Hardy (1948) and Carr (1952) ex- pressed concern about overcol1ection of tortoises for the pet trade. Jaeger (1955) observed that human encroachment was causing the gradual disappearance of G. agassizii, and Bury and Mar- low (1973) predicted that urbanization would eliminate the tortoise from the northwestern Mo- jave Desert in California. Luckenbach (1982:1) stated that "a pronounced and steady decline" had 1 Now with the National Biological Survey, same address. been noted in some populations for several years. Besides these long-term trends related mostly to habitat destruction, significant decreases ofnum- bers of tortoises were reported in several popula- tions in the western Mojave Desert during the 1980's, related perhaps to the outbreak of an upper respiratory disease in -some locations (Berry 1990). These reported declines in part prompted the U.S. Fish and Wildlife Service to declare Mo- jave Desert populations of Gopherus agassizii as threatened (U.S. Fish and Wildlife Service 1990). This paper evaluates the evidence for short-term declines of populations of G. agassizii in the Mo- jave Desert in Arizona, California, Nevada, and
-
Upload
hoangquynh -
Category
Documents
-
view
214 -
download
0
Transcript of Recent Trends ofDesert Tortoise Populations in the … · PAUL STEPHEN CORN $5 . Recent Trends...
PAUL STEPHEN CORN $5
Recent Trends of Desert Tortoise Populations in the Mojave Desert
by
Paul Stephen Corn!
U.S. Fish and Wildlife Service National Ecology Research Center
4512 McMurry Avenue Fort Collins, Colorado 80525
Abstract. The desert tortoise, Gopherus agassizii (Cooper), was listed as threatened in the Mojave Desert in 1990. Important factors for the listing were severe recent mortality in tortoise populations and a general decline throughout this century. Recent trends in tortoise populations were examined by plotting total captures of adult and juvenile tortoises from 2,6-krn2 study plots, rather than by mark-and-recapture population estimates. Changes in relative abundance oftortoises were greatest among large tortoises in the western Mojave Desert, which may reflect high levels of human disturbance, and among small tortoises, which may reflect either lower ability of searchers to detect small tortoises or greater mortality of tortoises during drought conditions in 1986-90, or both factors. Further collection of data on population trends is needed, particularly in years withhigher-than-average precipitation. Retention ofthe threatened status ofthe tortoise is a conservative strategy for the conservation of natural resources but should be reassessed when additional data are available.
Key words: Drought, Gopherus agassizii, human disturbance, population analysis, size.
The status of the desert tortoise, Gopherus agassizii, has been followed for several years. Woodbury and Hardy (1948) and Carr (1952) expressed concern about overcol1ection of tortoises for the pet trade. Jaeger (1955) observed that human encroachment was causing the gradual disappearance of G. agassizii, and Bury and Marlow (1973) predicted that urbanization would eliminate the tortoise from the northwestern Mojave Desert in California. Luckenbach (1982:1) stated that "a pronounced and steady decline" had
1 Now with the National Biological Survey, same address.
been noted in some populations for several years. Besides these long-term trends related mostly to habitat destruction, significant decreases ofnumbers of tortoises were reported in several populations in the western Mojave Desert during the 1980's, related perhaps to the outbreak ofan upper respiratory disease in -some locations (Berry 1990). These reported declines in part prompted the U.S. Fish and Wildlife Service to declare Mojave Desert populations of Gopherus agassizii as threatened (U.S. Fish and Wildlife Service 1990). This paper evaluates the evidence for short-term declines of populations of G. agassizii in the Mojave Desert in Arizona, California, Nevada, and
86 FISH AND WILDLIFE RESEARCH 13
Utah since 1977 with data from the Bureau of Land Management.
The Bureau of Land Management Data Set and
Critique of Existing Analyses
Bureau of Land Management personnel collected trend data on populations of G. agassizii from 2.6-km2 study plots (Berry and Nicholson 1984). Standardized surveys usually involved 60 days (fewer calendar days if more than one person was employed). Data from study plots were used to calculate densities of tortoises with the Lincoln-Peterson mark-and-recapture model by dividing the 60-day survey into two approximately equal sampling efforts (Turner and Berry 1984).
There are four assumptions for estimating population size with mark-and-recapture techniques (Otis et al. 1978; White et al. 1982): (1) the population is demographically and geographically closed; (2) marks are persistent; (3) all marks are recorded correctly; and (4) the probability of capture for each animal at each trapping occasion is equal and constant. Data on G. agassizii from 2.6-km2 study plots, however, violate assumptions 1 and 4. Assumption 1 is violated because study plots are not geographically closed but part of larger expanses of suitable tortoise habitat. Tortoises may move freely between the study area and adjacent habitat. Assumption 4 is violated often in two ways: different-sized tortoises have different probabilities of capture (Turner and Berry 1984), and capture probabilities may vary over time. Because tortoises are usually more active during or immediately after rain (Turner and Berry 1984; Nagy and Medica 1986), rainfall during a 60-day survey probably creates unequal capture probabilities. If there is heterogeneity of capture probabilities among animals and across time, a statistically valid population estimate cannot be calculated (Otis et al. 1978; White et al. 1982).
Violation of the assumptions of mark-and-recapture models may lead to density estimates that are biased and that may be too large. One of the strengths of the 60-day survey, however, is that
sampling effort is generally equivalent among years. Thus, ignoring recaptures, the total number of tortoises captured (registered) during a 60day survey may be a more useful index of population trends because the probability of observing adult tortoises is high (Berry and Turner 1986). Lower capture probabilities of smaller tortoises and variation in activity because of weather, however, create greater uncertainty about the total numbers of captured juvenile tortoises. Still, I prefer this technique to estimating numbers based on few recaptures. Here, I analyze recent trends in tortoise populations based on total numbers captured during 60-day surveys.
Methods
I analyzed captures of desert tortoises from 1977 to 1989 at 16 sites in the Mojave Desert (for which multiple years of observations were available) with published data or data in the public domain (Table 1): 2 study plots in Arizona (Duck and Snider 1988; Duck and Schipper 1989), 13 study plots in California (Berry and Nicholson 1984; Turner et al. 1987a; Berry 1990; Berry et al. 1990), and 1 study plot in Nevada (Bureau ofLand Management, unpublished data). I did not use data from plots in which sampling was conducted in only one year or in which sampling efforts differed across years. For example, the Fremont Peak plot in California with 15-, 30-, and 60-day sampling efforts and the Sheep Mountain plot in Nevada with 30- and 60-day sampling efforts (Esque and Duncan 1989) were excluded from the analysis. I excluded data from a 30-day sampling effort in the Piute plot in Nevada in 1979 but used data from 60-day efforts in 1983 and 1989 at this site.
To account for size-related differences in capture probabilities, I partitioned my analysis between small (<l80-mm maximum carapace length [MCL)) tortoises-immature and juvenile size classes of Turner and Berry (1984), and large (~180-mm
MCL) tortoises-subadult and adult size classes of Turner and Berry (1984). I used the total number of tortoises captured during 60-day surveys; recapture data were not used. I transformed the data to
PAUL STEPHEN CORN 87
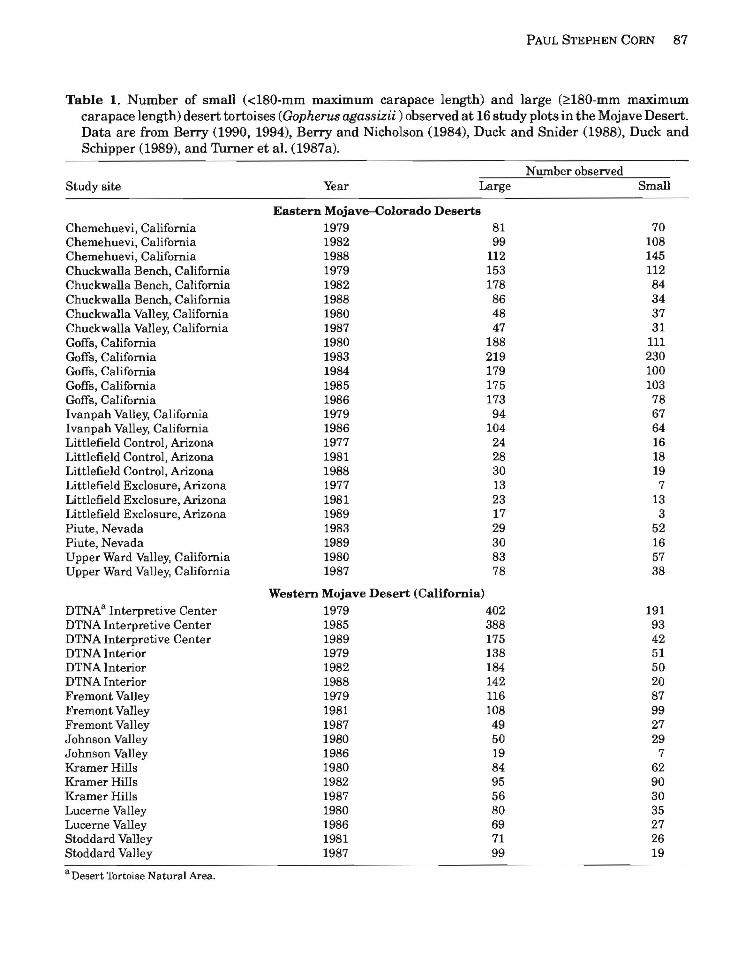
Table 1. Number of small (<l80-mm maximum carapace length) and large (~180-mm maximum carapace length) desert tortoises (Gopherus agassizii ) observed at 16 study plots in the Mojave Desert. Data are from Berry (1990, 1994), Berry and Nicholson (1984), Duck and Snider (1988), Duck and Schipper (1989), and Turner et al. (1987a).
Number observed Study site Year Large Small
EaBtern Mojave-Colorado Deserts Chemehuevi, California 1979 81 70 Chemehuevi, California 1982 99 108 Chemehuevi, California 1988 112 145 Chuckwalla Bench, California 1979 153 112 Chuckwalla Bench, California 1982 178 84 Chuckwalla Bench, California 1988 86 34 Chuckwalla Valley, California 1980 48 37 Chuckwalla Valley, California 1987 47 31 Goffs, California 1980 188 111 Goffs, California 1983 219 230 Goffs, California 1984 179 100 Goffs, California 1985 175 103 Goffs, California 1986 173 78 Ivanpah Valley, California 1979 94 67 Ivanpah Valley, California 1986 104 64 Littlefield Control, Arizona 1977 24 16 Littlefield Control, Arizona 1981 28 18 Littlefield Control, Arizona 1988 30 19 Littlefield Exclosure, Arizona 1977 13 7 Littlefield ExcloBure, Arizona 1981 23 13 Littlefield Exclosure, Arizona 1989 17 3 Piute, Nevada 1983 29 52 Piute, Nevada 1989 30 16 Upper Ward Valley, California 1980 83 57 Upper Ward Valley, California 1987 78 38
Western Mojave Desert (California)
DTNAa Interpretive Center 1979 402 191 DTNA Interpretive Center 1985 388 93 DTNA Interpretive Center 1989 175 42 DTNA Interior 1979 138 51 DTNA Interior 1982 184 50 DTNA Interior 1988 142 20 Fremont Valley 1979 116 87 Fremont Valley 1981 108 99 Fremont Valley 1987 49 27 Johnson Valley 1980 50 29 Johnson Valley 1986 19 7 Kramer Hills 1980 84 62 Kramer Hills 1982 95 90 Kramer Hills 1987 56 30 Lucerne Valley 1980 80 35 Lucerne Valley 1986 69 27 Stoddard Valley 1981 71 26 Stoddard Valley 1987 99 19
a Desert Thrtoise Natural Area.
88 FISH AND WILDIJFE RESEARCH 13
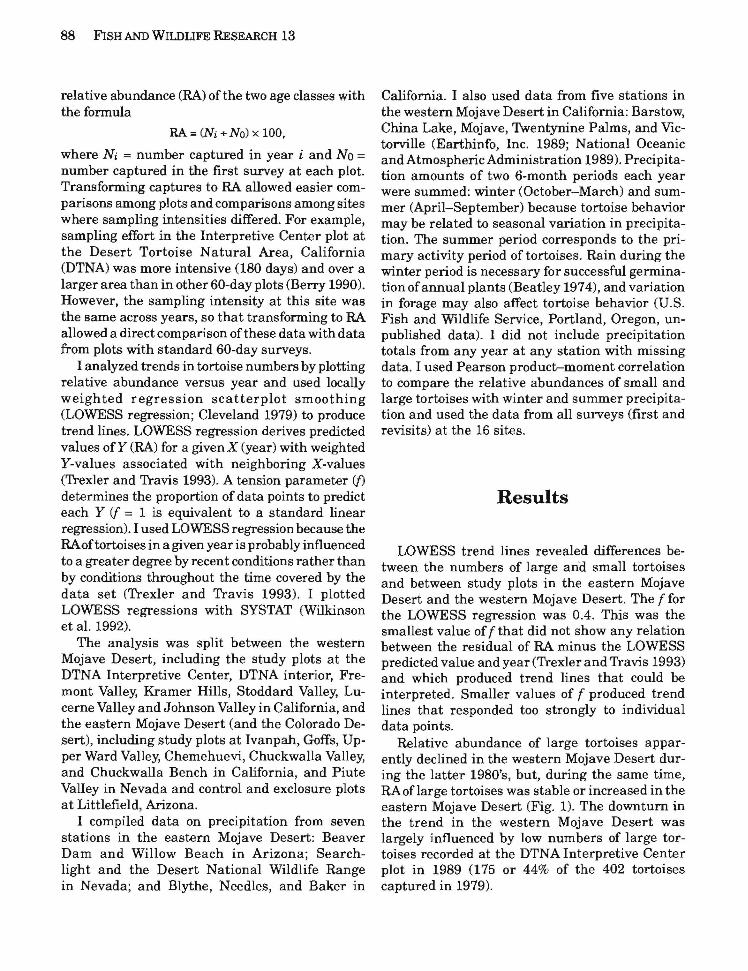
relative abundance (RA) ofthe two age classes with the formula
RA = (Ni + No) x 100,
where Ni = number captured in year i and No = number captured in the first survey at each plot. Transforming captures to RA allowed easier comparisons among plots and comparisons among sites where sampling intensities differed. For example, sampling effort in the Interpretive Center plot at the Desert Tortoise Natural Area, California (DTNA) was more intensive (180 days) and over a larger area than in other 60-day plots (Berry 1990). However, the sampling intensity at this site was the same across years, so that transforming to RA allowed a direct comparison of these data with data from plots with standard 60-day surveys.
I analyzed trends in tortoise numbers by plotting relative abundance versus year and used locally weighted regression scatterplot smoothing (LOWESS regression; Cleveland 1979) to produce trend lines. LOWESS regression derives predicted values ofY (RA) for a given X (year) with weighted Y-values associated with neighboring X-values (Trexler and Travis 1993). A tension parameter (f) determines the proportion of data points to predict each Y if = 1 is equivalent to a standard linear regression). I used LOWESS regression because the RAoftortoises in a given year is probably influenced to a greater degree by recent conditions rather than by conditions throughout the time covered by the data set (Trexler and Travis 1993). I plotted LOWESS regressions with SYSTAT (Wilkinson et al. 1992).
The analysis was split between the western Mojave Desert, including the study plots at the DTNA Interpretive Center, DTNA interior, Fremont Valley, Kramer Hills, Stoddard Valley, Lucerne Valley and Johnson Valley in California, and the eastern Mojave Desert (and the Colorado Desert), including study plots at Ivanpah, Goffs, Upper Ward Valley, Chemehuevi, Chuckwalla Valley, and Chuckwalla Bench in California, and Piute Valley in Nevada and control and exclosure plots at Littlefield, Arizona.
I compiled data on precipitation from seven stations in the eastern Mojave Desert: Beaver Dam and Willow Beach in Arizona; Searchlight and the Desert National Wildlife Range in Nevada; and Blythe, Needles, and Baker in
California. I also used data from five stations in the western Mojave Desert in California: Barstow, China Lake, Mojave, Twentynine Palms, and Victorville (Earthinfo, Inc. 1989; National Oceanic and Atmospheric Administration 1989). Precipitation amounts of two 6-month periods each year were summed: winter (October-March) and summer (April-September) because tortoise behavior may be related to seasonal variation in precipitation. The summer period corresponds to the primary activity period of tortoises. Rain during the winter period is necessary for successful germination ofannual plants (Beatley 1974), and variation in forage may also affect tortoise behavior (U.S. Fish and Wildlife Service, Portland, Oregon, unpublished data). I did not include precipitation totals from any year at any station with missing data. I used Pearson product-moment correlation to compare the relative abundances of small and large tortoises with winter and summer precipitation and used the data from all surveys (first and revisits) at the 16 sites.
Results
LOWESS trend lines revealed differences between the numbers of large arid small tortoises and between study plots in the eastern Mojave Desert and the western Mojave Desert. The f for the LOWESS regression was 0.4. This was the smallest value of f that did not show any relation between the residual of RA minus the LOWESS predicted value and year (Trexler and Travis 1993) and which produced trend lines that could be interpreted. Smaller values of f produced trend lines that responded too strongly to individual data points.
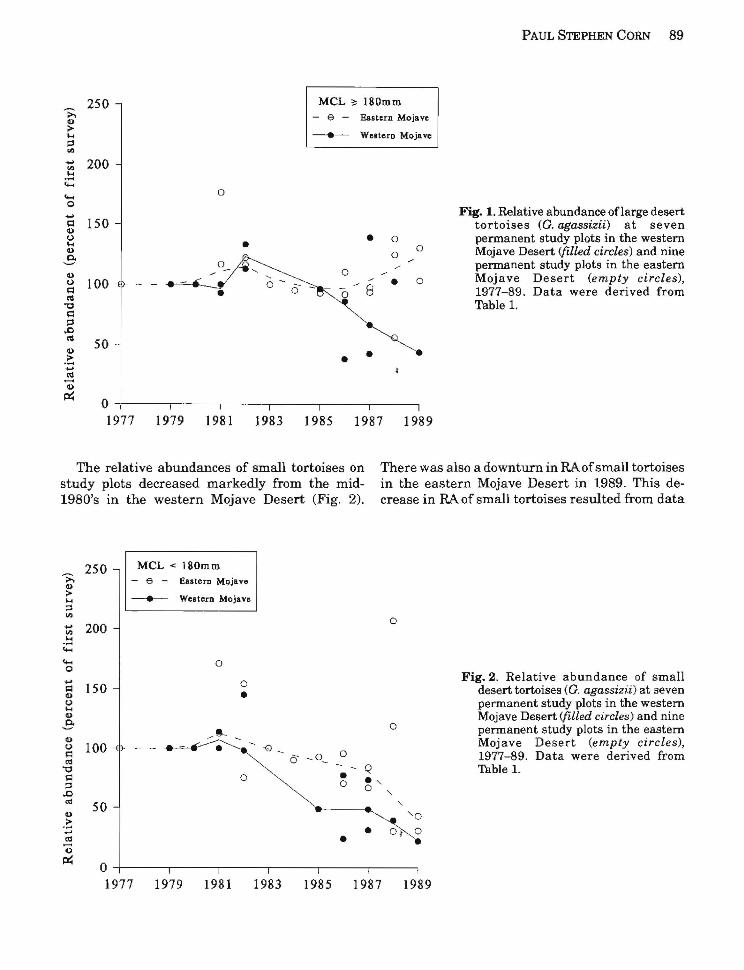
Relative abundance of large tortoises apparently declined in the western Mojave Desert during the latter 1980's, but, during the same time, RAoflarge tortoises was stable or increased in the eastern Mojave Desert (Fig. 1). The downturn in the trend in the western Mojave Desert was largely influenced by low numbers of large tortoises recorded at the DTNA Interpretive Center plot in 1989 (175 or 44% of the 402 tortoises captured in 1979).
••
90 FISH AND WILDLIFE RESEARCH 13
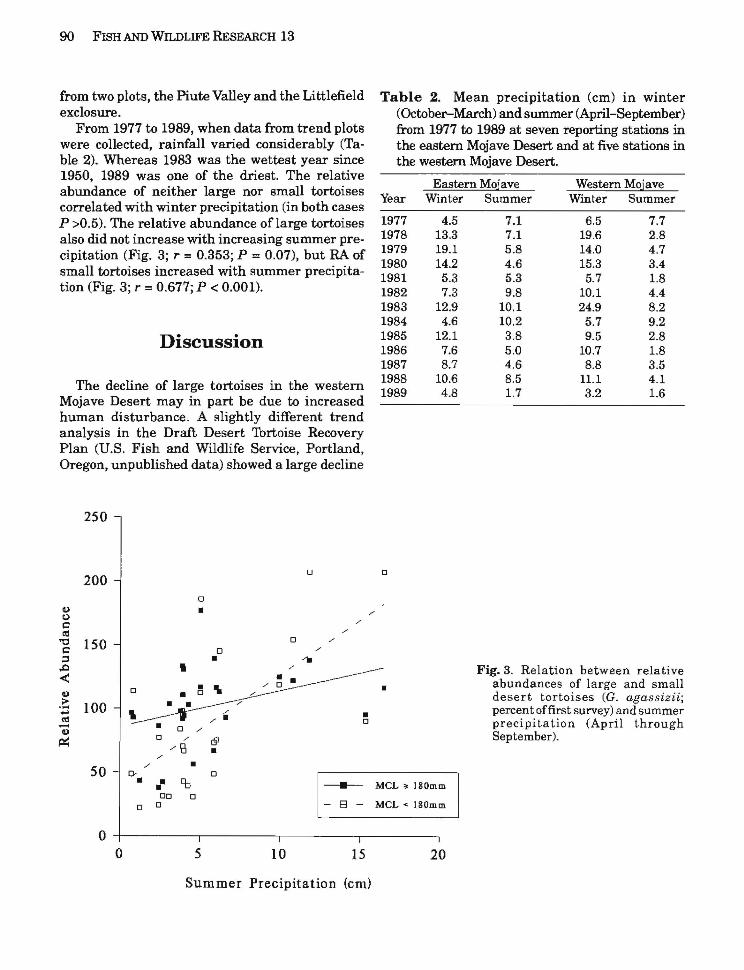
from two plots, the Piute Valley and the Littlefield Table 2. Mean precipitation (cm) in winter exclosure. (October-March) and summer (April-September)
From 1977 to 1989, when data from trend plots from 1977 to 1989 at seven reporting stations in were collected, rainfall varied considerably (Ta the eastern Mojave Desert and at five stations in ble 2). Whereas 1983 was the wettest year since the western Mojave Desert. 1950, 1989 was one of the driest. The relative
Eastern Mojave Western Mojaveabundance of neither large nor small tortoises Year Winter Summer Winter Summer
correlated with winter precipitation (in both cases P >0.5). The relative abundance oflarge tortoises 1977 4.5 7.1 6.5 7.7
1978 13.3 7.1 19.6 2.8also did not increase with increasing summer pre1979 19.1 5.8 14.0 4.7cipitation (Fig. 3; r = 0.353; P = 0.07), but RA of 1980 14.2 4.6 15.3 3.4small tortoises increased with summer precipita 1981 5.3 5.3 5.7 1.8
tion (Fig. 3; r =0.677; P < 0.001). 1982 7.3 9.8 10.1 4.4 1983 12.9 10.1 24.9 8.2 1984 4.6 10.2 5.7 9.2 1985 12.1 3.8 9.5 2.8Discussion 1986 7.6 5.0 10.7 1.8 1987 8.7 4.6 8.8 3.5 1988 10.6 8.5 11.1 4.1The decline of large tortoises in the western 1989 4.8 1.7 3.2 1.6
Mojave Desert may in part be due to increased human disturbance. A slightly different trend analysis in the Draft Desert Thrtoise Recovery Plan (U.S. Fish and Wildlife Service, Portland, Oregon, unpublished data) showed a large decline
250
0 0200
0
• /'
/'
/'
0 /'
• •0
/' -11
/'
Fig. 3. Relation between relative abundances of large and small
, 0
• • •0Q) desert tortoises (G. agassizii;
.~ 100 /' percent offirst survey) and summer. •«I0 /'
/' 0 precipitation (April through•Q) -0 /' @ September).
~ /'~ •/'
•/'
50 0- 0 ___ MCL ~ 180mm• • 9J•00 0
0 0 - 8 - MCL < 180mm
O-t--------,-----.--------,------,
o 5 10 15 20
Summer Precipitation (em)
• •
PAUL STEPHEN CORN 89
250>. II) ;> I-< ::s ... ""'" 200 .~ ..... ..... 0 ... I:l 150 II) t.) I-< II)
Co ~
II) t.) 100 ~ ~
"0 ~ ::s .c ~ 50 .::II)
... ~ ..... II)
~ 0
MCL ~ 180mm - e - Eastern Mojave
-.-- We.terD Mojave
0
• 0• 0
0 0
0"- .. 0
• 0-
0 0.-'8 •
•
1977 1979 1981 1983 1985 1987 1989
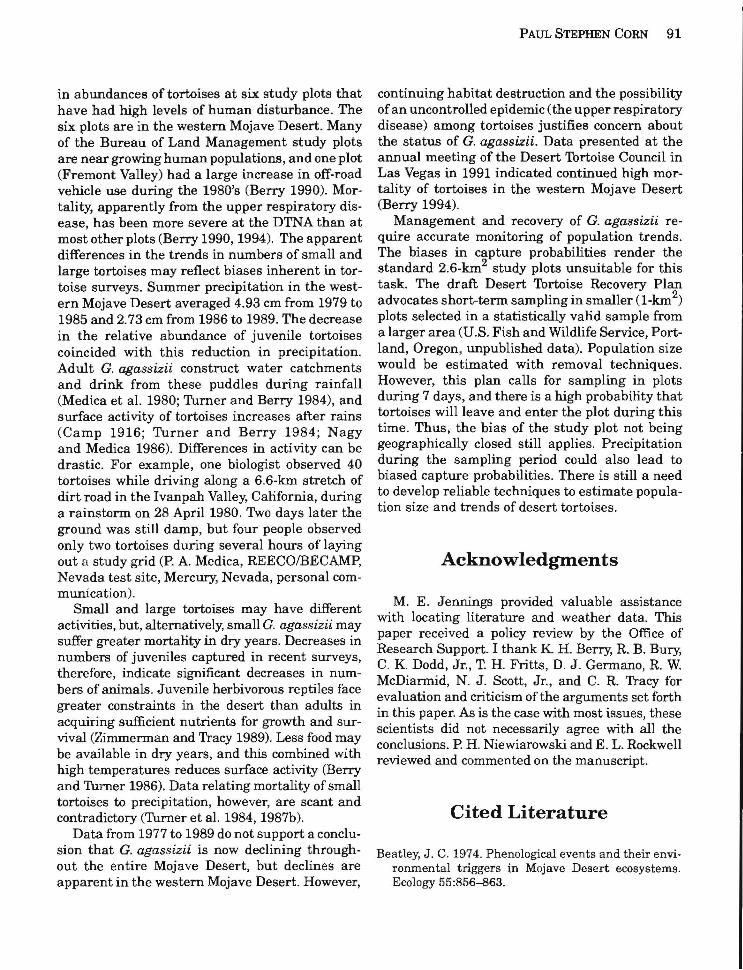
The relative abundances of small tortoises on study plots decreased markedly from the mid1980's in the western Mojave Desert (Fig. 2).
250>. II) ;> I-<
...::s '" 200 I-<'" ..... .....
..... 0 ... ~ 150 II) t.) I-< II)
..9II) t.) 100 ~ rtl
"0 ~ ::s .c cd 50 II) ;>..... .... rtl..... II)
~ 0
MCL < 180mm - e - Eastern Mojavc
-.-- Western Mojavc
0
0
•
/8
• '0_ 0
Fig. 1. Relative abundance oflarge desert tortoises (G. agCMsizii) at seven permanent study plots in the western Mojave Desert (filled circles) and nine permanent study plots in the eastern Mojave Desert (empty circles), 1977-89. Data were derived from Table 1.
There was also a downturn in RA ofsmall tortoises in the eastern Mojave Desert in 1989. This decrease in RA of small tortoises resulted from data
0
Fig. 2. Relative abundance of small desert tortoises (G. agassizii) at seven permanent study plots in the western Mojave Desert (filled circles) and nine
0 permanent study plots in the eastern Mojave Desert (empty circles),
(5 _0_ 1977-89. Data were derived from - Q Table 1.
0 •0 0." " "
"0
• • 0/ 0
1977 1979 1981 1983 1985 1987 1989
in abWldances of tortoises at six study plots that have had high levels of human disturbance. The six plots are in the western Mojave Desert. Many of the Bureau of Land Management study plots are near growing human populations, and one plot (Fremont Valley) had a large increase in off-road vehicle use during the 1980's (Berry 1990). Mortality, apparently from the upper respiratory disease, has been more severe at the DTNA than at most other plots (Berry 1990, 1994). The apparent differences in the trends in numbers of small and large tortoises may reflect biases inherent in tortoise surveys. Summer precipitation in the western Mojave Desert averaged 4.93 cm from 1979 to 1985 and 2.73 cm from 1986 to 1989. The decrease in the relative abWldance of juvenile tortoises coincided with this reduction in precipitation. Adult G. agassizii construct water catchments and drink from these puddles during rainfall (Medica et a1. 1980; Turner and Berry 1984), and surface activity of tortoises increases after rains (Camp 1916; Turner and Berry 1984; Nagy and Medica 1986). Differences in activity can be drastic. For example, one biologist observed 40 tortoises while driving along a 6.6-km stretch of dirt road in the Ivanpah Valley, California, during a rainstorm on 28 April 1980. Two days later the ground was still damp, but four people observed only two tortoises during several hours of laying out a study grid (P. A. Medica, REECOIBECAMP, Nevada test site, Mercury, Nevada, personal communication).
Small and large tortoises may have different activities, but, alternatively, small G. agassizii may suffer greater mortality in dry years. Decreases in numbers of juveniles captured in recent surveys, therefore, indicate significant decreases in numbers of animals. Juvenile herbivorous reptiles face greater constraints in the desert than adults in acquiring sufficient nutrients for growth and survival (Zimmerman and Tracy 1989). Less food may be available in dry years, and this combined with high temperatures reduces surface activity (Berry and 'llirner 1986). Data relating mortality of small tortoises to precipitation, however, are scant and contradictory (Turner et a1. 1984, 1987b).
Data from 1977 to 1989 do not support a conclusion that G. agassizii is now declining throughout the entire Mojave Desert, but declines are apparent in the western Mojave Desert. However,
PAUL STEPHEN CORN 91
continuing habitat destruction and the possibility ofan uncontrolled epidemic (the upper respiratory disease) among tortoises justifies concern about the status of G. agassizii. Data presented at the aIUlual meeting of the Desert Tortoise Council in Las Vegas in 1991 indicated continued high mortality of tortoises in the western Mojave Desert (Berry 1994).
Management and recovery of G. agassizii require accurate monitoring of population trends. The biases in capture probabilities render the standard 2.6-km2 study plots unsuitable for this task. The draft Desert Tortoise Recovery Plan advocates short-term sampling in smaller (l-km2
)
plots selected in a statistically valid sample from a larger area (U.S. Fish and Wildlife Service, Portland, Oregon, Wlpublished data). Population size would be estimated with removal techniques. However, this plan calls for sampling in plots during 7 days, and there is a high probability that tortoises will leave and enter the plot during this time. Thus, the bias of the study plot not being geographically closed still applies. Precipitation during the sampling period could also lead to biased capture probabilities. There is still a need to develop reliable techniques to estimate population size and trends of desert tortoises.
Acknowledgments
M. E. Jennings provided valuable assistance with locating literature and weather data. This paper received a policy review by the Office of Research Support. I thank K H. Berry, R. B. Bury, C. K. Dodd, Jr., T. H. Fritts, D. J. Germano, R. W. McDiarmid, N. J. Scott, Jr., and C. R. Tracy for evaluation and criticism of the arguments set forth in this paper. As is the case with most issues, these scientists did not necessarily agree with all the conclusions. P. H. Niewiarowski and E. L. Rockwell reviewed and commented on the manuscript.
Cited Literature
Beatley, J. C. 1974. Phenological events and their environmental triggers in Mojave Desert ecosystems. Ecology 55:856-863.
92 FISH AND WILDLIFE RESEARCH 13
*Berry, K H. 1990. The status of the desert tortoise in California in 1989. Draft. U.S. Bureau of Land Management, Riverside, Calif. 94 pp.
Berry, K H. 1994. Status of desert tortoise populations in California: the 1990 data set. Proceedings of the Desert Thrtoise Council. In press.
*Berry, K H., and L. L. Nicholson. 1984. A summary of human activities and their impacts on desert tortoise populations and habitat in California. Pages 61-117 in K H. Berry, editor. The status of the desert tortoise (Gopherus agassizii) in the United States. Report to U.S. Fish and Wildlife Service on Order 11310-0083-81.
Berry, K H., L. L. Nicholson, S. Juarez, and A. P. Woodman. 1990. Changes in tortoise populations at four study sites in California. Proceedings of the Desert Thrtoise Council 1986:60-80.
Berry, K H., and F. B. Thrner. 1986. Spring activities and habits of juvenile desert tortoises in California. Copeia 1986:1010-1012.
Bury, R. B., and R. W. Marlow. 1973. The desert tortoise-will it survive? National Parks Conservation Magazine 47(6):9-12.
Camp, C. L. 1916. Notes on the local distribution and habits of the amphibians and reptiles of southeastern California in the vicinity of the Turtle Mountains. University of California Publications in Zoology 12:503-544.
Carr, A. 1952. Handbook of turtles. The turtles of the United States, Canada, and Baja California. Comstock Publishing Associates, Ithaca, N.Y. 542 pp.
Cleveland, W. S. 1979. Robust locally weighted regression and smoothing scatterplots. Journal of the American Statistical Association 74:829-836.
*Duck, T. A., and J. R. Snider. 1988. An analysis of a desert tortoise population and habitat on the Beaver Dam Slope, Arizona, Littlefield. Bureau of Land Management, Arizona Strip District, St. George, Utah. 29 pp.
*Duck, T. A, and E. Schipper. 1989. An analysis of a desert tortoise population and habitat on the Beaver Dam Slope, Arizona, exclosure (draft). Bureau of Land Management, Arizona Strip District, St. George, Utah. 26 pp.
EarthInfo, Inc. 1988. Climate data, summary of the day (computer file), Western 1, Volume 1.0. EarthInfo, Inc., Boulder, Colo.
Esque, T. C., and R. B. Duncan. 1989. A population study of the desert tortoise (Gopherus agassizii) at the Sheep Mountain study plot in Nevada. Proceedings of the Desert Tortoise Council 1985:47-67.
• Asterisk denotes unpublished work.
Jaeger, E. C. 1955. On desert trails with a naturalist XIV. Hard-shelled denizens of the wasteland. Desert Magazine 18(5):19-21.
Luckenbach, R. A. 1982. Ecology and management of the desert tortoise (Gopherus agassizii) in California. Pages 1-37 in R. B. Bury, editor. North American tortoises: conservation and ecology. U.S. Fish and Wildlife Service Wildlife, Research Report 12.
Medica, P. A., R. B. Bury, and R. A. Luckenbach. 1980. Drinking and construction of water catchments by the desert tortoise in the Mojave Desert. Herpetologica 36:301-304.
Nagy, K A, and P. A Medica. 1986. Physiological ecology of desert tortoises. Herpetologica 42:73-92.
National Oceanic and Atmospheric Administration. 1989. Climatological data, Arizona, California, Nevada and Utah. Vol. 93(1). National Oceanic and Atmospheric Administration, National Climate Data Center, Asheville, N.C.
Otis, D. L., K. P. Burnham, G. C. White, and D. R. Anderson. 1978. Statistical inference from capture data on closed animal populations. Wildlife Monographs 62:1-135.
Trexler, J. C., andJ. Travis. 1993. Nontraditional regression analyses. Ecology 74:1629-1637.
*Turner, F. B., and K. H. Berry. 1984. Methods used in analyzing desert tortoise populations. Pages 593643 in K H. Berry, editor. The status of the desert tortoise (Gopherus agassizii) in the United States. Report to U.S. Fish and Wildlife Service on Order 11310-0083-81.
*Turner, F. B., K. H. Berry, D. C. Randall, and G. C. White. 1987a. Population ecology of the desert tortoise at ~ffs, California 1983-1986. Unpublished report, Southern California Edison Company. 101 pp.
'furner, F. B., P. A. Medica, and R. B. Bury. 1987b. Age-size relationships of desert tortoises in sonthern Nevada. Copeia 1987:974-979.
Turner, F. B., P. A Medica, and C. L. Lyons. 1984. Reproduction and survival of the desert tortoise in Ivanpah Valley, California. Copeia 1984:811-820.
U.S. Fish and Wildlife Service. 1990. Endangered and threatened wildlife and plants; determination of threatened status for the Mojave population ofthe desert tortoise. Federal Register 55:12178-12190.
*U.S. Fish and Wildlife Service. 1993. Draft recovery plan for the desert tortoise (Mojave population). U.S. Fish and Wildlife Service, Portland, Oreg. 170 pp. + appendixes.
White, G. C., D. R. Anderson, K. P. Burnham, and D. L. Otis. 1982. Capture-recapture and removal methods for sampling closed populations. LA-8787-NERP. Los

Alamos National Laboratory, Los Alamos, N.Mex. 235 pp.
Wilkinson, L., M. Hill, S. Miceli, G. Birkenbeuel, and E. Vang. 1992. SYSTAT for Windows: graphics. Version 5. SYSTAT Incorporated, Evanston, Ill. 636 pp.
PAUL STEPHEN CORN 93
Woodbury, A. M., and R. Hardy. 1948. Studies of the desert tortoise, Gopheru8 agassizii. Ecological Monographs 18:145-200.
Zimmerman, L. C., and C. R. Tracy. 1989. Interactions between the environment and ectothermy and herbivory in reptiles. Physiological Zoology 62:374-409.
94 FISH AND WILDLIFE RESEARCH 13
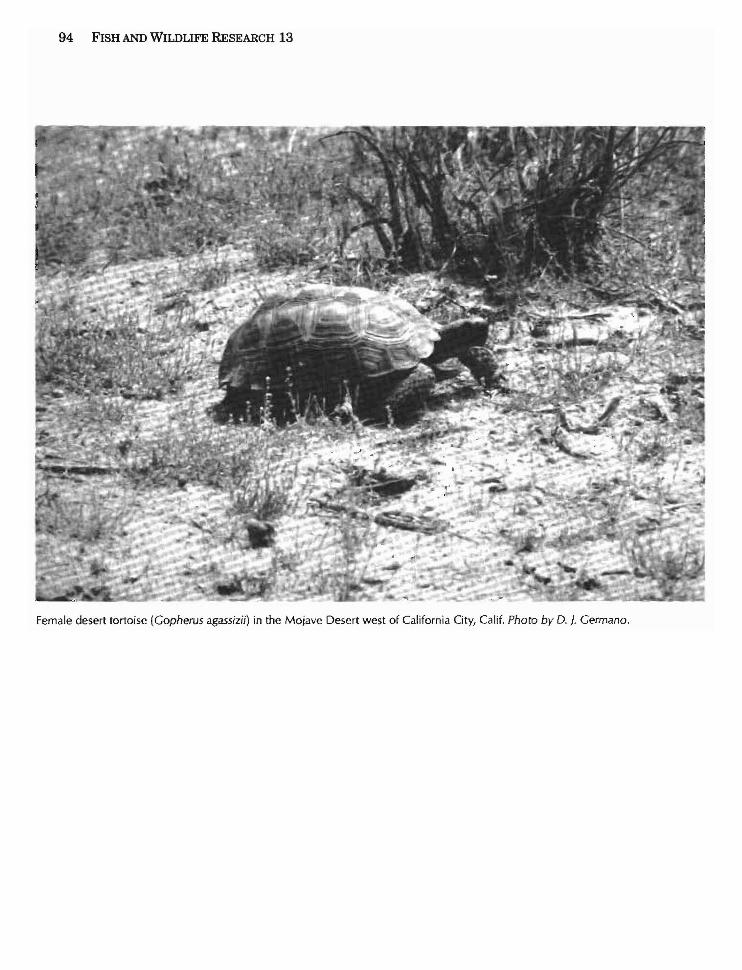
Female desert tortoise (Gopherus agassizii) in the Mojave Desert west of California City, Calif. Photo by D. j. Germano.