Recent Trends In Funding
75
2013 Indiana Governor’s Conference on Service and Nonprofit Capacity Building October 3, 2013 Indianapolis, IN Kirsten Grønbjerg, Ph.D. Patrick Rooney, Ph.D. Josette C. Rathbun, CFP, MBA Angela White, CFRE Moderator – Katie Prine
description
Transcript of Recent Trends In Funding
2013 Indiana Governor’s Conference on Service and Nonprofit Capacity Building
October 3, 2013 Indianapolis, IN
Kirsten Grønbjerg, Ph.D. Patrick Rooney, Ph.D.
Josette C. Rathbun, CFP, MBA Angela White, CFRE
Moderator – Katie Prine
Welcome to the 2013 Indiana Governor's Conference on Service and
Nonprofit Capacity Building!
October 3, 2013
IU LILLY FAMILY SCHOOL OF PHILANTHROPY Improving Philanthropy to Improve the World
Phi • lan • thro • py (n.)
“voluntary action for the public good”
~ Robert Payton
IU LILLY FAMILY SCHOOL OF PHILANTHROPY Improving Philanthropy to Improve the World
Introductions • Kirsten A. Grønbjerg, Efroymson Chair in
Philanthropy, Professor of Public and Environmental Affairs at Indiana University, Bloomington
• Patrick Rooney, Associate Dean for Academic
Affairs and Research at the IU Lilly Family School of Philanthropy
• Josette C. Rathbun, CFP, MBA, First Vice
President-Wealth Management at Merrill Lynch • Angela White, CFRE, Senior Consultant and
CEO at Johnson, Grossnickle, and Associates
IU LILLY FAMILY SCHOOL OF PHILANTHROPY Improving Philanthropy to Improve the World
Nonprofit Employment, Revenues and Funding Streams
Kirsten A. Grønbjerg Efroymson Chair in Philanthropy
Professor of Philanthropic Studies Professor of Nonprofit Management
School of Public & Environmental Affairs Indiana University Bloomington
Overview
• Trends in the Indiana nonprofit sector • Importance of philanthropic funding • Current state of giving
IU LILLY FAMILY SCHOOL OF PHILANTHROPY Improving Philanthropy to Improve the World
Indiana Nonprofit Sector: Trends
www.indiana.edu/~nonprof
IU LILLY FAMILY SCHOOL OF PHILANTHROPY Improving Philanthropy to Improve the World
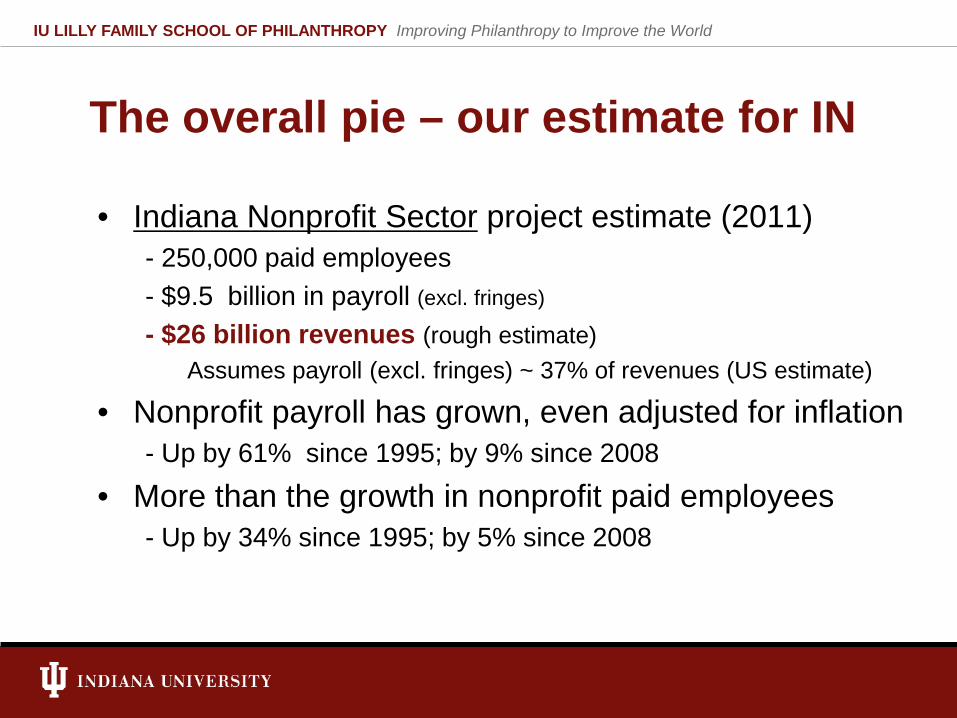
The overall pie – our estimate for IN
• Indiana Nonprofit Sector project estimate (2011) - 250,000 paid employees - $9.5 billion in payroll (excl. fringes)
- $26 billion revenues (rough estimate) Assumes payroll (excl. fringes) ~ 37% of revenues (US estimate)
• Nonprofit payroll has grown, even adjusted for inflation - Up by 61% since 1995; by 9% since 2008
• More than the growth in nonprofit paid employees - Up by 34% since 1995; by 5% since 2008
IU LILLY FAMILY SCHOOL OF PHILANTHROPY Improving Philanthropy to Improve the World
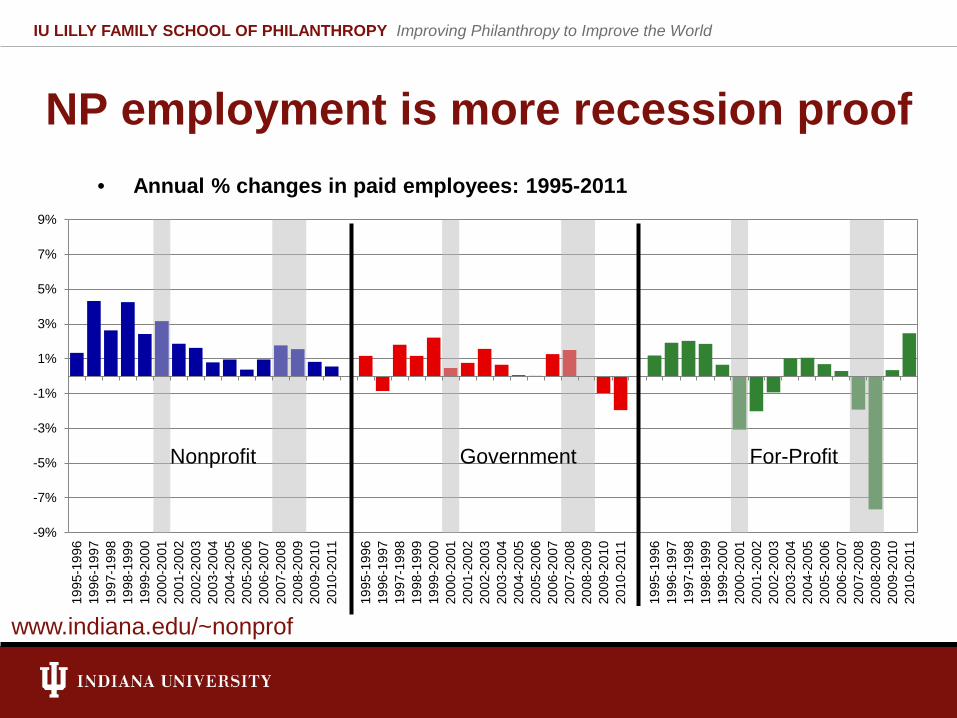
NP employment is more recession proof • Annual % changes in paid employees: 1995-2011
-9%
-7%
-5%
-3%
-1%
1%
3%
5%
7%
9%
1995
-199
619
96-1
997
1997
-199
819
98-1
999
1999
-200
020
00-2
001
2001
-200
220
02-2
003
2003
-200
420
04-2
005
2005
-200
620
06-2
007
2007
-200
820
08-2
009
2009
-201
020
10-2
011
1995
-199
619
96-1
997
1997
-199
819
98-1
999
1999
-200
020
00-2
001
2001
-200
220
02-2
003
2003
-200
420
04-2
005
2005
-200
620
06-2
007
2007
-200
820
08-2
009
2009
-201
020
10-2
011
1995
-199
619
96-1
997
1997
-199
819
98-1
999
1999
-200
020
00-2
001
2001
-200
220
02-2
003
2003
-200
420
04-2
005
2005
-200
620
06-2
007
2007
-200
820
08-2
009
2009
-201
020
10-2
011
Nonprofit Government For-Profit
www.indiana.edu/~nonprof
IU LILLY FAMILY SCHOOL OF PHILANTHROPY Improving Philanthropy to Improve the World
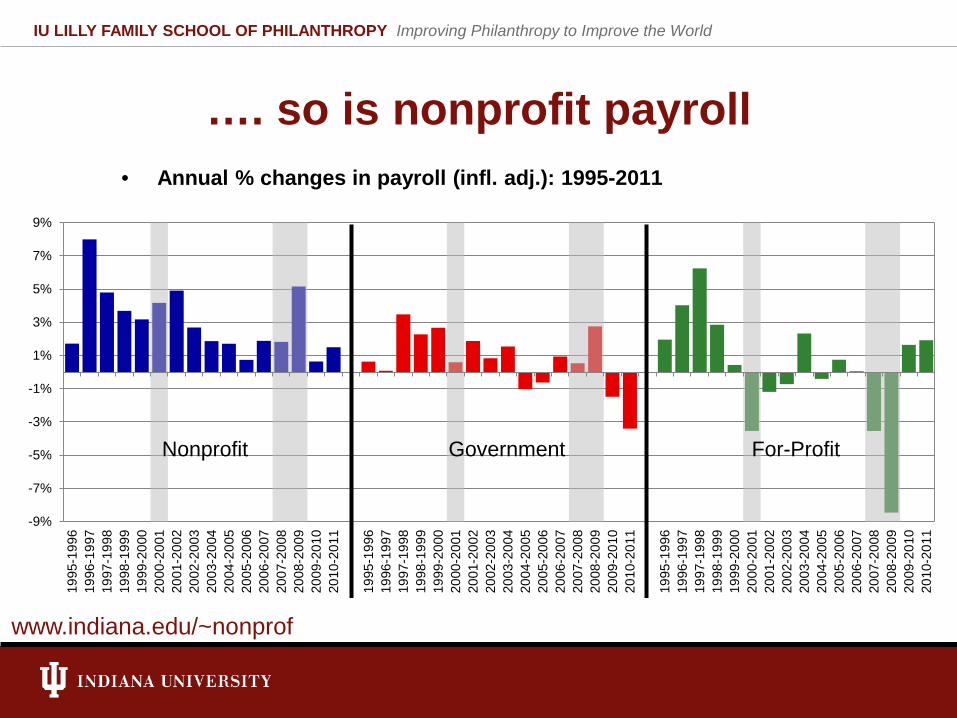
…. so is nonprofit payroll • Annual % changes in payroll (infl. adj.): 1995-2011
-9%
-7%
-5%
-3%
-1%
1%
3%
5%
7%
9%
1995
-199
619
96-1
997
1997
-199
819
98-1
999
1999
-200
020
00-2
001
2001
-200
220
02-2
003
2003
-200
420
04-2
005
2005
-200
620
06-2
007
2007
-200
820
08-2
009
2009
-201
020
10-2
011
1995
-199
619
96-1
997
1997
-199
819
98-1
999
1999
-200
020
00-2
001
2001
-200
220
02-2
003
2003
-200
420
04-2
005
2005
-200
620
06-2
007
2007
-200
820
08-2
009
2009
-201
020
10-2
011
1995
-199
619
96-1
997
1997
-199
819
98-1
999
1999
-200
020
00-2
001
2001
-200
220
02-2
003
2003
-200
420
04-2
005
2005
-200
620
06-2
007
2007
-200
820
08-2
009
2009
-201
020
10-2
011
Nonprofit Government For-Profit
www.indiana.edu/~nonprof
IU LILLY FAMILY SCHOOL OF PHILANTHROPY Improving Philanthropy to Improve the World
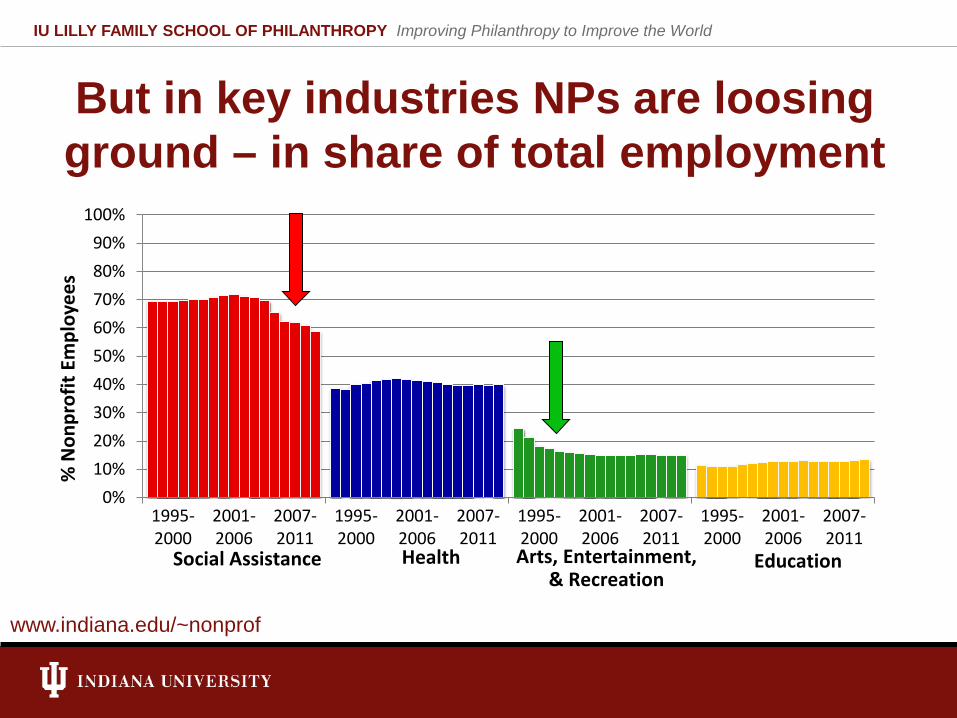
But in key industries NPs are loosing ground – in share of total employment
0%10%20%30%40%50%60%70%80%90%
100%
1995-2000
2001-2006
2007-2011
1995-2000
2001-2006
2007-2011
1995-2000
2001-2006
2007-2011
1995-2000
2001-2006
2007-2011
% N
onpr
ofit
Empl
oyee
s
Social Assistance Health Arts, Entertainment, & Recreation
Education
www.indiana.edu/~nonprof
IU LILLY FAMILY SCHOOL OF PHILANTHROPY Improving Philanthropy to Improve the World
0%
10%
20%
30%
40%
50%
60%
70%
80%
90%
100%
1995-2000
2001-2006
2007-2011
1995-2000
2001-2006
2007-2011
1995-2000
2001-2006
2007-2011
1995-2000
2001-2006
2007-2011
% N
onpr
ofit
Payr
oll
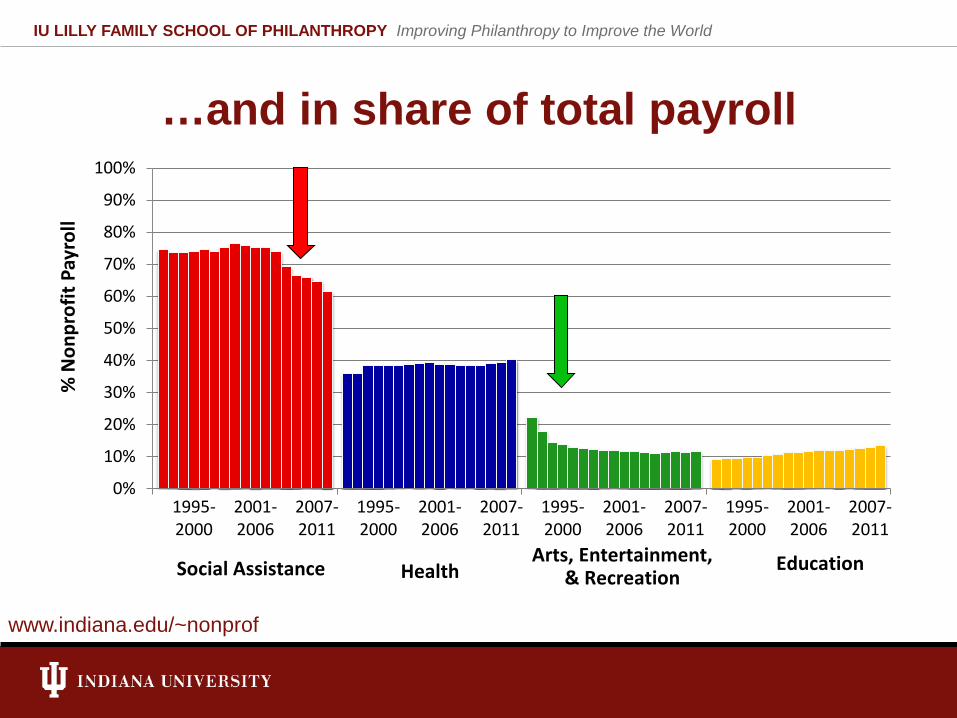
Social Assistance Health Arts, Entertainment,
& Recreation Education
…and in share of total payroll
www.indiana.edu/~nonprof
IU LILLY FAMILY SCHOOL OF PHILANTHROPY Improving Philanthropy to Improve the World
-7%
-6%
-5%
-4%
-3%
-2%
-1%
0%
1%
2%
3%
4%
5%
6%
7%
1995
-199
619
96-1
997
1997
-199
819
98-1
999
1999
-200
020
00-2
001
2001
-200
220
02-2
003
2003
-200
420
04-2
005
2005
-200
620
06-2
007
2007
-200
820
08-2
009
2009
-201
020
10-2
011
1995
-199
619
96-1
997
1997
-199
819
98-1
999
1999
-200
020
00-2
001
2001
-200
220
02-2
003
2003
-200
420
04-2
005
2005
-200
620
06-2
007
2007
-200
820
08-2
009
2009
-201
020
10-2
011
1995
-199
619
96-1
997
1997
-199
819
98-1
999
1999
-200
020
00-2
001
2001
-200
220
02-2
003
2003
-200
420
04-2
005
2005
-200
620
06-2
007
2007
-200
820
08-2
009
2009
-201
020
10-2
011
1995
-199
619
96-1
997
1997
-199
819
98-1
999
1999
-200
020
00-2
001
2001
-200
220
02-2
003
2003
-200
420
04-2
005
2005
-200
620
06-2
007
2007
-200
820
08-2
009
2009
-201
020
10-2
011
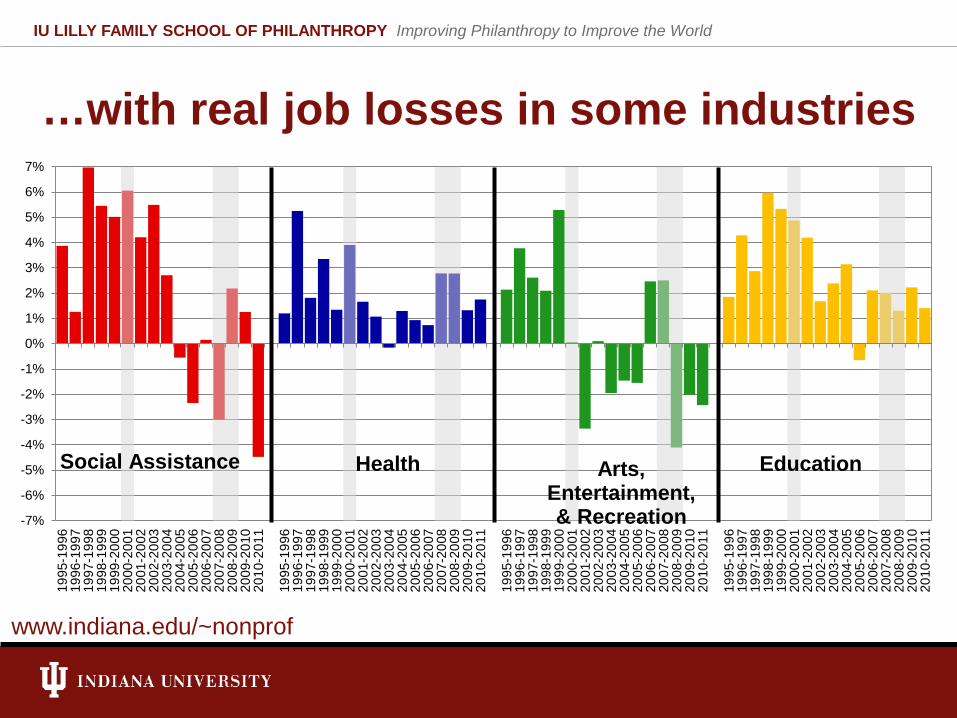
Social Assistance Health Arts, Entertainment, & Recreation
Education
…with real job losses in some industries
www.indiana.edu/~nonprof
IU LILLY FAMILY SCHOOL OF PHILANTHROPY Improving Philanthropy to Improve the World
-7%
-6%
-5%
-4%
-3%
-2%
-1%
0%
1%
2%
3%
4%
5%
6%
7%
1995
-199
619
96-1
997
1997
-199
819
98-1
999
1999
-200
020
00-2
001
2001
-200
220
02-2
003
2003
-200
420
04-2
005
2005
-200
620
06-2
007
2007
-200
820
08-2
009
2009
-201
020
10-2
011
1995
-199
619
96-1
997
1997
-199
819
98-1
999
1999
-200
020
00-2
001
2001
-200
220
02-2
003
2003
-200
420
04-2
005
2005
-200
620
06-2
007
2007
-200
820
08-2
009
2009
-201
020
10-2
011
1995
-199
619
96-1
997
1997
-199
819
98-1
999
1999
-200
020
00-2
001
2001
-200
220
02-2
003
2003
-200
420
04-2
005
2005
-200
620
06-2
007
2007
-200
820
08-2
009
2009
-201
020
10-2
011
1995
-199
619
96-1
997
1997
-199
819
98-1
999
1999
-200
020
00-2
001
2001
-200
220
02-2
003
2003
-200
420
04-2
005
2005
-200
620
06-2
007
2007
-200
820
08-2
009
2009
-201
020
10-2
011
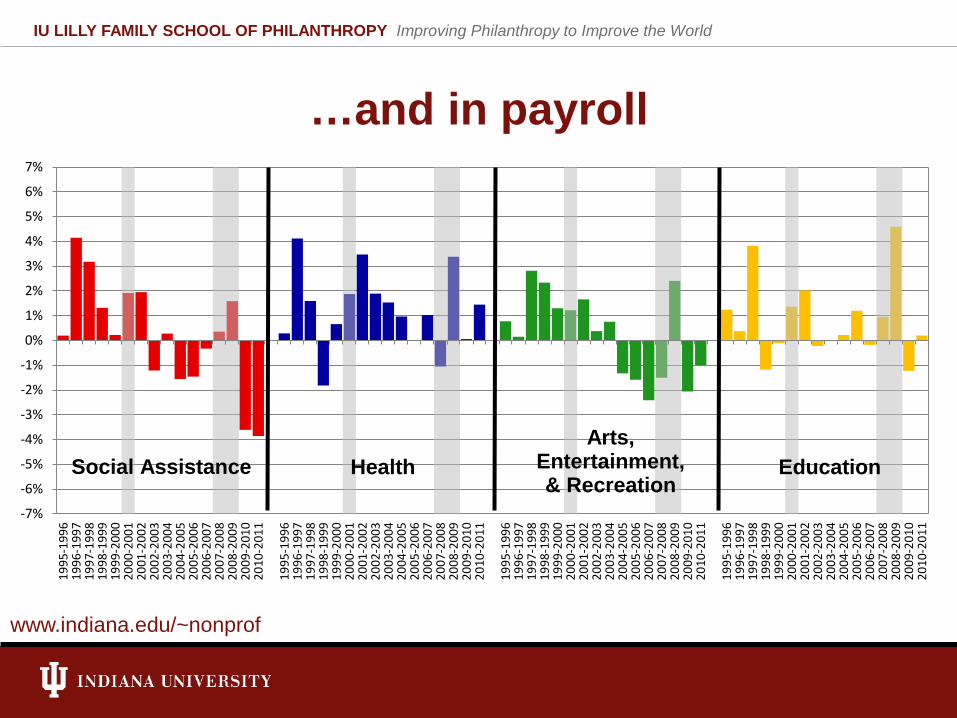
Social Assistance Health Arts, Entertainment,
& Recreation Education
…and in payroll
www.indiana.edu/~nonprof
IU LILLY FAMILY SCHOOL OF PHILANTHROPY Improving Philanthropy to Improve the World
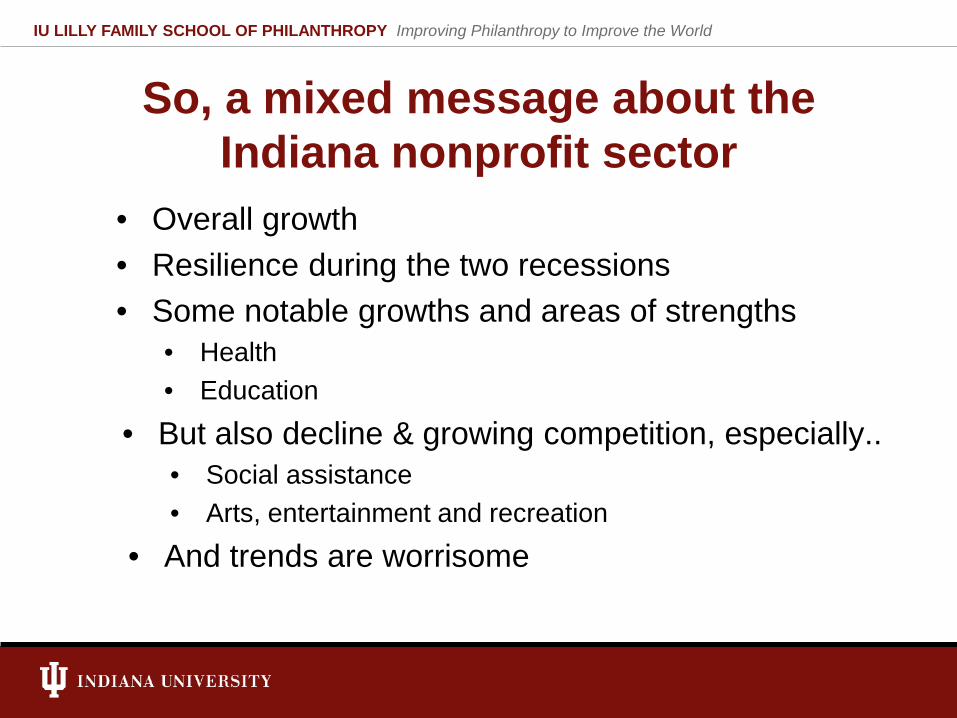
So, a mixed message about the Indiana nonprofit sector
• Overall growth • Resilience during the two recessions • Some notable growths and areas of strengths
• Health • Education
• But also decline & growing competition, especially.. • Social assistance • Arts, entertainment and recreation
• And trends are worrisome
IU LILLY FAMILY SCHOOL OF PHILANTHROPY Improving Philanthropy to Improve the World
Importance of Philanthropic Funding
IU LILLY FAMILY SCHOOL OF PHILANTHROPY Improving Philanthropy to Improve the World
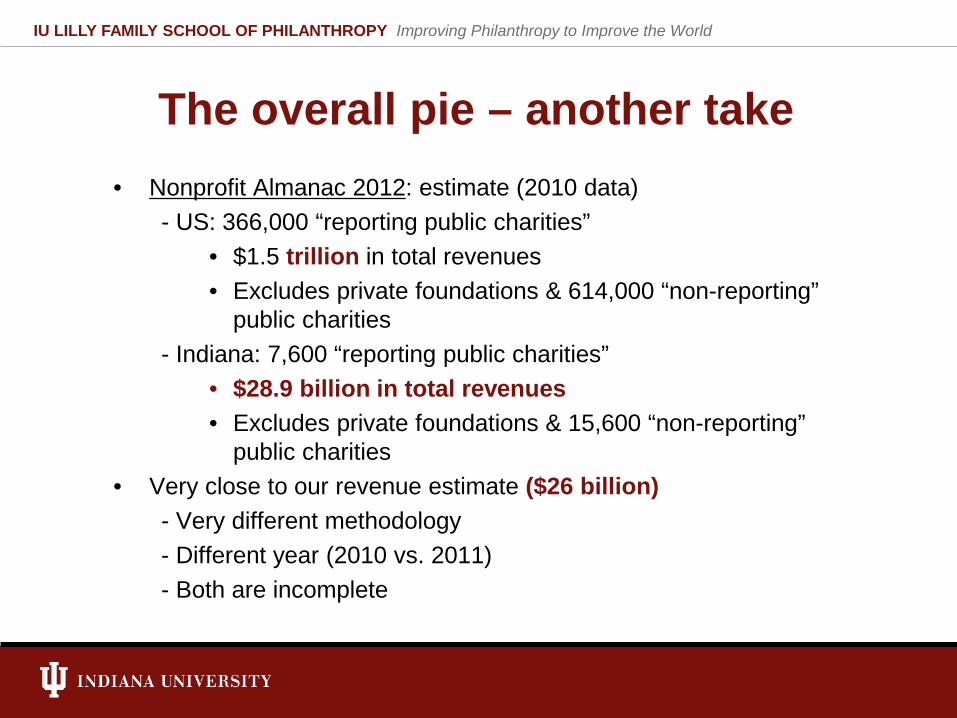
The overall pie – another take • Nonprofit Almanac 2012: estimate (2010 data)
- US: 366,000 “reporting public charities” • $1.5 trillion in total revenues • Excludes private foundations & 614,000 “non-reporting”
public charities - Indiana: 7,600 “reporting public charities”
• $28.9 billion in total revenues • Excludes private foundations & 15,600 “non-reporting”
public charities • Very close to our revenue estimate ($26 billion)
- Very different methodology - Different year (2010 vs. 2011) - Both are incomplete
IU LILLY FAMILY SCHOOL OF PHILANTHROPY Improving Philanthropy to Improve the World
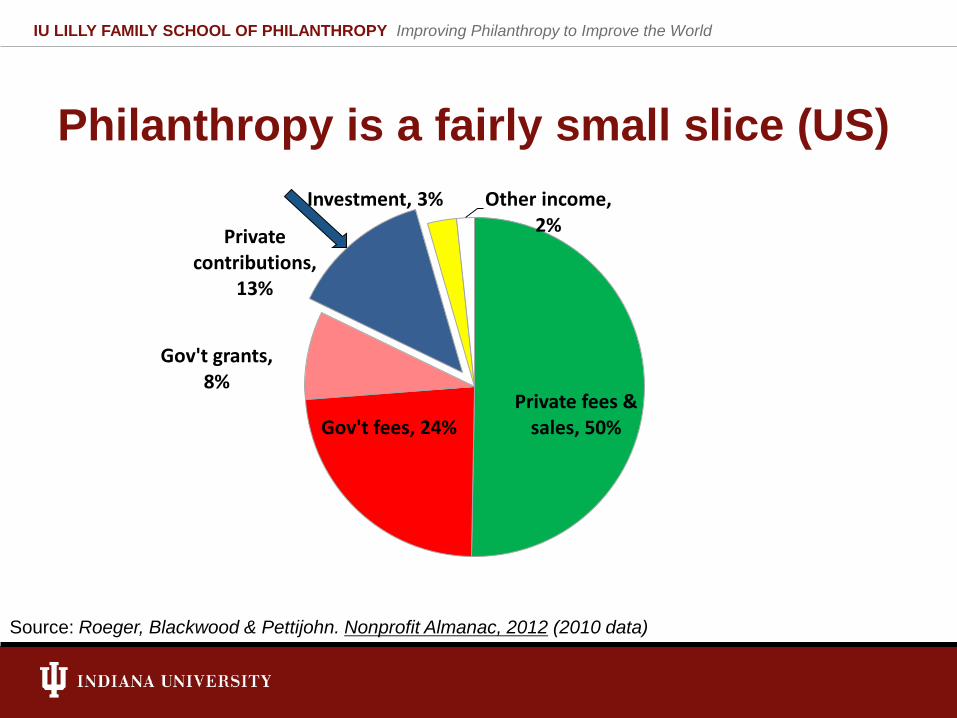
Philanthropy is a fairly small slice (US)
Private fees & sales, 50% Gov't fees, 24%
Gov't grants, 8%
Private contributions,
13%
Investment, 3% Other income, 2%
Source: Roeger, Blackwood & Pettijohn. Nonprofit Almanac, 2012 (2010 data)
IU LILLY FAMILY SCHOOL OF PHILANTHROPY Improving Philanthropy to Improve the World
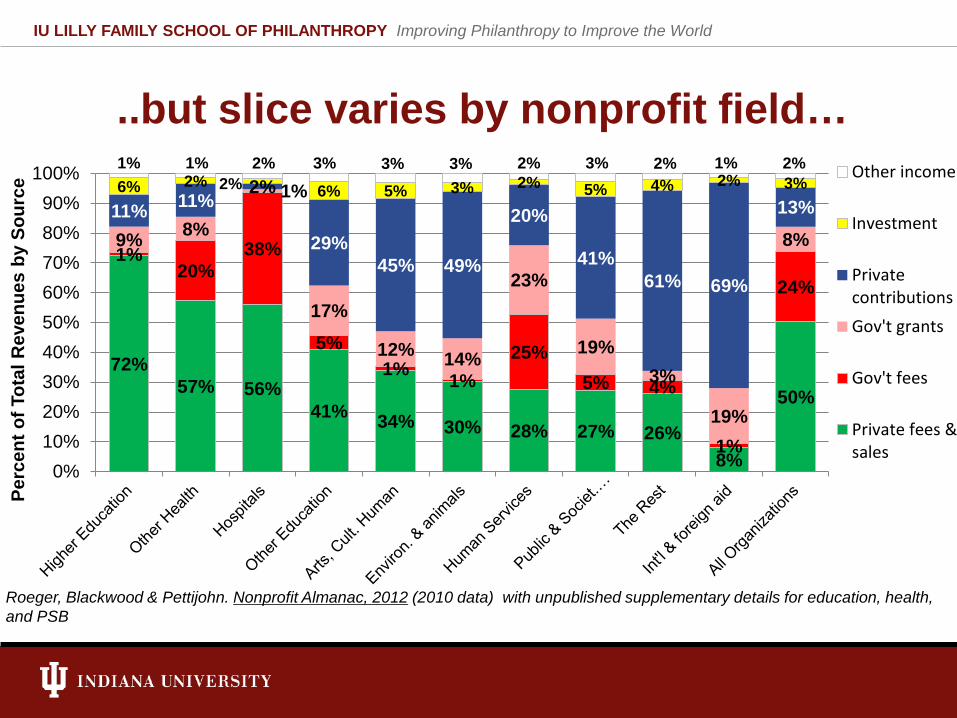
..but slice varies by nonprofit field…
72% 57% 56%
41% 34% 30% 28% 27% 26% 8%
50%
1% 20%
38%
5% 1% 1%
25% 5% 4%
1%
24%
9% 8%
1%
17%
12% 14%
23%
19% 3%
19%
8% 11% 11%
2%
29% 45% 49%
20%
41% 61% 69%
13% 6% 2% 2% 6% 5% 3% 2% 5% 4% 2% 3% 1% 1% 2% 3% 3% 3% 2% 3% 2% 1% 2%
0%10%20%30%40%50%60%70%80%90%
100%
Perc
ent o
f Tot
al R
even
ues
by S
ourc
e Other income
Investment
PrivatecontributionsGov't grants
Gov't fees
Private fees &sales
Roeger, Blackwood & Pettijohn. Nonprofit Almanac, 2012 (2010 data) with unpublished supplementary details for education, health, and PSB
IU LILLY FAMILY SCHOOL OF PHILANTHROPY Improving Philanthropy to Improve the World
Current State of Philanthropy
IU LILLY FAMILY SCHOOL OF PHILANTHROPY Improving Philanthropy to Improve the World
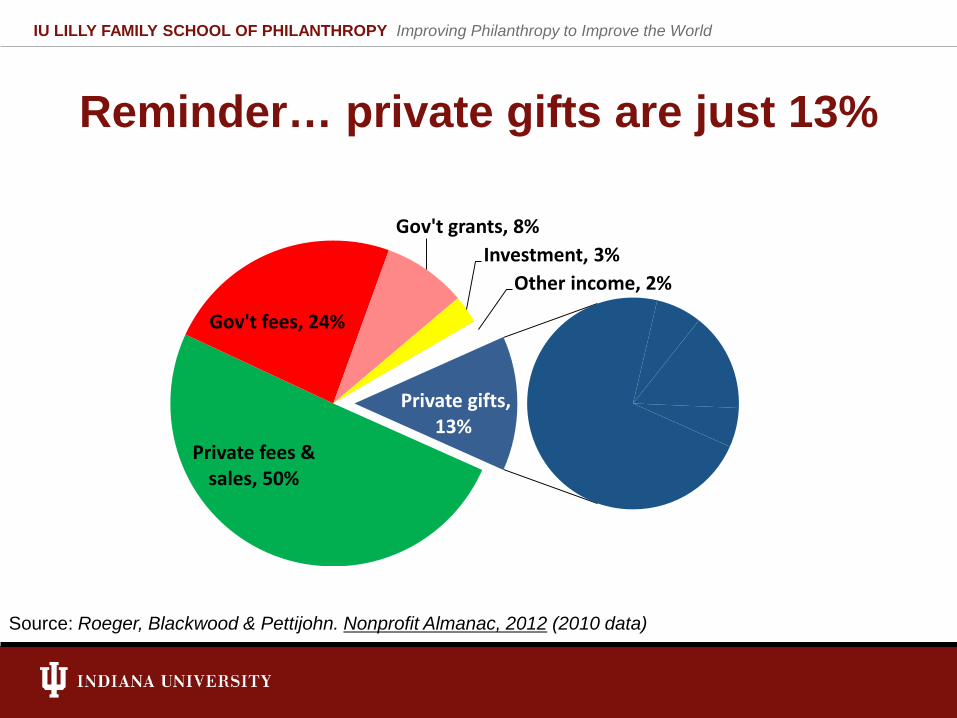
Reminder… private gifts are just 13%
Private fees & sales, 50%
Gov't fees, 24%
Gov't grants, 8% Investment, 3%
Other income, 2%
Private gifts, 13%
Source: Roeger, Blackwood & Pettijohn. Nonprofit Almanac, 2012 (2010 data)
IU LILLY FAMILY SCHOOL OF PHILANTHROPY Improving Philanthropy to Improve the World
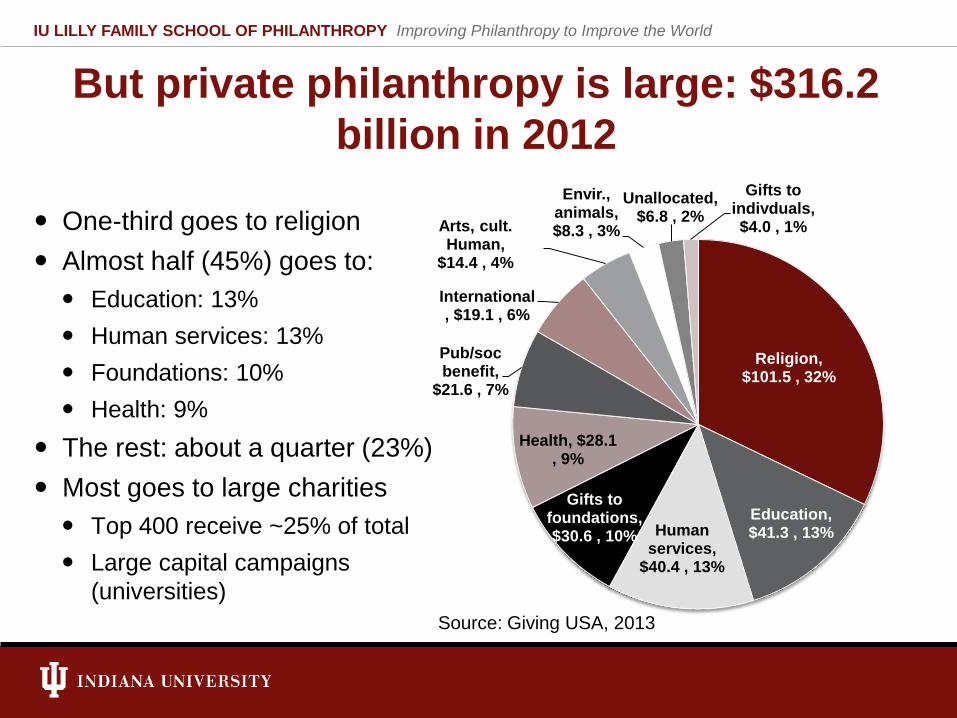
But private philanthropy is large: $316.2 billion in 2012
One-third goes to religion Almost half (45%) goes to: Education: 13% Human services: 13% Foundations: 10% Health: 9%
The rest: about a quarter (23%) Most goes to large charities Top 400 receive ~25% of total Large capital campaigns
(universities)
Religion, $101.5 , 32%
Education, $41.3 , 13% Human
services, $40.4 , 13%
Gifts to foundations, $30.6 , 10%
Health, $28.1 , 9%
Pub/soc benefit,
$21.6 , 7%
International, $19.1 , 6%
Arts, cult. Human,
$14.4 , 4%
Envir., animals, $8.3 , 3%
Unallocated, $6.8 , 2%
Gifts to indivduals, $4.0 , 1%
Source: Giving USA, 2013
IU LILLY FAMILY SCHOOL OF PHILANTHROPY Improving Philanthropy to Improve the World
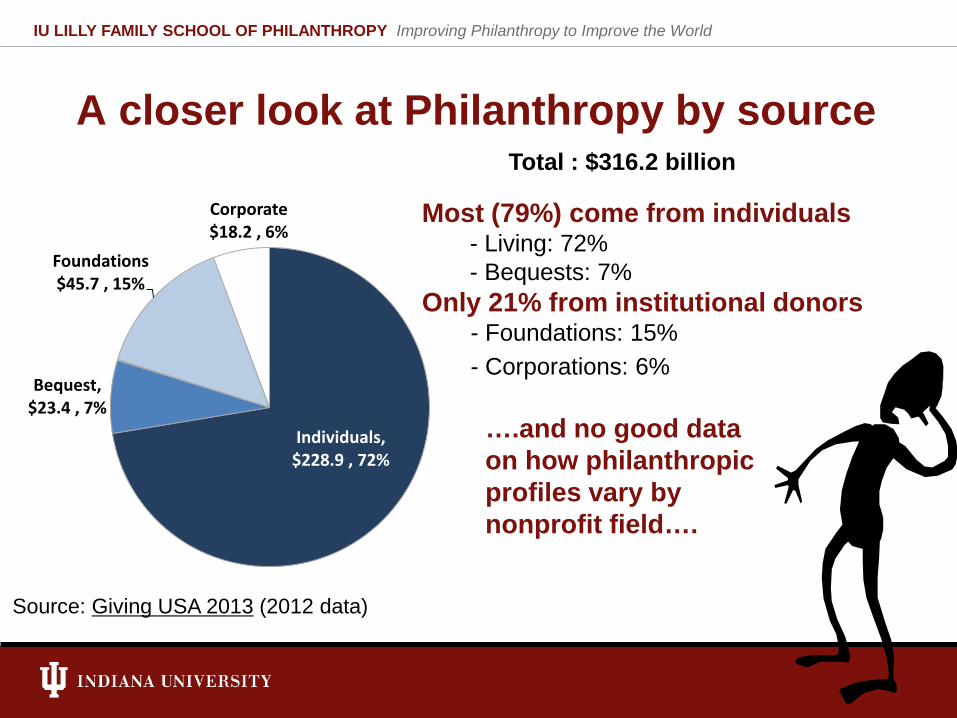
A closer look at Philanthropy by source
Individuals, $228.9 , 72%
Bequest, $23.4 , 7%
Foundations$45.7 , 15%
Corporate $18.2 , 6%
Total : $316.2 billion
Source: Giving USA 2013 (2012 data)
….and no good data on how philanthropic profiles vary by nonprofit field….
Most (79%) come from individuals - Living: 72% - Bequests: 7%
Only 21% from institutional donors - Foundations: 15% - Corporations: 6%
IU LILLY FAMILY SCHOOL OF PHILANTHROPY Improving Philanthropy to Improve the World
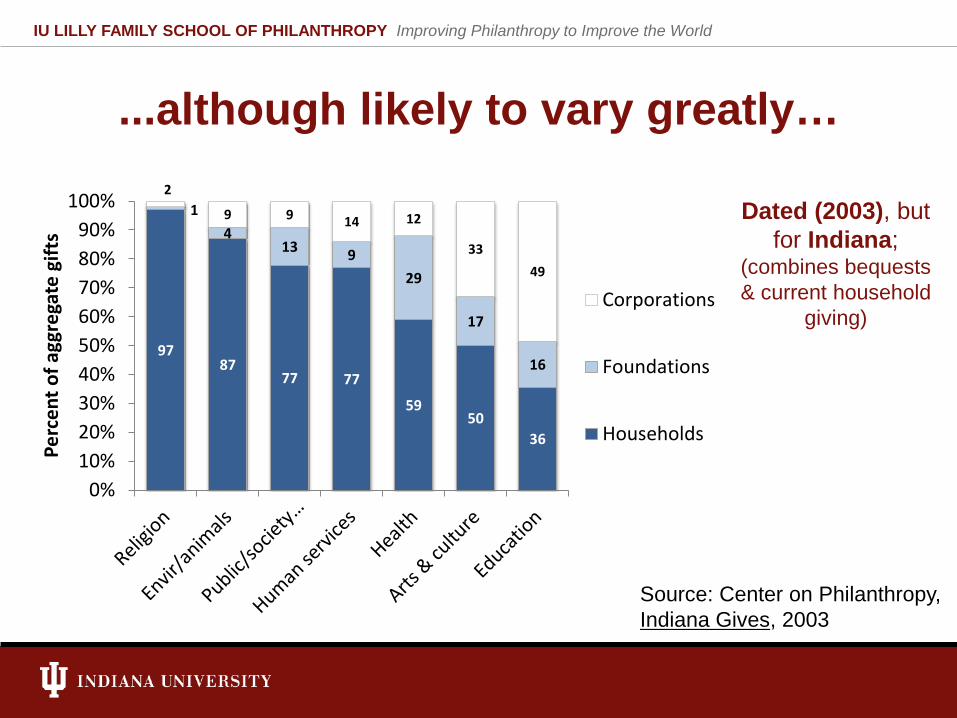
...although likely to vary greatly…
97 87
77 77
59 50
36
1 4
13 9 29
17
16
2
9 9 14 12
33 49
0%10%20%30%40%50%60%70%80%90%
100%
Perc
ent o
f agg
rega
te g
ifts
Corporations
Foundations
Households
Dated (2003), but for Indiana;
(combines bequests & current household
giving)
Source: Center on Philanthropy, Indiana Gives, 2003
IU LILLY FAMILY SCHOOL OF PHILANTHROPY Improving Philanthropy to Improve the World
The Role of Universities in The Growth of The Nonprofit Sector
Patrick Rooney Associate Dean for Academic Affairs and Research
Lilly Family School of Philanthropy at Indiana University
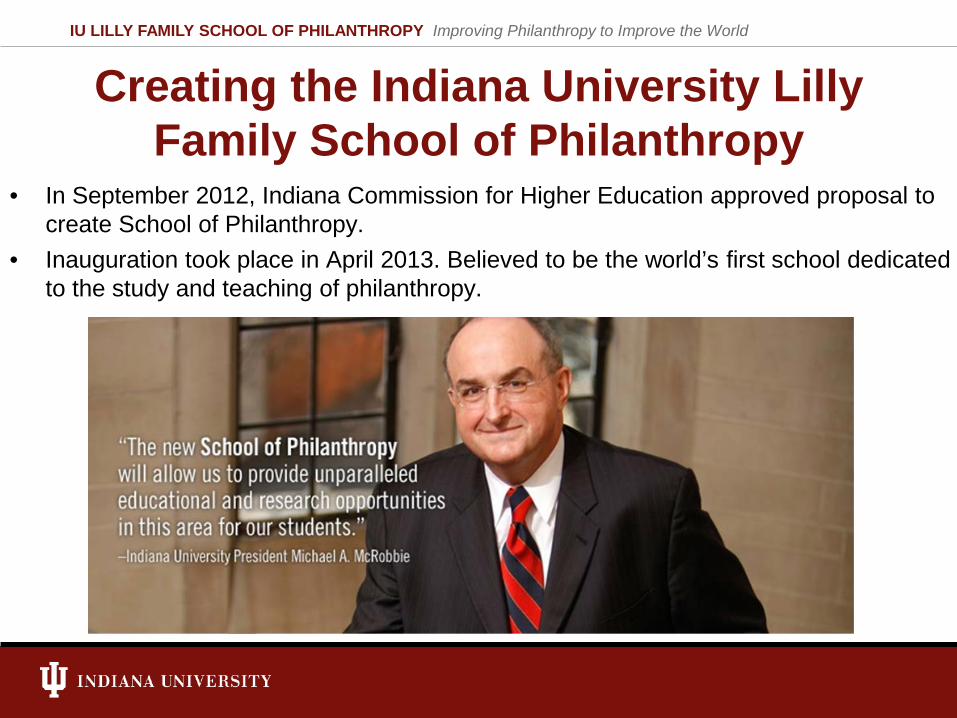
Creating the Indiana University Lilly Family School of Philanthropy
• In September 2012, Indiana Commission for Higher Education approved proposal to create School of Philanthropy.
• Inauguration took place in April 2013. Believed to be the world’s first school dedicated to the study and teaching of philanthropy.
IU LILLY FAMILY SCHOOL OF PHILANTHROPY Improving Philanthropy to Improve the World
Goals of the Lilly Family School
• Attract more top students to choose careers in philanthropy. • Prepare current and aspiring philanthropy and nonprofit
professionals with the knowledge to be thoughtful and innovative leaders.
• Educate new generations of scholars in a field whose importance is growing rapidly in all aspects of society.
• Draw on expansive network of faculty and programs focused on philanthropy and nonprofits.
• Expand and enhance actionable research for the sector. • Raise awareness and visibility of philanthropy and nonprofit sector. • Improve philanthropy to help you improve the world.
IU LILLY FAMILY SCHOOL OF PHILANTHROPY Improving Philanthropy to Improve the World
About the Lilly Family School
• Currently 12 core faculty + 40 affiliate faculty in 20+ fields
Strategic partnerships with SPEA ‘s Nonprofit Management programs at both IUPUI and IUB, as well as Liberal Arts
• Core program areas
Academic Programs
The Fund Raising School (TFRS)
Lake Institute on Faith & Giving
Women’s Philanthropy Institute
Research
IU LILLY FAMILY SCHOOL OF PHILANTHROPY Improving Philanthropy to Improve the World
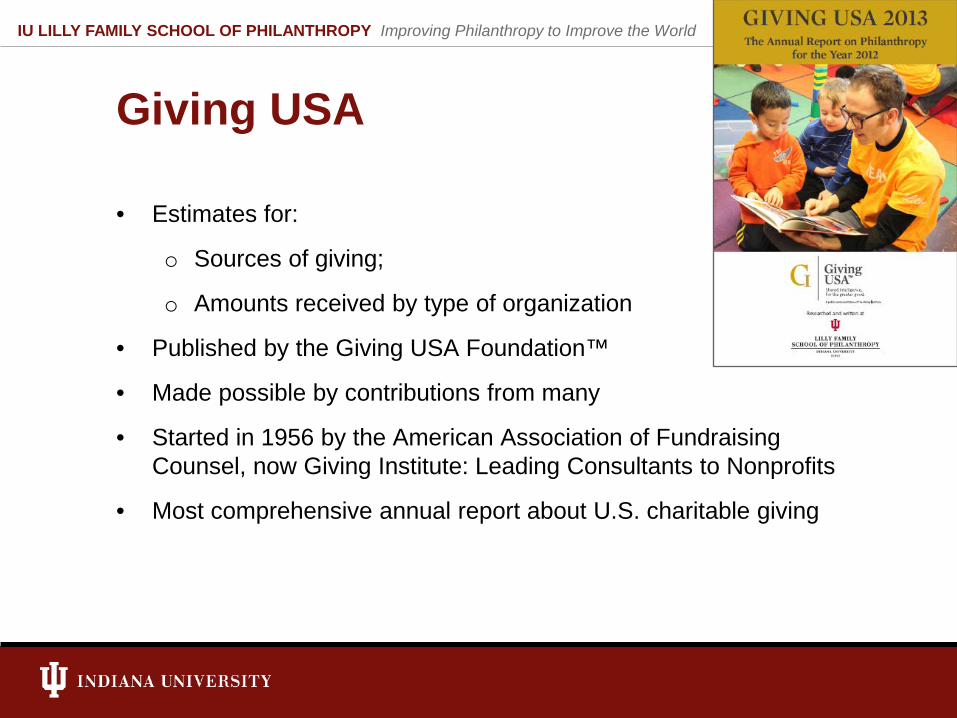
Giving USA
• Estimates for:
o Sources of giving;
o Amounts received by type of organization
• Published by the Giving USA Foundation™
• Made possible by contributions from many
• Started in 1956 by the American Association of Fundraising Counsel, now Giving Institute: Leading Consultants to Nonprofits
• Most comprehensive annual report about U.S. charitable giving
IU LILLY FAMILY SCHOOL OF PHILANTHROPY Improving Philanthropy to Improve the World
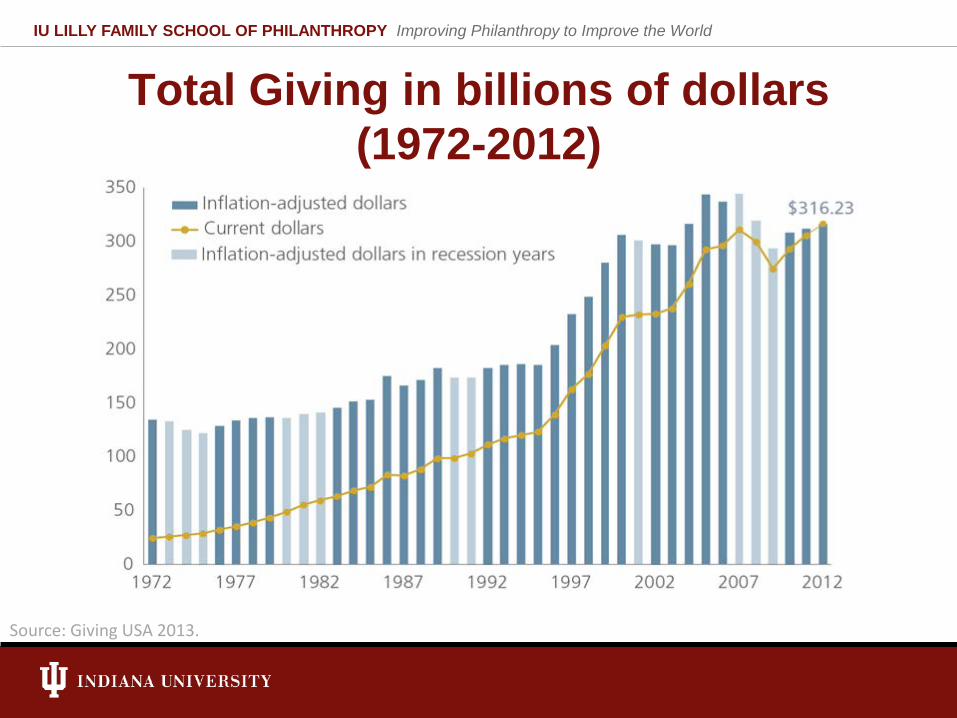
Total Giving in billions of dollars (1972-2012)
Source: Giving USA 2013.
IU LILLY FAMILY SCHOOL OF PHILANTHROPY Improving Philanthropy to Improve the World
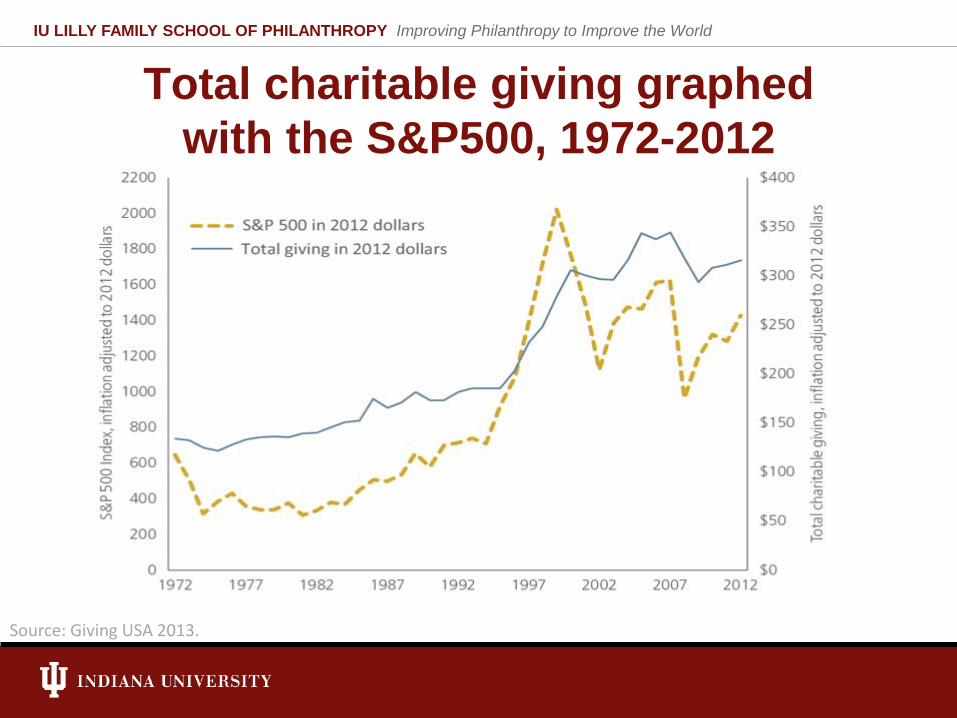
Total charitable giving graphed with the S&P500, 1972-2012
Source: Giving USA 2013.
IU LILLY FAMILY SCHOOL OF PHILANTHROPY Improving Philanthropy to Improve the World
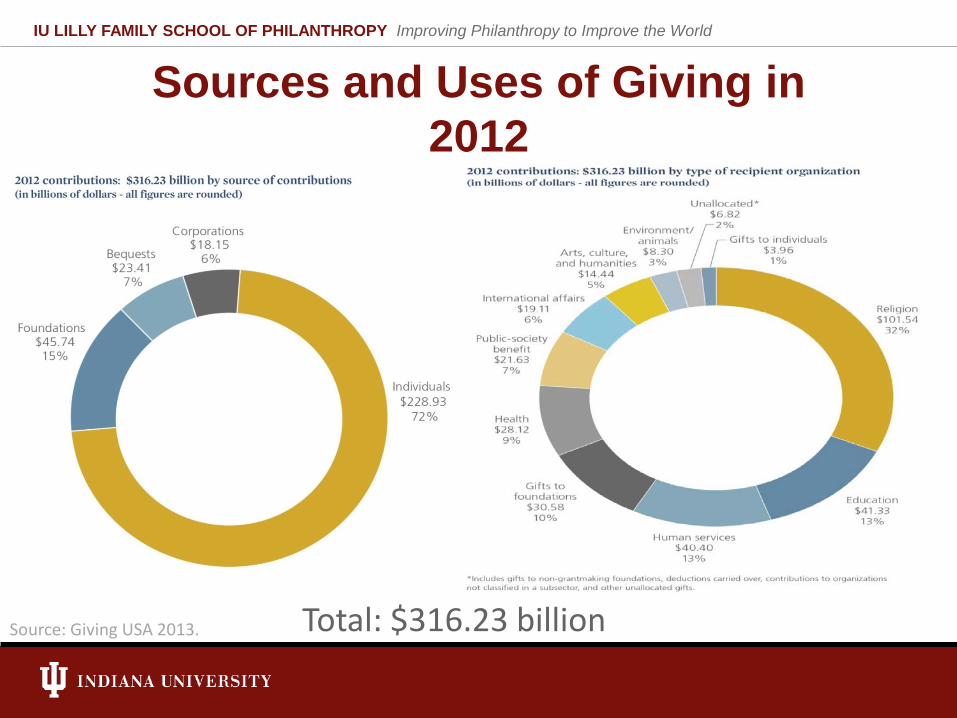
Sources and Uses of Giving in 2012
Total: $316.23 billion Source: Giving USA 2013.
IU LILLY FAMILY SCHOOL OF PHILANTHROPY Improving Philanthropy to Improve the World
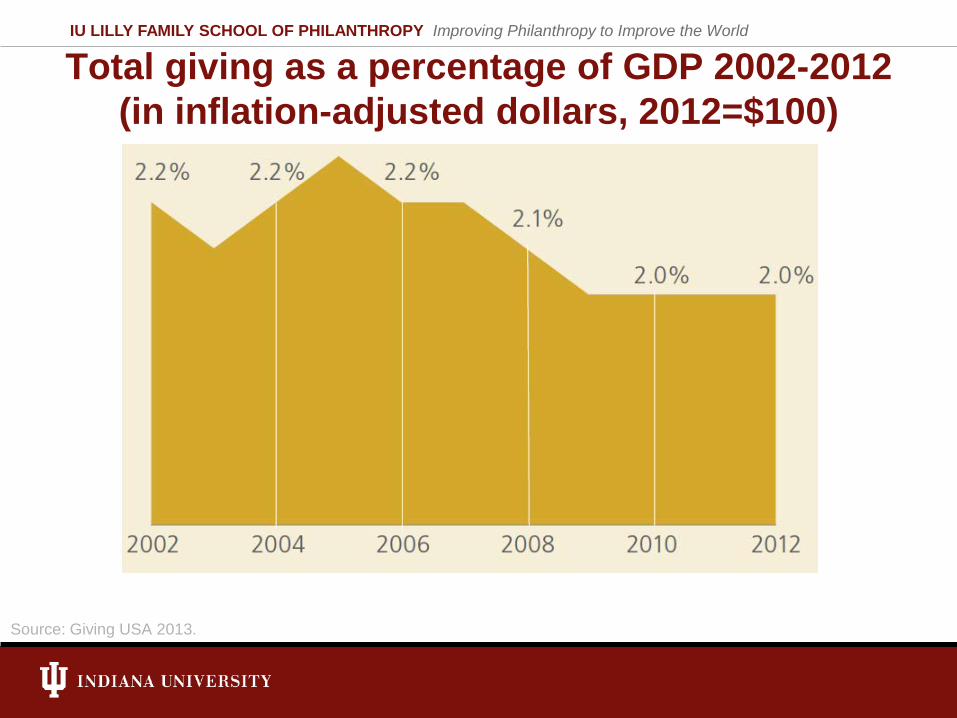
Total giving as a percentage of GDP 2002-2012 (in inflation-adjusted dollars, 2012=$100)
Source: Giving USA 2013.
IU LILLY FAMILY SCHOOL OF PHILANTHROPY Improving Philanthropy to Improve the World
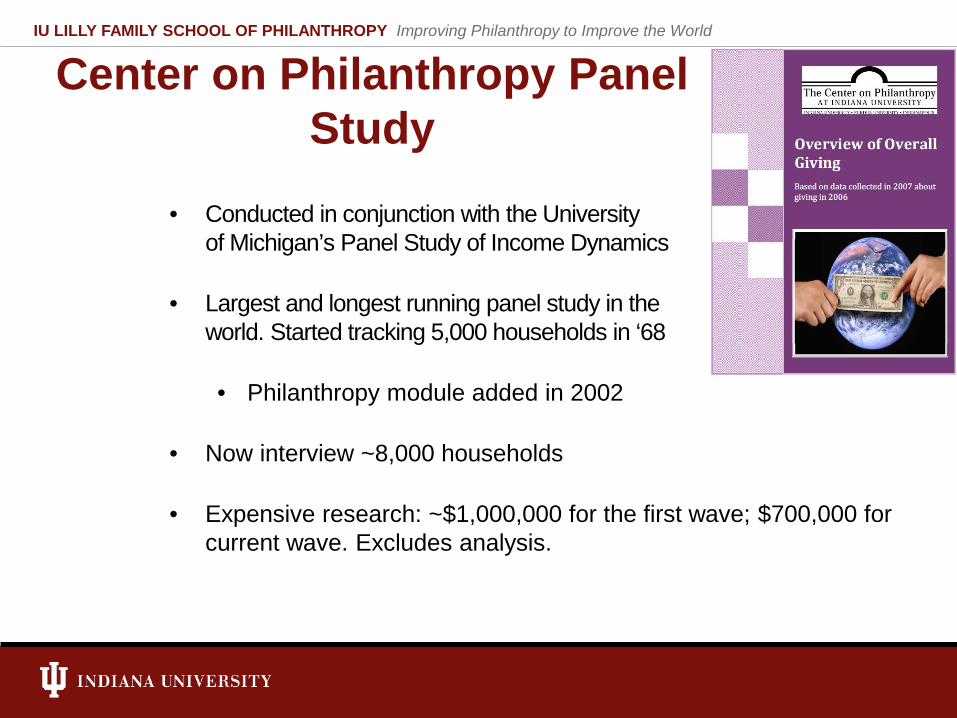
Center on Philanthropy Panel Study
• Conducted in conjunction with the University of Michigan’s Panel Study of Income Dynamics
• Largest and longest running panel study in the world. Started tracking 5,000 households in ‘68
• Philanthropy module added in 2002
• Now interview ~8,000 households
• Expensive research: ~$1,000,000 for the first wave; $700,000 for current wave. Excludes analysis.
IU LILLY FAMILY SCHOOL OF PHILANTHROPY Improving Philanthropy to Improve the World
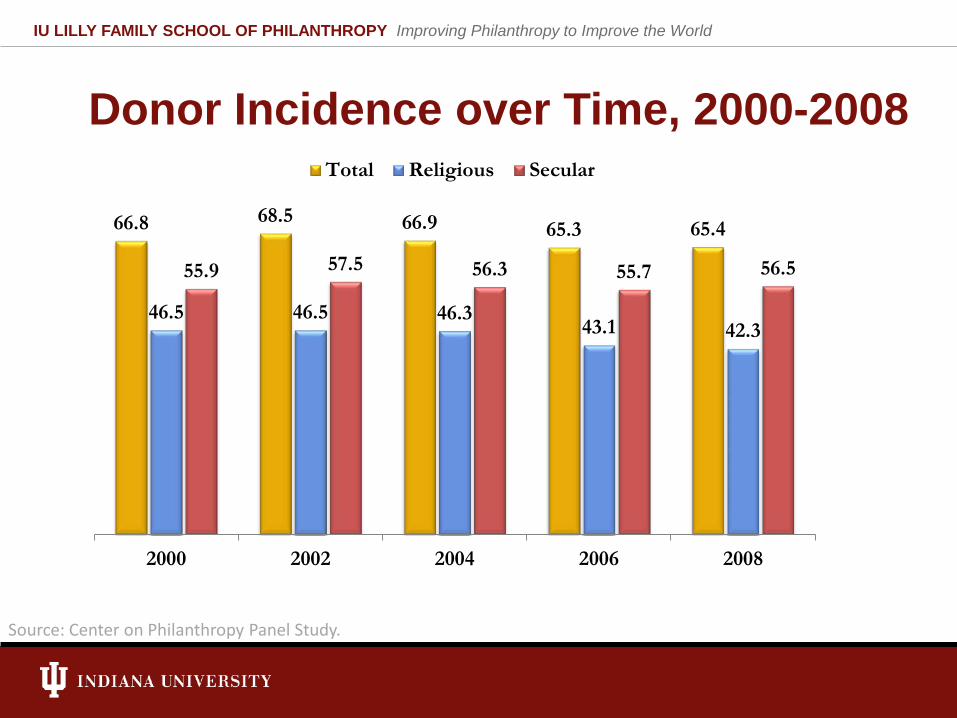
Donor Incidence over Time, 2000-2008
66.8 68.5 66.9 65.3 65.4
46.5 46.5 46.3 43.1 42.3
55.9 57.5 56.3 55.7 56.5
2000 2002 2004 2006 2008
Total Religious Secular
Source: Center on Philanthropy Panel Study.
IU LILLY FAMILY SCHOOL OF PHILANTHROPY Improving Philanthropy to Improve the World
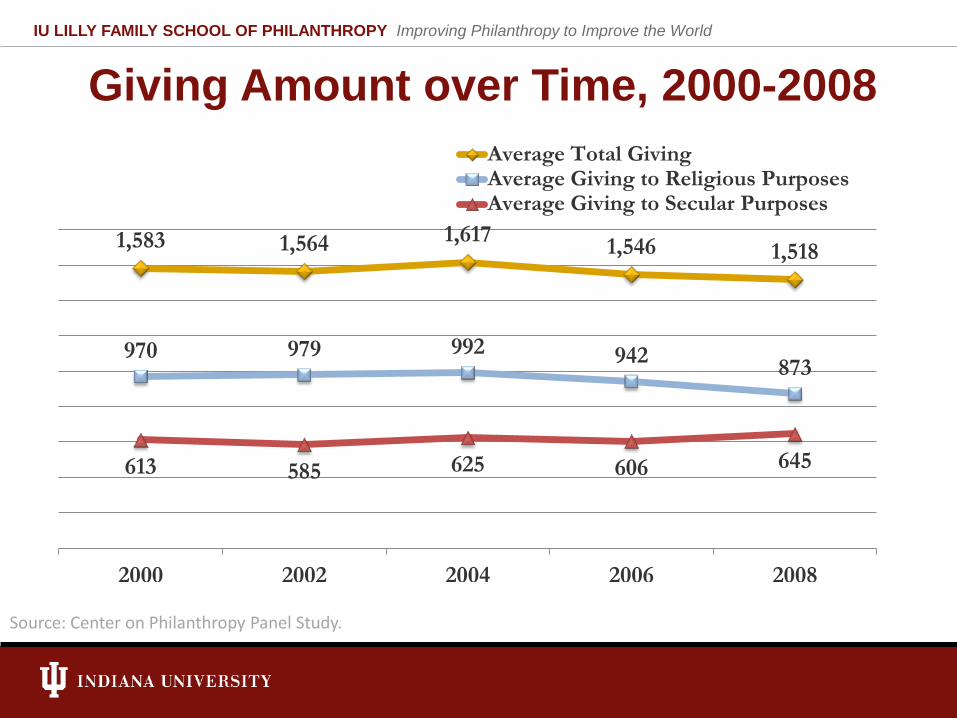
Giving Amount over Time, 2000-2008
1,583 1,564 1,617 1,546 1,518
970 979 992 942 873
613 585 625 606 645
2000 2002 2004 2006 2008
Average Total GivingAverage Giving to Religious PurposesAverage Giving to Secular Purposes
Source: Center on Philanthropy Panel Study.
IU LILLY FAMILY SCHOOL OF PHILANTHROPY Improving Philanthropy to Improve the World
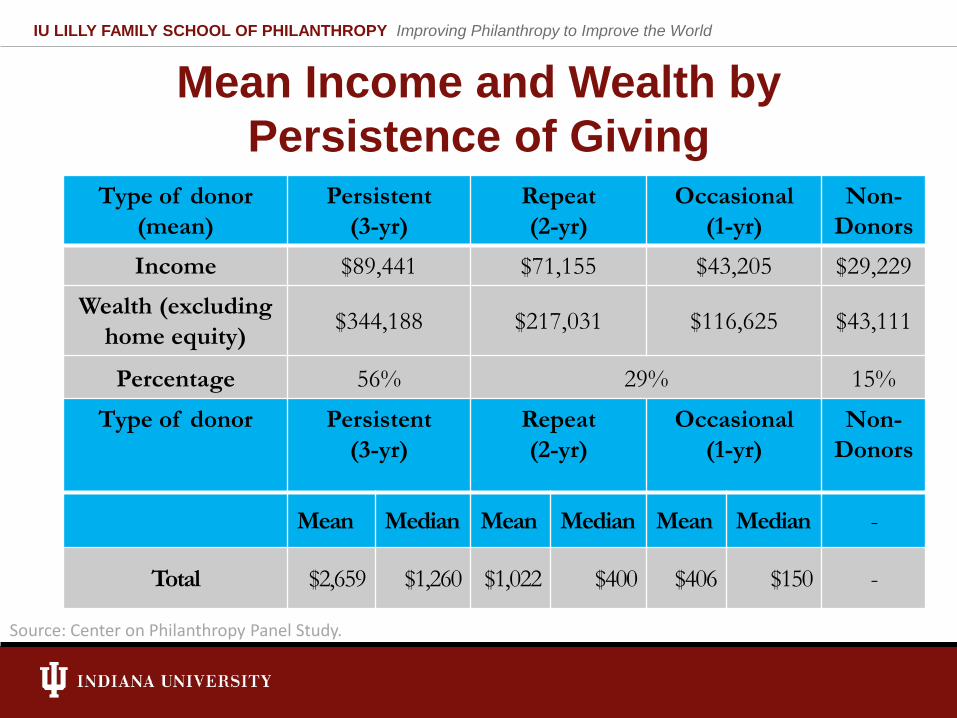
Mean Income and Wealth by Persistence of Giving
Type of donor (mean)
Persistent (3-yr)
Repeat (2-yr)
Occasional (1-yr)
Non-Donors
Income $89,441 $71,155 $43,205 $29,229
Wealth (excluding home equity) $344,188 $217,031 $116,625 $43,111
Percentage 56% 29% 15%
Type of donor Persistent (3-yr)
Repeat (2-yr)
Occasional (1-yr)
Non-Donors
Mean Median Mean Median Mean Median -
Total $2,659 $1,260 $1,022 $400 $406 $150 -
Source: Center on Philanthropy Panel Study.
IU LILLY FAMILY SCHOOL OF PHILANTHROPY Improving Philanthropy to Improve the World
Examples of Research Based on COPPS:
Predictors of Giving • The intergenerational transmission of
generosity
• Women Give 2010, 2012
• Stability of Donors
• Giving by Various Sources of Income and Wealth
• Without COPPS such research would not be possible!
Source: Picture taken from http://hopkins.typepad.com/.a/ 6a00d83451db8d69e2011168646150970c-popup
IU LILLY FAMILY SCHOOL OF PHILANTHROPY Improving Philanthropy to Improve the World
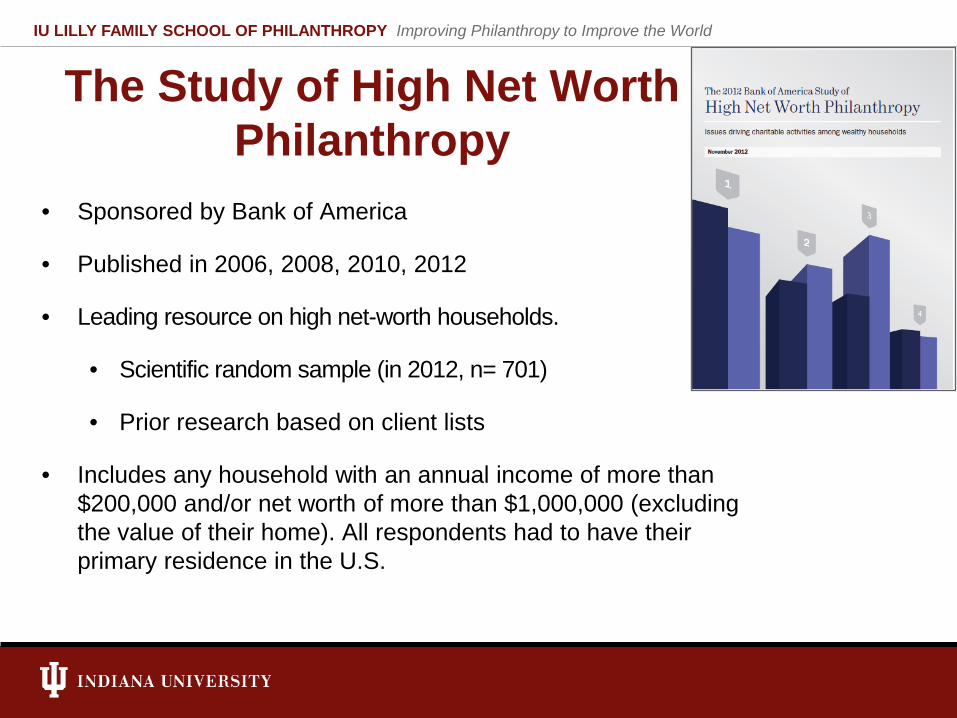
The Study of High Net Worth Philanthropy
• Sponsored by Bank of America
• Published in 2006, 2008, 2010, 2012
• Leading resource on high net-worth households.
• Scientific random sample (in 2012, n= 701)
• Prior research based on client lists
• Includes any household with an annual income of more than $200,000 and/or net worth of more than $1,000,000 (excluding the value of their home). All respondents had to have their primary residence in the U.S.
IU LILLY FAMILY SCHOOL OF PHILANTHROPY Improving Philanthropy to Improve the World
The Study of High Net Worth Philanthropy
• Commitment to Nonprofits
o In 2011, 95% of HNW donors gave to a charity
o In 2011, the average amount given by HNW households was $52,770 (a decrease of 7% from 2009)
• Focus on major gifts
Disproportionately high share of all individual giving in the U.S. comes from HNW individuals
o Top 1% gave 37% of all itemized contribution deductions in 2009
o Top 0.1% gave 18%
IU LILLY FAMILY SCHOOL OF PHILANTHROPY Improving Philanthropy to Improve the World
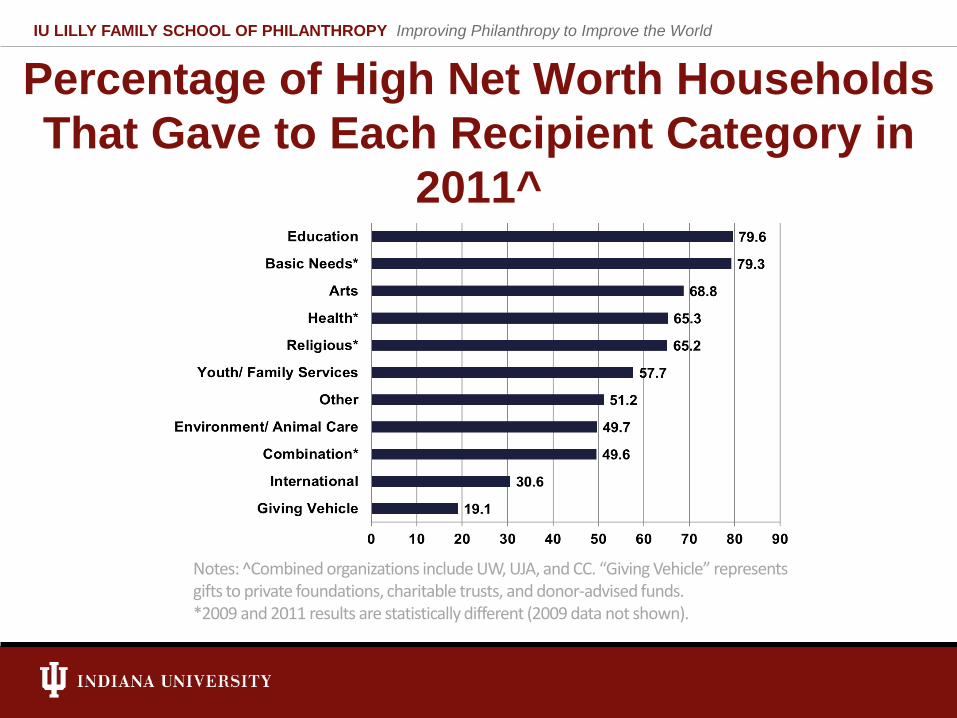
Percentage of High Net Worth Households That Gave to Each Recipient Category in
2011^
Notes: ̂ Combined organizations include UW, UJA, and CC. “Giving Vehicle” represents gifts to private foundations, charitable trusts, and donor-advised funds. *2009 and 2011 results are statistically different (2009 data not shown).
IU LILLY FAMILY SCHOOL OF PHILANTHROPY Improving Philanthropy to Improve the World
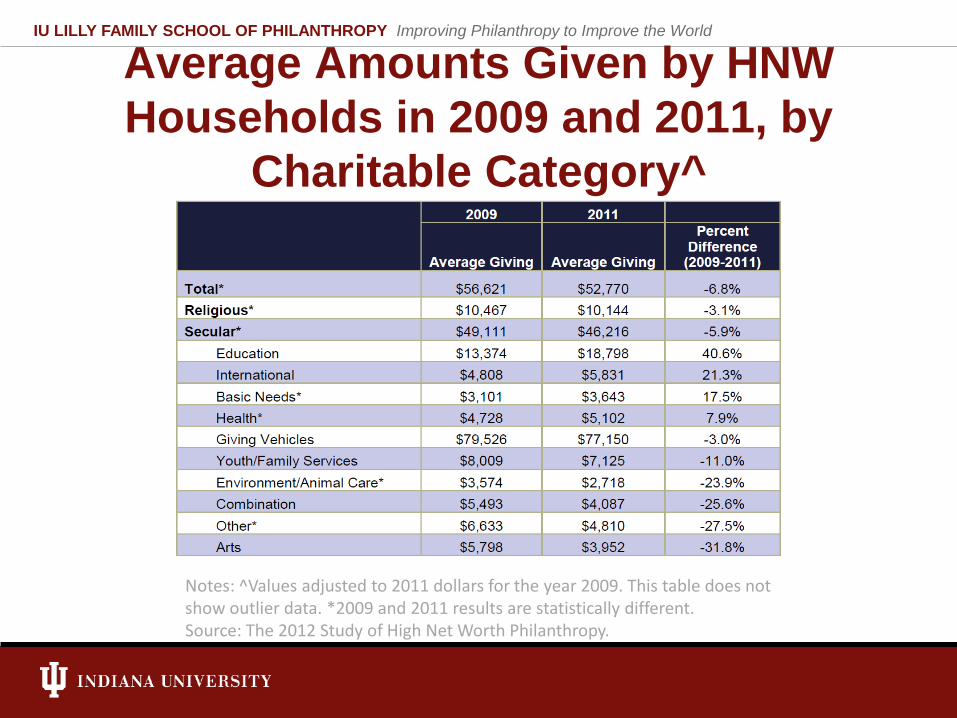
Average Amounts Given by HNW Households in 2009 and 2011, by
Charitable Category^
Notes: ^Values adjusted to 2011 dollars for the year 2009. This table does not show outlier data. *2009 and 2011 results are statistically different. Source: The 2012 Study of High Net Worth Philanthropy.
IU LILLY FAMILY SCHOOL OF PHILANTHROPY Improving Philanthropy to Improve the World
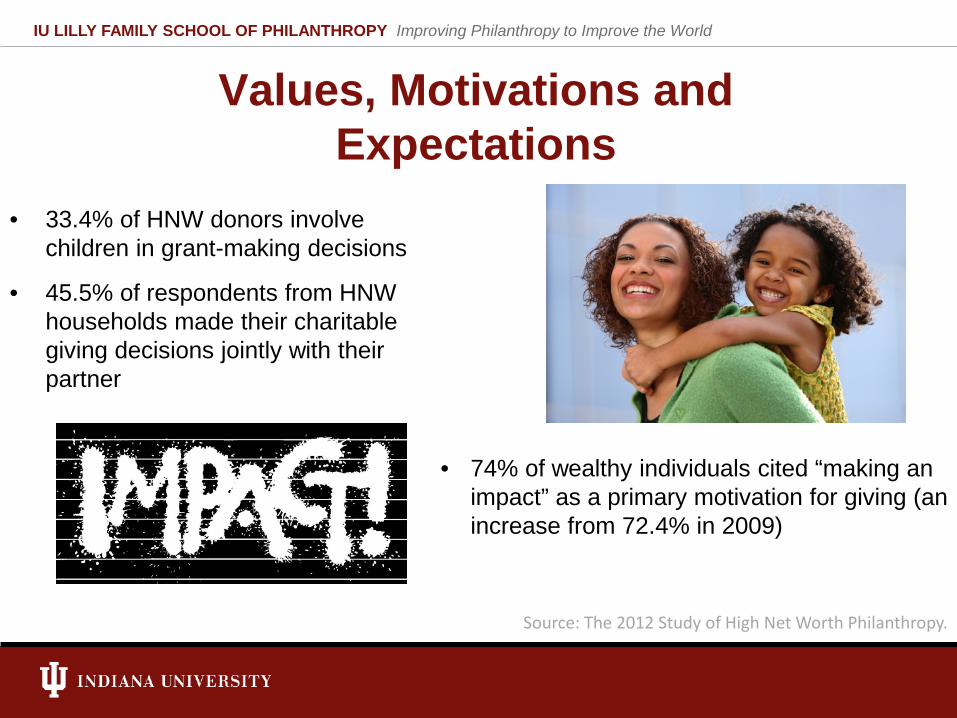
Values, Motivations and Expectations
Source: The 2012 Study of High Net Worth Philanthropy.
• 33.4% of HNW donors involve children in grant-making decisions
• 45.5% of respondents from HNW households made their charitable giving decisions jointly with their partner
• 74% of wealthy individuals cited “making an impact” as a primary motivation for giving (an increase from 72.4% in 2009)
IU LILLY FAMILY SCHOOL OF PHILANTHROPY Improving Philanthropy to Improve the World
• Purposes: • To enhance knowledge about giving at scale. • To make that knowledge transparent and
widely accessible • A unique dataset providing an in-depth view of
HNW giving • A total of 67,373 qualifying gifts (of $1 million +) from 2000 to 2011 • Grants a unique perspective on trends in giving at the highest level by the wealthiest
Americans, successful corporations, foundations, and other grant-making nonprofits
IU LILLY FAMILY SCHOOL OF PHILANTHROPY Improving Philanthropy to Improve the World
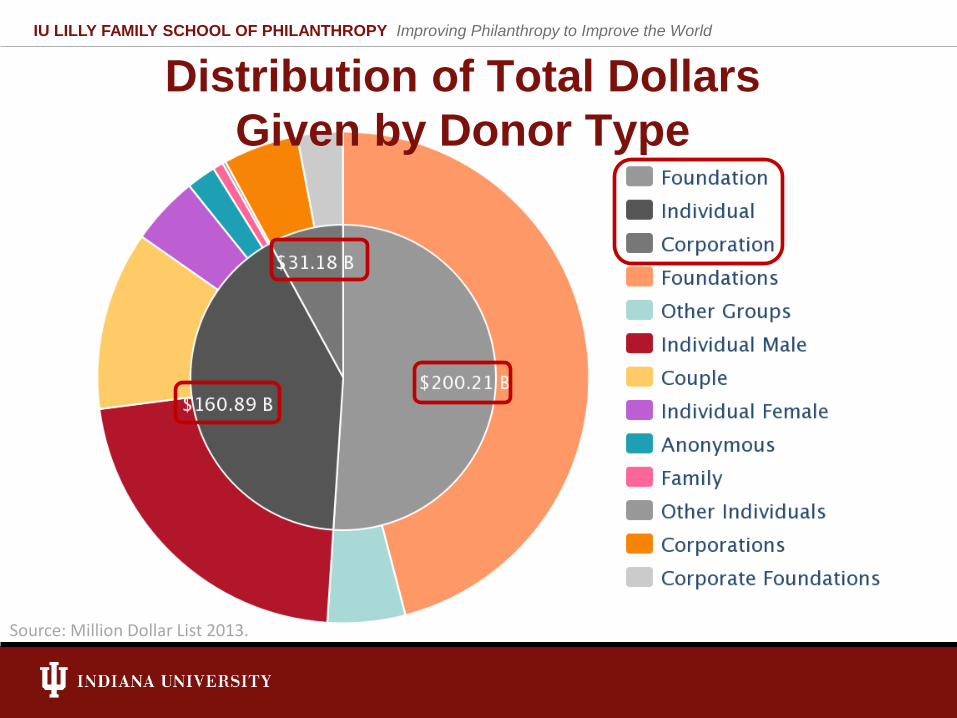
Distribution of Total Dollars Given by Donor Type
Source: Million Dollar List 2013.
IU LILLY FAMILY SCHOOL OF PHILANTHROPY Improving Philanthropy to Improve the World
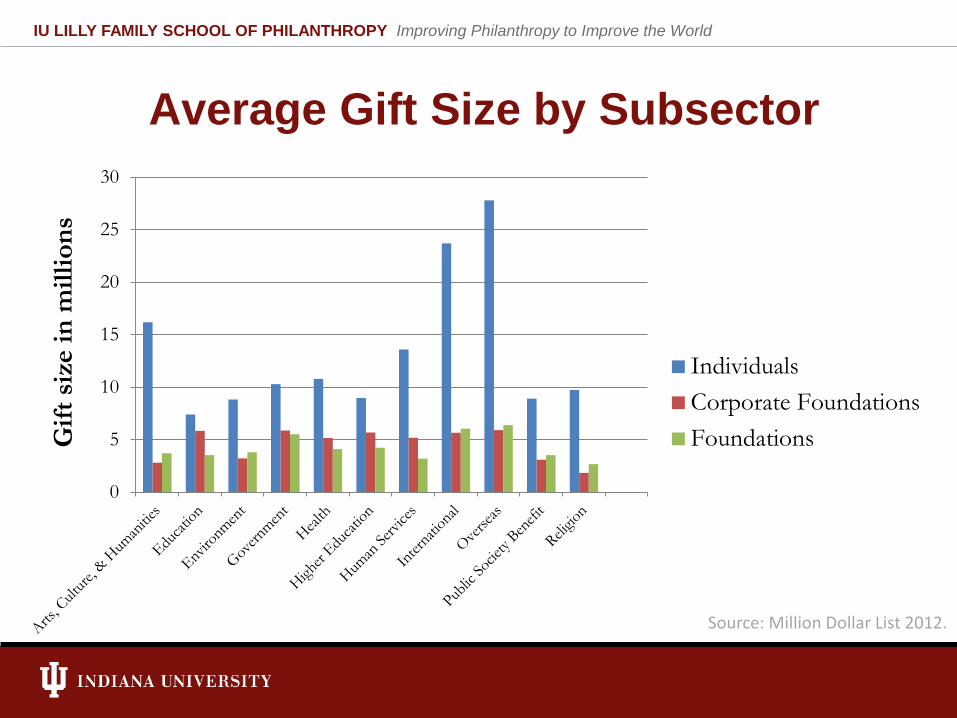
Average Gift Size by Subsector
0
5
10
15
20
25
30
Gift
siz
e in
mill
ions
IndividualsCorporate FoundationsFoundations
Source: Million Dollar List 2012.
IU LILLY FAMILY SCHOOL OF PHILANTHROPY Improving Philanthropy to Improve the World
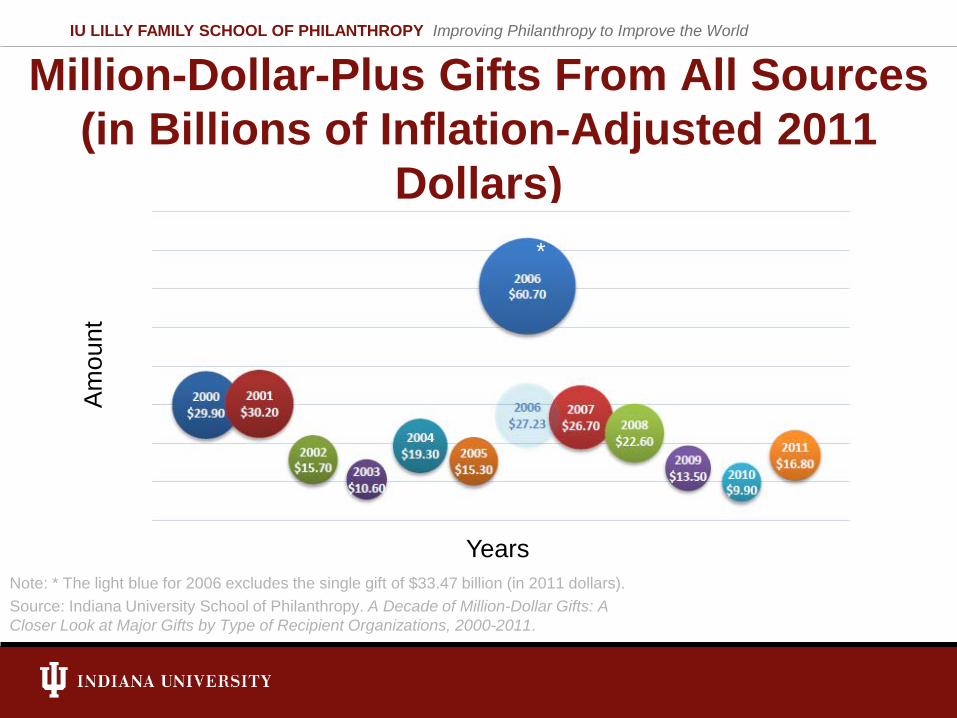
Million-Dollar-Plus Gifts From All Sources (in Billions of Inflation-Adjusted 2011
Dollars)
Note: * The light blue for 2006 excludes the single gift of $33.47 billion (in 2011 dollars). Source: Indiana University School of Philanthropy. A Decade of Million-Dollar Gifts: A Closer Look at Major Gifts by Type of Recipient Organizations, 2000-2011.
*
Amou
nt
Years
IU LILLY FAMILY SCHOOL OF PHILANTHROPY Improving Philanthropy to Improve the World
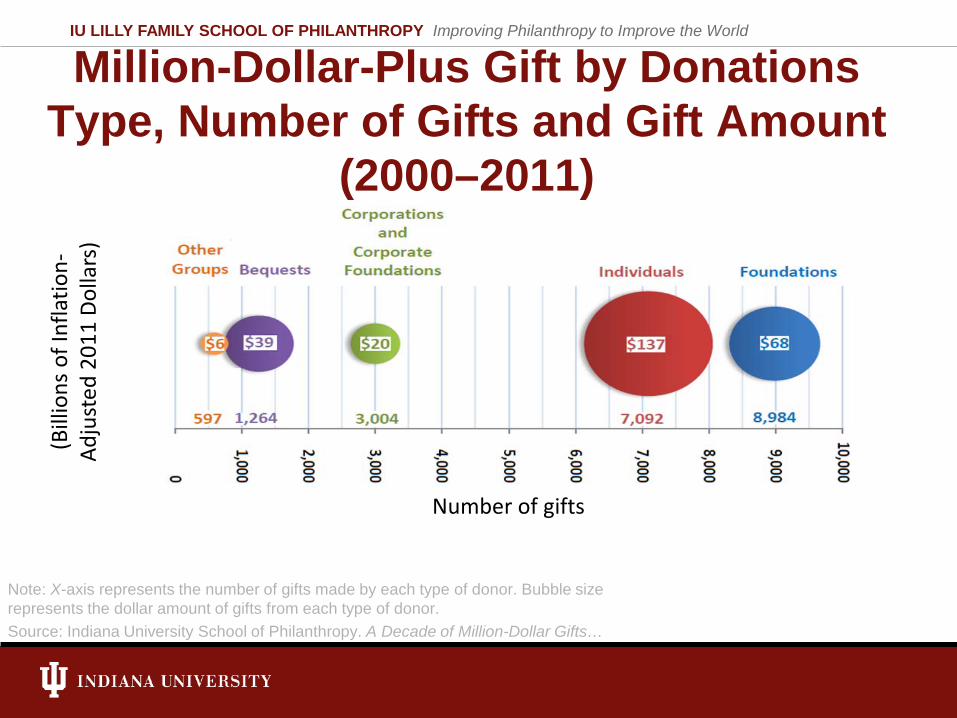
Million-Dollar-Plus Gift by Donations Type, Number of Gifts and Gift Amount
(2000–2011)
Note: X-axis represents the number of gifts made by each type of donor. Bubble size represents the dollar amount of gifts from each type of donor. Source: Indiana University School of Philanthropy. A Decade of Million-Dollar Gifts…
Number of gifts
(Bill
ions
of I
nfla
tion-
Adju
sted
201
1 Do
llars
)
IU LILLY FAMILY SCHOOL OF PHILANTHROPY Improving Philanthropy to Improve the World
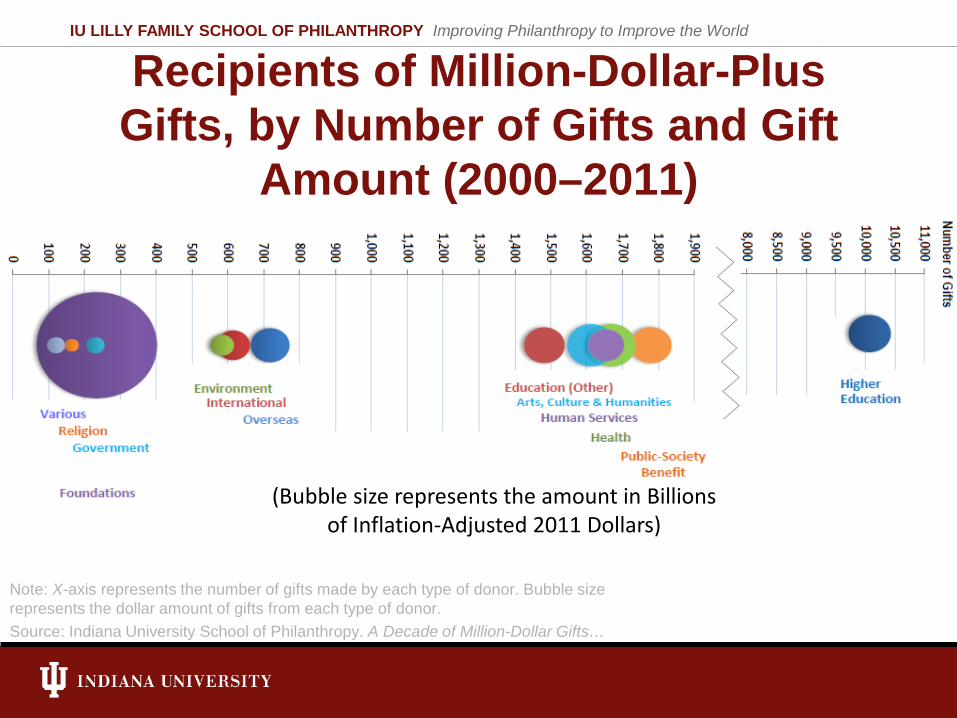
Recipients of Million-Dollar-Plus Gifts, by Number of Gifts and Gift
Amount (2000–2011)
Note: X-axis represents the number of gifts made by each type of donor. Bubble size represents the dollar amount of gifts from each type of donor. Source: Indiana University School of Philanthropy. A Decade of Million-Dollar Gifts…
(Bubble size represents the amount in Billions of Inflation-Adjusted 2011 Dollars)
IU LILLY FAMILY SCHOOL OF PHILANTHROPY Improving Philanthropy to Improve the World
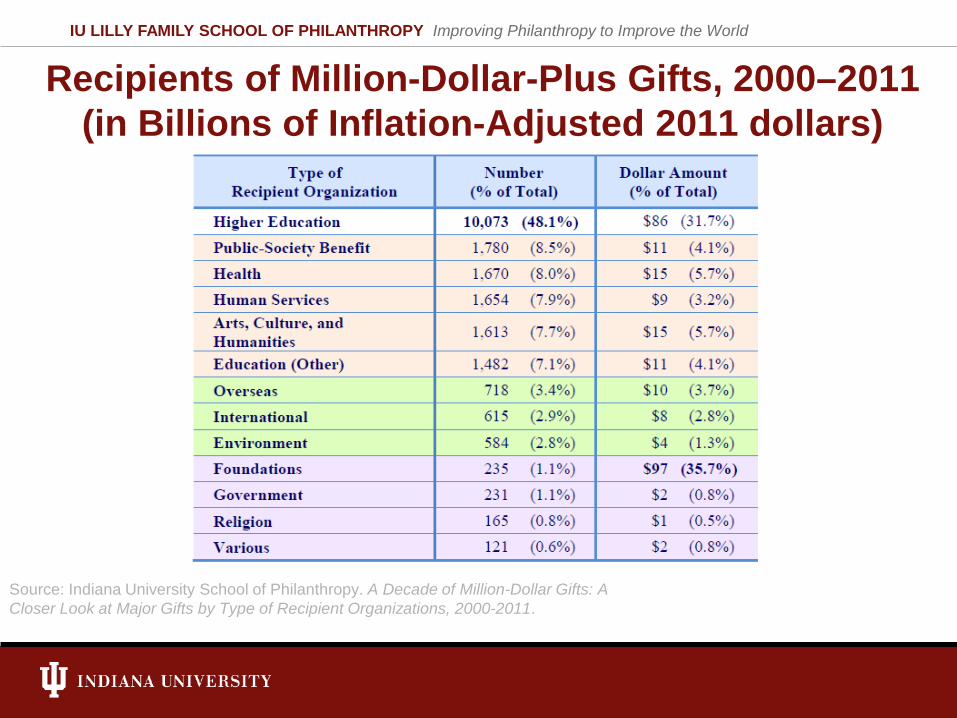
Recipients of Million-Dollar-Plus Gifts, 2000–2011 (in Billions of Inflation-Adjusted 2011 dollars)
Source: Indiana University School of Philanthropy. A Decade of Million-Dollar Gifts: A Closer Look at Major Gifts by Type of Recipient Organizations, 2000-2011.
IU LILLY FAMILY SCHOOL OF PHILANTHROPY Improving Philanthropy to Improve the World
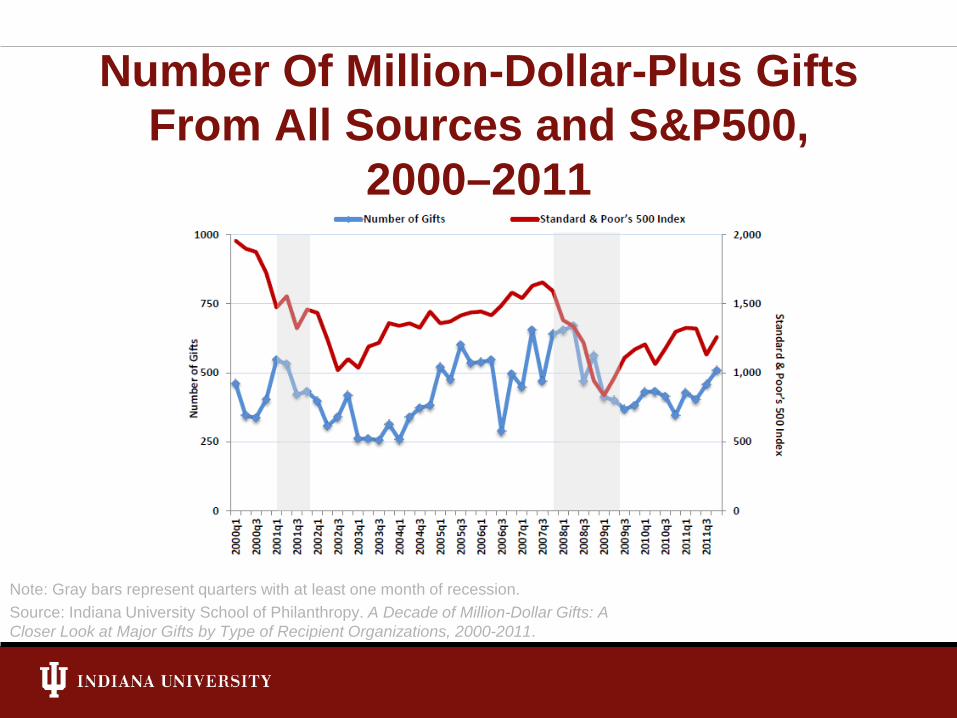
Number Of Million-Dollar-Plus Gifts From All Sources and S&P500,
2000–2011
Note: Gray bars represent quarters with at least one month of recession. Source: Indiana University School of Philanthropy. A Decade of Million-Dollar Gifts: A Closer Look at Major Gifts by Type of Recipient Organizations, 2000-2011.
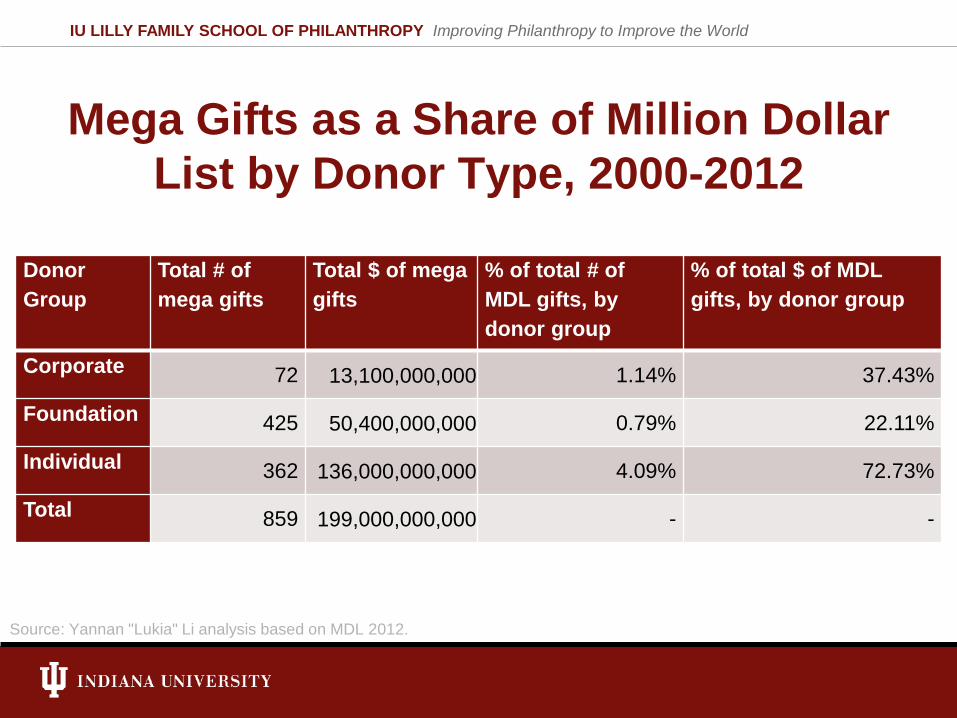
Mega Gifts as a Share of Million Dollar List by Donor Type, 2000-2012
Donor Group
Total # of mega gifts
Total $ of mega gifts
% of total # of MDL gifts, by donor group
% of total $ of MDL gifts, by donor group
Corporate 72 13,100,000,000 1.14% 37.43%
Foundation 425 50,400,000,000 0.79% 22.11%
Individual 362 136,000,000,000 4.09% 72.73%
Total 859 199,000,000,000 - -
Source: Yannan "Lukia" Li analysis based on MDL 2012.
IU LILLY FAMILY SCHOOL OF PHILANTHROPY Improving Philanthropy to Improve the World
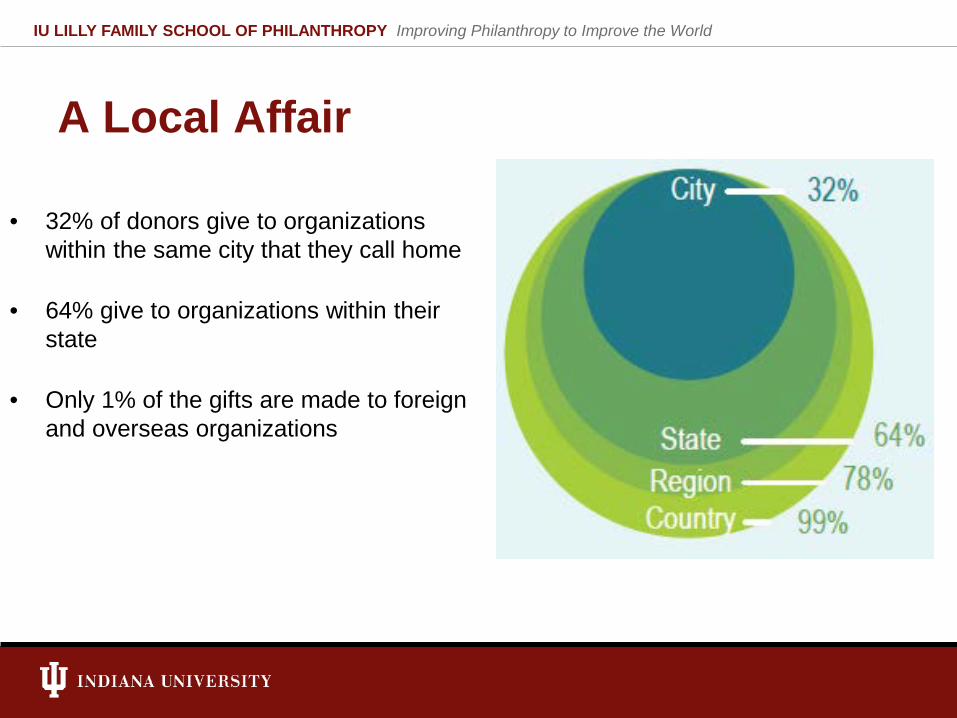
A Local Affair
• 32% of donors give to organizations within the same city that they call home
• 64% give to organizations within their state
• Only 1% of the gifts are made to foreign and overseas organizations
IU LILLY FAMILY SCHOOL OF PHILANTHROPY Improving Philanthropy to Improve the World
Resources • School of Philanthropy
www.philanthropy.iupui.edu
• Giving USA www.givingusareports.org
• The Million Dollar List www.milliondollarlist.org
• Other research including
Center on Philanthropy Panel Study
Bank of America Study on High Net Worth Philanthropy www.philanthropy.iupui.edu/research-by-category
IU LILLY FAMILY SCHOOL OF PHILANTHROPY Improving Philanthropy to Improve the World
In a World of Numbers, What Makes People Give?
Josette C. Rathbun, CFP, MBA First Vice President – Wealth Management
Wealth Management Advisor The Rathbun Group
Merrill Lynch
Donor Motivation My Experiences in the World of
Philanthropy
IU LILLY FAMILY SCHOOL OF PHILANTHROPY Improving Philanthropy to Improve the World
Bank of America 2012 Study of High Net Worth Philanthropy
IU LILLY FAMILY SCHOOL OF PHILANTHROPY Improving Philanthropy to Improve the World
Primary Motivations of Large Gifts
IU LILLY FAMILY SCHOOL OF PHILANTHROPY Improving Philanthropy to Improve the World
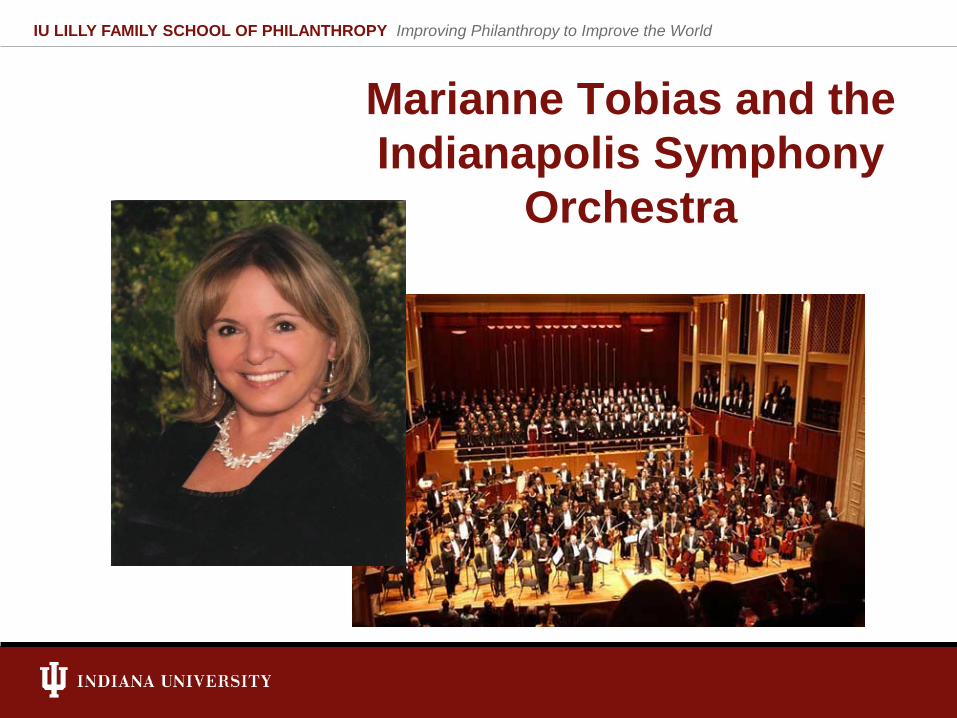
Marianne Tobias and the Indianapolis Symphony
Orchestra
IU LILLY FAMILY SCHOOL OF PHILANTHROPY Improving Philanthropy to Improve the World
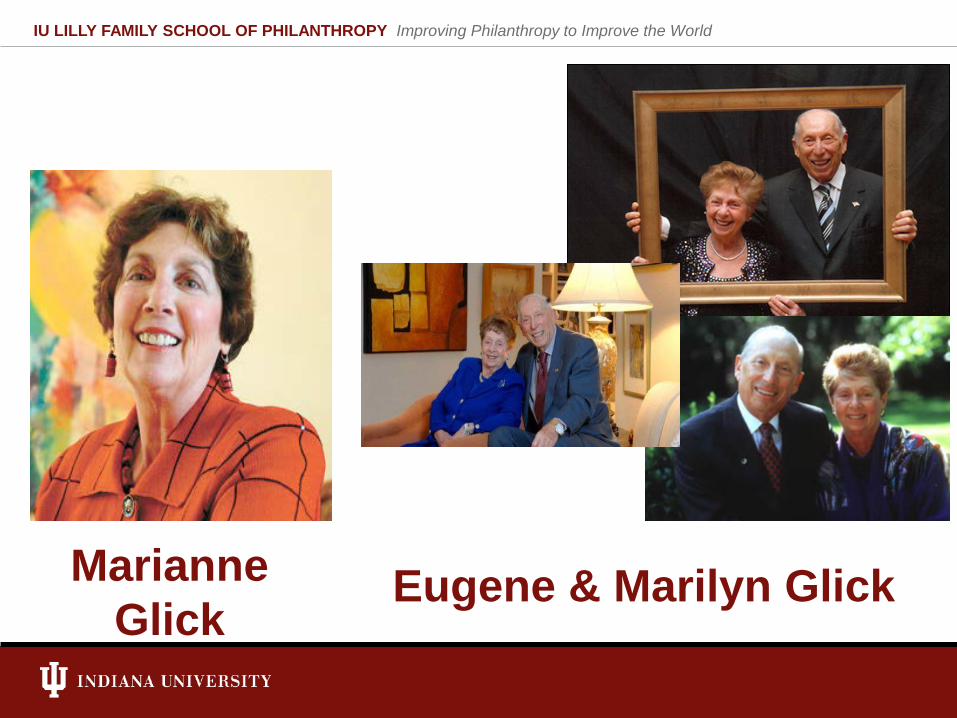
Eugene & Marilyn Glick
IU LILLY FAMILY SCHOOL OF PHILANTHROPY Improving Philanthropy to Improve the World
Marianne Glick
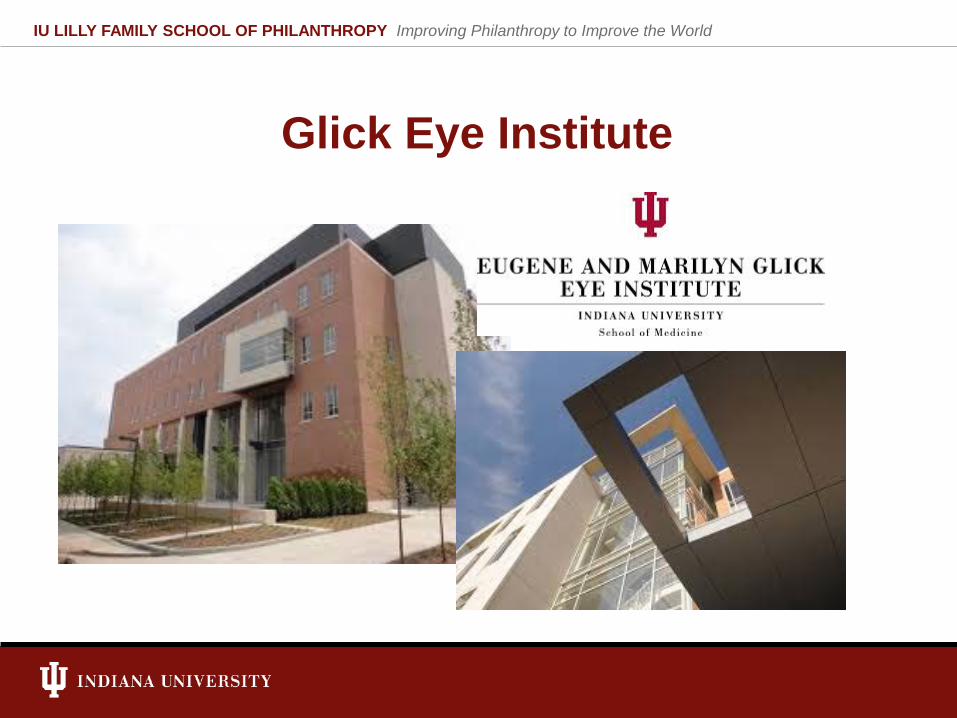
Glick Eye Institute
IU LILLY FAMILY SCHOOL OF PHILANTHROPY Improving Philanthropy to Improve the World
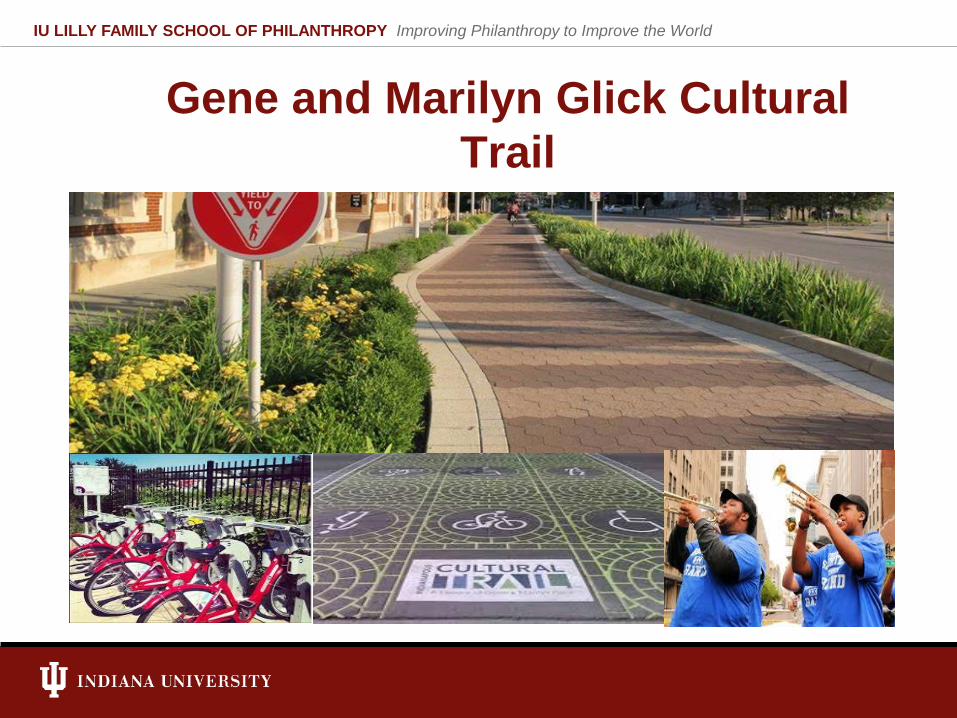
Gene and Marilyn Glick Cultural Trail
IU LILLY FAMILY SCHOOL OF PHILANTHROPY Improving Philanthropy to Improve the World
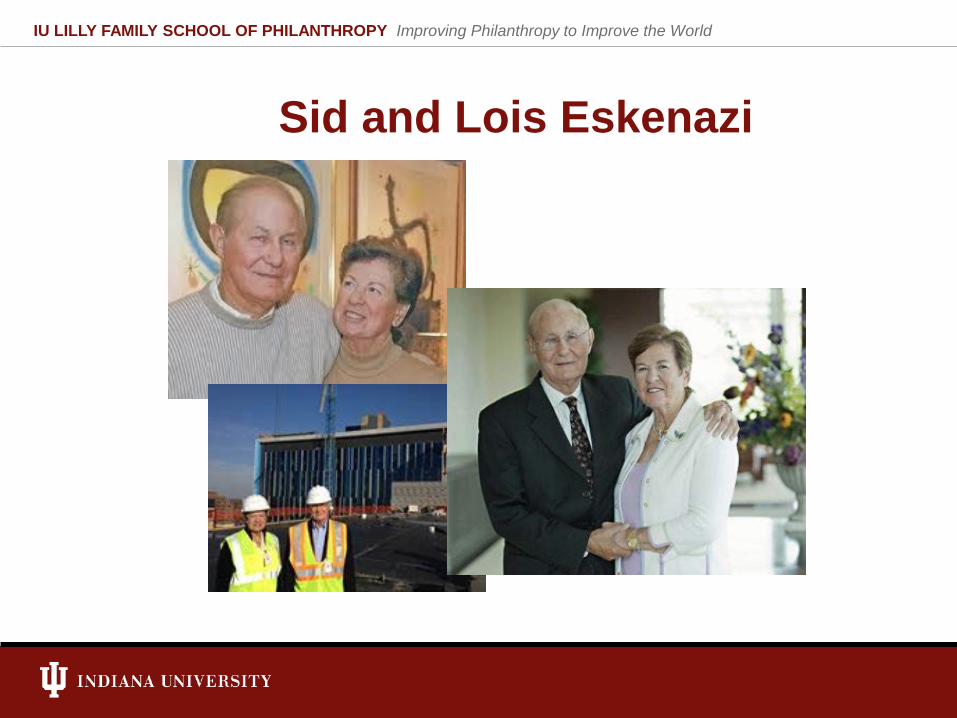
Sid and Lois Eskenazi
IU LILLY FAMILY SCHOOL OF PHILANTHROPY Improving Philanthropy to Improve the World
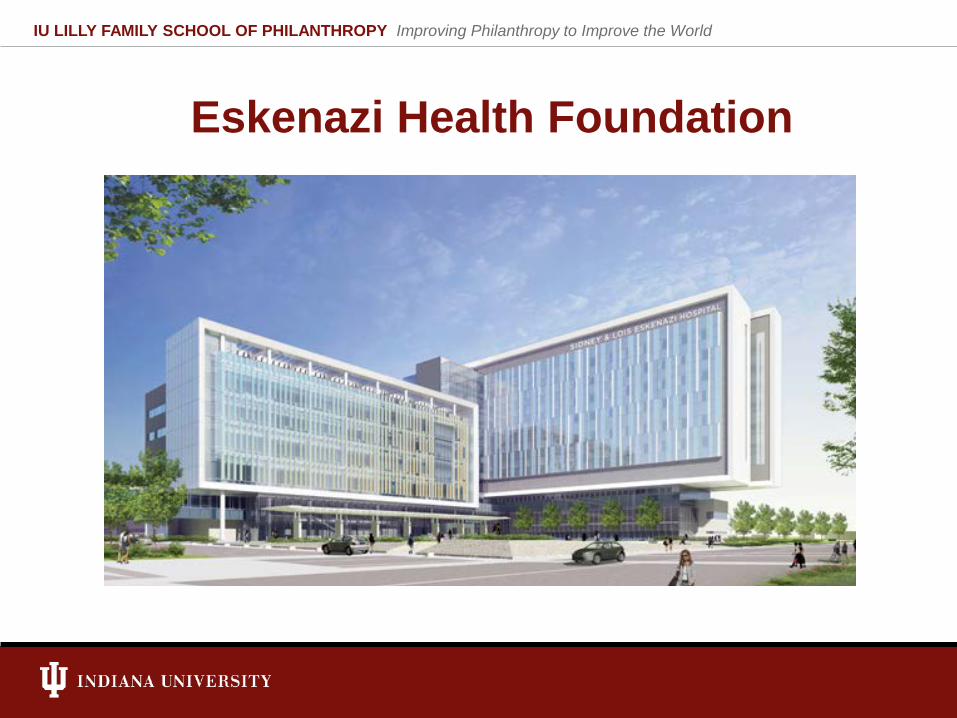
Eskenazi Health Foundation
IU LILLY FAMILY SCHOOL OF PHILANTHROPY Improving Philanthropy to Improve the World
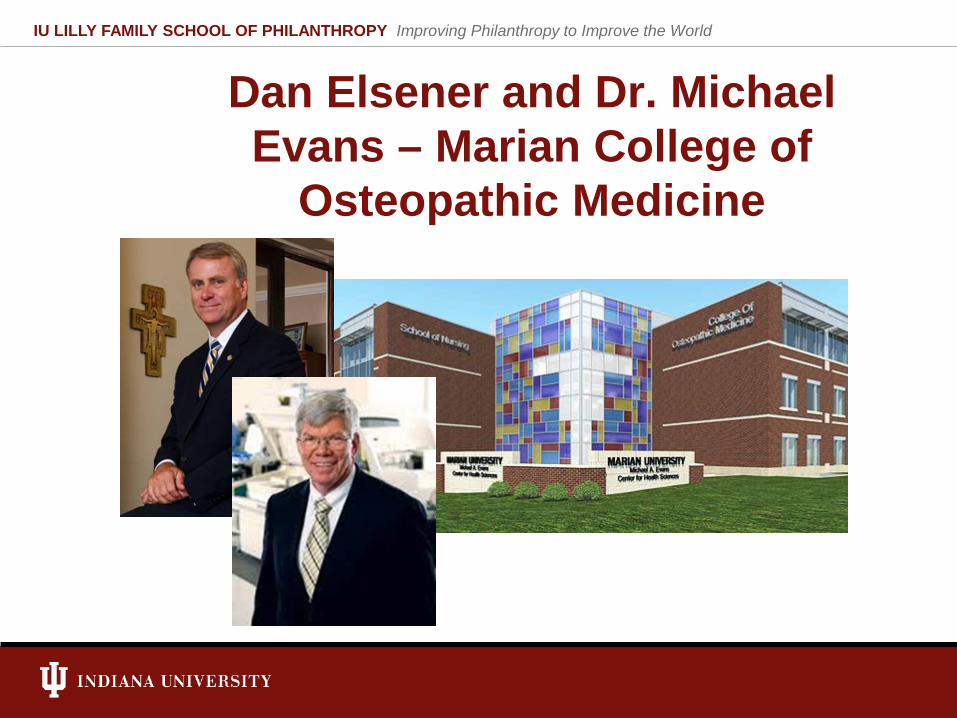
Dan Elsener and Dr. Michael Evans – Marian College of
Osteopathic Medicine
IU LILLY FAMILY SCHOOL OF PHILANTHROPY Improving Philanthropy to Improve the World
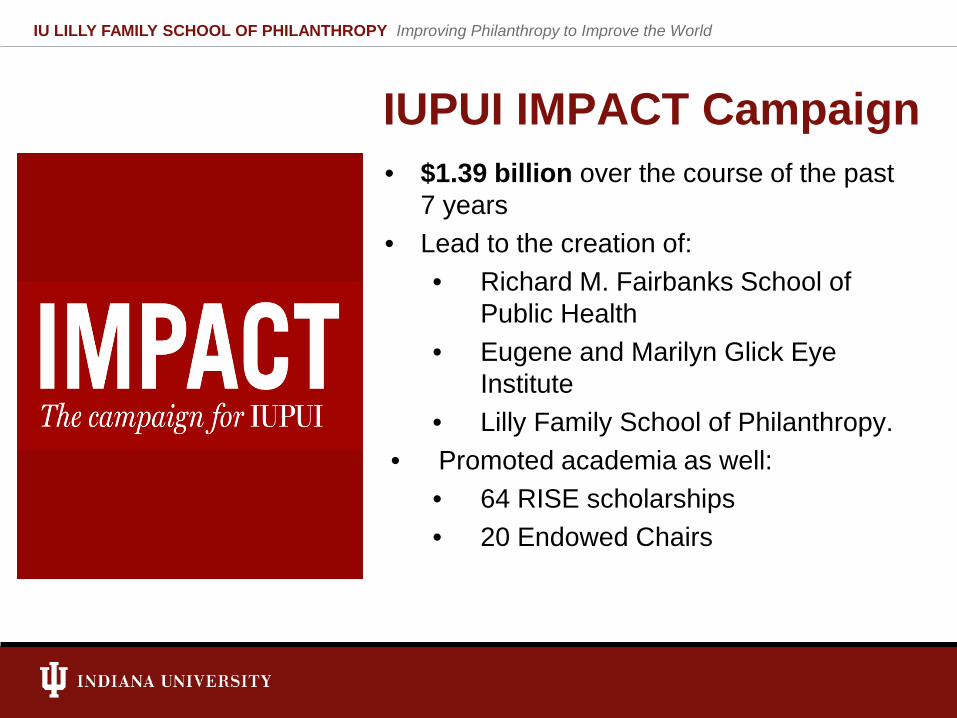
IUPUI IMPACT Campaign • $1.39 billion over the course of the past
7 years • Lead to the creation of:
• Richard M. Fairbanks School of Public Health
• Eugene and Marilyn Glick Eye Institute
• Lilly Family School of Philanthropy. • Promoted academia as well:
• 64 RISE scholarships • 20 Endowed Chairs
IU LILLY FAMILY SCHOOL OF PHILANTHROPY Improving Philanthropy to Improve the World
Putting the Pieces Together: What does all of this mean for your work with donors?
Angela E. White, CFRE Senior Consultant and CEO
Johnson, Grossnickle and Associates
1. Examine the effectiveness of your current major gift program.
• How do you currently engage with your donors and prospects? • Do you have an emphasis on building personal relationships? • Do you have systematic approach to the discipline of
donor/prospect contact? • Are there written plans for the engagement of each top
donor/prospect with your organization? • Do you communicate the impact of charitable giving on the
implementation of your mission?
IU LILLY FAMILY SCHOOL OF PHILANTHROPY Improving Philanthropy to Improve the World
2. Understand that the engagement of major gift prospects takes time and the involvement of your senior leadership.
• Are you thinking long-term when creating engagement plans for your major gift prospects?
• Do your prospects build personal relationships with multiple people at your organization?
• Are you creating meaningful volunteer opportunities for major gift prospects and donors?
• Are you soliciting a major gift when the time is right for the prospect and the relationship and not solely according to your internal schedule or plans?
IU LILLY FAMILY SCHOOL OF PHILANTHROPY Improving Philanthropy to Improve the World
3. Know your prospect! • Do you know the charitable giving strategies of your major gift
prospects? • Are you engaging both the husband and wife or life partner in
your discussions? • Are you focused on the right giving vehicle? • Do you know the extent to which the major donor prospect wants
her/his children involved in any charitable giving? • Do you know the unique motivators and de-motivators of your
major gift prospects?
IU LILLY FAMILY SCHOOL OF PHILANTHROPY Improving Philanthropy to Improve the World
4. Match the right project with the right prospect and giving vehicle.
• Are you soliciting major gift commitments for the operational needs of your organization?
• Do you know the desired giving vehicles for each prospect and are you able to match those vehicles to your funding needs?
• Are you focused on the right giving vehicle? • Are you effectively communicating your philanthropic needs in a
way that will elicit a prompt and meaningful response? • Are you working with professional advisors and community
foundation leaders to educate them on your mission and needs?
IU LILLY FAMILY SCHOOL OF PHILANTHROPY Improving Philanthropy to Improve the World
5. Practice excellent donor stewardship. • Does your focus on your major gift prospects end when a gift is
made? • Are you continuing to grow the relationship beyond the signing of
a gift agreement or cashing of a check? • Are you preparing your current major gift donors for the next
area of interest and for increasing their charitable support of your organization?
• Do you know the issues that are important to your major gift donors and continue to make the connections between these issues and your mission?
IU LILLY FAMILY SCHOOL OF PHILANTHROPY Improving Philanthropy to Improve the World
Concluding Thoughts
• It is important to understand the trends and research findings regarding high net worth individuals. However, we must avoid the tendency to make generalizations about our prospects and use this research in place of getting to know each major gift prospect and donor.
IU LILLY FAMILY SCHOOL OF PHILANTHROPY Improving Philanthropy to Improve the World
Resources • Giving USA; 2012 Edition. This is the annual report on philanthropy,
covering 2011.
• The School of Philanthropy at Indiana University COPPS Study. COPPS is the most accurate resource for measuring giving and volunteering in the United States. COPPS follows a large number of the same families for long periods of time and gathers detailed information about their lives to identify emerging trends in philanthropy.
• Women Give 2010. This study utilizes the COPPS data from 2007 to research single-headed households and giving.
• The 2012 Bank of America Study of High Net Worth Philanthropy. This research is based on 700 respondents throughout the U.S. with household income greater than $200,000 and/or net worth (excluding value of residence) of $1M+.
• Indiana Nonprofit Sector. This is the most comprehensive source of information on Indiana nonprofits: www.indiana.edu/~nonprof
IU LILLY FAMILY SCHOOL OF PHILANTHROPY Improving Philanthropy to Improve the World
Questions? Comments?
IU LILLY FAMILY SCHOOL OF PHILANTHROPY Improving Philanthropy to Improve the World