Recent summer Arctic atmospheric circulation · PDF fileRecent summer Arctic atmospheric...
12
The Cryosphere, 9, 53–64, 2015 www.the-cryosphere.net/9/53/2015/ doi:10.5194/tc-9-53-2015 © Author(s) 2015. CC Attribution 3.0 License. Recent summer Arctic atmospheric circulation anomalies in a historical perspective A. Belleflamme, X. Fettweis, and M. Erpicum Laboratory of Climatology, Department of Geography, University of Liège, Allée du 6 Août, 2, 4000 Liège, Belgium Correspondence to: A. Belleflamme (a.bellefl[email protected]) Received: 18 July 2014 – Published in The Cryosphere Discuss.: 10 September 2014 Revised: 4 December 2014 – Accepted: 7 December 2014 – Published: 7 January 2015 Abstract. A significant increase in the summertime occur- rence of a high pressure area over the Beaufort Sea, the Cana- dian Arctic Archipelago, and Greenland has been observed since the beginning of the 2000s, and particularly between 2007 and 2012. These circulation anomalies are likely partly responsible for the enhanced Greenland ice sheet melt as well as the Arctic sea ice loss observed since 2007. Therefore, it is interesting to analyse whether similar conditions might have happened since the late 19th century over the Arctic region. We have used an atmospheric circulation type classi- fication based on daily mean sea level pressure and 500 hPa geopotential height data from five reanalysis data sets (ERA- Interim, ERA-40, NCEP/NCAR, ERA-20C, and 20CRv2) to put the recent circulation anomalies in perspective with the atmospheric circulation variability since 1871. We found that circulation conditions similar to 2007–2012 have occurred in the past, despite a higher uncertainty of the reconstructed circulation before 1940. For example, only ERA-20C shows circulation anomalies that could explain the 1920–1930 sum- mertime Greenland warming, in contrast to 20CRv2. While the recent anomalies exceed by a factor of 2 the interannual variability of the atmospheric circulation of the Arctic region, their origin (natural variability or global warming) remains debatable. 1 Introduction In recent years, particularly since 2007, significant atmo- spheric circulation anomalies have been observed over differ- ent parts of the Arctic. Based on 500 hPa geopotential height (Z500), Fettweis et al. (2013) reported a doubled frequency of summertime anticyclones centred over Greenland, repre- senting an increased frequency of negative NAO (North At- lantic Oscillation) conditions. This circulation anomaly im- pacts the climate of a major part of the Arctic region by favouring warm southerly air advection over western Green- land and the Canadian Arctic Archipelago, and rather cold polar flow over Svalbard and the Barents Sea. This circula- tion anomaly partly explains the sharply enhanced melt of the Greenland ice sheet (Tedesco et al., 2008; Hanna et al., 2009; Fettweis et al., 2013; Rajewicz and Marshall, 2014) and the stabilisation of the melt rate of the Svalbard glaciers (Moholdt et al., 2010) despite Arctic warming (Serreze et al., 2009). In the same way, Bezeau et al. (2014) have shown that the increased melt of glaciers and ice caps in the Canadian Arctic Archipelago is related to the increased occurrence of high pressure systems over this region over 2007–2012. Ballinger et al. (2014) highlighted an increase in the sum- mertime frequency of the Beaufort Sea High over the last decade, on the basis of the mean sea level pressure (SLP). They found that this circulation anomaly is significantly an- ticorrelated with the Arctic Oscillation (AO) index, which has decreased over the same period (Hanna et al., 2014a). Moreover, this anomaly is simultaneous with the increased frequency of the Greenland High described above suggest- ing that both anomalies are linked. Finally, these circulation anomalies have been implicated in the recent Arctic sea ice extent (SIE) decrease (Wang et al., 2009; Overland et al., 2012; Matsumura et al., 2014; Stroeve et al., 2014; Sim- monds, 2015). High pressure systems over the Canadian Arc- tic Archipelago and Greenland favour sea ice export from the Arctic Basin through the Fram Strait and the Barents Sea, which is particularly effective for sea ice loss during summer (Wang et al., 2009). Published by Copernicus Publications on behalf of the European Geosciences Union.
Transcript of Recent summer Arctic atmospheric circulation · PDF fileRecent summer Arctic atmospheric...

The Cryosphere, 9, 53–64, 2015
www.the-cryosphere.net/9/53/2015/
doi:10.5194/tc-9-53-2015
© Author(s) 2015. CC Attribution 3.0 License.
Recent summer Arctic atmospheric circulation
anomalies in a historical perspective
A. Belleflamme, X. Fettweis, and M. Erpicum
Laboratory of Climatology, Department of Geography, University of Liège, Allée du 6 Août, 2, 4000 Liège, Belgium
Correspondence to: A. Belleflamme ([email protected])
Received: 18 July 2014 – Published in The Cryosphere Discuss.: 10 September 2014
Revised: 4 December 2014 – Accepted: 7 December 2014 – Published: 7 January 2015
Abstract. A significant increase in the summertime occur-
rence of a high pressure area over the Beaufort Sea, the Cana-
dian Arctic Archipelago, and Greenland has been observed
since the beginning of the 2000s, and particularly between
2007 and 2012. These circulation anomalies are likely partly
responsible for the enhanced Greenland ice sheet melt as well
as the Arctic sea ice loss observed since 2007. Therefore,
it is interesting to analyse whether similar conditions might
have happened since the late 19th century over the Arctic
region. We have used an atmospheric circulation type classi-
fication based on daily mean sea level pressure and 500 hPa
geopotential height data from five reanalysis data sets (ERA-
Interim, ERA-40, NCEP/NCAR, ERA-20C, and 20CRv2) to
put the recent circulation anomalies in perspective with the
atmospheric circulation variability since 1871. We found that
circulation conditions similar to 2007–2012 have occurred
in the past, despite a higher uncertainty of the reconstructed
circulation before 1940. For example, only ERA-20C shows
circulation anomalies that could explain the 1920–1930 sum-
mertime Greenland warming, in contrast to 20CRv2. While
the recent anomalies exceed by a factor of 2 the interannual
variability of the atmospheric circulation of the Arctic region,
their origin (natural variability or global warming) remains
debatable.
1 Introduction
In recent years, particularly since 2007, significant atmo-
spheric circulation anomalies have been observed over differ-
ent parts of the Arctic. Based on 500 hPa geopotential height
(Z500), Fettweis et al. (2013) reported a doubled frequency
of summertime anticyclones centred over Greenland, repre-
senting an increased frequency of negative NAO (North At-
lantic Oscillation) conditions. This circulation anomaly im-
pacts the climate of a major part of the Arctic region by
favouring warm southerly air advection over western Green-
land and the Canadian Arctic Archipelago, and rather cold
polar flow over Svalbard and the Barents Sea. This circula-
tion anomaly partly explains the sharply enhanced melt of
the Greenland ice sheet (Tedesco et al., 2008; Hanna et al.,
2009; Fettweis et al., 2013; Rajewicz and Marshall, 2014)
and the stabilisation of the melt rate of the Svalbard glaciers
(Moholdt et al., 2010) despite Arctic warming (Serreze et al.,
2009). In the same way, Bezeau et al. (2014) have shown that
the increased melt of glaciers and ice caps in the Canadian
Arctic Archipelago is related to the increased occurrence
of high pressure systems over this region over 2007–2012.
Ballinger et al. (2014) highlighted an increase in the sum-
mertime frequency of the Beaufort Sea High over the last
decade, on the basis of the mean sea level pressure (SLP).
They found that this circulation anomaly is significantly an-
ticorrelated with the Arctic Oscillation (AO) index, which
has decreased over the same period (Hanna et al., 2014a).
Moreover, this anomaly is simultaneous with the increased
frequency of the Greenland High described above suggest-
ing that both anomalies are linked. Finally, these circulation
anomalies have been implicated in the recent Arctic sea ice
extent (SIE) decrease (Wang et al., 2009; Overland et al.,
2012; Matsumura et al., 2014; Stroeve et al., 2014; Sim-
monds, 2015). High pressure systems over the Canadian Arc-
tic Archipelago and Greenland favour sea ice export from the
Arctic Basin through the Fram Strait and the Barents Sea,
which is particularly effective for sea ice loss during summer
(Wang et al., 2009).
Published by Copernicus Publications on behalf of the European Geosciences Union.
54 A. Belleflamme et al.: Recent summer Arctic circulation anomalies in a historical perspective
It is interesting to study whether the recent circulation
anomalies are unique (and potentially caused by global
warming) or if similar anomalies have already occurred dur-
ing the instrumental period (since the late 19th century)
due to the natural variability of the climatic system. We
have put the 2007–2012 summertime atmospheric circulation
anomaly over the Arctic region in perspective with the recon-
structed circulation over the instrumental period. To achieve
this, we have used an atmospheric circulation type classifi-
cation (CTC) to distinguish the main circulation types over
the Arctic region and to analyse their frequency changes over
time, as done by Ballinger et al. (2014) over the Beaufort Sea,
Bezeau et al. (2014) over the Canadian Arctic Archipelago,
and Fettweis et al. (2013) over Greenland. Since the aim of
CTCs is to group similar circulation situations together (Huth
et al., 2008; Philipp et al., 2010; Käsmacher and Schneider,
2011), this methodology allows for a synthetic analysis of
the atmospheric circulation over a given region at a daily
scale (i.e. the characteristic timescale of synoptic circula-
tion patterns like high pressure systems). CTCs are widely
used to compare data sets (e.g. reanalyses, general circula-
tion model outputs), to evaluate their ability to reproduce
the observed atmospheric circulation, and to detect changes
in the observed and projected atmospheric circulation (Bar-
dossy and Caspary, 1990; Kyselý and Huth, 2006; Philipp
et al., 2007; Anagnostopoulou et al., 2009; Demuzere et al.,
2009; Pastor and Casado, 2012; Fettweis et al., 2013; Belle-
flamme et al., 2013, 2014). While a wide range of classifica-
tions has been developed to study the atmospheric circulation
(e.g. leader-algorithm approaches, Fettweis et al., 2011; prin-
cipal component analyses, Huth, 2000; optimisation algo-
rithms, Philipp et al., 2007, including self-organising maps,
Käsmacher and Schneider, 2011; Bezeau et al., 2014; Hope
et al., 2014), no method can be considered as being overall
better than the others (Philipp et al., 2010). Thus, we use our
CTC that has been developed for the Arctic region and es-
pecially for Greenland (Fettweis et al., 2011). This CTC has
already been used to compare reanalysis data sets and gen-
eral circulation model outputs over Greenland with the aim
of detecting circulation changes (Belleflamme et al., 2013)
and to analyse temperature-related flow analogues over the
Greenland ice sheet (Fettweis et al., 2013).
In this study, we apply the CTC developed by Fettweis
et al. (2011) (described in Sect. 3) to daily SLP and Z500
fields from different reanalysis data sets (detailed in Sect. 2).
In Sect. 4.1.1, we put in perspective the summertime circu-
lation of 2007–2012 with the circulation variability observed
since 1871. The influence of the uncertainties of the past cir-
culation on our results is discussed in Sect. 4.1.2. After a
comparison between the SLP- and the Z500-based results in
Sect. 4.2, we analyse the links between the circulation type
frequencies and NAO and SIE in Sect. 4.3.
2 Data
We used daily SLP and Z500 data for the summer months
(JJA – June, July, and August) of five reanalysis data sets.
– The ERA-Interim reanalysis (Dee et al., 2011) from the
European Centre for Medium-Range Weather Forecasts
(ECMWF) (spatial resolution: 0.75◦× 0.75◦) over the
period 1979–2014.
– The ERA-40 reanalysis from the ECMWF (Uppala
et al., 2005) (spatial resolution: 1.125◦× 1.125◦) over
the period 1958–1978 used to extend ERA-Interim. It
should be noted that ERA-40 is known to have signif-
icant biases in its vertical temperature profile (Screen
and Simmonds, 2011), which is used in the geopotential
height calculation. However, the impact of these biases
on our Z500-based results should be limited, since the
most problematic year (i.e. 1997) is not included in the
ERA-40 period considered here.
– The NCEP/NCAR reanalysis from the National Centers
for Environmental Prediction – National Center for At-
mospheric Research (Kalnay et al., 1996) (spatial reso-
lution: 2.5◦× 2.5◦) over the period 1948–2014.
– The ERA-20C reanalysis from the ECMWF (Poli et al.,
2013) (spatial resolution: 1.125◦× 1.125◦) over the pe-
riod 1900–2010. The spread evaluating the uncertainty
of the ERA-20C data was not yet available when con-
ducting this study.
– The Twentieth Century Reanalysis version 2 (20CRv2)
(Compo et al., 2011) from the NOAA ESRL/PSD (Na-
tional Oceanic and Atmospheric Administration Earth
System Research Laboratory/Physical Sciences Divi-
sion) (spatial resolution: 2◦× 2◦) over the period 1871–
2012. The 20CRv2 data are constructed as the ensemble
mean of 56 runs. The standard deviation (called spread)
of this ensemble mean is also given for each variable
(in our case SLP and Z500). We used it to estimate the
uncertainty of our 20CRv2-based results, in particular
before the overlapping period with the other reanalysis
data sets when the assimilated observations are sparse.
In fact, the spread, and thus the uncertainty of the recon-
structed atmospheric circulation in 20CRv2, strongly
depends on the number of pressure observations, which
is low before 1940 (Compo et al., 2011).
It is important to note that only SLP, sea surface tempera-
ture (SST), and sea ice are assimilated into 20CRv2, and SLP,
SST, and oceanic near-surface air temperature and wind into
ERA-20C. The other reanalyses also assimilate satellite and
upper air data every 6 h. Therefore, 20CRv2 and ERA-20C
are a priori less reliable than the other more constrained re-
analyses.
Additionally, daily sea ice cover data from the ERA-
Interim are also used over the 1980–2014 JJA period.
The Cryosphere, 9, 53–64, 2015 www.the-cryosphere.net/9/53/2015/

A. Belleflamme et al.: Recent summer Arctic circulation anomalies in a historical perspective 55
Figure 1. The SLP-based reference circulation types over the 1980–2012 (JJA) period for the ERA-Interim are represented by the solid black
isobars (in hPa). The SLP anomaly (in colours) is calculated as the difference between the class mean SLP and the seasonal mean SLP over
1980–2012. The average frequency of each type is also given.
Since the reanalyses have different spatial resolutions, and
to avoid the problem of decreasing pixel area near the pole
when using geographic coordinates, all reanalysis outputs
have been linearly interpolated to a regular grid with a spatial
resolution of 100 km. Our integration domain has a size of
5000× 6000 km and covers the whole Arctic Ocean, Green-
land, and the northern part of the Atlantic Ocean (Fig. 1).
Finally, monthly NAO data over the period 1871–2013
were obtained from the Climatic Research Unit (CRU). This
NAO index is defined as the normalised difference between
the SLP measured in the Azores (Ponta Delgada) and Iceland
(Reykjavik).
3 Method
The SLP data from the different reanalyses were compared
using the automatic circulation type classification developed
by Fettweis et al. (2011) and used over Greenland by Belle-
flamme et al. (2013) and Fettweis et al. (2013), and over Eu-
rope by Belleflamme et al. (2014). This CTC is considered a
leader-algorithm method (Philipp et al., 2010), because each
class is defined by a reference day and a similarity threshold.
After having calculated the similarity index (see below) be-
tween all pairs of days of the data set, the day counting the
most similar days (i.e. with a similarity index value above the
similarity threshold) is selected as the reference day for the
first type. All days considered as similar to this reference day
are grouped into this type. The same procedure is repeated
type by type over the remaining days of the data set. This
whole process is repeated many times for various similarity
thresholds in order to optimise the classification. The similar-
ity between the days is gauged by the Spearman rank corre-
lation coefficient. The key feature of using correlation-based
similarity indices is that they are not influenced by the aver-
age SLP of a day, but only by its spatial pattern (Philipp et al.,
2007). Thus, in contrary to Fettweis et al. (2011, 2013), who
used the Euclidean distance as similarity index and Z500 to
take into account the influence of the temperature on the up-
per level circulation, we used the Spearman rank correlation
and SLP to focus exclusively on the circulation pattern. In
order to minimise the influence of eventual temperature bi-
www.the-cryosphere.net/9/53/2015/ The Cryosphere, 9, 53–64, 2015

56 A. Belleflamme et al.: Recent summer Arctic circulation anomalies in a historical perspective
ases into the SLP retrieving computation, especially over el-
evated regions like Greenland (Lindsay et al., 2014), we only
considered oceanic pixels when performing the SLP-based
classification. For comparison, the same procedure was done
using Z500, but all pixels of the domain were taken into ac-
count, since there is much less influence of the surface and
its elevation at this level.
This CTC is automatic, meaning that the circulation types
are built by the algorithm and not predefined by the user.
This implies that the circulation types obtained using differ-
ent data sets will be different and thus difficult to compare.
To overcome this problem, we “projected” the types of a ref-
erence data set onto the other data sets, i.e. the types obtained
for the reference data set were imposed as predefined types
for the other data sets, as proposed by Huth (2000) and imple-
mented by Belleflamme et al. (2013, 2014). Since the types
are now the same for all data sets, they can easily be com-
pared. Lindsay et al. (2014) compared seven reanalysis data
sets (including ERA-Interim, NCEP/NCAR, and 20CRv2)
over the Arctic for the 1980–2009 period and they conclude
that the ERA-Interim gives the best results for various vari-
ables (e.g. SLP, T2M, wind speed) compared with observa-
tions. Thus, we used the ERA-Interim data set over the 1980–
2012 period, which is common to all reanalyses used here
(except ERA-20C) and includes the 2007–2012 circulation
anomaly as the reference data set.
As said above, the 20CRv2 reanalysis SLP data are given
as an ensemble mean of 56 runs and the spread around
this ensemble mean. To evaluate the uncertainty from the
20CRv2-based data estimated by this spread, we have per-
formed 20 000 classification runs (note that using 5000 or
10 000 runs does not affect the results). For each run, the
daily spread, multiplied by a factor varying randomly be-
tween −1 and 1, is added to the daily SLP. Due to the high
number of runs, all multiplying factor values have equal like-
lihood and their average tends to zero. Thus, no systematic
SLP bias is introduced in the 20 000-run ensemble. If adding
or subtracting the spread implies a sufficient alteration in
the SLP pattern of a given day, this day could be classified
into another circulation type, compared to the run using the
20CRv2 SLP ensemble mean (called hereafter 20CRv2 ref-
erence run). The same procedure has been done for Z500.
In our CTC, the number of classes is fixed by the user. On
the basis of the ERA-Interim SLP over the 1980–2012 sum-
mers (JJA), six circulation types were retained. This is the
lowest number of classes needed to obtain the two patterns
in which we are the most interested in (i.e. the Beaufort Sea
High and the Greenland High) as well marked types. Min-
imising the number of types allows for a more concise and
synthetic analysis. Nevertheless, the main conclusions of this
study are the same when using 5, 8, or 10 types. The six ob-
tained circulation types can be described as follows (Fig. 1):
type 1 is characterised by a low pressure system centred over
the Arctic Ocean and represents about 14 % of the classi-
fied days during 1980–2012. However, type 2 is marked by a
high pressure located over the Beaufort Sea and the western
part of the Arctic Ocean. Type 3 presents a strong Icelandic
Low and higher pressure along the Russian coast. Type 4 is
the Greenland High type and accounts for 24 % of the classi-
fied days. Types 5 and 6 show opposite patterns, with a low
(respectively, high) pressure east of Svalbard surrounded by
high (respectively, low) pressure systems. It is important to
note that type 6 also contains the unclassified days, i.e. the
days for which the similarity index values with regard to the
reference days of all types lie below the similarity thresh-
olds of these types (< 1 % of the classified days for the ERA-
Interim reference classification).
Despite the difference between the SLP- and Z500-based
circulation types, six types were also retained for Z500
(Fig. S1 in the Supplement). Type 1 is characterised by a
strong depression centred over the Arctic Ocean. This de-
pression is located further to the east in type 2, which also
presents a slight ridge over Greenland. In type 3, the de-
pression is situated over the Greenland and Svalbard region.
Type 4 is marked by two depressions, the Icelandic Low and
a low over the Chukchi Sea, and a ridge over the Barents
and Kara seas. Type 5 combines the Greenland High and the
Beaufort Sea High. Finally, type 6 shows a high pressure sys-
tem over the Arctic Ocean, while the depression is split into
three parts (i.e. the Icelandic Low, a low over the Kara Sea,
and a low over the Canadian Arctic Archipelago).
4 Results
There is a very good agreement between the frequencies of
the circulation types and their evolution over time for all re-
analyses over 1958–2012, as well SLP (Fig. 2) and Z500
(Fig. S2). Nevertheless, two notable differences have to be
pointed out. The first difference is a systematic overestima-
tion of about 4–6 % of the frequency of type 3 at the expense
of type 2 by 20CRv2 compared to the full constrained re-
analyses (ERA-40/ERA-Interim and NCEP/NCAR) for SLP.
This bias is in agreement with the findings of Lindsay et al.
(2014), who report a positive SLP bias over Asia for 20CRv2
(using monthly data), since type 3 is characterised by an an-
ticyclone over the Asian part of the domain, in contrary to
type 2. The second difference is an overestimation of type 2
at the expense of type 1 and to a lesser extent of type 3 by
ERA-20C over its whole period (1900–2010) compared to
all the other reanalyses used here, for the SLP-based classi-
fication. This frequency bias is particularly important before
1950 compared to 20CRv2. In fact, ERA-20C overestimates
SLP over the whole Arctic Ocean, and especially over the
Beaufort Sea, compared to the other reanalyses (not shown).
This implies that more ERA-20C days are considered as sim-
ilar to type 2 (Beaufort Sea–Arctic Ocean High) at the ex-
pense of type 1 (low pressure over the Arctic Ocean) and
type 3 (low pressure over Greenland and the Canadian Arctic
Archipelago). The ERA-20C SLP bias is particularly impor-
The Cryosphere, 9, 53–64, 2015 www.the-cryosphere.net/9/53/2015/

A. Belleflamme et al.: Recent summer Arctic circulation anomalies in a historical perspective 57
Figure 2. The dotted light lines represent the annual (JJA) SLP-based circulation type frequencies for ERA-Interim (1979–2014) and ERA-
40 (1958–1978), NCEP/NCAR (1948–2014), ERA-20C (1900–2010), and the 20CRv2 reference run and the 20CRv2 20 000-run ensemble
mean (1871–2012). The corresponding solid lines represent the 10-year binomial running mean frequencies. For the 20CRv2 20 000-run
ensemble, the 10th and the 90th percentiles as well as the 1 standard deviation interval around the mean are also given.
tant before 1950 compared to 20CRv2, but it is still present
over the last decades compared to ERA-40, ERA-Interim,
and NCEP/NCAR. However, since 20CRv2 also shows sys-
tematic biases, it is not possible to consider one of these two
reanalyses as more reliable than the other.
4.1 Sea level pressure
4.1.1 Circulation type frequency evolution
The frequencies of type 2 (Beaufort Sea–Arctic Ocean High)
and type 4 (Greenland High) are almost twice as large during
2007–2012 compared with the 1871–2014 average (Fig. 2).
These frequency anomalies are similar to those found by
Ballinger and Sheridan (2014) and Ballinger et al. (2014)
for the Beaufort Sea, by Fettweis et al. (2013) for Green-
land, and by Bezeau et al. (2014) for the Canadian Arc-
tic Archipelago. They are compensated by a decrease in
frequency of type 3 by a factor of 2, and to a lesser ex-
tent of type 1. Both types are characterised by a low pres-
sure system over the Arctic. Over the record, types 2 and 4
never experienced such high frequencies over several con-
secutive summers since 1871. Between 2007 and 2012, two
summers for type 2 and five summers for type 4 presented
a higher frequency than the 90th percentile frequency, mean-
ing a return period of about 10 years (Table 1). However,
20CRv2 suggests that similar circulation type frequencies
were observed before 1880; although, the uncertainty is very
high over that period. Moreover, type 4 shows some sum-
mers with anomalously high frequencies between 1891 and
1896. Despite the frequency biases described above, ERA-
20C shows many summers with exceptionally high frequen-
cies of type 2 between 1923 and 1931. Thus, on the basis of
ERA-20C, the anomalously warm conditions and the associ-
ated high surface mass loss rates observed over the Green-
www.the-cryosphere.net/9/53/2015/ The Cryosphere, 9, 53–64, 2015

58 A. Belleflamme et al.: Recent summer Arctic circulation anomalies in a historical perspective
Table 1. For the SLP-based circulation types, which show a fre-
quency increase over the 2007–2012 period, the summers present-
ing a higher frequency than the 90th percentile frequency (i.e. a 10-
year return period) on the basis of the 20CRv2 reference run over
1871–2012 (JJA) are listed chronologically.
Type 2 Type 4
1873 1871
1877 1872
1879 1880
1891 1928
1897 1957
1911 1958
1912 1971
1923 1977
1948 1980
1960 1993
1965 2007
1982 2008
1987 2009
2007 2011
2011 2012
land ice sheet over that period (Chylek et al., 2006; Fettweis
et al., 2008) could be attributed to atmospheric circulation
anomalies. In contrast, the 20CRv2 circulation type frequen-
cies do not present any anomalies over the 1923–1931 pe-
riod. Finally, atmospheric circulation conditions similar to
2007–2012 are observed around 1957–1960 for all reanal-
yses used here. Nevertheless, these four periods were shorter
than 2007–2012 and not marked by as many anomalous sum-
mers, except for the 1891–1896 period for 20CRv2 type 4
and the 1923–1931 period for ERA-20C type 2. The anoma-
lies of the frequencies of types 2 and 4 (+20 %), and type 3
(−15 to −20 %), are much higher than their interannual fre-
quency variability (with a standard deviation over the 1871–
2012 period for the 20CRv2 20 000-run ensemble mean of
about 7.7, 9.7, and 8.2 % for types 2, 3, and 4, respectively).
The frequency anomalies of the other types are of the same
order than their interannual variability (with a standard devi-
ation of about 9.4, 5, and 5.6 % for types 1, 5, and 6, respec-
tively). The exceptional frequency anomalies of 2007–2012
could suggest that they are related to global warming. How-
ever, the 2013 summer shows opposite extremes. Neverthe-
less, the circulation type frequencies of the 2014 summer are
of the same order as the 2007–2012 average. This suggests
that, even if the 2007–2012 circulation anomalies might be
related to global warming, this link is not straightforward,
and the natural variability could largely exceed the global
warming induced signal.
The circulation type frequency anomalies are not due to
changes in the persistence (i.e. the duration of consecutive
days grouped in the same type). In fact, there is a persistence
increase for types 2 and 4, and a decrease for type 3 over
2007–2012 with regard to the overall average (not shown).
But a more detailed analysis shows that these persistence
changes are artefacts due to the frequency anomalies. Note
that the 20CRv2 20 000-run ensemble persistence cannot be
used for a persistence analysis. Since the spread is added with
a multiplying factor determined randomly for each day, the
continuity of the atmospheric circulation over time, i.e. the
transitions between the circulation types and the succession
of the types themselves, is not preserved.
The analysis of the 20CRv2 reference run monthly circu-
lation type frequencies shows that the 2007–2012 frequency
anomalies affect all three months (JJA). In this way, the
2007–2012 period differs from the other anomalous peri-
ods (1871–1880, 1891–1896, 1923–1931, and 1957–1960).
For example, the positive frequency anomaly of type 2 over
1958–1960 is due to high frequencies during August and
to a lesser extent during June. For the year 1957, type 4
shows frequencies far above normal for June and July, but
not for August. The 1871–1880 period has many summers
with above normal frequencies for type 4, but no systematic
frequency anomaly appearing in several summers can be de-
tected for one particular month.
4.1.2 20CRv2 frequency uncertainty
The uncertainty of the 20CRv2 frequencies strongly de-
creases between 1930 and 1950 to become insignificant over
the 4 or 5 last decades for all types (Fig. 2). It is interesting
to observe that this uncertainty remains relatively constant
over time before 1940, at a level of around 7–11 % for the
first four types, and around 4–6 % for types 5 and 6. More-
over, the 20 000-run ensemble mean frequency, its standard
deviation, and its 10th and 90th percentiles show an evolution
over time that is almost parallel to the 20CRv2 reference run.
There is no smoothing of the interannual variability, which
remains similar to the variability of the last decades when
going back in time. Finally, the last class, which groups the
unclassified days, does not show any increase towards the
beginning of the 20CRv2 period, meaning that there are not
more days that do not correspond to the main types before
1940 than over the last 3 decades (1980–2012). Thus, even if
there is some uncertainty about the exact frequencies before
1940, there is high confidence in the magnitude and the time
evolution of the circulation type frequencies.
There are significant circulation type frequency differ-
ences between the 20 000-run ensemble mean and the
20CRv2 reference run before 1940. In particular, the fre-
quencies of types 1 and 2 are strongly overestimated by
the 20 000-run ensemble compared to the 20CRv2 reference
run. The 20CRv2 reference run annual frequencies approxi-
mate the 10th percentile of the 20 000-run ensemble for these
two types. This is compensated by an underestimation of
the frequencies of the other types by the 20 000-run ensem-
ble whose 90th percentile frequencies are of the same order
as the 20CRv2 reference run frequencies. These frequency
The Cryosphere, 9, 53–64, 2015 www.the-cryosphere.net/9/53/2015/

A. Belleflamme et al.: Recent summer Arctic circulation anomalies in a historical perspective 59
shifts are due to the pattern of the SLP spread, which is much
higher over the Arctic Ocean than over the rest of the domain
for the 1871–1930 period (Fig. 3, bottom panels). Conse-
quently, when adding (with a multiplying factor of between 0
and 1) the SLP spread, the pattern of the SLP daily mean is
changed towards a more anticyclonic pattern over the Arctic
Ocean, making it similar to type 2. In the same way, when
subtracting (with a multiplying factor of between −1 and 0)
the SLP spread, the SLP daily mean becomes more similar to
type 1, which presents a low pressure over the Arctic Ocean.
Furthermore, since the Spearman rank correlation coefficient
is not sensitive to the average SLP, but only to the SLP pat-
tern, the evolution of the frequency uncertainty over time is
rather more related to the spatial maximum and the standard
deviation of the SLP spread than to its average. As shown
in Fig. 3 (top panel), the average SLP spread over the Arctic
region decreases already at the beginning of the 20CRv2 era,
while the spatial maximum and the standard deviation of the
SLP spread remain high until around 1940.
4.2 Geopotential height at 500 hPa
The detected frequency changes are similar to those of SLP.
The Greenland High and the Beaufort Sea High (types 2
and 5) were almost twice as frequent over 2007–2012 than
over the whole 1871–2014 period (Fig. S2, Table S1 in the
Supplement). For type 2 (Greenland High), two of the four
other high frequency periods found for SLP are also de-
tected: 1871–1880 and 1891–1896. The 1957–1960 period
is not exceptional on the basis of Z500. This is in agreement
with the findings of Bezeau et al. (2014), who showed on
the basis of NCEP/NCAR Z500 that the 2007–2012 period
reached record values since 1948, despite more frequent anti-
cyclones over the Canadian Arctic Archipelago before 1960.
The 1923–1931 period, which is only exceptional on the ba-
sis of ERA-20C SLP, is not anomalous at the Z500 level.
As for SLP, the Z500 spread plays an important role in
the frequency distribution before 1940, when it is the high-
est (Fig. S3, top panel). Before 1940, the frequencies of the
20CRv2 reference run and to a lesser extent of the 20 000-run
ensemble mean are much higher for type 1 (about 20 %) and
type 2 (about 10 %) with respect to the second half of the
20th century. This is compensated by particularly low fre-
quencies of types 3, 5, and 6, and to a lesser extent of type 4.
These frequency shifts are probably due to the uncertainties
in the 20CRv2 data before 1940 since they are lower for the
20 000-run ensemble compared to the 20CRv2 reference run.
Moreover, as for SLP, the frequency differences between the
20CRv2 reference run and the 20 000-run ensemble mean
can be explained by the pattern of the Z500 spread, which is
very close to the SLP spread pattern (Fig. S3, bottom panels).
When subtracting the spread, the circulation tends to become
more cyclonic over the Arctic Ocean, favouring the shift of
days into types 1, 2, and 4. In the same way, adding the
spread gives a more anticyclonic character to the circulation.
Figure 3. Top: the average SLP spread and its standard deviation
are calculated as the seasonal (JJA) average 20CRv2 spread and
its standard deviation over the oceanic pixels of our domain. The
maximum SLP spread is the value of the oceanic pixel showing the
highest seasonal (JJA) average spread of each year. Bottom: the SLP
spread is calculated as the average 20CRv2 spread over the 1871–
1930 summers (JJA), left, and over the 1950–2012 summers, right.
This favours types 3, 5, and 6. But types 1 and 2 count for
about 80 % of all days before 1940. Therefore, subtracting
the spread has only a limited impact on the frequency distri-
bution, since it favours types 1 and 2, which already contain
most of the days. However, adding the spread at the expense
of types 1 and 2 induces many more frequency changes, since
more days can be shifted into another type.
4.3 Links with other variables
4.3.1 North Atlantic Oscillation
The 30-year running correlation between the circulation type
frequencies and the JJA CRU NAO index (calculated as the
average of the JJA monthly CRU NAO index values) shows
www.the-cryosphere.net/9/53/2015/ The Cryosphere, 9, 53–64, 2015
60 A. Belleflamme et al.: Recent summer Arctic circulation anomalies in a historical perspective
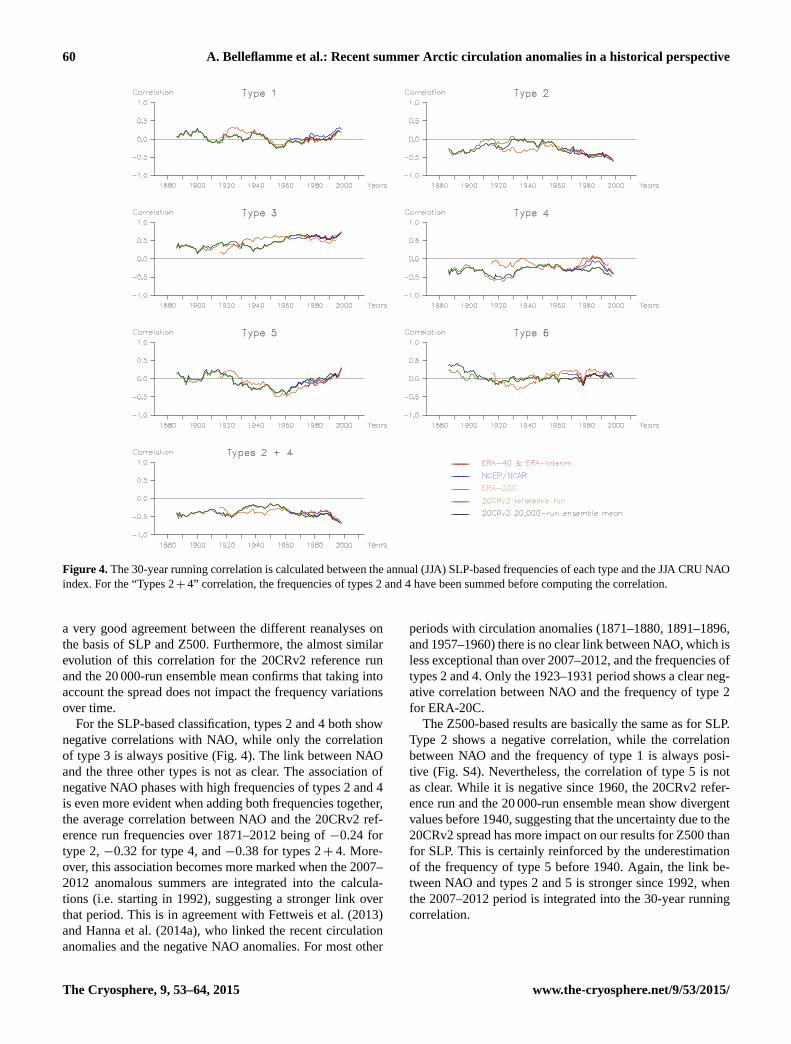
Figure 4. The 30-year running correlation is calculated between the annual (JJA) SLP-based frequencies of each type and the JJA CRU NAO
index. For the “Types 2+ 4” correlation, the frequencies of types 2 and 4 have been summed before computing the correlation.
a very good agreement between the different reanalyses on
the basis of SLP and Z500. Furthermore, the almost similar
evolution of this correlation for the 20CRv2 reference run
and the 20 000-run ensemble mean confirms that taking into
account the spread does not impact the frequency variations
over time.
For the SLP-based classification, types 2 and 4 both show
negative correlations with NAO, while only the correlation
of type 3 is always positive (Fig. 4). The link between NAO
and the three other types is not as clear. The association of
negative NAO phases with high frequencies of types 2 and 4
is even more evident when adding both frequencies together,
the average correlation between NAO and the 20CRv2 ref-
erence run frequencies over 1871–2012 being of −0.24 for
type 2, −0.32 for type 4, and −0.38 for types 2+ 4. More-
over, this association becomes more marked when the 2007–
2012 anomalous summers are integrated into the calcula-
tions (i.e. starting in 1992), suggesting a stronger link over
that period. This is in agreement with Fettweis et al. (2013)
and Hanna et al. (2014a), who linked the recent circulation
anomalies and the negative NAO anomalies. For most other
periods with circulation anomalies (1871–1880, 1891–1896,
and 1957–1960) there is no clear link between NAO, which is
less exceptional than over 2007–2012, and the frequencies of
types 2 and 4. Only the 1923–1931 period shows a clear neg-
ative correlation between NAO and the frequency of type 2
for ERA-20C.
The Z500-based results are basically the same as for SLP.
Type 2 shows a negative correlation, while the correlation
between NAO and the frequency of type 1 is always posi-
tive (Fig. S4). Nevertheless, the correlation of type 5 is not
as clear. While it is negative since 1960, the 20CRv2 refer-
ence run and the 20 000-run ensemble mean show divergent
values before 1940, suggesting that the uncertainty due to the
20CRv2 spread has more impact on our results for Z500 than
for SLP. This is certainly reinforced by the underestimation
of the frequency of type 5 before 1940. Again, the link be-
tween NAO and types 2 and 5 is stronger since 1992, when
the 2007–2012 period is integrated into the 30-year running
correlation.
The Cryosphere, 9, 53–64, 2015 www.the-cryosphere.net/9/53/2015/

A. Belleflamme et al.: Recent summer Arctic circulation anomalies in a historical perspective 61
4.3.2 Sea ice extent
There is a link between the circulation anomalies and the
summertime SIE loss. As indicated by the correlation be-
tween the ERA-Interim SIE loss and the ERA-Interim SLP-
based circulation type frequencies over 1980–2014, SIE loss
is only favoured by types 2 (r =−0.47) and 4 (r =−0.52),
while types 1 (r = 0.50) and 3 (r = 0.48) tend to mitigate it.
Types 5 (r = 0.17) and 6 (r = 0.22) do not have important
impacts on the SIE loss. When considering the sum of the
frequencies of types 2 and 4, the relation appears to be even
clearer with a correlation of −0.65. This means that the fre-
quency increase of types 2 and 4 could partly explain the
summertime record Arctic SIE loss observed over the last
decade.
For the Z500-based classification, only type 5 (r =−0.54)
can be clearly related to enhanced SIE loss and type 1
(r = 0.57) to mitigated SIE loss. For the remaining types, the
correlation varies between −0.20 and −0.04. As said above,
type 5 combines the Beaufort Sea High and the Greenland
High. Type 2 shows only a slight ridge over Greenland and a
depression centred over the Arctic Ocean, far away from the
Russian coast. Thus, the conditions favouring sea ice export
through the Fram Strait and the Barents Sea are not met for
this type, as confirmed by its poor correlation (r =−0.20)
with SIE.
Our results seem to confirm those of Wang et al. (2009)
and Overland et al. (2012), who showed that the record Arc-
tic sea ice loss observed over the last years can partly be
attributed to more frequent positive Arctic dipole anomaly
(DA) phases. In fact, positive DA phases are characterised
by a higher occurrence of a high pressure system over the
Canadian Arctic Archipelago and Greenland and a low pres-
sure system over the Kara and Laptev seas (Wu et al., 2006).
Thus, at first glance, the SLP-based types 2 and 4 can both be
associated with a positive DA phase, while the other types,
particularly types 1 and 3, can be related to a negative DA
phase. During positive DA phases, the sea ice export from the
Arctic Basin through the Fram Strait and the Barents Sea is
strongly enhanced, which is particularly effective for impor-
tant sea ice loss during summer (Wang et al., 2009). Further-
more, our results agree with those of Simmonds and Keay
(2009) and Screen et al. (2011), who have shown that SIE in
September is lower in years characterised by a weaker than
normal summertime Arctic cyclonic activity, which induces
a higher average SLP over the region.
5 Conclusions
We have used an automatic circulation type classification to
study the anomalies in the summertime (JJA) atmospheric
circulation based on (i) the sea level pressure and (ii) the
500 hPa geopotential height over the Arctic region over the
1871–2014 period. Three reanalysis data sets were used
over the second half of the 20th century (ERA-Interim as
reference, ERA-40, and NCEP/NCAR). The 20CRv2 and
ERA-20C reanalyses were used over the 1871–2012 and
1900–2010 periods, respectively, to evaluate if circulation
anomalies similar to 2007–2012 could already have oc-
curred. Furthermore, since 20CRv2 data are given as a 56-
member ensemble mean with its standard deviation (spread),
20 000 runs have been done to take into account the 20CRv2
uncertainty. For these runs, the spread multiplied by a factor
varying randomly between −1 and 1 has been added to the
daily mean.
Despite an uncertainty of about 5–11 % for the circulation
type frequencies before 1930, the magnitude and the time
evolution of the frequency anomalies can be reasonably well
estimated using 20CRv2 SLP. Furthermore, this uncertainty
becomes less significant after 1950, due to improved assimi-
lated data availability and reliability. The strong impact of the
number and quality of observational data on the reliability of
reanalysis data sets is also highlighted by the important dis-
crepancies between 20CRv2 and ERA-20C during the first
half of the 20th century. These discrepancies can have strong
impacts on the interpretation of the results. For example, the
1923–1931 warmer summers over Greenland (Chylek et al.,
2006) could be attributed to anomalous atmospheric circu-
lation conditions according to ERA-20C but not to 20CRv2.
The particular spatial pattern of the 20CRv2 spread, i.e. high-
est over the Arctic Ocean, causes a strong overestimation
of type 1 (low pressure over the Arctic Ocean) and type 2
(high pressure over the Arctic Ocean) at the expense of all
other types for the SLP-based 20 000-run ensemble com-
pared to the 20CRv2 reference run. Thus, it is interesting
to note that, although no systematic SLP bias is introduced
through adding the spread, systematic circulation type fre-
quency shifts appear. In a similar way, the Z500 spread also
introduces artefacts in the 20 000-run ensemble. This shows
the importance of accounting for the spread of the 20CRv2
data to get an estimation of the range of plausible results.
We have found the same summertime circulation anoma-
lies as described by other authors (Fettweis et al., 2013;
Ballinger et al., 2014), i.e. a doubling in frequency of the
Beaufort Sea–Arctic Ocean High and of the Greenland High
over 2007–2012. Only four other periods (1871–1880, 1891–
1896, 1923–1931, and 1957–1960) of similar circulation
anomalies were detected but the successions of summers
with such anomalies are shorter than in the 2000s. These
anomalies all largely exceed the interannual variability of
the circulation type frequencies. Nevertheless, it is not pos-
sible to attribute the circulation anomalies over 2007–2012
to global warming. First, these anomalies are observed over
a too short period, so that they could simply be an excep-
tionally strong deviance from the average circulation. In this
way, the 2013 summer was marked by opposite frequency
extremes, positive NAO index values, low melting of the
Greenland ice sheet, and lower Arctic sea ice decline com-
pared to 2007–2012. Our findings corroborate those of Ra-
www.the-cryosphere.net/9/53/2015/ The Cryosphere, 9, 53–64, 2015

62 A. Belleflamme et al.: Recent summer Arctic circulation anomalies in a historical perspective
jewicz and Marshall (2014), who state that the 2013 JJA
mean Z500 over Greenland was significantly lower than the
average over the last 7 decades, which contrasts with the
strong positive anomaly of the preceding summers. The op-
posite extreme anomalies between 2012 (positive anomaly)
and 2013 (negative anomaly) have also been highlighted by
Hanna et al. (2014b) on the basis of the Greenland Blocking
Index. Secondly, as said above, similar circulation conditions
were observed before 1880 and around 1891–1896, when
the Arctic climate was likely to have been much colder than
now. Furthermore, Ding et al. (2014) suggest that the geopo-
tential height increase observed over north-eastern Canada
and Greenland, as well as the negative NAO trend, could
be due to SST changes in the tropical Pacific that induce
changes in the Rossby wave train affecting the North Amer-
ican region. Since the tropical SST changes are not repro-
duced by general circulation models under current green-
house gas concentrations, Ding et al. (2014) conclude that
these changes are due to the natural variability of the cli-
matic system. However, Wu et al. (2014) showed that the pro-
gressive intensification of the Beaufort Sea High over 1979–
2005 can only be reproduced by climate models by including
the observed greenhouse gas concentration increase. More-
over, Screen et al. (2012) have shown that various forcings
are needed to explain the observed Arctic warming: while
Arctic sea ice and associated SST changes, as well as re-
mote SST changes (corroborating the conclusions of Ding
et al., 2014) are the main drivers of the winter warming, the
summertime temperature increase could mainly be due to in-
creased radiative forcing, suggesting a role of global warm-
ing. Matsumura et al. (2014) have found a significant relation
between the earlier spring snowmelt over the Eurasian con-
tinent and the enhanced summertime Arctic anticyclonic cir-
culation. The earlier snowmelt could induce a negative SLP
anomaly over Eurasia, which is compensated by an SLP in-
crease over the western part of the Arctic region. Finally,
Bezeau et al. (2014) conclude that the anomalous anticy-
clonic patterns over the Arctic over 2007–2012 are due to
combined effects of sea ice loss, snow extent reduction, and
enhanced meridional heat advection. Thus, while it is widely
admitted that the Arctic region experiences a strong warm-
ing since some years (Screen et al., 2012), the complexity
of the climate of this region due to its multiple internal and
external forcings and feedbacks does not allow us to solve
the question of whether the 2007–2012 circulation anomaly
is (mainly) due to global warming or to natural variability.
Our findings corroborate those of Ballinger et al. (2014)
and Overland et al. (2012), who found that the Beaufort Sea
High is associated with anticyclonic conditions over Green-
land. This is particularly clear for the Z500-based classifi-
cation, where type 5 combines both the Beaufort Sea High
and the Greenland High. Moreover, the circulation type fre-
quency anomalies observed over the 2007–2012 period on
the basis of SLP and Z500 are linked with the observed neg-
ative NAO trend (Hanna et al., 2014a). Thus, our results
seem to be in agreement with the hypothesis of Overland
et al. (2012), who suggest that recently more frequent Beau-
fort Sea High and Greenland High pressure systems might
be part of an enhanced North American blocking mecha-
nism. Additionally, we have shown that the 2007–2012 cir-
culation anomaly affects the whole tropospheric circulation,
from the surface (SLP) to upper levels (Z500). In this way,
Mahieu et al. (2014) have shown that increased HCl concen-
trations observed since 2007 in the lower stratosphere of the
Northern Hemisphere can be attributed to atmospheric cir-
culation anomalies. This confirms once more that the 2007–
2012 summertime Arctic circulation anomaly analysed here
could be part of a major climatic anomaly extending beyond
the Arctic region.
Finally, the observed summertime decrease in sea ice ex-
tent (SIE) between 1980 and 2014 seems to be partly due
to the higher occurrence of the Beaufort Sea High and the
Greenland High. This means that, in addition to the factors
influencing the Arctic sea ice melt cited by Stroeve et al.
(2014) and Parkinson (2014) (e.g. generalised warming over
the Arctic, earlier melt onset, enhanced ice–albedo feedback,
increased SST, and a delayed autumn freeze-up), the JJA at-
mospheric circulation could also play a significant role in the
sea ice melt. However, some studies (e.g. Petoukhov and Se-
menov, 2010; Inoue et al., 2012; Bezeau et al., 2014) suggest
that atmospheric circulation changes can be induced by SIE
anomalies. Therefore, the recent SIE decrease could be a trig-
ger of the recent atmospheric circulation change inducing in
turn a SIE decrease, suggesting a positive feedback.
The Supplement related to this article is available online
at doi:10.5194/tc-9-53-2015-supplement.
Acknowledgements. NCEP/NCAR reanalysis data were provided
by the NOAA/OAR/ESRL PSD, Boulder, Colorado, USA, from
their website at http://www.esrl.noaa.gov/psd/.
The ECMWF ERA-40, ERA-Interim, and ERA-20C reanalysis
data used in this study were obtained from the ECMWF Data Server
(http://www.ecmwf.int).
Support for the Twentieth Century Reanalysis (20CR) Project
data set was provided by the US Department of Energy, Of-
fice of Science Innovative and Novel Computational Impact on
Theory and Experiment (DOE INCITE) program, by the Office
of Biological and Environmental Research (BER), and by the
National Oceanic and Atmospheric Administration (NOAA) Cli-
mate Program Office (http://www.esrl.noaa.gov/psd/data/gridded/
data.20thC_ReanV2.html).
The monthly NAO data were obtained from the University of
East Anglia (UEA) Climatic Research Unit (CRU) website (http:
//www.cru.uea.ac.uk/cru/data/nao/).
This paper is published with the support of the Belgian Uni-
versity Foundation. Cet article est publié avec le concours de la
Fondation Universitaire de Belgique.
Edited by: M. van den Broeke
The Cryosphere, 9, 53–64, 2015 www.the-cryosphere.net/9/53/2015/

A. Belleflamme et al.: Recent summer Arctic circulation anomalies in a historical perspective 63
References
Anagnostopoulou, C., Tolika, K., and Maheras, P.: Classification of
circulation types: a new flexible automated approach applicable
to NCEP and GCM datasets, Theor. Appl. Climatol., 96, 3–15,
doi:10.1007/s00704-008-0032-6, 2009.
Ballinger, T., and Sheridan, S.: Associations between circulation
pattern frequencies and sea ice minima in the western Arctic, Int.
J. Climatol., 34, 1385–1394, doi:10.1002/joc.3767, 2014.
Ballinger, T., Sheridan, S., and Hanna, E.: Short Communi-
cation “Resolving the Beaufort Sea High using synoptic
climatological methods”, Int. J. Climatol., 34, 3312–3319,
doi:10.1002/joc.3907, 2014.
Bardossy, A. and Caspary, H.-J.: Detection of climate change
in Europe by analyzing European atmospheric circulation pat-
terns from 1881 to 1989, Theor. Appl. Climatol., 42, 155–167,
doi:10.1007/BF00866871, 1990.
Belleflamme, A., Fettweis, X., Lang, C., and Erpicum, M.: Cur-
rent and future atmospheric circulation at 500 hPa over Green-
land simulated by the CMIP3 and CMIP5 global models, Clim.
Dynam., 41, 2061–2080, doi:10.1007/s00382-012-1538-2, 2013.
Belleflamme, A., Fettweis, X., and Erpicum, M.: Do global
warming-induced circulation pattern changes affect temperature
and precipitation over Europe during summer?, Int. J. Climatol.,
doi:10.1002/joc.4070, in press, 2014.
Bezeau, P., Sharp, M., and Gascon, G.: Variability in summer an-
ticyclonic circulation over the Canadian Arctic Archipelago and
west Greenland in the late 20th/early 21st centuries and its effect
on glacier mass balance, Int. J. Climatol., doi:10.1002/joc.4000,
2014.
Chylek, P., Dubey, M. K., and Lesins, G.: Greenland warming of
1920–1930 and 1995–2005, Geophys. Res. Lett., 33, L11707,
doi:10.1029/2006GL026510, 2006.
Compo, G., Whitaker, J., Sardeshmukh, P., Matsui, N., Allan, R.,
Yin, X., Gleason, B., Vose, R., Rutledge, G., Bessemoulin, P.,
Brönnimann, S., Brunet, M., Crouthamel, R., Grant, A., Gro-
isman, P., Jones, P., Kruk, M., Kruger, A., Marshall, G.,
Maugeri, M., Mok, H., Nordli, Ø., Ross, T., Trigo, R.,
Wang, X., Woodruff, S., and Worley, S.: The twentieth cen-
tury reanalysis project, Q. J. Roy. Meteorol. Soc., 137, 1–28,
doi:10.1002/qj.776, 2011.
Dee, D., Uppala, S., Simmons, A., Berrisford, P., Poli, P.,
Kobayashi, S., Andrae, U., Balmaseda, M., Balsamo, G.,
Bauer, P., Bechtold, P., Beljaars, A., van de Berg, L., Bidlot, J.,
Bormann, N., Delsol, C., Dragani, R., Fuentes, M., Geer, A.,
Haimberger, L., Healy, S., Hersbach, H., Hólm, E., Isaksen, L.,
Kållberg, P., Köhler, M., Matricardi, M., McNally, A., Monge-
Sanz, B., Morcrette, J.-J., Park, B.-K., Peubey, C., de Ros-
nay, P., Tavolato, C., Thépaut, J.-N., and Vitart, F.: The ERA-
Interim reanalysis: configuration and performance of the data
assimilation system, Q. J. Roy. Meteorol. Soc., 137, 553–597,
doi:10.1002/qj.828, 2011.
Demuzere, M., Werner, M., van Lipzig, N., and Roeckner, E.: An
analysis of present and future ECHAM5 pressure fields using a
classification of circulation patterns, Int. J. Climatol., 29, 1796–
1810, doi:10.1002/joc.1821, 2009.
Ding, Q., Wallace, J. M., Battisti, D. S., Steig, E. J., Gallant, A. J. E.,
Kim, H.-J., and Geng, L.: Tropical forcing of the recent rapid
Arctic warming in northeastern Canada and Greenland, Nature,
509, 209–212, doi:10.1038/nature13260, 2014.
Fettweis, X., Hanna, E., Gallée, H., Huybrechts, P., and Erpicum,
M.: Estimation of the Greenland ice sheet surface mass balance
for the 20th and 21st centuries, The Cryosphere, 2, 117–129,
doi:10.5194/tc-2-117-2008, 2008.
Fettweis, X., Mabille, G., Erpicum, M., Nicolay, S., and Van den
Broeke, M.: The 1958–2009 Greenland ice sheet surface melt
and the mid-tropospheric atmospheric circulation, Clim. Dy-
nam., 36, 139–159, doi:10.1007/s00382-010-0772-8, 2011.
Fettweis, X., Hanna, E., Lang, C., Belleflamme, A., Erpicum, M.,
and Gallée, H.: Brief communication “Important role of the mid-
tropospheric atmospheric circulation in the recent surface melt
increase over the Greenland ice sheet”, The Cryosphere, 7, 241–
248, doi:10.5194/tc-7-241-2013, 2013.
Hanna, E., Cappelen, J., Fettweis, X., Huybrechts, P., Luckman, A.,
and Ribergaard, M. H.: Hydrologic response of the Greenland
ice sheet: the role of oceanographic warming, Hydrol. Process.
(Special issue: Hydrol. Effect Shrink Cryosphere), 23, 7–30,
doi:10.1002/hyp.7090, 2009.
Hanna, E., Cropper, T. E., Jones, P. D., Scaife, A. A., and Allan, R.:
Recent seasonal asymmetric changes in the NAO (a marked
summer decline and increased winter variability) and associated
changes in the AO and Greenland Blocking Index, Int. J. Clima-
tol., doi:10.1002/joc.4157, in press, 2014a.
Hanna, E., Fettweis, X., Mernild, S. H., Cappelen, J., Riber-
gaard, M. H., Shuman, C. A., Steffen, K., Wood, L., and
Mote, T. L.: Atmospheric and oceanic climate forcing of the ex-
ceptional Greenland ice sheet surface melt in summer 2012, Int.
J. Climatol., 34, 1022–1037, doi:10.1002/joc.3743, 2014b.
Hope, P., Keay, K., Pook, M., Catto, J., Simmonds, I., Mills, G.,
McIntosh, P., Risbey, J., and Berry, G.: A comparison of auto-
mated methods of front recognition for climate studies: A case
study in southwest Western Australia, Mon. Weather Rev., 142,
343–363, doi:10.1175/MWR-D-12-00252.1, 2014.
Huth, R.: A circulation classification scheme applica-
ble in GCM studies, Theor. Appl. Climatol., 67, 1–18,
doi:10.1007/s007040070012, 2000.
Huth, R., Beck, C., Philipp, A., Demuzere, M., Ustrnul, Z.,
Cahynová, M., Kyselý, J., and Tveito, O. E.: Classifica-
tions of atmospheric circulation patterns: Recent advances
and applications, Ann. NY. Acad. Sci., 1146, 105–152,
doi:10.1196/annals.1446.019, 2008.
Inoue, J., Hori, M., and Takaya, K.: The role of Barents sea ice
in the wintertime cyclone track and emergence of a warm-
Arctic cold-Siberian Anomaly, J. Climate., 25, 2561–2568,
doi:10.1175/JCLI-D-11-00449.1, 2012.
Kalnay, E., Kanamitsu, M., Kistler, R., Collins, W., Deaven, D.,
Gandin, L., Iredell, M., Saha, S., White, G., Woollen, J., Zhu, Y.,
Leetmaa, A., Reynolds, B., Chelliah, M., Ebisuzaki, W., Hig-
gins, W., Janowiak, J., Mo, K., Ropelewski, C., Wang, J.,
Jenne, R., and Joseph, D.: The NCEP/NCAR 40-Year Reanalysis
Project, B. Am. Meteorol. Soc., 77, 437–471, doi:10.1175/1520-
0477(1996)077<0437:TNYRP>2.0.CO;2, 1996.
Käsmacher, O. and Schneider, C.: An objective circulation pattern
classification for the region of Svalbard, Geogr. Ann. A., 93,
259–271, doi:10.1111/j.1468-0459.2011.00431.x, 2011.
Kyselý, J. and Huth, R.: Changes in atmospheric circulation over
Europe detected by objective and subjective methods, Theor.
Appl. Climatol., 85, 19–36, doi:10.1007/s00704-005-0164-x,
2006.
www.the-cryosphere.net/9/53/2015/ The Cryosphere, 9, 53–64, 2015
64 A. Belleflamme et al.: Recent summer Arctic circulation anomalies in a historical perspective
Lindsay, R., Wensnahan, M., Schweiger, A., and Zhang, J.: Eval-
uation of seven different atmospheric reanalysis products in
the Arctic, J. Climate., 27, 2588–2606, doi:10.1175/JCLI-D-13-
00014.1, 2014.
Mahieu, E., Chipperfield, M. P., Notholt, J., Reddmann, T., An-
derson, J., Bernath, P. F., Blumenstock, T., Coffey, M. T.,
Dhomse, S. S., Feng, W., Franco, B., Froidevaux, L., Grif-
fith, D. W. T., Hannigan, J. W., Hase, F., Hossaini, R.,
Jones, N. B., Morino, I., Murata, I., Nakajima, H., Palm, M.,
Paton-Walsh, C., Russell III, J. M., Schneider, M., Servais, C.,
Smale, D., and Walker, K. A.: Recent Northern Hemisphere
stratospheric HCl increase due to atmospheric circulation
changes, Nature, 515, 104–107, doi:10.1038/nature13857, 2014.
Matsumura, S., Zhang, X., and Yamazaki, K.: Summer Arctic atmo-
spheric circulation response to spring Eurasian snow cover and
its possible linkage to accelerated sea ice decrease, J. Climate.,
27, 6551–6558, doi:10.1175/JCLI-D-13-00549.1, 2014.
Moholdt, G., Nuth, C., Hagen, J., and Köhler, J.: Recent
elevation changes of Svalbard glaciers derived from ICE-
Sat laser altimetry, Remote Sens. Environ., 114, 2756–2767,
doi:10.1016/j.rse.2010.06.008, 2010.
Overland, J., Francis, J., Hanna, E., and Wang, M.: The recent shift
in early summer Arctic atmospheric circulation, Geophys. Res.
Lett., 39, L19804, doi:10.1029/2012GL053268, 2012.
Parkinson, C. L.: Spatially mapped reductions in the length of
the Arctic sea ice season, Geophys. Res. Lett., 41, 4316–4322,
doi:10.1002/2014GL060434, 2014.
Pastor, M. and Casado, M.: Use of circulation types classifications
to evaluate AR4 climate models over the Euro-Atlantic region,
Clim. Dynam., 39, 2059–2077, doi:10.1007/s00382-012-1449-2,
2012.
Petoukhov, V. and Semenov, V.: A link between reduced Barents-
Kara sea ice and cold winter extremes over northern continents, J.
Geophys. Res., 115, D21111, doi:10.1029/2009JD013568, 2010.
Philipp, A., Della-Marta, P., Jacobeit, J., Fereday, D., Jones, P.,
Moberg, A., and Wanner, H.: Long-term variability of daily
North Atlantic-European pressure patterns since 1850 classified
by simulated annealing clustering, J. Climate, 20, 4065–4095,
doi:10.1175/JCLI4175.1, 2007.
Philipp, A., Bartholy, J., Beck, C., Erpicum, M., Esteban, P., Fet-
tweis, X., Huth, R., James, P., Jourdain, S., Kreienkamp, F.,
Krennert, T., Lykoudis, S., Michalides, S., Pianko, K.,
Post, P., Rassilla Álvarez, D., Schiemann, R., Spekat, A., and
Tymvios, F. S.: COST733CAT – a database of weather and cir-
culation type classifications, Phys. Chem. Earth, 35, 360–373,
doi:10.1016/j.pce.2009.12.010, 2010.
Poli, P., Hersbach, H., Tan, D., Dee, D., Thépaut, J.-N., Sim-
mons, A., Peubey, C., Laloyaux, P., Komori, T., Berris-
ford, P., Dragani, R., Trémolet, Y., Hólm, E., Bonavita, M.,
Isaksen, L., and Fisher, M.: The data assimilation system
and initial performance evaluation of the ECMWF pilot re-
analysis of the 20th-century assimilating surface observa-
tions only (ERA-20C), ERA Report Series, 14, 59 pp., avail-
able at: http://old.ecmwf.int/publications/library/ecpublications/
_pdf/era/era_report_series/RS_14.pdf (last access: 17 Novem-
ber 2014), 2013.
Rajewicz, J. and Marshall, S.: Variability and trends in anticyclonic
circulation over the Greenland ice sheet, 1948–2013, Geophys.
Res. Lett., 41, 2842–2850, doi:10.1002/2014GL059255, 2014.
Screen, J. A. and Simmonds, I.: Erroneous Arctic temperature
trends in the ERA-40 reanalysis: A closer look, J. Climate., 24,
2620–2627, doi:10.1175/2010JCLI4054.1, 2011.
Screen, J. A., Simmonds, I., and Keay, K.: Dramatic interan-
nual changes of perennial Arctic sea ice linked to abnor-
mal summer storm activity, J. Geophys. Res., 116, D15105,
doi:10.1029/2011JD015847, 2011.
Screen, J. A., Deser, C., and Simmonds, I.: Local and remote
controls on observed Arctic warming, Geophys. Res. Lett., 39,
L10709, doi:10.1029/2012GL051598, 2012.
Serreze, M. C., Barrett, A. P., Stroeve, J. C., Kindig, D. N., and Hol-
land, M. M.: The emergence of surface-based Arctic amplifica-
tion, The Cryosphere, 3, 11–19, doi:10.5194/tc-3-11-2009, 2009.
Simmonds, I.: Comparing and contrasting the behaviour of Arctic
and Antarctic sea ice over the 35 year period 1979–2013, Ann.
Glaciol., 56, 18–28, doi:10.3189/2015AoG69A909, 2015.
Simmonds, I. and Keay, K.: Extraordinary September Arctic
sea ice reductions and their relationships with storm be-
havior over 1979–2008, Geophys. Res. Lett., 36, L19715,
doi:10.1029/2009GL039810, 2009.
Stroeve, J., Markus, T., Boisvert, L., Miller, J., and Bar-
rett, A.: Changes in Arctic melt season and implications
for sea ice loss, Geophys. Res. Lett., 41, 1216–1225,
doi:10.1002/2013GL058951, 2014.
Tedesco, M., Serreze, M., and Fettweis, X.: Diagnosing the extreme
surface melt event over southwestern Greenland in 2007, The
Cryosphere, 2, 159–166, doi:10.5194/tc-2-159-2008, 2008.
Uppala, S. M., Kållberg, P. W., Simmons, A. J., Andrae, U., da
Costa Bechtold, V., Fiorino, M., Gibson, J. K., Haseler, J.,
Hernandez, A., Kelly, G. A., Li, X., Onogi, K., Saarinen, S.,
Sokka, N., Allan, R. P., Andersson, E., Arpe, K., Bal-
maseda, M. A., Beljaars, A. C. M., van de Berg, L., Bid-
lot, J., Bormann, N., Caires, S., Chevallier, F., Dethof, A.,
Dragosavac, M., Fisher, M., Fuentes, M., Hagemann, S.,
Hólm, E., Hoskins, B., Isaksen, L., Janssen, P. A. E. M.,
Jenne, R., McNally, A. P., Mahfouf, J.-F., Morcrette, J.-
J., Rayner, N. A., Saunders, R. W., Simon, P., Sterl, A.,
Trenberth, K. E., Untch, A., Vasiljevic, D., Viterbo, P., and
Woollen, J.: The ECMWF re-analysis, Q. J. Roy. Meteorol. Soc.,
131, 2961–3012, doi:10.1256/qj.04.176, 2005.
Wang, J., Zhang, J., Watanabe, E., Ikeda, M., Mizobata, K.,
Walsh, J., Bai, X., and Wu, B.: Is the Dipole Anomaly a major
driver to record lows in Arctic summer sea ice extent?, Geophys.
Res. Lett., 36, L05706, doi:10.1029/2008GL036706, 2009.
Wu, B., Wang, J., and Walsh, J.: Dipole anomaly in the winter Arctic
atmosphere and its association with sea ice motion, J. Climate,
19, 210–225, doi:10.1175/JCLI3619.1, 2006.
Wu, Q., Zhang, J., Zhang, X., and Tao, W.: Interannual vari-
ability and long-term changes of atmospheric circulation over
the Chukchi and Beaufort Seas, J. Climate, 27, 4871–4889,
doi:10.1175/JCLI-D-13-00610.1, 2014.
The Cryosphere, 9, 53–64, 2015 www.the-cryosphere.net/9/53/2015/