Recent Res. Devel. Electrochem., 9 (2013): 81-126 ISBN ... A3.pdf · processes occurring in...
46
Transworld Research Network 37/661 (2), Fort P.O. Trivandrum-695 023 Kerala, India Review Article Recent Res. Devel. Electrochem., 9 (2013): 81-126 ISBN: 978-81-7895-594-0 5. Electrochemical impedance spectroscopy as a method for characterization of the equilibria in bilayer lipid membranes and between bilayers‟ components and ions present in the aqueous solution Monika Naumowicz Institute of Chemistry, University of Bialystok, Al. J. Pilsudskiego 11/4, 15-443 Bialystok, Poland Abstract. The quantitative descriptions of various equilibria that take place in lipid membranes, both natural and artificial, are extremely important and essential for the interpretation of processes occurring in biological membranes. Physicochemical and electrochemical researches of lipid membrane properties are carried out by various research groups from many years. However, knowledge concerning the electrical properties of bilayers and of influence of various factors on them (e.g., the membrane composition and the electrolyte solution composition) is still not enough in order to give complete description of all functions of lipid membranes. Electrochemical studies are particularly promising here. Therefore, this chapter regards quantitative analysis of definite models of biological systems. The presented researches of biolipid interaction are concentrated on description of equilibria that Correspondence/Reprint request: Dr. Monika Naumowicz, Institute of Chemistry, University of Bialystok Al. J. Pilsudskiego 11/4, 15-443 Bialystok, Poland. E-mail: [email protected]
Transcript of Recent Res. Devel. Electrochem., 9 (2013): 81-126 ISBN ... A3.pdf · processes occurring in...
Transworld Research Network
37/661 (2), Fort P.O.
Trivandrum-695 023
Kerala, India
Review Article
Recent Res. Devel. Electrochem., 9 (2013): 81-126 ISBN: 978-81-7895-594-0
5. Electrochemical impedance spectroscopy
as a method for characterization of the
equilibria in bilayer lipid membranes and
between bilayers‟ components and ions
present in the aqueous solution
Monika Naumowicz Institute of Chemistry, University of Bialystok, Al. J. Pilsudskiego 11/4, 15-443 Bialystok, Poland
Abstract. The quantitative descriptions of various equilibria that
take place in lipid membranes, both natural and artificial, are
extremely important and essential for the interpretation of
processes occurring in biological membranes.
Physicochemical and electrochemical researches of lipid
membrane properties are carried out by various research groups
from many years. However, knowledge concerning the electrical
properties of bilayers and of influence of various factors on them
(e.g., the membrane composition and the electrolyte solution
composition) is still not enough in order to give complete
description of all functions of lipid membranes. Electrochemical
studies are particularly promising here.
Therefore, this chapter regards quantitative analysis of
definite models of biological systems. The presented researches of
biolipid interaction are concentrated on description of equilibria that
Correspondence/Reprint request: Dr. Monika Naumowicz, Institute of Chemistry, University of Bialystok
Al. J. Pilsudskiego 11/4, 15-443 Bialystok, Poland. E-mail: [email protected]
Monika Naumowicz 82
take part within the bilayer as well as on its surface. Assumed models of interaction
between amphiphilic molecules and the equilibria that take place there as well as
acid-base equilibria are described by mathematical equations for the systems studied.
These theoretical models are verified experimentally using electrochemical
impedance spectroscopy technique.
1. Introduction
The inspiration for lipid bilayer research, without question, comes from
the biological world. Because of the structural diversity of cell membranes, it
is extremely difficult to examine their properties. That is why scientific
experiments are carried out on simplified models usually composed of one or
more compounds. Although the first report on self-assembled bilayer lipid
membranes in vitro was reported in 1961 [1], experimental scientists
including surface, colloid, and bioscientists have been dealing with these
interfacial phenomena since Robert Hooke‟s time (1672).
The most popular cell membrane models are planar bilayer lipid
membranes (BLMs) which have many advantages. Primarily, they allow
studying the properties of a singular component of membranes. Secondly,
the structures of BLMs are well understood and theoretically described.
Furthermore, a composition of artificial lipid bilayers can be easily modified
during the experiment. Finally, the BLM system allows the exquisite
investigation of electrical properties (membrane potentials, electrical
resistance, current-voltage curves and electrical capacitance). Unlike most
other model membranes, BLMs are dynamic, ultrathin and liquid-crystalline.
Indeed, studies of the BLMs facilitate the initial testing of working
hypotheses, which have generated guidelines for a better choice of
reconstituted membrane experiments and have led to potential applications
[2]. Bilayer lipid membranes have been used in a number of applications
ranging from basic membrane biophysics studies to the conversion of solar
energy via water photolysis, and to biosensor development that uses
supported bilayer lipid membranes [3].
Cell membranes and their models are primary composed of amphiphiles,
a special class of surface-active molecules, which are characterized by
having a hydrophilic and a hydrophobic group in the same molecule.
Usually, zwitterionic or nonionic lipids are used as the basic lipids for the
preparation of bilayers. These lipids can be categorized into three principal
types: phospholipids, sphingolipids, and sterols. They each play different
roles in the membranes.
Phosphatidylcholine (PC) is the most abundant phospholipid in
mammalian cell membranes, constituting 40–50 % of total phospholipid [4].

Impedance of bilayer lipid membranes 83
The second most abundant mammalian membrane phospholipid is
phosphatidylethanolamine (PE), which constitutes 20–50 % of total
phospholipids [4]. Phosphatidylcholine and phosphatidylethanolamine differ
considerably in their effective sizes, hydration properties, and interhydrogen
bonding capability of their polar headgroups [5] as well as their intrinsic
curvatures [6] pertinent to the effective structure and intermolecular
interactions of lipid molecules in membranes. Although phosphatidylserine
(PS) is distributed widely among animals, plants, and microorganisms,
it is usually less than 10 % of the total phospholipids, with the greatest
concentration being in myelin from brain tissue. However, it may comprise
10 to 20 % of the total phospholipid in the cell membrane bilayer [7], where
it exerts important functions. Sphingolipids differ from phospholipids in
being based on a lipophilic amino alkohol (sphingosine) rather than glycerol.
Sphingomyelin (SM) is a major sphingolipid species (sphingolipids can
comprise 10-20 % mol of the plasma membrane). Ceramide (Cer) is the
biological building blocks of more complex sphingolipids. The cellular
concentration of ceramides can be quite high in reaching levels of
1–10 mol % of the total phospholipid concentration [8]. Cholesterol (Ch),
the major sterol present in plasma membranes of higher eukaryotes, can
comprise up to 50 mol % of the total plasma membrane lipids [9]. Ergosterol
(Erg) is the major component present in lower eukaryotes such as certain
protozoa, yeast, and other fungi, and in insects such as Drosophila [10].
The second dominating group contained in cell membranes are proteins
embedded in membranes; they are macromolecules that are responsible for
many functions essential for living, i.e. transporting of molecules across the
lipid membrane, enzymatic properties and interactions with the other cell
membranes.
In addition proteins and lipids, biological membranes also contain:
carbohydrates, vitamins, free fatty acids, carotenoids, lysolipids and many
other compounds that constitute extraordinarily important elements in the
biomembranes functioning. For example, -tocopherol ( -T) is the form of
vitamin E that is preferentially absorbed and accumulated in humans [11]. It
is believed to have two primary functions in cells: a major role is thought to
be as an antioxidant acting to prevent free radical damage to the tissues [12]
and a subsidiary function is to stabilize the structure of membranes [13].
Fatty acids and amines contain the same functional groups that are present in
natural membranes and are suitable for introduction into model membranes.
Their simple structures make them invaluable sources of information that
may be extrapolated to more complex biological membranes.
Most of the lipid bilayer studies concentrate on the surface potential [14]
or surface pressure measurements [15], spectroscopy [16] and microscopic

Monika Naumowicz 84
visualization of lateral domains [17]. The possibility to form lipid bilayers
between two aqueous solutions allows placing the electrodes in both aqueous
solutions being in contact with the membrane, and thus permits on utilization
of electrochemical techniques to study the properties of the lipid bilayers.
Thus, as is well known, biological membranes and black lipid membranes
used as model membranes can also be very well characterized by
electrochemical impedance spectroscopy [18-19]. Beginning in the 1970s,
research electrochemists and materials scientists began to discover the power
of electrochemical impedance as a tool for studying difficult and
complicated systems. Even today, it often provides the only non-invasive
method for detailed structural-functional studies of these systems [18]. This
is especially so of systems in which important processes occur at the
molecular level, such as those processes associated with biological and
synthetic membranes and interfaces that form between solutions and various
solids, e.g., metals and colloid particles [18].
Electrochemical impedance spectroscopy (EIS) may be used in the
characterization of membrane capacitance and resistance. Both these
electrical parameters are affected by such factors as medium pH and the
presence of certain substances, such as cholesterol, other lipids, fatty acids or
amines incorporated in the lipid bilayer. In this paper, the effect of various
agents on impedance parameters values of bilayer lipid membranes is
discussed.
2. Electrical capacitance and electrical resistance of single-
component bilayer lipid membranes
Capacitance is a characteristic and well-reproducible parameter of
BLMs. It is considered to be the best tool for probing the stability and formal
goodness of the lipid bilayer [20]. For this reason it is measured for every
bilayer, even when other properties are the main focus of the researches.
Membrane capacitance measurements are made for various purposes
including, for example, membrane thickness determinations [21], studies of
membrane stability and of its formation process [22], studies of surface
potentials [23], toxicological studies [24], investigation of photo-effects [25]
and studies of transport phenomena through the membrane [26].
Measurements of membrane capacitance can be performed by various
methods, differing in the way of capacitance determination and the type of a
measurement signal applied to the membrane: measurements with a sinusoidal
signal [27] or a triangular signal [28], pulse methods [29], compensation
methods [30], bridge methods [31], conversion of capacitance to frequency
[32] and measurements of the minimum capacitance potential [33].

Impedance of bilayer lipid membranes 85
Resistance (reciprocal of conductance) as an electrical property of
nonpermeabilized lipid bilayer can be measured only during application of
voltage or current signal [20]. Resistance may vary by at least one order of
magnitude, possibly because of impurities of the bilayer, border leakage at
the membrane support, the appearance of lipid “crystals” at the periphery of
the bilayer or way of introducing the lipid solution (if the forming solution is
introduced with a microsyringe, instead of a brush, the irreproducibility of
bilayer can be minimized). The resistance of a single membrane, however, is
usually constant until a short time before the membrane ruptures. Therefore,
any changes in resistance due to addition of ions, proteins, drugs, etc., can be
determined with a relatively high degree of accuracy [34]. Galluci et al. [35]
have developed the system for measuring conductance and capacitance
simultaneously and continuously as a function of time. This method allows
measurement of electrical properties of nonpermeabilized planar bilayers as
well as during the process of defect formation and electroporation
(electroporation is a significant increase in the electrical conductivity
and permeability of the membrane caused by an externally applied
electrical field).
Capacitance and resistance values of pure bilayer lipid membranes
formed from various components, obtained in our laboratory, are
summarized in Table 1. The EIS technique was used to characterize
the membrane features as this method has been shown to measure the
electrical parameters of BLMs accurately. The capacitance value for
phosphatidylcholine is equal to 0.62 ± 0.02 F cm-2
. This value has been
reported in the subject literature [1,20,36].
From the table above it can be concluded that values of resistance often definitely show greater scattering than values of capacity, and therefore
effects of measurements of the conductance are most often treated as supplementary data. The conductance is burdened with random errors caused by the presence of the solvent and ions in a bilayer. The presence of the solvent and ions always carries a meaningful, easily noticeable error as well as scattering to results. This effect is not occurring in such a visually perceptible manner in the capacity. There is no reliable literature data on capacitance and resistance values
for membranes formed from pure fatty acids, amines, -tocopherol and
ergosterol because these components do not form single-component
membranes. Therefore, the hypothetical values of the impedance parameters
for bilayers built from the above components were determined (values
presented in Table 1). In the case of decanoic acid and decylamine, the
capacitance hypothetical values for membranes built from these components
were determined adjusting the experimental curve with the polynomial of the

Monika Naumowicz 86
Table 1. Impedance parameters values of single-component bilayer lipid membranes.
Electrolyte, 0.1 M KCl.
other mark extrapolating the x2 = 1 value. The hypothetical capacitance value for membrane built from stearic acid was estimated by fitting the experimental curve with a straight line for four different molar fractions of fatty acid and extrapolating x2 = 1 value. The hypothetical values of the resistance for bilayers built from pure fatty acids and amines is not provided here because of the spread in the resistance measurements and the irreproducibility of the results. In the case of -tocopherol and ergosterol, the hypothetical values of the impedance parameters were evaluated from plateau values appearing at the end of the experimental curves.
3. Equilibria of 1:1 complex formation in bilayer lipid
membranes
In spite of a wide variety of experimental methods for the study of lipid bilayers, some long-lasting problems remain. One of them is the complex formation between two kinds of lipids in bilayers. Moreover, there is still little of the quantitative description of the lipid-lipid systems. It is required for a better understanding of the processes that take place in biological membranes with the aim of forming the artificial membranes that would very closely resemble the properties of the natural membranes. Therefore, the knowledge of molecular structure and organization of biolipids is necessary.

Impedance of bilayer lipid membranes 87
3.1. Theoretical considerations
One, two, or several membrane components can be contained in a forming solution used to obtain artificial lipid bilayers. These components may or may not form another compound in the membranes. The model, which has been presented in full detail previously [38,42,43] assumes that in the case, where the membrane components do not form chemical compounds, any two-component system, regardless of whether it forms a two-dimensional monolayer or a three-dimensional bilayer, can be described by the equations expressing additivity of the capacitance and the conductance:
1 1 1 2 2 2
s s
mC C c S C c S (1a)
and
-1 -1 -1
1 1 1 2 2 2
s s
mR R c S R c S (1b)
here:
11
1 2
s
s s
cx
c c (2)
1 2 1x x (3)
where:
mC [ F cm-2
] – the measured capacitance of the membrane referred to the
unit area of the membrane;
1 2C C, [ F cm-2
] – the capacitance of the membrane built by components 1
and 2, respectively, referred to the unit area of the membrane; 1-
mR [
-1 cm
-2] – the measured conductance of the membrane referred to the
unit area of the membrane; 1 1
1 2R ,R [
-1 cm
-2] – the conductance of the membrane built by components
1 and 2, respectively, referred to the unit area of the membrane;
1 2,s sc c [mol m-2
] – the surface concentration of components 1 and 2,
respectively, in the membrane;

Monika Naumowicz 88
1 2S S, [m2 mol
-1] – the surface area, occupied by one mole of components 1
and 2, respectively;
1 2x x, – the molar fraction of components 1 and 2, respectively.
After solution of the equations system (1)-(3), dependences of linear
type are derived:
21 1 2 2
1
- - -m m
SC C x C C x
S
(4a)
-1 -1 -1 -121 1 2 2
1
( - ) - ( - )m m
SR R x R R x
S
(4b)
Lipid membranes may also be assembled from two components capable
of forming a complex (compound 3). The stoichiometry of the complex may
vary, but because the first stability constant in complexes, as the most
essential one, is usually the largest and should be taken into consideration
[46,47], mainly the existence of 1:1 complex in the analyzed system was
assumed. The equilibrium between the individual components and the complex is presented by:
A + B AB
(Component 1) (Component 2) (Compound 3)
Then, the set of equations (1)-(3) is modified because the impedance
parameters (electric capacity and electric conductance) are the sum of the
contributions from each compound [38,42,43]:
1 1 1 2 2 2 3 3 3
s s s
mC C c S C c S C c S (5a)
1 1 1 1
1 1 1 2 2 2 3 3 3
- - s - s - s
mR R c S R c S R c S
(5b)
here:
3
1 2
s
R s s
cK
c c

Impedance of bilayer lipid membranes 89
1 31
1 2 32
s s
s s s
c cx
c c c (7)
1 1 3
s s s
tc c c (8)
2 2 3
s s s
tc c c (9)
1 2 1x x (10)
where:
C3 [ F cm
-2] – the capacitance of the membrane built by compound 3,
referred to the unit area of the membrane; 1
3R [
-1 cm
-2] – the conductance of the membrane built by compound 3,
referred to the unit area of the membrane;
3
sc [mol m-2
] – the surface concentration of compound 3 in the membrane;
1 2,s s
t tc c [mol m-2
] – the total surface concentration of components 1 and 2,
respectively, in the membrane;
3S [m2 mol
-1] – the surface area, occupied by one mole of compound 3;
RK [m2 mol
-1] – the stability constant of compound 3.
After solution of the equations system (5)-(10), the following basic
equations are obtained:
1 2 1 2 1 2 3 1 2 1 3 2 1 2 1 2 1 2- - - - - -m mC C B x C C B x C C B x C C B x C C x x
1
3 1 2 1 2 1 3 1 2 2 1 2 3 2 1
-
R m m m mK S B B C -C x - x C -C B x C -C x - x (C -C )B x (11a)
and
-1 -1 -1 -1 -1 -1 -1 -1 -1 -1
1 2 1 2 1 2 3 1 2 1 3 2 1 2 1 2 1 2- - - - - -m mR R B x R R B x R R B x R R B x R R x x
1 1 1 1 1 1 1 1 1
3 1 2 1 2 1 3 1 2 2 1 2 3 2 1
- - - - - - - - -
R m m m mK S B B R - R x - x R - R B x R - R x - x R - R B x (11b)
in which:

Monika Naumowicz 90
31
1
SB =
S and 3
2
2
.S
B = S
Eqs. (11) are equations of second degree with respect to mC and -1mR , to
the complex composition as well as with respect to the constants: -1 -1 -1
1 2 3 1 2 3 1 2, , , , , , ,C C C R R R B B . Opening of parentheses results in a great
complexity of the equations, and it is troublesome when directly applied to
the determination of constants. The capacitance and resistance values of the
membranes formed from pure components 1 and 2 can be measured directly
(or 2C and -12R can be determined in such a way as described in Section 2). The
remaining constants can be determined in individual cases using simplified
forms of these equations.
Eqs. (11) may be simplified taking into account the sufficiently high value
of the stability constant of the complex (in limit → ∞) and approximating x2 to
low or high values. The criterion of rightness of the accepted assumption is the
agreement between theoretical and experimental values.
Compound 1 and the complex are contained in the two-component lipid
membrane for low x2 values (x2 0). These compounds determine in this
case the values of function of capacitance and conductance. Therefore,
Eqs. (11) may be presented as the following straight lines:
1 2
1 1 3 1
2
-- -m m
x xC C B C B C
x
(12a)
-1 -1 -1 -11 21 1 3 1
2
-- -m m
x xR R B R B R
x (12b)
Compound 2 and the complex are contained in the two-component lipid
membrane for high x2 values (x2 1). In this case only these two
compounds determine the values of capacitance and conductance functions.
This is why Eqs. (11) may be written as other straight lines:
2 12 2 3 2
1
-- -m m
x xC C B C B C
x (13a)
-1 -1 -1 -12 12 2 3 2
1
-- -m m
x xR R B R B R
x (13b)

Impedance of bilayer lipid membranes 91
When calculating the stability constant for the complex, Eqs. (11) can be
simplified to 1 2x x :
-1 -1 -1 -1 -1 -1 -1 -1 -1 -1 -1 -1
2 1 1 2 1 2 2 1 1 2 2 1 1 2 1 2 1 2 3- - -m mC S C S C S S C S C S C S C S C S S S S C
2-1 2 -1 2
1 2 3 3( ) ( ) -R mK S S S C C (14a)
and
-1 -1 -1 -1 -1 -1 -1 -1 -1 -1 -1 -1 -1 -1 -1 -1 -1 -1 -1 -1 12 1 1 2 1 2 2 1 1 2 2 1 1 2 1 2 1 2 3- - -m mR S R S R S S R S R S R S R S R S S S S R
2-1 2 -1 2 -1 -11 2 3 3( ) ( ) -mRK S S S R R (14b)
The parameters describing the complex ( -13 3, ,RK C R , and
3S ), determined
using Eqs. (12)–(14), may be used to calculate theoretical points using the
equation presented below (agreement between theoretical and experimental
values implies that the system is well described by the above equations):
(15a)
where:
and
(15b)
in which:
-1 -1 -1 -1 -1 -1 -1 -1 -1
4 3 1 2 2 1 1 3 1 2 2 3 2 1- - - -a S R R x x R R x S R R x S

Monika Naumowicz 92
For bilayer membranes assembled from two components, 1:1 complex
formation may be assumed to be the explanation for deviation from the
additivity rule. Model curves can be constructed using calculated parameters
such as equilibrium constants, molecular areas of the complexes, electrical
capacitance and electrical conductance of molecules and complexes. The
accuracy of the models is then verified by comparison to experimental
results.
3.2. Lipid-lipid systems
The phospholipid-cholesterol interactions have been widely studied
since 1925 [48] because of their importance from a biological point of view.
Cholesterol is a significant factor in controlling physical properties of cell
membranes and their functions [49]. As a result of a growing interest in
biological membranes, many studies are directed at the cholesterol-
phospholipid system [50]. Cholesterol increases both the order of the
hydrocarbon chains (an ordering effect) and the surface density of the membrane
(condensing effect) in a model and in biological membranes [51,52]. Ordering
and condensing effects are not limited to specific phospholipids, they are
shown by phosphatidylcholines, phosphatidylethanolamines and also
phosphatidic acid, sphingomyelin, phosphatidylglycerol or other derivatives of
phospholipids [53].
There have been a number of proposals for existence of the complexes at
different stoichiometries formed from two kinds of lipids. However, there is
no agreement concerning what stoichiometries of the formed complexes
have. The 1:1, 1:2, 2:1, 1:3 and 3:1 complexes are mostly claimed to be in
bilayers [54,55]. On the other hand, subsequent investigators have suggested
that specific associates [56], phase separation [57], domains [58] or lattice-
based structures [59] could be formed in the PC–Ch membranes.
In this paragraph, a 1:1 complex has been proposed to exist in bilayer
composed of two kinds of lipids. It was verified experimentally using
electrochemical impedance spectroscopy technique. Area, capacitance,
conductance, and stability constant values for the complexes were calculated
based on the model assuming 1:1 stoichiometry, and the model was
validated by comparison of these values to experimental results. Description
of the complex formation equilibria is presented below on the example of
phosphatidylcholine bilayers modified with ceramide.
Typical impedance spectra of the PC, PC-Cer (1:1 molar ratio) and Cer
membranes are presented in Fig. 1. Very simple impedance diagrams were
obtained for all the examined membranes. They have the form of semicircles
in the entire analyzed frequency range. Their centers lie on the real axis,

Impedance of bilayer lipid membranes 93
provided that the lipid bilayers are considered as dielectric layers with
leakage. The pure PC bilayers have different impedance than the PC-Cer
membranes, confirming that ceramide has been successfully incorporated
into the lipid bilayers and has a contrast effect on the electrical properties of
the membranes. It caused both capacitance of the membrane Cm and resistance
of the membrane Rm to decrease. The complex nonlinear least squares fits
(according to the equivalent circuit illustrated in Fig. 2) are represented by
solid lines and are in good agreement with the data obtained.
0.0E+00
4.0E+04
8.0E+04
1.2E+05
0.0E+00 4.0E+04 8.0E+04 1.2E+05 1.6E+05 2.0E+05 2.4E+05
Z' / cm2
-Z"
/ c
m2
phosphatidylcholine phosphatidylcholine-ceramide (1:1 molar ratio) ceramide
0.E+00
3.E+03
0.E+00 6.E+03
Figure 1. Dependence of an imaginary part −Z” on the real part Z‟ for a membrane
made of phosphatidylcholine, phosphatidylcholine-ceramide and ceramide. The solid
lines represent the results of the fitting procedure.
R0
Rm
Cm
Figure 2. The equivalent circuit used for impedance data analysis: R0 represents the
resistance of the electrolyte, Cm is the capacitance of the membrane and Rm is the
resistance of the membrane.

Monika Naumowicz 94
The validity of the results obtained by electrochemical impedance
spectroscopy was verified using electrical equivalent circuit model which is
presented in Fig. 2. This equivalent circuit consists of a parallel arrangement
of capacitance mC and resistance mR , attributed to the electrical properties
of the bilayer, completed by a serial resistance 0R for the conductivity of the
bulk. The possibility of misinterpretation of the recorded data is reduced by
the simplicity of the circuit. This electric circuit is characteristic for an
artificial lipid membrane only when ionophore systems, specific channels-
pores and adsorption are absent [60]. The electrochemical parameters of the
circuit were evaluated by employing the ZsimpWin software. A very high
correlation was observed between experimental results and the results
calculated with the best fitting electrical equivalent circuit model, where χ2
was minimized below 10-3
. An examination of the data obtained for analyzed
systems indicate that the proposed equivalent circuit can be used to describe
the experimental results (Fig. 1).
Dependences of the capacitance and the conductance of phosphatidylcholine
(component 1) - ceramide (component 2) membranes are illustrated in Figs. 3a
and 3b as functions of the molar fraction of ceramide. The resulting dependences
deviate from linearity indicating that specific interactions between membrane
components are presented in the membrane. The capacitance and the
conductance values obtained for a pure PC bilayer are equal to 0.62 0.02
F cm-2
and (4.35 0.91) 10-6 -1
cm-2
, respectively. The capacitance and the
conductance values for a pure Cer bilayer are equal to 0.17 0.01 F cm-2
and
(3.29 1.35) 10-4
-1
cm-2
, respectively. Figs. 3a and 3b also show the
theoretical values, marked by the curve, obtained from Eqs. (15a) and (15b)
(describing the complex formation process). These theoretical values were
calculated using values whose determination will be described in further
parts of the paper. It can be seen from these figures that the theoretical
values agree well with the experimental data in the whole analyzed
concentration range which suggests the existence of PC-Cer complex in the
examined membranes.
Figs. 4a and 4b present graphs (Cm -C1)x1 versus -(Cm –C2)x2 and -1 -1
1 1( - )mR R x versus -1 -1
2 2-( - )mR R x described by Eqs. (4a) and (4b),
respectively. The dependences are expressed in the coordinate systems in
which the plots should yield straight lines when the membrane components
do not interact. Their actual shapes prove that they do not correspond to
Eqs. (4a) and (4b), suggesting that there are specific interactions in the
analyzed bilayer. Therefore, the formation of a complex in this system was
assumed. Because the existence of a 1:1 complex is a typical case [46], the
formation of a 1:1 PC-Cer complex was accepted.

Impedance of bilayer lipid membranes 95
a)
0.00
0.20
0.40
0.60
0.80
0.0 0.1 0.2 0.3 0.4 0.5 0.6 0.7 0.8 0.9 1.0x 2
Cm
/F
cm
-2
experimental points theoretical curve
b)
1.0E-06
1.0E-05
1.0E-04
1.0E-03
0.0 0.1 0.2 0.3 0.4 0.5 0.6 0.7 0.8 0.9 1.0
x 2
Rm
-1/
-1 cm
-2
experimental points theoretical curve
Figure 3. Dependences of capacitance Cm (a) and conductance Rm–1 (b) of the
phosphatidylcholine-ceramide bilayers on the molar fraction of ceramide x2. Error
bars indicate the experimental scatter. The experimental values are denoted by points
and the theoretical ones, calculated according to Eqs. (15), by curves.
Consequently, Eqs. (5a) and (5b), and the stability constant KR,
describing a complex formed in this system, complete the theoretical
description. After simple modifications of Eqs. (5a) and (5b), one can obtain
information of great interest from our point of view, presented by Eqs. (11a)
and (11b). Assuming that the value of the stability constant of the PC-Cer
complex was sufficient with respect to the simplified Eqs. (11) to Eqs. (12)
and (13), the constants B1, B2, C3, R3-1
were obtained.

Monika Naumowicz 96
a) -0.08
-0.06
-0.04
-0.02
0.00
-0.30-0.20-0.100.00
-(C m -C 2)x 2/ F cm-2
(Cm
-C1)x
1/
F c
m-2
x2
x2
b)
0.0E+00
1.0E-05
2.0E-05
3.0E-05
4.0E-05
5.0E-05
-3.0E+04-2.0E+04-1.0E+040.0E+00
-(R m-1
-R 2-1
)x 2/-1
cm-2
(Rm
-1-R
1-1
)x1/
-1 c
m-2
x2
Figure 4. Plots representing Eqs. (4): Cm, Rm–1 - capacitance and resistance of the
membrane, respectively; C1, R1–1 - capacitance and resistance of the pure
phosphatidylcholine membrane, respectively; C2, R2–1 - capacitance and resistance of
the pure ceramide membrane, respectively; x1, x2 - molar fraction of the
phosphatidylcholine and the ceramide, respectively. The arrows denote the direction
of the increasing x2 values and the dashed lines indicate the order of points.
Figs. 5a, 5b, 6a and 6b present the plots of functions (12a), (13a), (12b)
and (13b), respectively. The presented dependences are transformed into
straight lines when KR is high and the values x2 are low (Figs. 5a and 6a) or
the values x2 are high (Figs. 5b and 6b). If at least three successive points fall
on the same straight line, it is reasonable to assume that the conditions for
simplification of Eqs. (11) have been met and straight line passing through
these three points may be described by Eqs. (12) and (13).

Impedance of bilayer lipid membranes 97
a)
-0.6
-0.5
-0.4
-0.3
-0.2
-0.1
0.0
0.1
0.0 0.2 0.4 0.6 0.8
C m F cm-2
(C1-C
m)x
1-x
2/x
2/
F c
m-2
0.58 0.60 0.62
b)
-1.0
-0.7
-0.4
-0.1
0.2
0.5
0.0 0.2 0.4 0.6 0.8
C m / F cm-2
(C2-C
m)x
2-x
1/x
1/
F c
m-2
Figure 5. Plots illustrating the dependences for phosphatidylcholine-ceramide
complex described with Eq. (12a) (a) and Eq. (13a) (b). Straight lines join the points,
from which parameters B1, B2, S3 and capacitance C3 can be determined.
Points fulfilling both the aforementioned limitations of x2 values and
forming straight lines are joined together in Figs. 5 and 6. From the B1 and
B2 constants, which were determined on the basis of these equations, it was
possible to calculate the capacitance value of the complex C3 and the
conductance value of the complex R3-1
.
The values of B1 and B2 were determined from the slopes of the lines. The
intersections of the straight lines with the ordinate provide -B1C3 and -B2C3
and -B1R3-1
and -B2R3-1
, which can be used to determine C3 and R3-1
. The mean

Monika Naumowicz 98
a)
-8.0E-05
4.0E-05
1.6E-04
2.8E-04
0.0E+00 1.1E-04 2.2E-04 3.3E-04
R m-1
/-1
cm-2
(R1
-1-R
m-1
)x1-x
2/x
2/
1 c
m-2
5.0E-06 1.0E-05 1.5E-05
b)
-4.0E-04
5.0E-05
5.0E-04
0.0E+00 1.0E-04 2.0E-04 3.0E-04
R m-1
/-1
cm-2
(R2
-1-R
m-1
)x2-x
1/x
1/
-1 c
m-2
Figure 6. Plots illustrating the dependences for phosphatidylcholine-ceramide
complex described with Eq. (12b) (a) and Eq. (13b) (b). Straight lines join the points,
from which parameters B1, B2, S3 and conductance R3-1 can be determined.
values obtained from these points equal to 0.58 ± 0.01 F cm-2
and
(1.30 ± 0.13) 10-5
-1
cm-2
, respectively.
Eqs. (12) and (13) could also be applied to calculate the surface area per
a single complex molecule S3. The values of the surface area, occupied by one
mole of components 1 and 2, are necessary for this calculation. The surface
area occupied by the PC molecule depends on the way the phospholipid is
prepared, because this affects the length, conformation and degree of
unsaturation of the fatty acids chains. Therefore, the values in the literature
range between 54 and 99 Å2 [61,62]. In our case, we chose S1 value,
determined in our laboratory as 85 Å2 [63]. The surface area occupied by Cer
molecule, reported in the literature, is equal to 50 Å2 [64]. The resulting S3
value amounts to 75 Å2 molecule
-1 and is lower than the sum of areas
occupied by each component of the complex (135 Å2).

Impedance of bilayer lipid membranes 99
The stability constant of the complex could be determined from
Eqs. (14a) and (14b) by setting 1 2 0.5x x . The resulting mean value of
the stability constant is (8.76 ± 0.42) 107 m
2 mol
-1.
The parameters determined on the basis of Eqs. (11) and (14) were
applied to represent the agreement of the data, evaluated from Eqs. (11)
(solid lines) with the experimental data (points) in Figs. 3a and 3b using
Eqs. (15). Both of Eqs. (15) can yield two solutions, as they are of a
second order. The values ensuring better agreement of the experimental
points with the predicted ones by the equations describing the complex
formation between membrane lipid components were chosen. It can be seen
from the Figs. 3a and 3b that the agreement between experimental and
theoretical points is good. This agreement means that our theoretical model
(presented in Section 3.1) is sufficient to describe the analyzed system. This
agreement also justifies the statement that other complexes do not represent
a significant component of this system. Still, the fact remains that we cannot
detect other complexes based on our experimental data.
Table 2 lists several physicochemical parameters for 1:1 complexes
existing in BLMs. These parameters were determined in our laboratory using
electrochemical impedance spectroscopy.
Table 2. Selected physicochemical parameters for lipid-lipid complexes (1:1) in
bilayer lipid membranes. Electrolyte, 0.1 M KCl.

Monika Naumowicz 100
Analysis of the results presented in the table leads to the following
conclusions:
1. The values of stability constant of all analyzed complexes are
relatively high, providing additional support for the prevalence of
1:1 complexes in mixed bilayers. These values also confirm that the
assumptions used to simplify Eqs. (11) were correct.
2. The stability constant of the Ch-containing complexes are higher
(besides SM-Ch complex) than of complexes without cholesterol in
their structures indicating that these complexes are more stable.
3. The experimentally obtained values for the surface area occupied
by the PC-Ch and PE-Ch complexes 3
eS are lower than values of the
surface area 3
tS calculated for both molecules; 3
eS and 3
tS values in
the case of SM-Ch complex are the same. These result confirm that
addition of cholesterol to membranes formed from phospholipids
resulted in increased stability and reproducibility. Cholesterol
condenses some membrane components, making the membrane
structures more rigid. Ch also improves the packing of membrane
lipids as, unlike sphingolipid molecules, it preferentially occupies
voids in the hydrophobic layer of the membrane rather than spaces
in the polar region. 4. The 3
eS values for PC-Cer and PS-Cer complexes are also lower than values of 3
tS calculated for these complexes. It is interpreted as condensing effect of Cer, which is in agreement with the subject literature [65-67].
5. Good agreement between the experimental and the theoretical points verifies the assumption of existence of 1:1 complex in the lipid bilayer. The lack of variation between theoretical and experimental points indicates that our theoretical model is sufficient to describe the interaction in analyzed systems. The agreement between the experimental results and the model predictions for the PC-Ch, PE-Ch, SM-Ch, PC-PE, PC-Cer and PS-Cer membranes justifies the statement that other complexes do not represent a significant component of these systems.
6. The mathematically derived and experimentally confirmed results
presented here are of great importance for the interpretation of
phenomena occurring in lipid bilayers. These results can help lead
to a better understanding of the physical properties of biological
membranes. The simple and very interesting methods proposed in
this Section may be used with success to determine the equilibrium
constant values of 1:1 complexes in any lipid–lipid systems.

Impedance of bilayer lipid membranes 101
3.3. Lipid-fatty acid and lipid-amine systems
Amphiphiles such as fatty acids or amines are known to strongly modify
the structures of biological membranes and their functions such as transport
[68] or enzyme adsorption [69]. These effects may be investigated by
examining the molecular interaction of fatty acids or amines with
phospholipids in the bulk [70,71] or in monolayers [72]. Calorimetric studies
[70,71] of phospholipid–fatty acid mixtures in the bulk phase have shown
that saturated fatty acids partition preferentially into the solid-like domains of
the lipids; a 1:1 or 1:2 complex formation was also suggested.
The dependence of lipid membrane capacitance on composition for
PC-decanoic acid (DA), PC-decylamine (DE), and PC-stearic acid (SA) systems
were studied over a possible concentration range. The results are depicted in Fig. 7.
These dependences were executed in the function of the composition to 0.52
molar fraction of the decanoic acid, to 0.88 molar fraction of the decylamine
and to 0.80 molar fraction of the stearic acid, because only to such contents
of component 2 (decanoic acid, decylamine, stearic acid) the bilayer
membrane formation was possible.
The conductance values were treated as supplementary data and were
not used for equilibrium calculations.
The values of C3 for the PC-DA (0.33 F cm-2
), PC-DE (0.94 F cm-2
),
and PC-SA (1.52 F cm-2
) complexes were calculated using Eqs. (12a) and
(13a). Equations (12a) and (13a) could also be used to calculate the areas
occupied by PC-DA, PC-DE, and PC-SA complexes (the surface area
occupied by decanoic acid, decylamine, and stearic acid molecule is 22 [72],
20 [72], and 19 Å2
[73], respectively), which are 239, 152, and 122 Å2,
respectively. Obtained values of the surface areas are much larger than the
sum of the surface area occupied by each component of the complexes. It is
probably connected with the arrangement of PC molecules in the complex
and also connected with the structural construction of such complexes.
The stability constants of the analyzed complexes were determined
using Eq. (14a). The KR of PC-DA, PC-DE, and PC-SA complexes are
2.82 105, 2.06 10
7 and 2.87 10
7 m
2 mol
-1, respectively. The KR values
obtained for PC-DE and PC-SA complexes are relatively high, giving
evidence for the prevailing of the 1:1 complex in bilayers composed from
phosphatidylcholine and decylamine or stearic acid. These values also confirm
that the assumptions used to simplify Eq. (11a) were correct.
The verification of the assumption about the formation of 1:1 complexes in
the PC-DA, PC-DE, and PC-SA bilayers is shown in Fig. 7. The experimental
values are marked by points and compared with the values calculated from
Eq. (15a). These calculated („„theoretical‟‟) results are presented as the solid

Monika Naumowicz 102
a)
0.0
0.2
0.4
0.6
0.8
1.0
0.0 0.1 0.2 0.3 0.4 0.5 0.6
x 2
Cm
/F
cm
-2
b)
0.0
0.2
0.4
0.6
0.8
1.0
0.0 0.2 0.4 0.6 0.8 1.0
x 2
Cm
/F
cm
-2
c)
0.0
0.4
0.8
1.2
1.6
0.0 0.2 0.4 0.6 0.8 1.0
x 2
Cm
/F
cm
-2
Figure 7. Dependence of capacitance Cm of the phosphatidylcholine membranes
modified with decanoic acid (a), decylamine (b) and stearic acid (c) on the molar
fraction of decanoic acid, decylamine or stearic acid x2. Error bars indicate the
experimental scatter. The solid line represents the theoretical values calculated from
Eq. (15a).

Impedance of bilayer lipid membranes 103
lines. It can be seen that, in the case of PC-DE and PC-SA membranes, the agreement between experimental and calculated points is good. This agreement means that our theoretical model (presented in Section 3.1) is sufficient to describe the interaction in these systems. Obtained results indicate that a 1:1 complex with high stability constant forms in mixed membranes of PC and DE or SA, similar to the complex between PC and unsaturated fatty acids containing a trans or cis double bond in the acyl chain [74]. The results also verify our choice of C2 value for component of the membrane. The small variances between the experimental and the theoretical capacitance values indicate that complexes of different stoichiometries or associates are also possible in the PC-DE and PC-SA bilayers.
On the contrary, the lack of agreement between the experimental results and values calculated from Eq. (15a) for PC-DA bilayers indicates that complexes of stoichiometry other than 1:1 are present in these membranes. Presumably, the existence of a 1:2 complex PC-DA is the most probable explanation, as in the case of the mixtures of PC with longer-chain (C12–C20)
fatty acids [71,75]. During the course of presented investigations, the formation of PC-DA, PC-DE, and PC-SA complexes with 1:1 stoichiometry was assumed. These complexes arise by producing a connection between the −N
(+)(CH3)3 group from PC molecule and –COO
(−) groups from DA
(or SA), in the case of the complex PC-decanoic acid (or PC-stearic acid), and between the –PO
(−) group from phosphatidylcholine and −N
(+)H3 group
from decylamine. The dissociation constants of the −N(+)
(CH3)3 group from PC and –COO
(−) groups from the decanoic acid are equal 10
−5.7 [63] and
about 10−5
[76], respectively. It should be noted that the dissociation constants of –PO
(−) group from PC and −N
(+)H3 group from DA are equal
10−2.6
[63] and about 10−10
[76], respectively. Therefore the connection between PC and decanoic acid will be stronger and it is possible to expect
that the stability constant of the PC-DA should be higher than the stability constant of the PC–DE complex. Thus, in order to correctly characterize the interactions between phosphatidylcholine and decanoic acid in the bilayers, complexes with stoichiometry other than 1:1 should be taken into consideration during derivation of mathematical formulas. Next, suitable modifications should be applied in equations.
4. Equilibria of domain formation in bilayer lipid membranes
Lipid lateral organization is an important issue in membrane biology.
There is increasing evidence that functional lipid domains of micrometer
sizes exist in biological membranes under physiological conditions [77,78],
but relatively less is known about lipid organization at the molecular level
inside and outside those domains.

Monika Naumowicz 104
4.1. Theoretical considerations During formation of a two-component lipid membrane, the spatial
regionalization of components can occur in various lengthscales from
nanometer to micrometer scale. It is due to specific interactions between
membrane components resulting in the appearance of membrane regions of
diverse chemical character, structure, and functions. Such specialized
structures of various sizes have been called domains [79]. The equilibrium of
domain formation can be described in terms of such physicochemical
parameters as electric capacity and electric conductance. Let us assume that,
in the domain (compound 3) formation process in a two-component lipid
membrane, every molecule of component 2 is surrounded by certain,
possibly to determine, quantity of component 1. The equilibrium state of the
discussed system is described by a previously published set of equations
[44,45,80]:
1 1 1 3 3 3
s s
mC C c S C c S (16a)
and
-1 -1 -1
1 1 1 3 3 3
s s
mR R c S R c S (16b)
in which:
11
1 3
s
s s
cx =
c c (17)
1 1 3 3 1s sc S c S (18)
where -1
3 3 3, sC ,R c and
3S symbols were described in Section 3.1.
Knowing that 1 3 1x x , where x3 is the molar fraction of compound 3,
and eliminating 1
sc and 3
sc , the above system of equations can be presented as:
1 1 3 3 1 1 3
1 3 1 3
( )
( )m
C S C S C S xC
S S S x (19a)

Impedance of bilayer lipid membranes 105
-1 -1 -1-1 1 1 3 3 1 1 3
1 3 1 3
( )
( )m
R S R S R S xR
S S S x (19b)
The systems of Eqs. (1)-(4) and (16)-(19) are mathematically equivalent,
although the parameters for component 2 and compound 3 are different. However,
Eqs. (1)-(4) refer to the case where no domains exist and Eqs. (16)-(19) refer to the
case where domains are created. Therefore both cases are considered separately.
In consequence, the final Eqs. (4a)-(4b) and (19a)-(19b) are presented in the form
suited for a discussion of the results obtained.
Eqs. (19) are quotients of polynomials. Dividing the numerator of each
quotient by its denominator yields a series of increasing exponents of the
power of molar fraction, x3. Further, taking into account two first terms of
each series results in linear expressions, which are correct at low molar
fractions (for 03x ):
-1 -1 -1
3 1 3 3 1 1 3( )mC x C x C C S S (20a)
-1 -1 -1 -1 -1 -1 -1
3 1 3 3 1 1 3( )mR x R x R R S S (20b)
4.2. Phospholipid- -tocopherol and phospholipid-ergosterol
domains Based on derived mathematical equations, a simple method for
calculation of the surface area of the domain between phospholipid and
alpha-tocopherol or ergosterol was proposed. This method can be used with
success for the quantitative determination of area and describe the
stoichiometry of domains formed in any two-component system.
The dependences of impedance parameters on composition for
PC-ergosterol (Erg), PC-alpha-tocopherol ( -T), and PE- -T membranes
were studied over a possible concentration range. These dependences were
executed in the function of the composition to 0.11 molar fraction of the Erg
for PC-Erg membrane, to 0.33 molar fraction of the -T for PC- -T
membrane and to 0.27 molar fraction of the -T for PE- -T membrane,
because only to such contents of component 2 (ergosterol or -tocopherol)
the bilayer membranes formation was possible. The new method developed
by us is presented below on example of PC-Erg domains.
Fig. 8 shows typical impedance plots of chosen phosphatidylcholine
membranes, pure and containing different amounts of ergosterol. For the sake
of clarity, spectra for some molar fractions have been omitted (otherwise the

Monika Naumowicz 106
0.0E+00
5.0E+05
1.0E+06
0.0E+00 5.0E+05 1.0E+06 1.5E+06 2.0E+06
Z'/ cm2
-Z"
/ c
m2
0.00 0.06 0.07 0.08 0.09 0.11
Figure 8. Complex plane impedance diagrams of phosphatidylcholine bilayers
modified with ergosterol. A different content of ergosterol (expressed as a molar
fraction) is illustrated by the different point‟s shapes of the impedance spectra. The
solid lines represent the results of the fitting procedure.
figure would be illegible by superimposed spectra caused by too little
differences in the impedance parameters values). The equivalent circuit used
for data analysis of the system in which domain formation is assumed is the
same as the equivalent circuit used for the system where 1:1 complex
formation appears (presented in Fig. 2).
Dependences of the capacitance and the conductance of the PC-Erg
bilayer on the molar fraction of ergosterol are presented in Figs. 9a and 9b,
respectively. The resulting curves deviate from linearity indicating that some
bonds are formed in the membrane.
In Figs. 9, points denote experimental values and solid lines are
calculated on the basis of Eqs. (19a) and (19b) (describing the domain
formation process) using values whose determination will be presented in
further parts of this paper. The theoretical values agree well with the
experimental data in the range 0.00-0.06 molar fraction of ergosterol
suggests the existence of PC-Erg domains with a defined stoichiometry and a
constant area in this region. Erg had significant effect on the capacitance and
the conductance membranes up to 0.09 molar fraction, Cm and 1-
mR reached a
plateau value when the ergosterol molar fraction was over 0.09. At a molar
fraction of ergosterol in the range 0.06-0.09, the lipid composition and
physicochemical properties of PC-Erg domains change in comparison with
the domains formed in the range 0.00-0.06. The C1 and 1
1R values obtained
for a pure bilayer of phosphatidylcholine are equal to 0.62 F cm-2
and
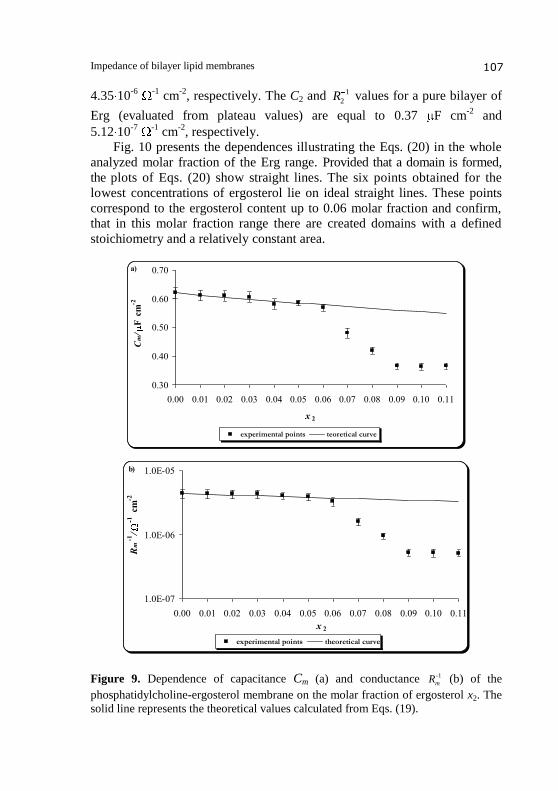
Impedance of bilayer lipid membranes 107
4.35 10-6
-1
cm-2
, respectively. The C2 and 1
2R values for a pure bilayer of
Erg (evaluated from plateau values) are equal to 0.37 F cm-2
and
5.12 10-7
-1
cm-2
, respectively.
Fig. 10 presents the dependences illustrating the Eqs. (20) in the whole
analyzed molar fraction of the Erg range. Provided that a domain is formed, the plots of Eqs. (20) show straight lines. The six points obtained for the
lowest concentrations of ergosterol lie on ideal straight lines. These points
correspond to the ergosterol content up to 0.06 molar fraction and confirm,
that in this molar fraction range there are created domains with a defined
stoichiometry and a relatively constant area.
a)
0.30
0.40
0.50
0.60
0.70
0.00 0.01 0.02 0.03 0.04 0.05 0.06 0.07 0.08 0.09 0.10 0.11
x 2
Cm
/F
cm
-2
experimental points teoretical curve
b)
1.0E-07
1.0E-06
1.0E-05
0.00 0.01 0.02 0.03 0.04 0.05 0.06 0.07 0.08 0.09 0.10 0.11
x 2
Rm
-1/
-1 c
m-2
experimental points theoretical curve
Figure 9. Dependence of capacitance Cm (a) and conductance 1-
mR (b) of the
phosphatidylcholine-ergosterol membrane on the molar fraction of ergosterol x2. The
solid line represents the theoretical values calculated from Eqs. (19).

Monika Naumowicz 108
0.0E+00
2.0E+01
4.0E+01
6.0E+01
8.0E+01
0.0E+00 3.0E+01 6.0E+01 9.0E+01 1.2E+02
x 3-1
Cm
x3
-1/
F c
m-2
0.0E+00
2.0E-04
4.0E-04
6.0E-04
8.0E-04
1.0E-03
Rm
-1 x
3-1
/-1
cm
-2
experimental points theoretical curves
Figure 10. A plot illustrating Eqs. (20), from which the surface area of
phosphatidylcholine-ergosterol domain can be determined Cm represents capacitance
of the membrane, -1
mR conductance of the membrane and x3 molar fraction of the
domain. Solid lines represent the theoretical lines calculated according to Eqs. (20).
The Eqs. (20) can be written in the form: y = ax + b. The a and b
coefficients were determined for six of the least (smallest) molar fractions of
Erg using a linear regression. Next, these coefficients were applied to present
the agreement of the Eqs. (20) data (solid lines) with the experimental data
(points) in Fig. 10. The slope values of the straight lines are equal to
C1 and -1
1R , respectively, and are in agreement (in deviation limits) with
experimental values obtained for a pure PC membrane. The intersections of
the straight lines with y-axes yield the -
3( )C C S S13 1 1 and -1 -1 -1
3 1 1 3( )R R S S ,
respectively, which allow one to determine an area occupied by one domain
(denoted by S3). Knowing the S1 (85 Å2), C1 (0.62 F cm
-2) and C3
(0.37 F cm-2
), as well as -1
1R (4.35 10-6
-1
cm-2
) and -1
3R (5.12 10-7 -1
cm-2
),
the area occupied by one PC-Erg domain could be determined. The resulting
S3 values were 243 Å2 from capacitance measurements and 281 Å
2 from
conductance measurements, which gave the mean value amounting to 262 Å2.
Taking into account the surface area occupied by one Erg molecule
(equal to 38.5 Å2 [81]), the surface area occupied by one PC molecule
(mentioned above), the mean experimental surface area occupied by one
PC-Erg domain determined by us and the possibility of existence of
condensation and ordering effects, we suggest that the stoichiometry of
PC-Erg domain is equal to 3:1. The mean experimental S3 value is higher
than the sum of areas per two PC and one Erg molecule (208.5 Å2) but lower
than the sum of areas per three PC and one Erg molecule (293.5 Å2).

Impedance of bilayer lipid membranes 109
Table 3 contains the values of surface area of both components of the
domains formed in analyzed two-component systems. These values are taken
together with values of area and stoichiometry of the domains.
Deviation of the surface area of all analyzed domains calculated on the
basis of experiments from the theoretical values show a negative value, which
means that a reduction in the surface area occurs as a result of component
mixing. This is thus a condensation effect observed between the
phospholipids and alpha-tocopherol or ergosterol, which indicates that
-T and Erg can work as a reinforcer for phosphatidylcholine and
phosphatidylethanolamine bilayers. The condensation can be attributed to
area changes within the PC and PE when these lipids are mixed with -T or
-T and Erg are rigid molecules whose area does not significantly
change when PC- -T and PE- -T bilayers are formed. This is in agreement
with the model of intermolecular interactions, which assumes that at a
constant surface pressure the area per rigid molecule (e.g., sterol) is also
constant. The condensation effect of -T and Erg is related to the decrease of
the area per phospholipid molecule. The surface area occupied by one PE
molecule within the PE- -T domain amounts to about 65 Å2. Alpha-
tocopherol causes similar condensation effect on the phosphatidylcholine
bilayer; it reduces the molecular area of the PC from 85 to 77 Å2. The surface
Table 3. Selected physicochemical parameters of domains occurring in examined
bilayer lipid membranes. Electrolyte, 0.1 M KCl.
Monika Naumowicz 110
area occupied by one PC molecule within the PC-Erg domain amounts to 75
Å2, whereas the presence of cholesterol in the PC bilayer can reduce the
molecular area of the phosphatidylcholine to 56 Å2 [34].
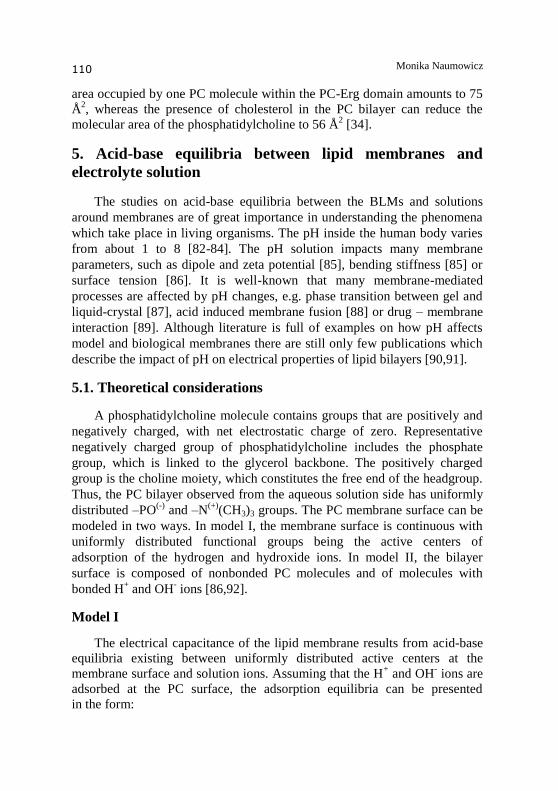
5. Acid-base equilibria between lipid membranes and
electrolyte solution
The studies on acid-base equilibria between the BLMs and solutions
around membranes are of great importance in understanding the phenomena
which take place in living organisms. The pH inside the human body varies
from about 1 to 8 [82-84]. The pH solution impacts many membrane
parameters, such as dipole and zeta potential [85], bending stiffness [85] or
surface tension [86]. It is well-known that many membrane-mediated
processes are affected by pH changes, e.g. phase transition between gel and
liquid-crystal [87], acid induced membrane fusion [88] or drug – membrane
interaction [89]. Although literature is full of examples on how pH affects
model and biological membranes there are still only few publications which
describe the impact of pH on electrical properties of lipid bilayers [90,91].
5.1. Theoretical considerations
A phosphatidylcholine molecule contains groups that are positively and
negatively charged, with net electrostatic charge of zero. Representative
negatively charged group of phosphatidylcholine includes the phosphate
group, which is linked to the glycerol backbone. The positively charged
group is the choline moiety, which constitutes the free end of the headgroup.
Thus, the PC bilayer observed from the aqueous solution side has uniformly
distributed –PO(-)
and –N(+)
(CH3)3 groups. The PC membrane surface can be
modeled in two ways. In model I, the membrane surface is continuous with
uniformly distributed functional groups being the active centers of
adsorption of the hydrogen and hydroxide ions. In model II, the bilayer
surface is composed of nonbonded PC molecules and of molecules with
bonded H+ and OH
- ions [86,92].
Model I
The electrical capacitance of the lipid membrane results from acid-base
equilibria existing between uniformly distributed active centers at the
membrane surface and solution ions. Assuming that the H+ and OH
- ions are
adsorbed at the PC surface, the adsorption equilibria can be presented
in the form:

Impedance of bilayer lipid membranes 111
A H AH (21)
B OH BOH (22)
where:
A- is –PO
(-) group of phosphatidylcholine and B
+ is –N
(+)(CH3)3 group of
phosphatidylcholine.
Consequently, the four groups A-, AH, B
+ and BOH are present at the
bilayer surface.
Acid-base constants can be calculated from surface concentrations of the
bilayer lipid components and volume concentrations of the ions present in
the solution according to the equations:
-
AHA
A H
aK
a a (23)
BOHB
B OH
aK
a a (24)
Taking into account the acid-base equilibria – Eqs. (21) and (22), the surface
concentration of the phosphatidylcholine s can be expressed as:
- AHAa a s (25)
BOHBa a s (26)
where:
BOHBAHAaaaa ,,, [mol m
-2] – the concentrations on the membrane
surface of the membrane components, respectively.
Assuming additivity of the contributions of the individual forms of the
phosphatidylcholine molecule to the electrical capacitance of membrane Cm,
the following equation can be written:
-m AH BOHA BC C C C C (27)

Monika Naumowicz 112
in which:
-
- -
0 A
A A
aC C
s (28)
0 AHAH AH
aC C
s (29)
0 B
B B
aC C
s (30)
0 BOHBOH BOH
aC C
s (31)
where:
-
0 0 0 0, , ,AH BOHA BC C C C [ F cm
-2] – the specific capacitances of the membrane
components, respectively.
Elimination of BOHBAHAaaaa ,,, from the equations system (21)–(31)
yields the equation:
-
0 0 0 01 1
1 1 1 1
BA OHHm AH BOHA B
A A B BH H OH OH
K aK aC C C C C
K a K a K a K a
(32)
Eq. (32) describes the dependence of the electrical capacitance of the lipid
membrane on the pH of the electrolyte solution.
Model II
Since the PC molecule possesses a zwitterionic character, it can
participate in acid-base equilibria with both H+ and OH
-:
PC H PCH (33)
PC OH PCOH (34)
PC HOH PCHOH (35)

Impedance of bilayer lipid membranes 113
Consequently, Eqs. (33)-(35) can be considered as the description of an
adsorption process. As a result of adsorption of hydrogen and hydroxide ions
on the surface of phosphatidylcholine layer, the PC molecule can exist in
four different forms: PCH+ with H
+ adsorbed, PCOH
- with OH
- adsorbed,
PCHOH with both H+ and OH
- ions adsorbed on the surface and a free
phosphatidylcholine molecule PC i.e. with no ions adsorbed (Fig. 11). A
phosphatidylcholine bilayer is assumed to consist of these four forms. The
relative contributions of above forms are dependent on pH, according to
Eqs. (33)-(35).
Assuming that the electrical capacitance of membrane is the sum of the
contributions of the individual forms of the phosphatidylcholine molecule,
the following equation can be presented:
m PCHOH PCPCH PCOHC C C C C (36)
The surface concentrations of the groups considered in Model I can be
written depending on the forms of the PC molecule postulated in Model II:
- -PCA PCOHa a a (37)
AH PCHOHPCHa a a (38)
O N(CH3)3
R2
O
O
R1
O
O
O
O-
PO
H (-) (+)
(+)
OH
PCHOH
(-) O N(CH3)3
R2
O
O
R1
O
O
O
O-
PO
H (-) (+)
(+)
PCH+
O N(CH3)3
R2
O
O
R1
O
O
O
O-
PO
(-)
(+)
OH
PCOH-
(-) O N(CH3)3
R2
O
O
R1
O
O
O
O-
PO
(-)
(+)
PC
Figure 11. Four forms of phosphatidylcholine occurring as a result of adsorption of
H+ and OH- ions on the bilayer surface.
Monika Naumowicz 114
PCB PCHa a a (39)
BOH PCHOHPCOHa a a (40)
where:
PC PCHOHPCOH PCHa ,a ,a ,a [mol m
-2] – the concentrations on the membrane
surface of the membrane components, respectively.
Then, the association acid constant of the groups PC and PCOH- with
the H+ ions (Eq. 23) may be expressed as:
-
PCHOHPCHA
PCH PCOH
a aK
a a a
(41)
and the association base constant of the groups PC and PCH+ with the
OH- ions (Eq. 24) may be presented as:
PCHOHPCOHB
PCOH PCH
a aK
a a a
(42)
On the basis of Eqs. (37)-(40), the surface concentration of the lipid can
be written as:
PCHOH PCPCH PCOHa a a a s (43)
The relationship between the surface concentrations of the membrane
components, the surface concentration of the lipid and the electrical
capacitance values takes a form:
0 0 0 0PCHOH PCH PCOH PCm PCHOH PCPCH PCOH
a aa aC C C C C
s s s s (44)
in which:
0 0 0 0, , ,PCHOH PCPCH PCOH
C C C C [ F cm-2
] – the specific capacitances of the
membrane components, respectively.

Impedance of bilayer lipid membranes 115
The equations connecting surface concentrations of the lipid forms
PC PCHOHPCOH PCHa ,a ,a ,a with surface concentrations of the groups
BOHBAHAaaaa ,,, can be written:
PCHOH BOHAHa aa
s s s (45)
1PCH BOHAHa aa
s s s (46)
1PCOH BOH AHa a a
s s s (47)
1 1PC BOHAHa aa
s s s (48)
The below equations can be obtained on the basis of Eqs. (41)-(43):
1
A HAH PCHOHPCH
A H
K a sa a a
K a (49)
1
B OHBOH PCHOHPCOH
B OH
K a sa a a
K a (50)
Substituting Eqs. (49)-(50) to Eqs. (45)-(48) yields the dependence:
0 0 1
1 1 1 1
BA AOHH Hm PCHOH PCH
A B A BH OH H OH
K aK a K aC C C
K a K a K a K a
0 01 1 1
1 1 1 1
B OHPCPCOH
A B A BH OH H OH
K aC C
K a K a K a K a
(51)
Eq. (51) represents the dependence of the electrical capacitance of the lipid
bilayer on the pH of the electrolyte solution.
Monika Naumowicz 116
5.2. Phosphatidylcholine membranes
The electrochemical impedance spectroscopy measurements were
carried out in pH range from 3.32 to 7.27. Attempts to form bilayer stable
enough in the solution of lower or higher pH were unsuccessful. Presumably,
the large electrostatic forces due to the dissociation of polar groups at the
interface may prevent the formation of a stable bilayer. The minimal Cm
value obtained at pH 4.13 is equal to 0.552 F cm-2
. A quantitative
description of acid-base equilibria based on Rm is not carried out because of
the spread in the measurements of this electrical parameter and the
uncertainty of the results.
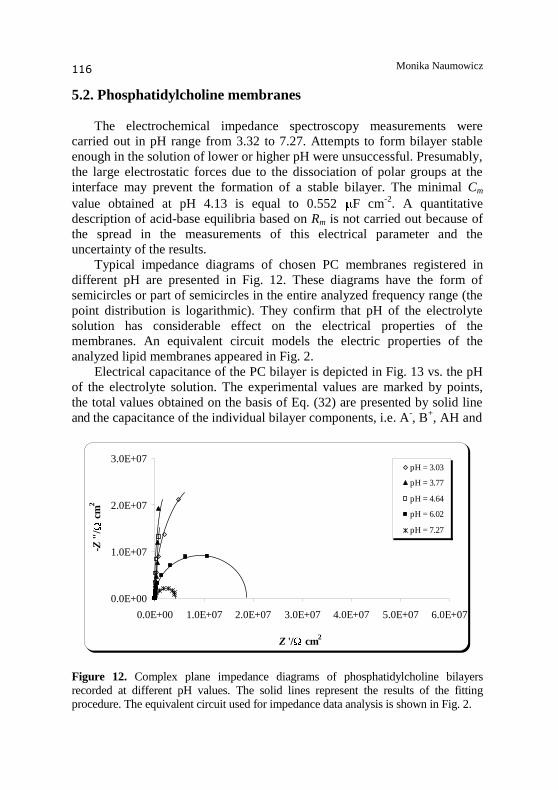
Typical impedance diagrams of chosen PC membranes registered in
different pH are presented in Fig. 12. These diagrams have the form of
semicircles or part of semicircles in the entire analyzed frequency range (the
point distribution is logarithmic). They confirm that pH of the electrolyte
solution has considerable effect on the electrical properties of the
membranes. An equivalent circuit models the electric properties of the
analyzed lipid membranes appeared in Fig. 2.
Electrical capacitance of the PC bilayer is depicted in Fig. 13 vs. the pH
of the electrolyte solution. The experimental values are marked by points,
the total values obtained on the basis of Eq. (32) are presented by solid line
and the capacitance of the individual bilayer components, i.e. A-, B
+, AH and
0.0E+00
1.0E+07
2.0E+07
3.0E+07
0.0E+00 1.0E+07 2.0E+07 3.0E+07 4.0E+07 5.0E+07 6.0E+07
Z '/ cm2
-Z"
/ c
m2
pH = 3.03
pH = 3.77
pH = 4.64
pH = 6.02
pH = 7.27
Figure 12. Complex plane impedance diagrams of phosphatidylcholine bilayers
recorded at different pH values. The solid lines represent the results of the fitting
procedure. The equivalent circuit used for impedance data analysis is shown in Fig. 2.

Impedance of bilayer lipid membranes 117
-4.0E-03
0.0E+00
4.0E-03
8.0E-03
1.2E-02
0 2 4 6 8 10 12
pH of electrolyte solution
Cm
/F
m-2
experimental values A B AH BOH A+AH+B+BOH
Figure 13. The participation of the A and B groups, calculated from the Model I, in
associated and dissociated forms in the electrical capacitance of the
phosphatidylcholine bilayer, as a function of pH of the electrolyte solution.
BOH are marked with broken lines. This figure refers to the earlier described
structural Model I of a phosphatidylcholine membrane surface in which the
functional groups have been assumed to be uniformly distributed on its
surface from the aqueous solution side. Fig. 13 shows that the capacitance
has a minimum value around pH 4.13, and increases almost symmetrically
toward low pH and high pH (similar variation in Cm with pH was reported in
[93]). Disturbances of the symmetry may be caused by difference in the sizes
of the positive and negative ionized groups. The minimal electrical
capacitance of the analyzed bilayers appears at the isoelectric point of the
phosphatidylcholine, which corresponds to the pH at which surface formed
from PC has no net electrical charge, or where the negative and positive
charges are equal [94].
As it is seen in Eq. (32), the total capacitance value of the PC bilayer is
the sum of the capacitance values of its components. In order to calculate the
values of the specific capacitance of these components, the equilibrium
constants of adsorption processes of hydrogen and hydroxide ions on
phosphatidylcholine have to be known. The acid-base equilibrium constants
for PC bilayer were reported in the paper [63], their values are: KA = 102.581
and KB = 105.687
. The association acid constant is assigned to the –PO(-)
group
and the association base constant is attributed to the –N(+)
(CH3)3 group.
From comparison of the association constants it appears that the OH- ion is
more strongly adsorbed than the H+ ion. Introduction of KA and KB values to

Monika Naumowicz 118
Eq. (32) results in specific capacitance values of the individual forms of the
phosphatidylcholine bilayer. The -
0 0 0 0, , ,AH BOHA BC C C C values calculated using
the linear regression method are -0.40 F cm-2
, 0 F cm-2
, 0.94 F cm-2
and
1.12 F cm-2
, respectively. When the specific capacitances of the membrane
components have zero or negative values it is possible to suppose that no
bilayer formed from these forms do exist.
The degree of coverage of the PC membrane surface by associated and
dissociated forms of the groups present at the membrane surface as function
of pH of the electrolyte solution is plotted in Fig. 14. It is seen that at
extreme acidic pH‟s the degree of coverage of the membrane by the H+ ions
is over 0.9, e.g. in this pH range the bilayer is covered by hydrogen ions. As
the pH changes to less acidic values, the concentration of the adsorbed
protons decreases e.g. AH groups begin to lose partially their proton
(AH A-). Around the isoelectric point of PC (pH equal to 4.13), the
surface is almost not covered by the H+ ions. In the proximity of isoelectric
point of PC, there is also almost no coverage of the membrane by OH- ions.
As the pH of the electrolyte solution increases up to basic values, the
concentration of hydroxide ions in solution grows and therefore such ions
begin to bind with B+ groups (B
+ BOH). The coverage with the OH
- ions
is favored at basic pH‟s, it is almost one at pH 7.
The pH dependence of the electrical capacitance of the bilayer
membrane in the electrolyte solution is also plotted in Fig. 15. Points present
the experimental values, the total values of Cm calculated from Eq. (51) are
0.0
0.2
0.4
0.6
0.8
1.0
1.2
0 2 4 6 8 10 12
pH of electrolyte solution
deg
ree
of
cove
rag
e
AH BOH A B
Figure 14. The degree of coverage of the phosphatidylcholine bilayer surface,
calculated from the Model I, with associated and dissociated forms of the A and B
groups as a function of pH of the electrolyte solution.

Impedance of bilayer lipid membranes 119
0.0E+00
2.0E-03
4.0E-03
6.0E-03
8.0E-03
1.0E-02
0 2 4 6 8 10 12
pH of electrolyte solution
Cm
/F m
-2
experimental values PCH
PCOH PC
PCHOH PCHOH+PCH+PCOH+PC
Figure 15. The participation of the individual forms of the phosphatidylcholine
molecules, calculated from the Model II, in the electrical capacitance of the
phosphatidylcholine bilayer, as a function of pH of the electrolyte solution.
presented by a continuous line and the capacitance values of PC membrane
components are marked with broken lines. Fig. 15 refers to the above
presented Model II, in which the PC bilayer surface is composed of
nonbonded molecules and of molecules with bonded H+ and OH
- ions. Based
on Eq. (51), the total membrane capacitance is a sum of capacitances of its
components, i.e. PC, PCH+, PCOH
- and PCHOH. Specific capacitance
values of individual components of the PC membrane were determined by
linear regression method. The obtained values of 0 0 0 0, , ,PC PCHOHPCH PCOHC C C C
amount to 0.53 F cm-2
, 0.94 F cm-2
, 0.72 F cm-2
and 0 F cm-2
,
respectively. When the specific capacitance of the membrane component has
zero value it is possible to suppose that the bilayer formed from this form
does not exist.
The degree of coverage of the phosphatidylcholine membrane surface by
the H+ and OH
- ions as function of pH of the electrolyte solution is shown in
Fig. 16. It is seen that the PC form predominates in the membrane surface
when the pH is near the isoelectric point (like in Fig. 14); the membrane
surface is almost not covered by the hydrogen and hydroxide ions there. In
both descriptions, the degree of coverage of the PC membrane surface by the
H+ and OH
- ions remains unchanged in the ranges below 1.5 and above 7.5.
A head group of amphoteric PC contains two separated oppositely charged
moieties. Then, there is a possibility of strong electrostatic attraction
between hydrophobic parts and appropriate local charge. The negative charge

Monika Naumowicz 120
0.0
0.2
0.4
0.6
0.8
1.0
1.2
0 2 4 6 8 10 12
pH of electrolyte solution
deg
ree
of
cove
rage
0.0E+00
1.0E-03
2.0E-03
3.0E-03
4.0E-03
5.0E-03PCH PCOH PC PCHOH
Figure 16. The degree of coverage of the phosphatidylcholine bilayer surface,
calculated from the Model II, with the individual forms of the molecules as a function
of pH of the electrolyte solution.
of the phosphate group is distributed among four oxygen atoms, while the
positive charge of ammonium group is concentrated on a single nitrogen
atom, which is favorable for electrostatic interaction with anions [95].
The effect of pH on membrane mechanics and electrostatics has not
been systematically studied in membrane bilayers. It was found that the
electrical capacitance of the bilayer depended upon pH. The Cm had a
minimum value around pH 4 for PC membrane and its value increased as the
pH became lower or higher [93]. From the investigation of the
electrophoretic mobility of bilayers, it has been inferred that the isoelectric
point of PC is around pH 4 and in this pH zeta potential is equal zero. Zeta
potential is positive below pH 4 and this is due to the high concentration of
H+
ions in the solution which bind to PC membrane generating a positive
charge on the bilayer surface. Above pH 4 zeta potential is negative and this
is caused by high concentration of OH- ions which are attached to the
membrane inducing a negative charge on the surface [96]. The effect of pH
on PC membrane interfacial tension has been described in [63,86]. The
interfacial tension of PC lipids was observed to increase near pH 4. It was
shown that the description, in which the assumption of the additivity of the
contributions of each individual forms of the PC molecule to the overall
interfacial tension of the membrane was made, resulted in significantly better
description of the dependence on pH than the description based on the Gibbs
isotherm [63].
Impedance of bilayer lipid membranes 121
In this paper, two models describing the surface of the membrane build
from phosphatidylcholine are presented. Model I assumes the equilibria
between -PO(-)
and -N(+)
(CH3)3 groups uniformly distributed on membrane
surface and hydrogen and hydroxide ions. Model II supposes the existence
of four different forms of PC as a result of adsorption of H+ and OH
- ions on
the bilayer surface. Figs. 13-16 show that Model II gives more reliable
results than Model I, in which the negative value of the specific capacitance
of -PO(-)
form shows that this model is not likely from the physicochemical
point of view.
6. Materials and experimental details
6.1. Chemicals and preparation of the forming solutions
All substances used for membrane formation were dissolved in
chloroform and mixed in appropriate proportions to achieve the desired
molar fractions. The solvent was evaporated under a stream of argon.
The dried residues were dissolved in appropriate solvents mixture (e.g.
n-hexadecane: n-butanol 10:1 by volume) to produce a concentration of
20 mg ml-1
. During membrane formation, the solvent mixture was removed,
resulting in a membrane with the same composition as the solution. Samples
were stored at 4 C for less than a week. The preparation and storage
methods provided reproducible electrochemical properties when samples
prepared at different times were examined using impedance spectroscopy.
0.1M potassium chloride solution was used as electrolyte for the
experiment. Potassium chloride was heated before use at 400 C for 4 h to
remove traces of organic material.
The acetate buffer was used as the electrolyte in the pH range of 3.32 to
7.27 in the experiment, in which acid-base equilibria at interface separating
electrolyte solution and phosphatidylcholine bilayer were assumed.
The experiments were performed at a temperature of about 293 1 K.
6.2. Preparation of the bilayer membranes
Bilayer membranes were obtained as bubbles at the Teflon cap
comprising a portion of the measuring vessel. The use of n-hexadecane as a
solvent made it possible to obtain membranes with thickness and capacity
values similar to those of monolayer membranes [97]. The small quantity of
n-butanol had a negligible effect on the impedance parameters of the
bilayers, yet it considerably accelerated membrane formation.

Monika Naumowicz 122
Thinning of the membranes was monitored using reflected light
microscopy with a high-brightness yellow LED source and by measuring the
membrane capacitance.
6.3. Impedance analysis and modeling
Electrochemical impedance spectroscopy was performed with an a.c.
impedance system that included a personal computer, a two-phase lock-in
amplifier and a potentiostat/galvanostat. The electrochemical cell was
connected with a potentiostat via a self-constructed four-electrode
preamplifier with high-impedance inputs; the measuring cell was described
exactly in [27,43]. The use of the four-electrode system in the studies of
electric phenomena occurring in membranes makes it possible to
considerably reduce the errors caused by electrode and electrolyte
impedance [98]. A 4-mV amplitude sine-wave signal perturbation was
applied in the 0.1-10 000 Hz frequency range.
Impedance data were analyzed by using the nonlinear least-squares
fitting to a model represented by an equivalent electrical circuit. The
modeling process was iterative, using the chi-square (χ2) value for the entire
model and the percent error values for each circuit component to determine
the fit of a given model to the experimental data. Components were chosen
basing on theories from electrochemical cell studies and using the Boukamp
suggestion that each component addition should reduce the χ2 value by one-
order of magnitude. According to the literature [99], a χ2 of on the order of
1 10-3
or below was acceptable for a given model.
The membrane images were captured with a color CCD camera. The
bilayer areas were calculated from the photographs, taking into consideration
the spherical nature of the surface and using the equations provided in [100].
The area of the bilayer membranes were between 4 10-2
-8 10-2
cm2
(the
values were given for the bilayer area with subtracted margin).
Each value of the measured parameters was calculated as an arithmetic
mean and standard deviation for at least six membranes. The experimental
impedance values are related to the bilayer surface-area unit.
Conclusion
Investigations presented in this paper have provided valuable
information necessary for the quantitative description of bilayer lipid
membranes. Further studies will be certainly aiming at examinations of
natural membranes. However, preparation of natural membranes so that
possible was access to them from both sides is extremely difficult. Efforts

Impedance of bilayer lipid membranes 123
in this direction can already be seen in the subject literature e.q. patch-clamp
technique.
Acknowledgement
Impedance spectroscopic measurements of the following systems
were supported by a grant from the Polish Committee of Scientific Research
No 1 T09A 070 30: phosphatidylcholine-phosphatidylethanolamine,
phosphatidylethanolamine-cholesterol, sphingomyelin-cholesterol, and
phosphatidylethanolamine- -tocopherol.
References 1. Mueller, P., Rudin, D.O., Tien, H.T., Wescott, W.C. 1961, Symposium on the
Plasma Membrane, American Heart Association and New York Heart
Association, New York, December 8-9, Nature, 194, 1962, 979.
2. Coster, H.G.L. 2003, Planar Lipid Bilayers (BLMs) and their Applications, H.T.
Tien, A. Ottova-Leitmannova (Eds.), Elsevier, Amsterdam, 75.
3. Tien, H.T., and Ottova, A.L. 2001, J. Membr. Sci., 189, 83.
4. Vance, J.E. 2008, J. Lipid Res., 49, 1377.
5. Hauser, H., Pascher, I., Pearson, R.H., and Sundell, S. 1981, Biochim. Biophys.
Acta, 650, 21.
6. Cheng, K.H., and Somerharju, P. 1996, Biophys. J., 70, 2287.
7. Freysz, L., Dreyfus, C., and Vincendon, C. 1982, Phospholipid in the Nervous
System, L. Horrocks (Ed.), Raven Press, New York, 37.
8. Hannun, Y.A. 1996, Science, 274, 1855.
9. White, D.A. 1973, Form and Function of Phospholipids, G.B Ansell, J.N.
Hawthrne, R.M.C. Dawson (Eds.), Elsevier Scientific Publishing Company,
Amsterdam, 117.
10. Bloch, K.E. 1983, CRC Crit. Rev. Biochem., 14, 47.
11. Rigotti, A. 2007, Mol. Aspects Med., 28, 423.
12. Scarpa, M., Rigo, A., Maiorino, M., Ursini, F., and Gregolin, C. 1984, Biochim.
Biophys. Acta, 801, 215.
13. Kagan, V.E., 1988, Ann. N.Y. Acad. Sci., 570, 121.
14. Hianik, T., Passechnik, V.I., Sargent, D.F., Dlugopolsky, J., and Sokolikova, L.
1995, Bioelectrochem. Bioenerg., 37, 61.
15. Zhao L., and Feng, S. 2004, J. Colloid Interf. Sci., 274, 55.
16. Costa, E.J.X., Shida, C.S., Biaggi, M.H., Ito, A.S., and Lamy-Freund, M.T.
1997, FEBS Lett., 416, 103.
17. London, E. 2002, Curr. Opin. Struc. Biol., 12, 480.
18. Coster, H.G.L., Chilcott, T.C., and Coster, A.C.F. 1996, Biochem. Bioenerg., 40, 79.
19. Steinem, C., Janshoff, A., Ulrich, W.P., Sieber, M., and Galla, H.-J. 1996,
Biochim. Biophys. Acta, 1279, 169.
Monika Naumowicz 124
20. Pavlin, M., Kotnik, T., Miklavčič, D., Kramar, P., Macek-Lebar, A.E. 2008,
Advances in Planar Lipid Bilayers and Liposomes, A. Leitmannova Liu (Ed.),
Elsevier, Amsterdam, 165.
21. Hianik, T., and Passechnik, V.I. 1995, Bilayer Lipid Membranes: Structure and
Mechanical Properties, Kluwer Academic Publishers, Dordrecht.
22. Koronkiewicz, S., Bryl, K., Witkowski, S., and Wałejko, P. 1999, Natur. Sci.,
3, 20.
23. Schoch, P., Sargent, D.F., and Schwyzer, R. 1979, J. Membr. Biol., 46, 71.
24. Stern, J., Freisleben, H.J., Janku, S., and Ring, K. 1992, Biochim. Biophys. Acta,
1128, 227.
25. Stelzle, M., Weissműller, G., and Sackmann, E. 1993, J. Phys. Chem., 97, 2974.
26. Alonso-Romanowski, S., Gassa, L.M., and Vilche, J.R. 1995, Electrochim. Acta,
40, 1561.
27. Naumowicz, M., Petelska, A.D., and Figaszewski, Z.A. 2003, Cell. Mol. Biol.
Lett., 8, 5.
28. Cherny, V.V., Sokolo, V.S., and Abidor, I.G. 1980, Bioelectrochem.
Bioenerget., 7, 413.
29. Feldberg, S.W., and Kissel, G. 1975, J. Membr. Biol., 20, 269.
30. Alvarez, O., Brodwick, M., Latorre, R., McLaughlin, A., McLaughlin, S., and
Szabo, G. 1983, Biophys. J., 44, 333.
31. White, S.H. 1970, Biophys. J., 10, 1127.
32. Kalinowski, S., and Figaszewski, Z. 1992, Biochim. Biophys. Acta, 1112, 57.
33. Sargent, D.F., and Hianik, T. 1994, Bioelectrochem. Bioenerget., 33, 11.
34. Tien, H.T. 1974, Bilayer Lipid Membrane: Theory and Practice, Marcel Dekker,
New York.
35. Galluci, E, Micelli, S, and Monticelli, G. 1996, Biophys. J., 71, 824.
36. Genco, I., Gliozzi, A., Relini, A., Robello, M., and Scalas, E. 1993, Biochim.
Biophys. Acta, 1149, 10.
37. Naumowicz, M., Petelska, A.D., and Figaszewski, Z.A. 2006, Electrochim.
Acta, 51, 5024.
38. Naumowicz, M., and Figaszewski, Z.A. 2009, J. Membrane Biol., 227, 67.
39. Naumowicz, M., Petelska, A.D., and Figaszewski Z.A. 2005, Electrochim. Acta,
50, 2155.
40. Naumowicz, M., and Figaszewski, Z.A. 2007, Bulg. Chem. Commun., 39, 175.
European Internet Centre for Impedance Spectroscopy, Impedance Contributions
Online 4 (2006) P1, http://accessimpedance.iusi.bas.bg.
41. Naumowicz, M., Petelska, A.D., and Figaszewski, Z.A. 2008, Acta Biochim.
Polon., 55, 721.
42. Naumowicz, M., and Figaszewski, Z.A. 2009, Bulg. Chem. Commun., 41, 185.
European Internet Centre for Impedance Spectroscopy, Impedance Contributions
Online 6 (2008) P3-1, http://accessimpedance.iusi.bas.bg.
43. Naumowicz, M., Petelska, A.D., and Figaszewski, Z.A. 2011, Cell Biochem.
Biophys., 61, 145.
44. Naumowicz, M., Petelska, A.D., and Figaszewski, Z.A. 2009, Electrochim.
Acta, 54, 1089.

Impedance of bilayer lipid membranes 125
45. Naumowicz, M., and Figaszewski, Z.A. 2005, Biophys. J., 89, 3173.
46. Inczendy, J. 1976, Analytical Applications of Complex Equlibria, Akademiai
Kiado, Budapest, 1976.
47. Beck, M.T., and Nagypal, I. 1990, Complex Equilibria: Stability Constans, Ellis
Horwood Series in Inorganic Chemistry.
48. Leathes, JB. 1925, Lancet, 208, 853.
49. Davis, J.H. 1993, Cholesterol in Membrane Models, L. Finegold (Ed.), CRC
Press, Boca Raton, FL, USA, 67.
50. Paré, C., and Lafleur, M. 1998, Biophys. J., 74, 899.
51. Hianik, T., Haburcak, M., Lohner, K., Prenner, E., Paltauf, F., and Hermetter, A.
1998, Colloids Surf. A, 139, 189.
52. Prestom, M.R., Tulenko T.N., and Jacob, R.F. 2003, Biochim. Biophys. Acta,
1610, 198.
53. Demel, R.A., and De Kruyff, B. 1976, Biochim. Biophys. Acta, 457, 109.
54. Cadenhead, D.A. 1970, Recent Progress in Surface Science, J.F. Danielli, A.C.
Riddiford, M.D. Rosenberg (Eds.), Academic Press, New York & London, 169.
55. Darke, A., Finer, E.G., Flook, A.G., Phillips, M.C. 1971, FEBS Lett., 18, 326.
56. Ohvo-Rekila, H., Ramstedt, B., Leppimaki, P., and Slotte, J.P. 2002, Prog. Lipid
Res., 41, 66.
57. Shigematsu, D., Matsutani, M., Furuya, T., Kiyota, T., Lee, S. and Sugihara, G.
2002, Biochim. Biophys. Acta, 1564, 271.
58. Kahya, N., Scherfeld, D., Bacia, K., and Schwille, P.J. 2004, Struct. Biol.,
147, 77.
59. Somerharju, P., Virtanen, J.A., and Cheng, K.H. 1999, Biochim. Biophys. Acta,
1440, 32.
60. Krysiński, P. 1982, Post. Biochem., 28, 227.
61. Joos, P., and Demel, R.A. 1969, Biochim. Biophys. Acta, 183, 447.
62. Jain, M.K. 1972, The Bimolecular Lipid Membrane, Litton Educational
Publishing Inc., New York.
63. Petelska, A., and Figaszewski, Z.A. 2000, Biophys. J., 78, 812.
64. Imura, T., Sakai, H., Yamauchi, H., Kozawa, K., Yokoyama, S., Matsumoto, M.,
and Abe, M. 2000, Colloids Surf. B, 19, 81.
65. Carrer, D.C., and Maggio, B. 2001, Biochim. Biophys. Acta, 1514, 87.
66. Massey, J.B. 2001, Biochim. Biophys. Acta, 1510, 167.
67. Maggio, B., Ariga, T., Calderón, R.O., and Yu, R.K. 1997, Chem. Phys. Lipids,
90, 1.
68. Messineo, F.C., Rathier, M., Favreau, C., Watras, J., and Takenaka, H. 1984, J.
Biol. Chem., 259, 1336.
69. Dahim, M., and Brockman, H. 1998, Biochemistry, 37, 8369.
70. Langner, M., Isac, T., and Hui, S.W. 1995, Biochim. Biophys. Acta, 1236, 73.
71. Seddon, J.M., Templer, R.H., Warrender, N.A., Huang, Z., Cevc, G., and Marsh,
D. 1997, Biochim. Biophys. Acta, 1327, 131.
72. Petelska, A.D., and Figaszewski, Z.A. 2011, Colloids Surf. B, 82, 340.
73. Vaknin, D. J. 2003, J. Am. Chem. Soc., 125, 1313.

Monika Naumowicz 126
74. Inoue, T., Yanagihara, S., Misono, Y., and Suzuki, M. 2001, Chem. Phys.
Lipids, 109, 117.
75. Boggs, J.M., Rangaraj, G., and Koshy, K.M. 1986, Chem. Phys. Lipids, 40, 23.
76. Engineers Handbook, 1974, WNT Press, Warsaw, Poland.
77. Simons, K., and Ikonen, E. 1997, Nature, 387, 569.
78. Brown, D.A., and London, E. 2000, J. Biol. Chem., 275, 17221.
79. Do1owy, K., Szewczyk, A., and Piku1a, S. 2003, Biological Membranes,
Science Publishing „Silesia”, Katowice, Poland.
80. Naumowicz, M., and Figaszewski, Z.A. 2005, J. Membrane Biol., 205, 29.
81. Demel, R.A., Bruckdorfer, K.R., and van Deenen, L.L.M. 1972, Biochim.
Biophys. Acta., 255, 311.
82. Evans, D.F., Pye, G., Bramley, R., Clark, A.G., Dyson, T.J., and Hardcastle, J.D.
1988, Gut, 29, 1035.
83. D.R. Lide (Ed.), 2005, CRC Handbook of Chemistry and Physics, Internet
Version 2005, http://www.hbcpnetbase.com, CRC Press, Boca Raton, FL.
84. McDowell, A., and McLeod, B.J. 2007, Adv. Drug Del. Rev., 59, 1121.
85. Zhou, Y., and Raphael, R.M. 2007, Biophys. J., 92, 2451.
86. Petelska, A.D., and Figaszewski, Z.A. 2002, Biochim. Biophys. Acta, 1561, 135.
87. Furuike, S., Levadny, V.G., Li, S.J., and Yamazaki, M. 1999, Biophys. J.,
77, 2015.
88. Connor, J., Yatvin, M.B., and Huang, L. 1984, Proc. Natl. Acad. Sci., 81, 1715.
89. Carrozzino, J.M.,. and Khaledi, M.G. 2005, J. Chromatogr. A, 1079, 307.
90. Mclntosh, T.J., Magid, A.D., and Simon S.A. 1990, Biophys. J., 57, 1187.
91. Berkovich, A.K., Lukashev, E.P., and Melik-Nubarov, N.S. 2012, Biochim.
Biophys. Acta, 1818, 375.
92. Naumowicz M., Figaszewski Z.A., Półtorak L. 2013, Electrochim. Acta 91, 367.
93. Ohki, S. 1969, Biophys. J., 9, 1195.
94. Adamson, A.W. 1976, Physical Chemistry of Surfaces, Wiley & Sons,
New York.
95. Shapovalov, V.L. 1998, Thin Solid Films 327/329, 599.
96. Chiriac, R., and Luchian, T. 2007, Biophys. Chem., 130, 139.
97. Karolins C., Coster H.G.L., Chilcott T.C., and Barrow K.D. 1998, Biochim.
Biophys. Acta, 1368, 247.
98. Figaszewski, Z. 1982, J. Electroanal. Chem., 139, 309.
99. Cui, X.Y., and Martin, D.C. 2003, Sens Actuators B, 89, 92.
100. Bronsztejn, I.N., and Siemiendiajew, K.A. 1996, Mathematics.
The Encyclopedic Handbook, Polish Scientific Publishers PWN, Warsaw.