Recent Developments in Address-Based Sampling (ABS) · Recent Developments in Address-Based...
30
Recent Developments in Address-Based Sampling (ABS) Mansour Fahimi Dale Kulp and David Malarek FedCASIC Workshop March 17-19, 2009
Transcript of Recent Developments in Address-Based Sampling (ABS) · Recent Developments in Address-Based...

Recent Developments inAddress-Based Sampling (ABS)
Mansour FahimiDale Kulp and David Malarek
FedCASIC WorkshopMarch 17-19, 2009
Presentation Outline
Emerging Alternatives in Survey Administrations
Issues with the “Old Methods”
Need for More Flexible/Innovative Methods
Using DSF for Sampling Purposes
Potential Issues with DSF as a Sampling Frame
Possible Enhancements of DSF

Emerging Alternatives in Survey Administrations
Address-based sampling (ABS) methodologies are gaining popularity for several reasons:
Evolving coverage problems associated with telephone-based samples
Eroding rates of response to single modes of contact along with the increasing costs of remedies to reduce nonresponse
Recent improvements in the databases of household addresses available to researchers

Coverage Problems for Telephone Surveys(The Cell Phone Invasion)
A growing number of households are becoming cell-only or cell-mostly
According to NCHS more than 3 out of 10 adults in the U.S. receive all or nearly all calls on cell phones
Cell-only and cell-mostly individuals have different characteristics than the general public – younger and more mobile
If these individuals are not included in surveys results can be biased

Coverage Problems for Telephone Surveys (Composition of the Landline Frame)
1,000,000
1,500,000
2,000,000
2,500,000
3,000,000
3,500,000
4,000,000
4,500,000
2000 2004 2008 2009
0-Listed HH 1+ Listed HH Non-Genesys
Distribution of the 100-Series Telephone Number BanksNPA-NXX-XX00 to NPA-NXX-XX99
Presenter
Presentation Notes
Top 10 residential VoIP providers, which does not include Magic-Jack http://www.top10voipproviders.com/top_voip_providers_residential.php Magic-Jack claims they are signing more than a quarter of a million subscribers a month! http://www.magicjack.com/7/index.asp

Coverage Problems for Telephone Surveys(The Landline Frame Diffusion)
In 1995 Westat and MSG estimated the percentage of households in 0-listed banks to be only 3.7%Results from the 2008 study:
Disposition1+Listed
100-Banks(n = 9,062)
0-Listed100-Banks(n = 20,000)
RemainingPOTS
(n = 8,937)Total
Residential 80.5% 14.5% 5.0% 100%
Business 35.7% 51.2% 13.1% 100%
Nonworking 23.9% 49.1% 27.0% 100%

Eroding Rates of Response to Telephone Surveys
45%
50%
55%
60%
65%
70%
75%
1992 1993 1994 1995 1996 1997 1998 1999 2000 2001 2002 2003 2004 2005 2006 2007
Response Rate for the BRFSS Surveys

Need for More Flexible/Innovative Methods
Researchers are struggling with the “old” methods of survey administration:
Evolving coverage problems of telephone surveys
Prohibitive costs of in-person surveys
Growing rates of nonresponse to single mode methods
Multi-mode methods are gaining popularity because different modalities can be combined effectively to:
Improve coverage
Boost response rates
Reduce cost

Pros and Cons of Multi-Mode Alternatives
In comparison to single-mode methods of data collection multi-mode methods can (Link 2006, 2007, 2008):
RDD – Improve response and coverage ratesIn-person – Reduce cost and time significantlyMail – Improve response rates
Addressed-based sampling methods provide a convenient framework for multi-mode alternatives

Pros and Cons of Multi-Mode Alternatives
There are concerns about systematic differences when collecting similar data using different modes (Dillman 1996)
There is a greater likelihood for socially desirable responses to sensitive questions in interviewer-administered surveys (Aquilino 1994)
The rate of missing data is higher in self-administered surveys as compared to interviewer-administered surveys (Biemer 2003)

Pros and Cons of Multi-Mode Alternatives
Is it feasible to untangle the convoluted interactions between the mode, interviewer, respondent, and survey contents (Voogt & Saris 2005)?
Is mode effect simply a reflection of respondents’ preference or comfort level with different modes of survey administration?
Maybe “techie” respondents are more comfortable (prefer) a web-based method
Maybe older respondents prefer an interviewer
Maybe sensitive questions should be asked via IVR
Presenter
Presentation Notes
Interactive voice response (IVR) is a technology that allows a computer to detect voice and keypad inputs. http://en.wikipedia.org/wiki/Interactive_voice_response

Pros and Cons of Multi-Mode Alternatives
Whatever a respondent’s preference might be, it is better to have them than to loose them
To reduce mode effect in multi-mode surveys need to:
Minimize differences in survey instruments for each mode of administration
Devise effective weighting adjustments to account for differences in the profile of respondents to each mode

Improvements in Databases of Household Addresses
The Delivery Sequence File (DSF) of the USPS is a database that contains all delivery point addressesThe first generation of DSF included over 125 million records with the following delivery features:
Address validation and standardizationZIP+4 and carrier route codingDelivery sequenceDetection of addresses that are potentially undeliverableDelivery-type code that indicates business or residentialSeasonal delivery information

Improvements in Databases of Household Addresses
With more than 135 million addresses the second generation of DSF is the most complete address database availableBy providing the most current delivery information and improved address hygiene this system helps reduce cost and improve efficiency by:
Reducing the number of undeliverable-as-addressed mailings
Increasing the speed of delivery
Given daily feedback from thousands of letter carriers the database is updated on a nearly continuous basis

Using DSF for Sample Survey PurposesHow?
Start with an address-based sample down to ZIP+4:Stratified or random across the entire domain
Clustered in an area probability fashion if in-person attempts are contemplated as part of the design
Initial contacts can be by phone and/or mail and include attempts for:
Survey administration at the point of initial contact
Recruitment for participation via other modes
Once contact has been established follow-up attempts can take place in any order or combination of modes.

Available Data Items(DSF File Layout)
ZipZip+4Walk Sequence NumberRoute TypePO Box ThrowbackHouse NumberPre Directional: NE and WStreet NameStreet Suffix, Ave, BlvdPost Directional: NE and NWSecondary Unit DescriptorApt NumberDelivery Type CodeVacant Code
Drop IndicatorDrop CountSeasonal CodeCarrier RouteDelivery PointDelivery Point Check DigitCity CodeState CodeCountyTractBlockNormalized addressCity NameState Name

Topology of the DSF(Delivery Point Type Indicator)
Business: Indicates the delivery point is a business address
Central: The delivery point is serviced at a mail receptacle located within a centralized unit
CMRA (Commercial Mail Receiving Agency): A private business that acts as a mail-receiving agent for specific clients
Curb: The delivery point is serviced via motorized vehicle at a mail receptacle located at the curb
Drop: A delivery point or receptacle that services multiple residences such as a shared door slot or a boarding house in which mail is distributed internally by the site
Educational: Identified as an educational facility such as colleges, universities, dormitories, sorority or fraternity houses, and apartment buildings occupied primarily by students

Topology of the DSF(Delivery Point Type Indicator)
NDCBU (Neighborhood Delivery Collection Box Unit): Services at a mail receptacle located within a cluster box
No-Stat: Indicates address is not receiving delivery and is not counted as a possible delivery point for various reasons
Seasonal: Receives mail only during a specific season and the months the seasonal addresses are occupied are identified
Throwback: Address associated with this delivery point is a street address but the delivery is made to the customer’s PO Box address
Vacant: Was active in the past, but is currently vacant (in most cases unoccupied over 90 days) and not receiving delivery

Potential Issues When Using DSF for Sampling
Certain households have a higher likelihood of not being included as a delivery point (simplified addresses void of delivery information such as street or P.O. Box number):
The coverage rate diminishes with population density in areas where home delivery of mail is unavailable (Staab & Iannacchione 2003)
When comparing on-site enumerated addresses to those from DSF the rate of mismatches may be high in rural areas (Dohrmann & Mohadjer 2006)
A minor source of non-coverage is due to households that request that their addresses not be sold (O’Muircheartaigh 2003)
Rural area addresses go through the 911 address conversion to acquire a city-style format and become un-simplified

Potential Issues When Using DSF for Sampling(Counts of Simplified Addresses by Year)
0
1,000,000
2,000,000
3,000,000
4,000,000
5,000,000
6,000,000
7,000,000
8,000,000
9,000,000
10,000,000
2004 2005 2006 2007 20008 2009
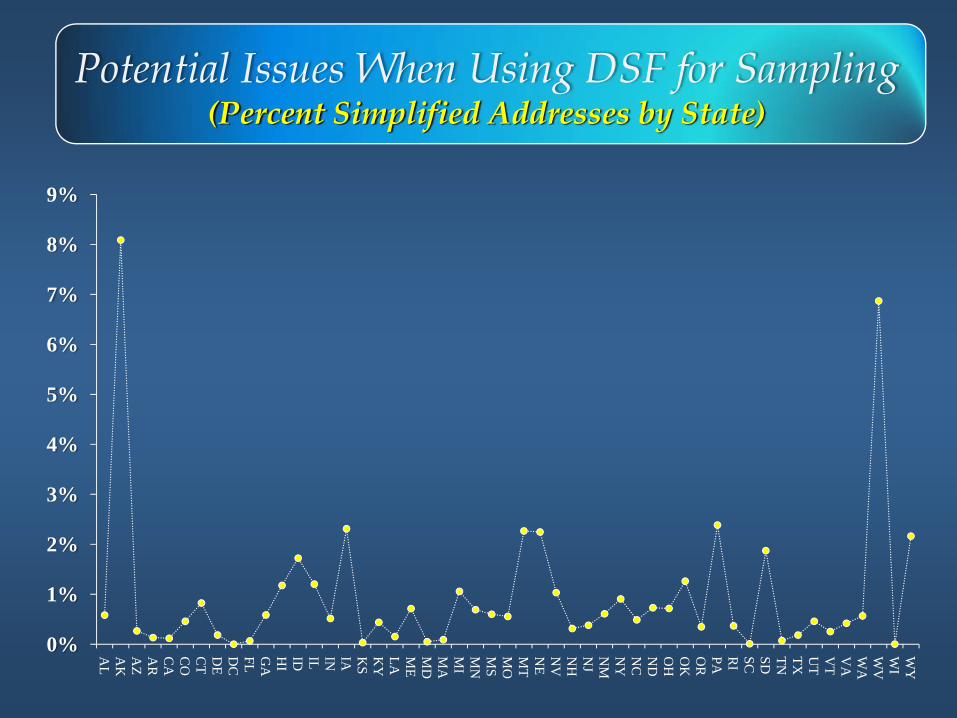
Potential Issues When Using DSF for Sampling(Percent Simplified Addresses by State)
0%
1%
2%
3%
4%
5%
6%
7%
8%
9%
AL
AK
AZ
AR
CA
CO
CT
DE
DC
FL GA
HI
ID IL IN IA KS
KY
LA ME
MD
MA
MI
MN
MS
MO
MT
NE
NV
NH
NJ
NM
NY
NC
ND
OH
OK
OR
PA RI
SC SD TN TX UT
VT
VA
WA
WV
WI
WY

Possible Enhancements of DSF
“Raw” DSF contains very little information to be suitable for complex sample surveys
Many list suppliers simply offer basic extracts from the DSF without any enhancements
Possible enhancements include appendage of:Simplified address resolution
Geographic information
Household demographic information
Name and telephone number retrievals

Possible Enhancements of DSF(Simplified Address Resolution)
A carrier route consists of 100 to 2,500 households served by an individual mail carrier within a five-digit ZIP Code area.
There are approximately 570,000 carrier routes in the U.S.Simplified
Box Route
Rural Route
City Route
Highway Contract Route
General Delivery Route
DSF provides only counts of addresses (physical or P.O. Box) in simplified routes.

Possible Enhancements of DSF(Augmentation of DSF for Simplified Addresses)
DSF contains all addresses in all non-simplified carrier routes (Box, Rural, and City).
Can obtain a list of all simplified carrier routes and counts of active simplified addresses in each route.
There are legitimate city-style addresses in simplified carrier routes available via commercial databases such as: Experian, infoUSA, and Axiom.
Such addresses can be identified using the various databases available to MSG and added to DSF.

Possible Enhancements of DSF(Resolution Summary for DSF-Based Samples)
There are about 134 million residential addresses of all types:
The latest DSF contains 852,723 simplified addresses
MSG can augment about 718,121 addresses
Augmented sampling frame covers over 99% of all residential addresses in the U.S.

Possible Enhancements of DSF(Appending Information)
Geographic Information Enactments:Census geographic domains
Marketing and media domains
Household Information Enhancements:Direct household data from commercial databases
Molded household statistics at various levels of aggregation
Name and Telephone Number Retrievals:Append names to addresses (about 85%)
Retrieve telephone numbers (about 60%)

Closing Remarks
Single-mode methods of data collection are problematic for response rate, coverage, and cost reasons.
Telephone surveys based on landline RDD samples are subject to non-ignorable coverage bias.
Multi-mode methods of data collection can reduce some of the problems associated with single-mode methods.
DSF provides a natural and efficient framework for design and implementation of multi-mode surveys.
Available enhancements for the DSF can significantly improve its coverage and expand its utility for design and analytical applications.

References and Citations
Aquilino, W.S. (1994). Interview mode effects in surveys of drug and alcohol use: a field experiment. Public Opinion Quarterly, 58, 210-40.Biener, L., Garrett, C.A., Gilpin, E.A., Roman, A.M., & Currivan, D.B. (2004). Consequences of declining survey response rates for smoking prevalence estimates. American Journal of Preventive Medicine, 27(3), 254-257.Biemer, P.P. & Lyberg, L.E. (2003). Introduction to Survey Quality, New York: John Wiley & Sons, Inc.Blumberg, S. J. and Luke, V. J. (2007). “Wireless Substitution: Early Release of Estimates from the National Health Interview Survey.”Brick, J. M., J. Waksberg, D. Kulp, and A. Starer. 1995. “Bias in List-Assisted Telephone Samples.” Public Opinion Quarterly, 59: 218-235.Curtin, R., Presser, S., & Singer, E. (2005). Changes in telephone survey nonresponse over the past quarter century. Public Opinion Quarterly, 69, 87-98.de Leeuw, E. & de Heer, W. (2002). Trends in household survey nonresponse: a longitudinal and international comparison. In R. M. Groves, D. A. Dillman, J. L. Eltinge (Eds.), Survey Nonresponse (pp. 41-54). New York: John Wiley & Sons, Inc.Dillman, D. A. 1991. The Design and Administration of Mail Surveys, Annual Review of Sociology, 17, 225-249.
References and CitationsDillman, D., Sangster, R., Tanari, J., & Rockwood, T. (1996). Understanding differences in people’s answers to telephone and mail surveys. In Braverman, M.T. & Slater J.K. (eds.), New Directions for Evaluation Series: Advances in Survey Research. San Francisco: Jossey-Bass.Dohrmann, S., Han, D. & Mohadjer, L. (2006). Residential Address Lists vs. Traditional Listing: Enumerating Households and Group Quarters. Proceedings of the American Statistical Association, Survey Methodology Section, Seattle, WA. pp. 2959- 2964.Groves, R.M. (2005). Survey Errors and Survey Costs, New York: John Wiley & Sons, Inc.Fahimi, M., M. W. Link, D. Schwartz, P. Levy & A. Mokdad (2008). “Tracking Chronic Disease and Risk Behavior Prevalence as Survey Participation Declines: Statistics from the Behavioral Risk Factor Surveillance System and Other National Surveys.” Preventing Chronic Disease(PCD), Volume 5: No. 3.Fahimi, M., D. Creel, P. Siegel, M. Westlake, R. Johnson, & J. Chromy (2007b). “Optimal Number of Replicates for Variance Estimation.” Third International Conference on Establishment Surveys (ICES-III), Montreal, Canada.Fahimi, M., Chromy J., Whitmore W., & Cahalan M. Efficacy of Incentives in Increasing Response Rates. (2004). Proceedings of the Sixth International Conference on Social Science Methodology. Amsterdam, Netherlands.Fahimi, M., Kulp, D. & Brick, J. M. (2008). Bias in RDD Sampling: A 21th Century Digital World Reassessment. Presented at the American Association for Public Opinion Research Annual Conference, New Orleans, LA.

References and Citations
Gary, S. (2003). Is it Safe to Combine Methodologies in Survey Research? MORI Research Technical Report.Iannacchione, V., Staab, J., & Redden, D. (2003). Evaluating the use of residential mailing addresses in a metropolitan household survey. Public Opinion Quarterly, 76:202-210.Link, M., M. Battaglia, M. Frankel, L. Osborn, & A. Mokdad. (2006). Addressed-based versus Random-Digit-Dial Surveys: Comparison of Key Health and Risk Indicators. American Journal of Epidemiology, 164, 1019 - 1025.O’Muircheartaigh, C., Eckman, S., & Weiss, C. (2003). Traditional and enhanced field listing for probability sampling. Proceedings of the American Statistical Association, Survey Methodology Section (CD-ROM), Alexandria, VA, pp.2563- 2567.Staab, J.M., & Iannacchione, V.G. (2004). Evaluating the use of residential mailing addresses in a national household survey. Proceedings of the American Statistical Association, Survey Methodology Section (CD-ROM), Alexandria, VA, pp.4028- 4033.Voogt, R. & Saris, W. (2005). Mixed mode designs: finding the balance between nonresponse bias and mode effects. Journal of Official Statistics. 21, 367-387.Wilson, C., Wright, D., Barton, T. & Guerino, P. (2005). "Data Quality Issues in a Multi-mode Survey" Paper presented at the Annual Meeting of the American Association for Public Opinion Research, Miami, FL.