Received 15 August 2020; accepted 19 November 2020
22
African Crop Science Journal, Vol. 28, No. 4, pp. 595 - 616 ISSN 1021-9730/2020 $4.00 Printed in Uganda. All rights reserved © 2020, African Crop Science Society African Crop Science Journal by African Crop Science Society is licensed under a Creative Commons Attribution 3.0 Uganda License. Based on a work at www.ajol.info/ and www.bioline.org.br/cs DOI: https://dx.doi.org/10.4314/acsj.v28i4.9 PREDICTED LAND USE AND LAND COVER OUTLOOK FOR SEMI-ARID LOKERE AND LOKOK CATCHMENTS IN KARAMOJA REGION, UGANDA R. OSALIYA, O.V. WASONGA, J-G. MAJALIWA MWANJALOLO 1 , L. MACOPIYO, G. KIRONCHI and E. ADIPALA 2 Department of Land Resource Management and Agricultural Technology, University of Nairobi, P. O. Box 29053-00625, Nairobi, Kenya 1 School of Forestry, Environment and Geographical Sciences, Makerere University, P. O. Box 7062 Kampala, Uganda 2 Regional Universities Forum for Capacity Building in Agriculture, P. O. Box 16811, Wandegeya, Kampala, Uganda Corresponding author: [email protected] (Received 15 August 2020; accepted 19 November 2020) ABSTRACT The semi-arid Lokere and Lokok catchments in northeastern Uganda are experiencing land use and land cover (LULC) change driven by policies and actions aimed at pastoralist sedentarisation. While these efforts present a trajectory of a landscape dominated by farming, livestock herding or grazing persists. The objective of this study was to project medium, and long-term LULC for Lokere and Lokok catchments in Karamoja, Uganda. We applied automatic multi-perceptron neural network, built on Markov chain modeling method, along with multi-criteria evaluation strategies; all embedded in the IDRISI Land Change Modeler (LCM) to project the catchments’ LULC to the year 2030 and 2050. The model was trained using 1994 and 2003 LULC, and validated with 2013 LULC. Results of three modelled policy scenarios; business as usual (BAU), pro-livestock and pro-farming; to the years 2030 and 2050 showed that small scale farming (SSF) would increase in all scenarios, even if policy shifts to promote livestock rearing. Pro-farming policies would, in both 2030 and 2050, result in reduction of grassland as SSF increases; doubling the 2003 land area by 2050. The results of this study facilitate assessment of potential impacts of the future LULC and policy evaluation in the catchments. Key Words: Land Change Modeler, land policy evaluation, pastoralism, sedentarisation RÉSUMÉ Les bassins versants semi-arides de Lokere et de Lokok dans le nord-est de l’Ouganda connaissent un changement d’utilisation des terres et de couverture terrestre (UTCT) motivé par des politiques et des actions visant la sédentarisation des pasteurs. Si ces efforts présentent une trajectoire d’un paysage dominé par l’agriculture, l’élevage ou le pâturage persiste. L’objectif de cette étude était de projeter une UTCT à moyen et long terme pour les bassins versants de Lokere et Lokok à Karamoja, en
Transcript of Received 15 August 2020; accepted 19 November 2020

African Crop Science Journal, Vol. 28, No. 4, pp. 595 - 616 ISSN 1021-9730/2020 $4.00
Printed in Uganda. All rights reserved © 2020, African Crop Science Society
African Crop Science Journal by African Crop Science Society is licensed under
a Creative Commons Attribution 3.0 Uganda License. Based on a work
at www.ajol.info/ and www.bioline.org.br/cs
DOI: https://dx.doi.org/10.4314/acsj.v28i4.9
PREDICTED LAND USE AND LAND COVER OUTLOOK FOR SEMI-ARIDLOKERE AND LOKOK CATCHMENTS IN KARAMOJA REGION, UGANDA
R. OSALIYA, O.V. WASONGA, J-G. MAJALIWA MWANJALOLO1, L. MACOPIYO,
G. KIRONCHI and E. ADIPALA2
Department of Land Resource Management and Agricultural Technology, University of Nairobi,
P. O. Box 29053-00625, Nairobi, Kenya1 School of Forestry, Environment and Geographical Sciences, Makerere University, P. O. Box 7062
Kampala, Uganda2 Regional Universities Forum for Capacity Building in Agriculture, P. O. Box 16811, Wandegeya,
Kampala, Uganda
Corresponding author: [email protected]
(Received 15 August 2020; accepted 19 November 2020)
ABSTRACT
The semi-arid Lokere and Lokok catchments in northeastern Uganda are experiencing land use and
land cover (LULC) change driven by policies and actions aimed at pastoralist sedentarisation. While
these efforts present a trajectory of a landscape dominated by farming, livestock herding or grazing
persists. The objective of this study was to project medium, and long-term LULC for Lokere and
Lokok catchments in Karamoja, Uganda. We applied automatic multi-perceptron neural network, built
on Markov chain modeling method, along with multi-criteria evaluation strategies; all embedded in the
IDRISI Land Change Modeler (LCM) to project the catchments’ LULC to the year 2030 and 2050. The
model was trained using 1994 and 2003 LULC, and validated with 2013 LULC. Results of three
modelled policy scenarios; business as usual (BAU), pro-livestock and pro-farming; to the years 2030
and 2050 showed that small scale farming (SSF) would increase in all scenarios, even if policy shifts to
promote livestock rearing. Pro-farming policies would, in both 2030 and 2050, result in reduction of
grassland as SSF increases; doubling the 2003 land area by 2050. The results of this study facilitate
assessment of potential impacts of the future LULC and policy evaluation in the catchments.
Key Words: Land Change Modeler, land policy evaluation, pastoralism, sedentarisation
RÉSUMÉ
Les bassins versants semi-arides de Lokere et de Lokok dans le nord-est de l’Ouganda connaissent un
changement d’utilisation des terres et de couverture terrestre (UTCT) motivé par des politiques et des
actions visant la sédentarisation des pasteurs. Si ces efforts présentent une trajectoire d’un paysage
dominé par l’agriculture, l’élevage ou le pâturage persiste. L’objectif de cette étude était de projeter
une UTCT à moyen et long terme pour les bassins versants de Lokere et Lokok à Karamoja, en
R. OSALIYA et al.596
Ouganda. Nous avons appliqué un réseau neuronal multi-perception automatique, construit sur la
méthode de modélisation de chaîne de Markov, ainsi que des stratégies d’évaluation multicritères;
tous intégrés dans le modèle IDRISI Land Change Modeler (LCM) pour projeter le UTCT des bassins
versants jusqu’en 2030 et 2050. Le modèle a été formé à l’aide de 1994 et 2003 UTCT, et validé avec
UTCT de 2013. Résultats de trois scénarios de politique modélisés; business as usual (BAU), pro-
bétail et pro-agriculture; a montré que l’agriculture à petite échelle (SSF) augmenterait dans tous les
scénarios, même si les politiques changeaient pour promouvoir l’élevage pour les années 2030 et 2050.
Des politiques favorables à l’agriculture entraîneraient, en 2030 et 2050, une réduction des prairies à
mesure que les champs de culture augmentent; doubler sa superficie de 2003 d’ici 2050. Les résultats
de cette étude facilitent l’évaluation des impacts potentiels de UTCT future et l’évaluation des politiques
dans les bassins versants.
Mots Clés : modeleur de changement foncier, évaluation de politique foncière, pastoralisme,
sédentarisation
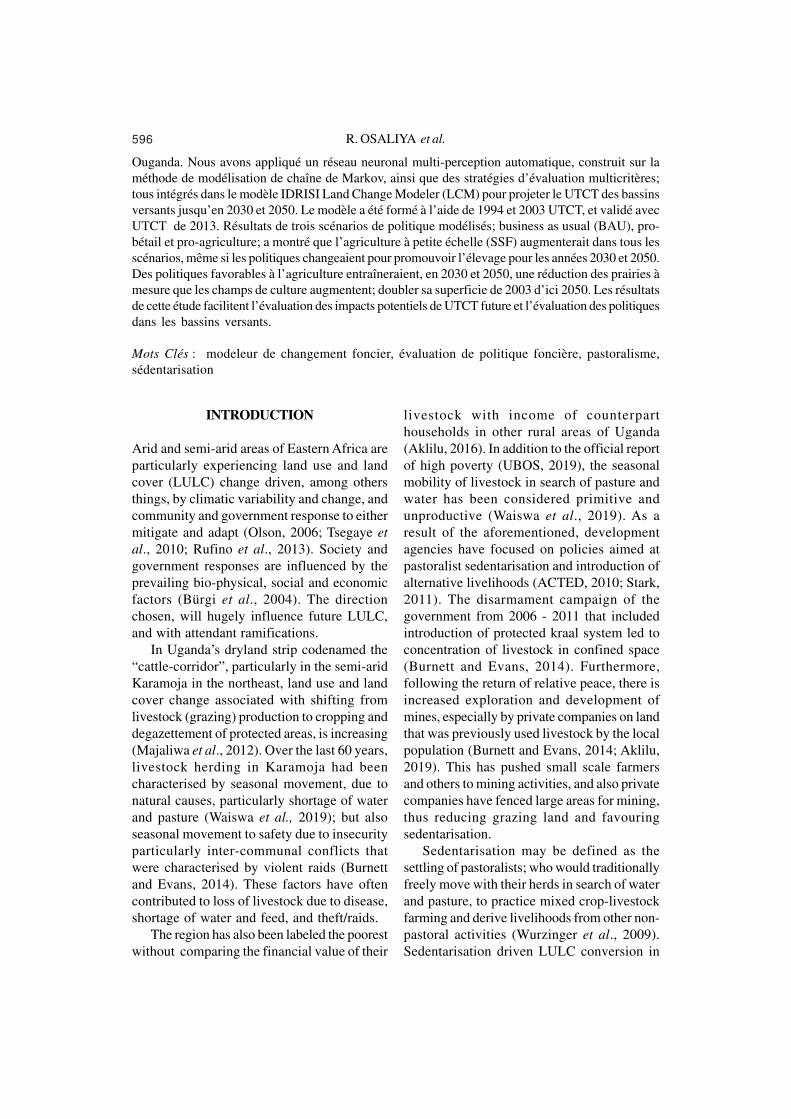
INTRODUCTION
Arid and semi-arid areas of Eastern Africa are
particularly experiencing land use and land
cover (LULC) change driven, among others
things, by climatic variability and change, and
community and government response to either
mitigate and adapt (Olson, 2006; Tsegaye et
al., 2010; Rufino et al., 2013). Society and
government responses are influenced by the
prevailing bio-physical, social and economic
factors (Bürgi et al., 2004). The direction
chosen, will hugely influence future LULC,
and with attendant ramifications.
In Uganda’s dryland strip codenamed the
“cattle-corridor”, particularly in the semi-arid
Karamoja in the northeast, land use and land
cover change associated with shifting from
livestock (grazing) production to cropping and
degazettement of protected areas, is increasing
(Majaliwa et al., 2012). Over the last 60 years,
livestock herding in Karamoja had been
characterised by seasonal movement, due to
natural causes, particularly shortage of water
and pasture (Waiswa et al., 2019); but also
seasonal movement to safety due to insecurity
particularly inter-communal conflicts that
were characterised by violent raids (Burnett
and Evans, 2014). These factors have often
contributed to loss of livestock due to disease,
shortage of water and feed, and theft/raids.
The region has also been labeled the poorest
without comparing the financial value of their
livestock with income of counterpart
households in other rural areas of Uganda
(Aklilu, 2016). In addition to the official report
of high poverty (UBOS, 2019), the seasonal
mobility of livestock in search of pasture and
water has been considered primitive and
unproductive (Waiswa et al., 2019). As a
result of the aforementioned, development
agencies have focused on policies aimed at
pastoralist sedentarisation and introduction of
alternative livelihoods (ACTED, 2010; Stark,
2011). The disarmament campaign of the
government from 2006 - 2011 that included
introduction of protected kraal system led to
concentration of livestock in confined space
(Burnett and Evans, 2014). Furthermore,
following the return of relative peace, there is
increased exploration and development of
mines, especially by private companies on land
that was previously used livestock by the local
population (Burnett and Evans, 2014; Aklilu,
2019). This has pushed small scale farmers
and others to mining activities, and also private
companies have fenced large areas for mining,
thus reducing grazing land and favouring
sedentarisation.
Sedentarisation may be defined as the
settling of pastoralists; who would traditionally
freely move with their herds in search of water
and pasture, to practice mixed crop-livestock
farming and derive livelihoods from other non-
pastoral activities (Wurzinger et al., 2009).
Sedentarisation driven LULC conversion in
597Land use and land cover outlook for semi-arid catchments
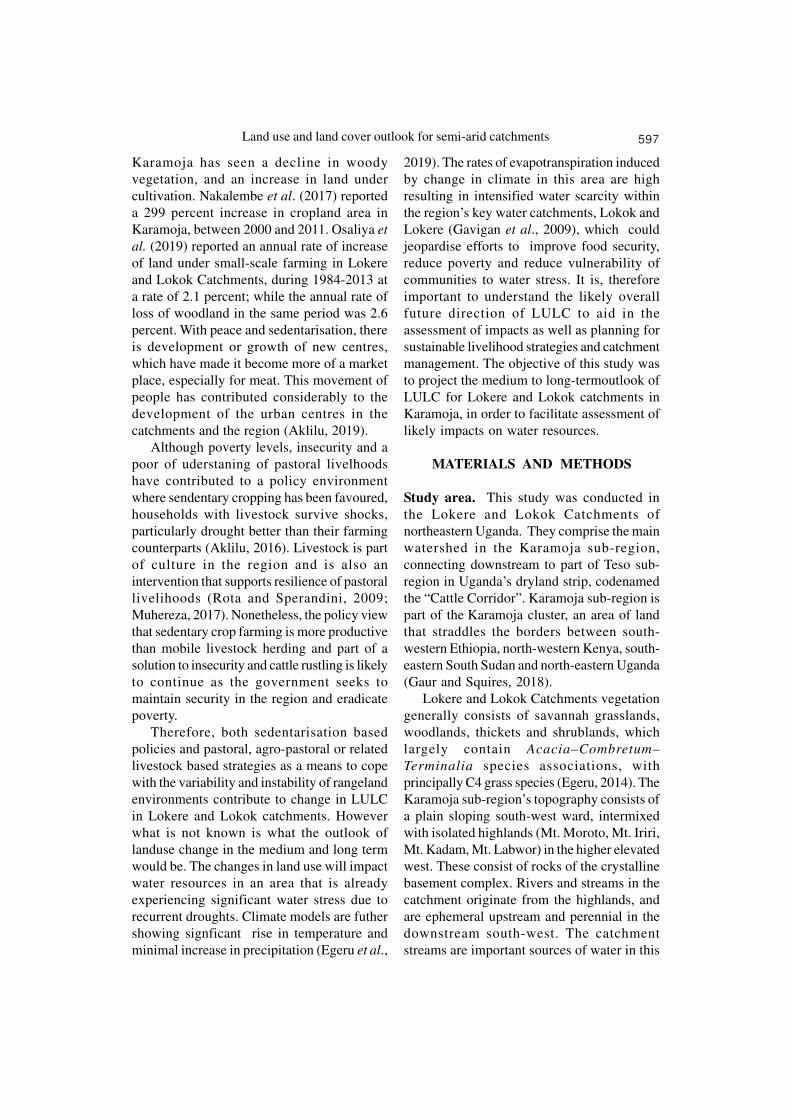
Karamoja has seen a decline in woody
vegetation, and an increase in land under
cultivation. Nakalembe et al. (2017) reported
a 299 percent increase in cropland area in
Karamoja, between 2000 and 2011. Osaliya et
al. (2019) reported an annual rate of increase
of land under small-scale farming in Lokere
and Lokok Catchments, during 1984-2013 at
a rate of 2.1 percent; while the annual rate of
loss of woodland in the same period was 2.6
percent. With peace and sedentarisation, there
is development or growth of new centres,
which have made it become more of a market
place, especially for meat. This movement of
people has contributed considerably to the
development of the urban centres in the
catchments and the region (Aklilu, 2019).
Although poverty levels, insecurity and a
poor of uderstaning of pastoral livelhoods
have contributed to a policy environment
where sendentary cropping has been favoured,
households with livestock survive shocks,
particularly drought better than their farming
counterparts (Aklilu, 2016). Livestock is part
of culture in the region and is also an
intervention that supports resilience of pastoral
livelihoods (Rota and Sperandini, 2009;
Muhereza, 2017). Nonetheless, the policy view
that sedentary crop farming is more productive
than mobile livestock herding and part of a
solution to insecurity and cattle rustling is likely
to continue as the government seeks to
maintain security in the region and eradicate
poverty.
Therefore, both sedentarisation based
policies and pastoral, agro-pastoral or related
livestock based strategies as a means to cope
with the variability and instability of rangeland
environments contribute to change in LULC
in Lokere and Lokok catchments. However
what is not known is what the outlook of
landuse change in the medium and long term
would be. The changes in land use will impact
water resources in an area that is already
experiencing significant water stress due to
recurrent droughts. Climate models are futher
showing signficant rise in temperature and
minimal increase in precipitation (Egeru et al.,
2019). The rates of evapotranspiration induced
by change in climate in this area are high
resulting in intensified water scarcity within
the region’s key water catchments, Lokok and
Lokere (Gavigan et al., 2009), which could
jeopardise efforts to improve food security,
reduce poverty and reduce vulnerability of
communities to water stress. It is, therefore
important to understand the likely overall
future direction of LULC to aid in the
assessment of impacts as well as planning for
sustainable livelihood strategies and catchment
management. The objective of this study was
to project the medium to long-termoutlook of
LULC for Lokere and Lokok catchments in
Karamoja, in order to facilitate assessment of
likely impacts on water resources.
MATERIALS AND METHODS
Study area. This study was conducted in
the Lokere and Lokok Catchments of
northeastern Uganda. They comprise the main
watershed in the Karamoja sub-region,
connecting downstream to part of Teso sub-
region in Uganda’s dryland strip, codenamed
the “Cattle Corridor”. Karamoja sub-region is
part of the Karamoja cluster, an area of land
that straddles the borders between south-
western Ethiopia, north-western Kenya, south-
eastern South Sudan and north-eastern Uganda
(Gaur and Squires, 2018).
Lokere and Lokok Catchments vegetation
generally consists of savannah grasslands,
woodlands, thickets and shrublands, which
largely contain Acacia–Combretum–
Terminalia species associations, with
principally C4 grass species (Egeru, 2014). The
Karamoja sub-region’s topography consists of
a plain sloping south-west ward, intermixed
with isolated highlands (Mt. Moroto, Mt. Iriri,
Mt. Kadam, Mt. Labwor) in the higher elevated
west. These consist of rocks of the crystalline
basement complex. Rivers and streams in the
catchment originate from the highlands, and
are ephemeral upstream and perennial in the
downstream south-west. The catchment
streams are important sources of water in this
R. OSALIYA et al.598
semi-arid area, especially during the dry season
(Mbogga, 2014). Catchment hydrology
oscillates with the stochastic climate events
in the sub-region. Consequently, streamflow
in most of the rivers in the region are
dominated by the baseflow component for
much of the year, with a correlative response
pattern to groundwater. More often than not,
standing water with slow seepage
characteristics is retained in the valley areas
by underlying low permeability clay rich soils
of the region (Gavigan et al., 2009).
The sub-region experiences hot and dry
weather, characteristic of most semi-arid
regions in Eastern Africa. Rainfall in Karamoja
sub-region is unimodal, occurring from March
to November, and ranging from < 500 mm in
eastern Karamoja, 500-800 mm in central
Karamoja to 700-1000 mm in west Karamoja
and the isolated highlands (Mbogga, 2014).
The Karamoja region, which includes the
upstream of the catchments, has uneven
rainfall and high run-off. Downstream of the
catchments falls in Teso subregion, that has
mean annual rainfall of about 1100-1200 mm,
distributed between two seasons of March to
July and September to November (Kisauzi et
al., 2012). Temperatures are generally high
throughout the year, with an annual average
of 28-33°C for minimum and maximum
temperature, respectively; leading to high
evapotranspiration levels averaging 2072 mm
per annum (Gavigan et al., 2009).
Land use and land cover in the catchments
has traditionally been characterised largely by
grazing in a landscape dominated by
grasslands, cultivation, hunting and settlement
(Osaliya et al., 2019); and has included
conservation, since the 1964 when three game
reserves (Matheniko, Bokora and Pian-Upe)
were gazetted in Karamoja, parts of which are
found upstream of the catchments (Rugadya
and Kamusiime, 2013). However, LULC
change over the last three to four decades in
the catchments has resulted in conversion of
woodlands and bushlands into small-scale
croplands, increase in grassland due to
degradation of woodland and bushlands, and
degazettement of protected areas (Majaliwa et
al., 2012). This saw small scale farming and
grassland area increase from 10 and 44 in 1984
to 16 and 60 percent in 2013 (Osaliya et al.,
2019).
Variables and data sets. Land use and land
cover for 1994, 2003 and 2013 prepared by
Osaliya et al. (2019) for the catchments were
used as the data for this study. The 1994 and
2003 layers were used for model calibration,
while the 2013 layer was used for model
validation. Commonly applied drivers of LULC
change were listed from literature (Serneels
and Lambin, 2001; Veldkamp and Lambin,
2001; Agarwal et al., 2002; Linkie et al., 2004;
Wilson and Weng, 2011; Ahmed and Ahmed
2012; Nyeko, 2012; Sleeter et al., 2012).
However, for this study the drivers used were
obtained from Osaliya et al. (2019).
According to Osaliya et al. (2019), the
community (among other actors) perceived
that the return of peace in the sub-region was
among the drivers of land cover and land use
change, particularly, the increase in cultivated
land and reduction in woody and bushy lands.
For a region that had volatile insecurity due to
cattle rustling, including episodes of raids by
the neighbouring Pokot from Kenya, security
is a key factor in the use of land. This study
assumed that the prevailing security would
remain uninterrupted. The promotion of crop
cultivation and use of new agricultural
technology was considered a policy
intervention and an exogenous change that was
causing a shift to increased cropping in a
region otherwise traditionally dominated by
pastoralism (grazing). This provided a basis
for the assumption that sedentarisation policies
could result in increased land area under small
scale farming. Evidence likelihood of LULC
change was included as an explanatory
variable, to account for practices and decisions
that influence change; and that would possibly
not be explained by the model, as described
by Eastman (2016 a and b). Evidence
likelihood of change was created by
determining the relative frequency with which
599Land use and land cover outlook for semi-arid catchments
different LULC types occurred within the areas
that transitioned from 1994 to 2003.
Nine explanatory variables/drivers and
sources of data were utilised in this study. Five
of the drivers were applied to model both
transition to small scale farming and to
grassland. These are : (a) distance from
streams calculated from streams vector layer
obtained from a digital elevation model (DEM)
based catchment delineation in ArcSWAT; (b)
distance from roads, calculated in ArcGIS from
a layer of road network obtained from the
Uganda National Bureau of Statistics (UBOS);
(c) slope calculated from a 30 meters Shuttle
Radar Topography Mission (SRTM) digital
elevation model (DEM) which was
downloaded from http://www2.jpl.nasa.gov/
srtm/ portal and projected to the UTM WGS
1984 zone 36N; (d) population density layer
calculated to sub-county level in ArcGIS, by
using the administrative boundaries layer and
population from the 2002 Census, obtained
from UBOS; and (e) distance from small towns
and urban centres within and close to
catchment boundary calculated from a layer
obtained from UBOS. In addition, distance
from small scale farms was calculated after
extracting the land cover in question from the
1994 LULC layer; and evidence likelihood for
change to small scale farming was used only
in modelling transmission to small scale
farming. On the other hand, total livestock
values (TLU) and evidence likelihood for
change to grassland were used only in
modelling transmission to grassland. The
evidence likelihood for change layers were
prepared in IDRISI’s TerrSet Geospatial
Monitoring and Modeling System as described
under “Preparation and selection of
explanatory variables” below, from 1994 and
2003 LULC layers. Distance layers were
calculated using the “Euclidean distance” tool
in ArcGIS 10.3 Spatial Analyst.
All the input datasets, that is, drivers also
called factors, constraints and incentive, and
LULC layers were prepared at a 30-meter
spatial resolution, to the same number of rows
(5153) and rows (7194), background values
and projected to the UTM WGS 1984 zone
36N, for consistency that is required for
executing overlay in GIS environments. These
derivations were executed in ArcGIS 10.3,
converted into GeoTiff format, and imported
into IDRISI’s TerrSet Geospatial Monitoring
and Modeling System for transformation and
modelling in accordance with desired
scenarios.
Modeling land use and land cover change.A number of modeling techniques have been
developed to evaluate and project LULC that
could result from different growth and policy
scenarios (Agarwal et al; 2002; Wainger et
al., 2007). They include (a) empirical-
statistical models, (b) stochastic models, (c)
optimisation models, (d) dynamic process-
based simulation models, and (e) the
connectionist models (Gonzales, 2009). The
suitability of a modelling approach selected
depends on the intended use (Wilson and
Weng, 2011).
As a selected modelling approach should
capture the most critical aspects of LULC
particularly heterogeneity, interactions, and
dynamics (Plantinga et al., 2006), projection
was attained by applying a combination of
methods embedded in the IDRISI Land Change
Modeler (LCM) software, as described by
several reports (Pontius et al. 2004; Eastman,
2009; Bernetti and Marinelli, 2010). The
methods are: (a) identifying historical LULC
change (transitions) by cross-comparison of
two images; (b) multivariate analysis of
transition potential using artificial neural
networks, particularly the multiperceptron
neural network (MLP), to develop an empirical
model of relationship between the historical
LULC transitions and a set of explanatory
variables; (c) future LULC demand calculation
by the Markov chains; and (d) multi-objective
land allocation. While the LCM has three
empirical model development tools, the MLP
was chosen because is capable of modelling
complex nonlinear relationships between
variables, able to detect and model interaction
effects among variables, and is robust for
R. OSALIYA et al.600
modelling the potential transitions (Eastman,
2009 and Nor et al., 2017). The LCM was
chosen because of its ability to combine these
methods and handiness of its interface through
the organisation of key modeling tasks into tabs
for change analysis, transition potentials,
change prediction and planning. The study
applied these tools to postulate that future
(2030 and 2050) LULC would result from a
combination of local bio-physical and socio-
economic drivers that can be extrapolated by
analysis of long term (1994 – 2003) past
occurrences, the exogenous changes caused
by the implementation of long-term land
policies and by land use constraints and
incentives. The tools were applied as described
below.
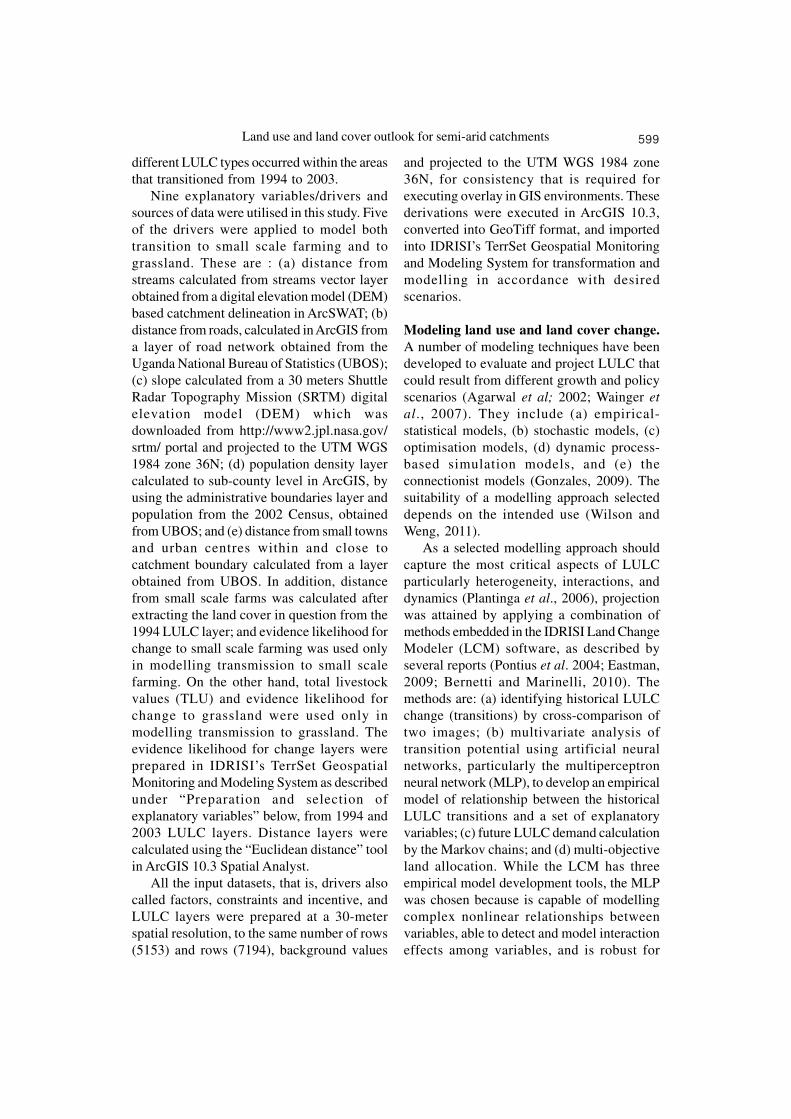
Identification of major transitions. Major
LULC transitions that occurred in the 1994-
2003 period were identified by cross-
comparison (Pontius et al. 2004 and Bernetti
and Marinelli, 2010) of 1994 and 2003 LULC
raster images in the LCM change analysis tab.
The LCM was set up to ignore transitions less
than 20 Km2 (Eastman, 2016b). Thus,
transitions involving the built-up areas were
ignored (Fig. 1).
The LCM transition tab allows for the
organisation of transitions into transition sub-
models can consist of a single land cover
transition or a group of transitions that have
the same explanatory variables and can be
modelled in one go, using the LCM’s MLP
(Eastman 2016a). To model increased small
scale farming, it was assumed that only
transitions from all of the other LULC types
to crop farms would be important. Thus, these
were grouped into a single transition sub-
model, “All_to_Farm”. Likewise, to model
increased grazing, only transitions to grassland
were assumed to be important, and were
grouped into one transition sub-model,
“All_to_Grass”.
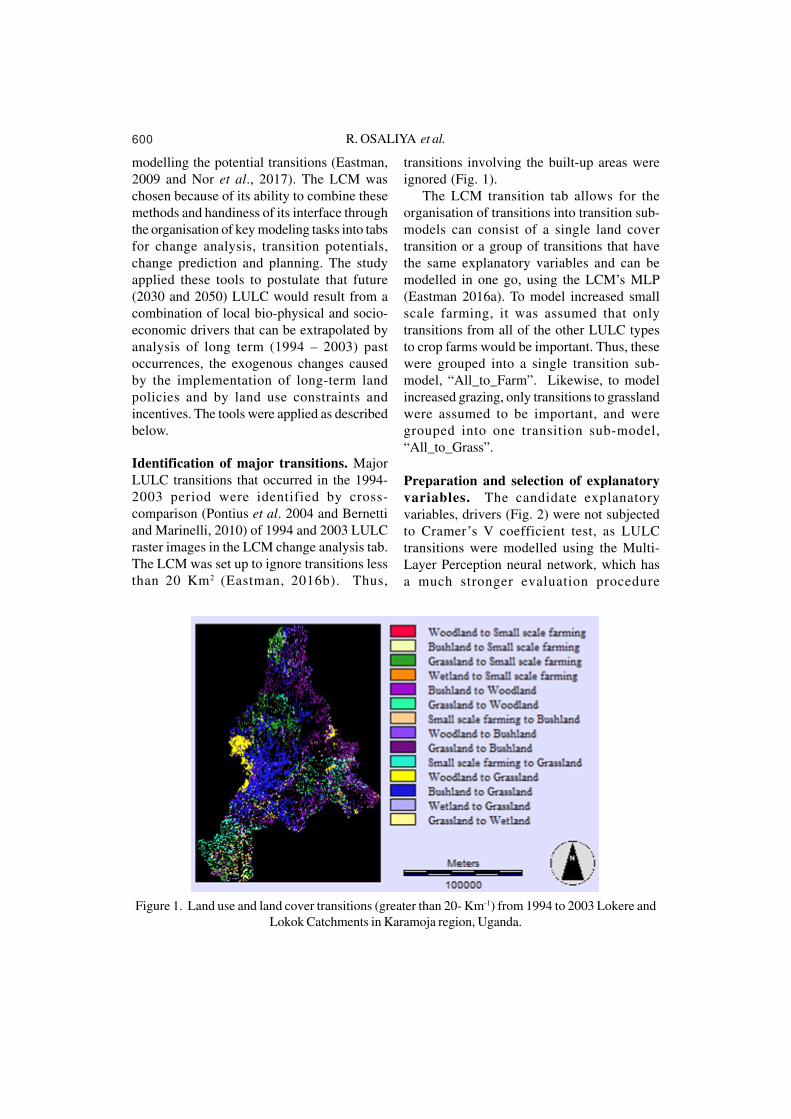
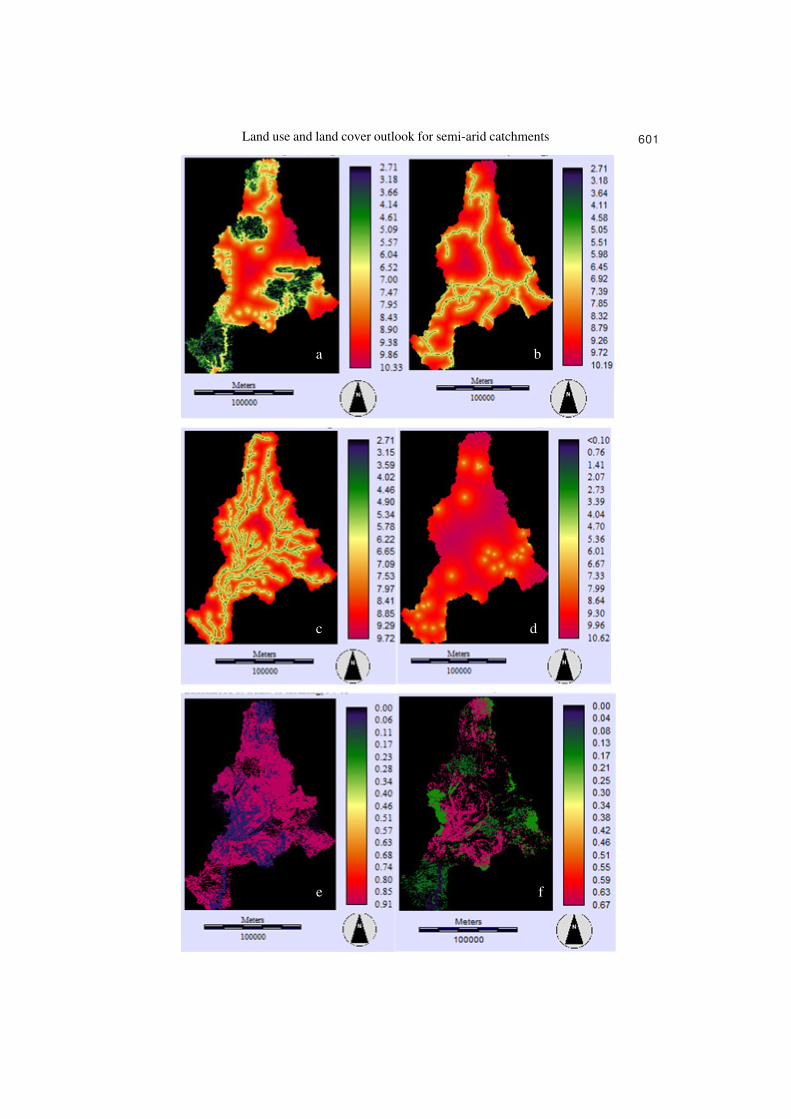
Preparation and selection of explanatoryvariables. The candidate explanatory
variables, drivers (Fig. 2) were not subjected
to Cramer’s V coefficient test, as LULC
transitions were modelled using the Multi-
Layer Perception neural network, which has
a much stronger evaluation procedure
Figure 1. Land use and land cover transitions (greater than 20- Km-1) from 1994 to 2003 Lokere and
Lokok Catchments in Karamoja region, Uganda.
601Land use and land cover outlook for semi-arid catchments
a b
c d
e f

R. OSALIYA et al.602
Figure 2. The candidate explanatory variables used in land use and land cover modeling (a) distance
from small scale farming in 1994, (b) distance from roads, (c) distance from streams, (d) distance from
towns, (e) evidence likelihood of transition to small scale farming, (f) evidence likelihood of transition
to grassland (g) population density, (h) slope, and (i) total livestock value in 2002.
g h
i
i
incorporated into its development process
(Eastman, 2016a). Although the MLP does not
require variable layers to be transformed as it
does not require variables to be linearly related,
transformation could enhance its performance
and accuracy, particularly where there is strong
non-linearity (Eastman, 2016a). Thus, the
Variable Transformation Utility of the LCM
which is a natural log transformation was
applied to the distance layers as recommended
for distance decay variables (Eastman, 2016a).
The root-square transformation was applied
on the population density, slope and Total
Livestock Units (TLUs) density layers.
Evidence likelihood of change layers were
prepared by (i) obtaining layers of transition
of all LULC classes in 1994 to small scale
farming, and to grassland in 2003, using the
603Land use and land cover outlook for semi-arid catchments
Change Analysis module of LCM; (ii) using
the RECLASS module in Terrset to obtain
Boolean images of transition; and (iii) using
the Boolean images with the 1994 layer as the
input image variable name, to derive the
evidence livelihood of change of LULC to
small scale farming and grassland, respectively.
The most sensitive variables were selected after
running the MLP and are presented under
“modelling of transition potentials” below.
Modelling of transition potentials. Using the
drivers and historical land cover and land use
images, transition raster images were
developed, using the MLP neural network. The
MLP was chosen due to its ability to model
non-linear process and run multiple transitions,
up to 9, per sub-model (Eastman, 2012a).
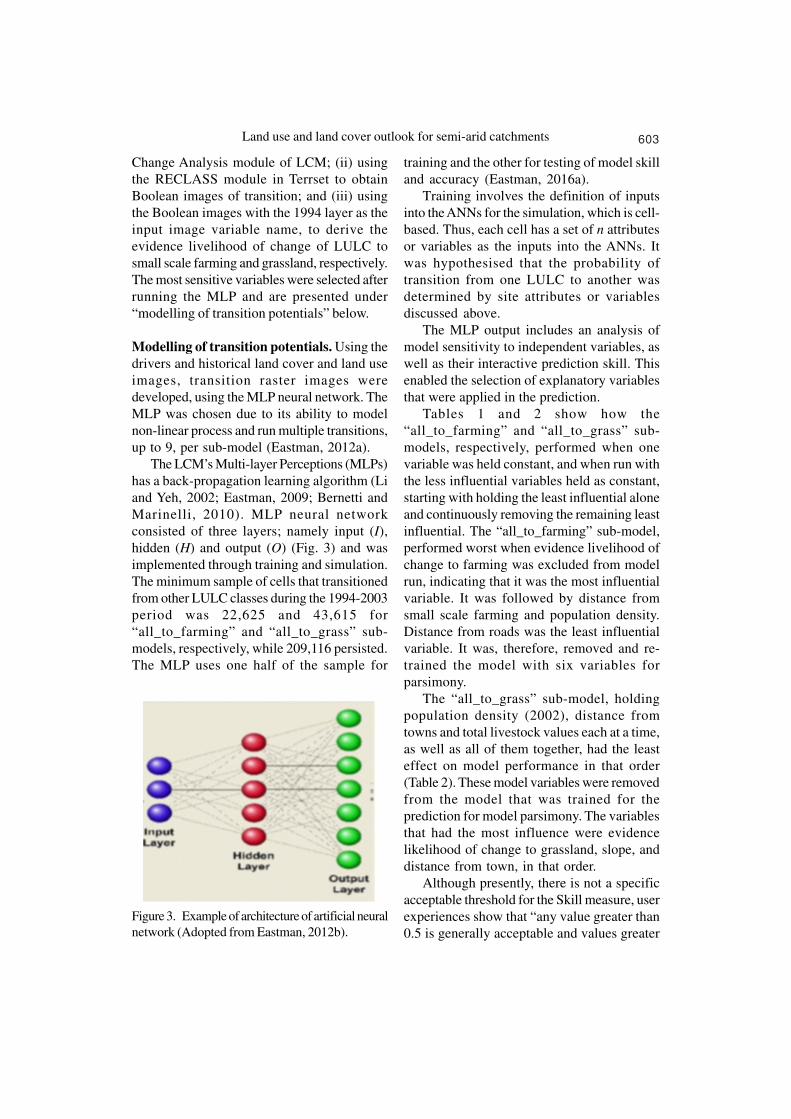
The LCM’s Multi-layer Perceptions (MLPs)
has a back-propagation learning algorithm (Li
and Yeh, 2002; Eastman, 2009; Bernetti and
Marinelli, 2010). MLP neural network
consisted of three layers; namely input (I),
hidden (H) and output (O) (Fig. 3) and was
implemented through training and simulation.
The minimum sample of cells that transitioned
from other LULC classes during the 1994-2003
period was 22,625 and 43,615 for
“all_to_farming” and “all_to_grass” sub-
models, respectively, while 209,116 persisted.
The MLP uses one half of the sample for
training and the other for testing of model skill
and accuracy (Eastman, 2016a).
Training involves the definition of inputs
into the ANNs for the simulation, which is cell-
based. Thus, each cell has a set of n attributes
or variables as the inputs into the ANNs. It
was hypothesised that the probability of
transition from one LULC to another was
determined by site attributes or variables
discussed above.
The MLP output includes an analysis of
model sensitivity to independent variables, as
well as their interactive prediction skill. This
enabled the selection of explanatory variables
that were applied in the prediction.
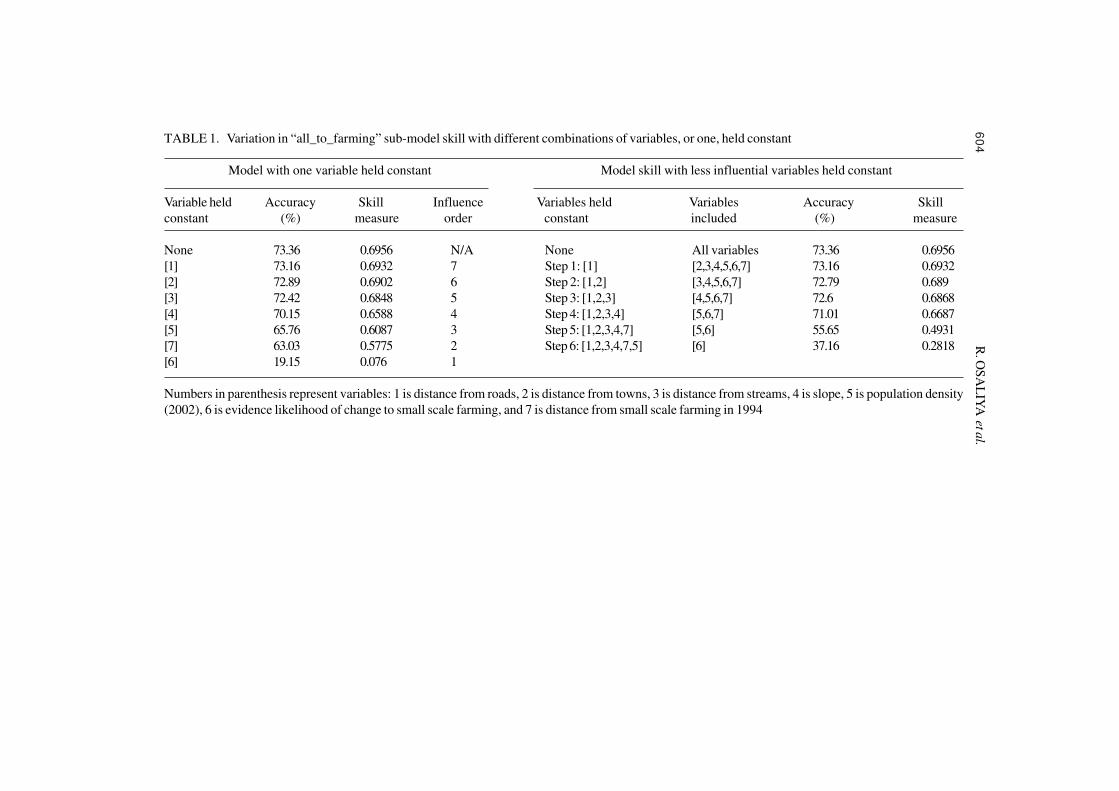
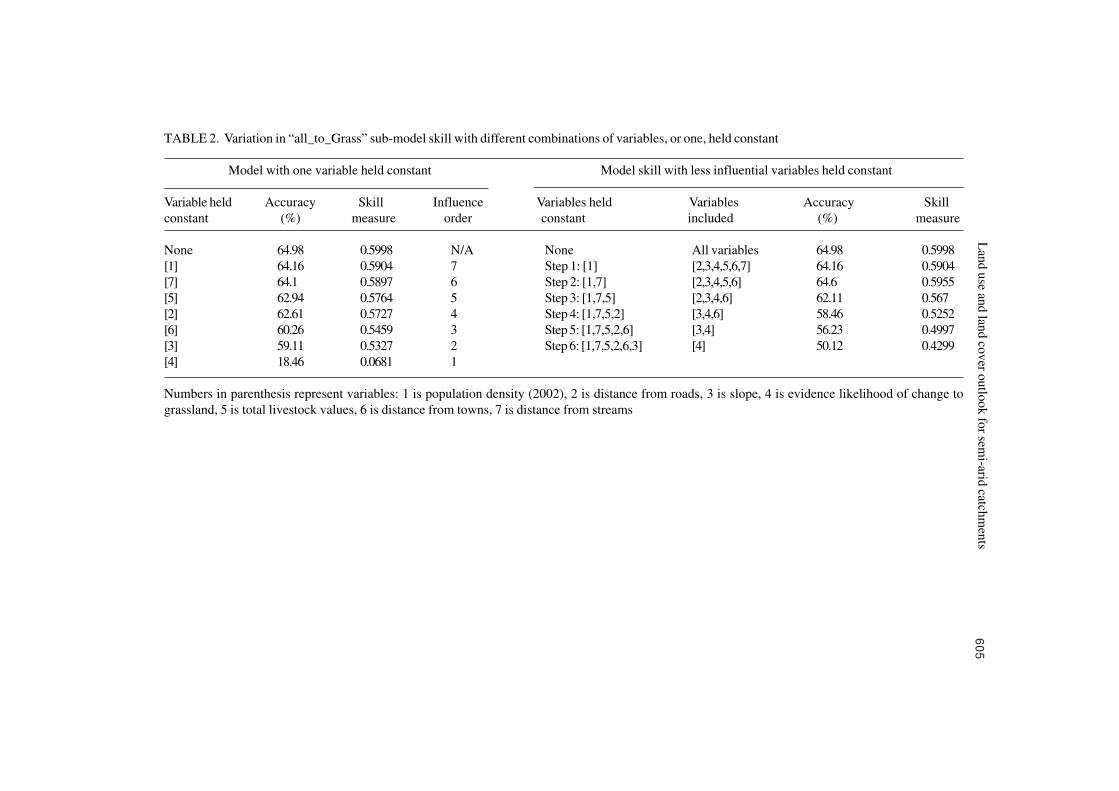
Tables 1 and 2 show how the
“all_to_farming” and “all_to_grass” sub-
models, respectively, performed when one
variable was held constant, and when run with
the less influential variables held as constant,
starting with holding the least influential alone
and continuously removing the remaining least
influential. The “all_to_farming” sub-model,
performed worst when evidence livelihood of
change to farming was excluded from model
run, indicating that it was the most influential
variable. It was followed by distance from
small scale farming and population density.
Distance from roads was the least influential
variable. It was, therefore, removed and re-
trained the model with six variables for
parsimony.
The “all_to_grass” sub-model, holding
population density (2002), distance from
towns and total livestock values each at a time,
as well as all of them together, had the least
effect on model performance in that order
(Table 2). These model variables were removed
from the model that was trained for the
prediction for model parsimony. The variables
that had the most influence were evidence
likelihood of change to grassland, slope, and
distance from town, in that order.
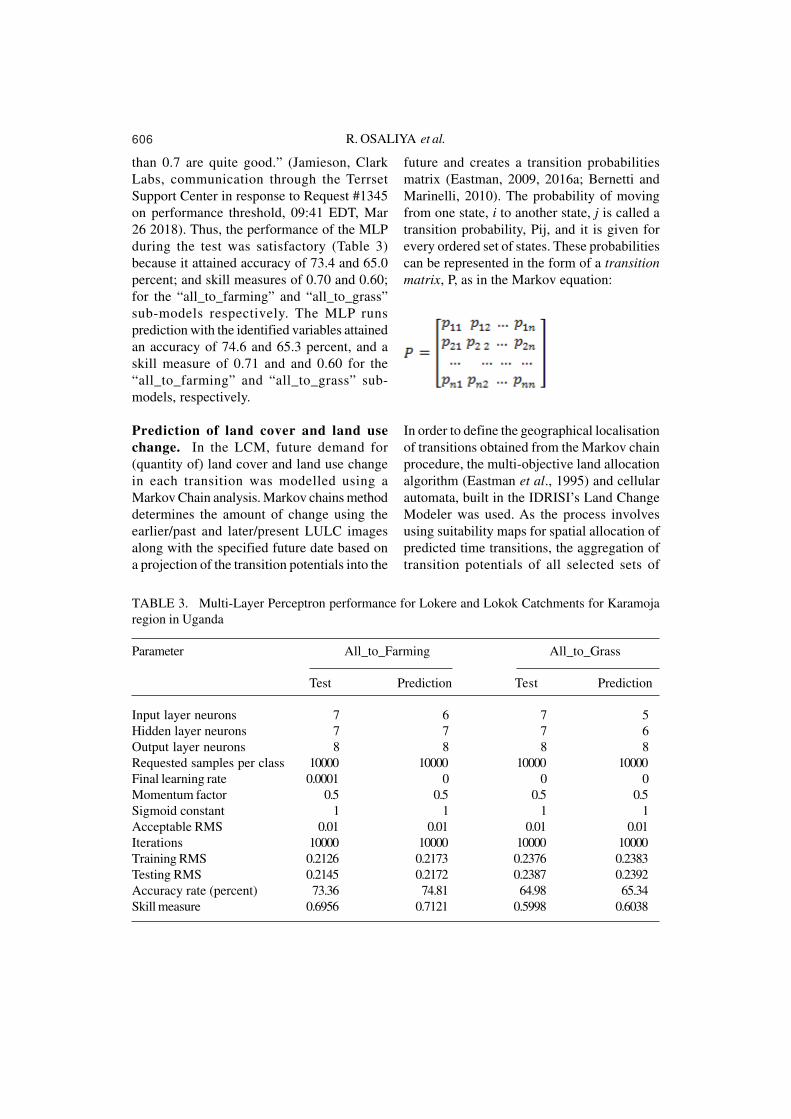
Although presently, there is not a specific
acceptable threshold for the Skill measure, user
experiences show that “any value greater than
0.5 is generally acceptable and values greater
Figure 3. Example of architecture of artificial neural
network (Adopted from Eastman, 2012b).
R. O
SA
LIY
A et a
l.6
04TABLE 1. Variation in “all_to_farming” sub-model skill with different combinations of variables, or one, held constant
Model with one variable held constant Model skill with less influential variables held constant
Variable held Accuracy Skill Influence Variables held Variables Accuracy Skill
constant (%) measure order constant included (%) measure
None 73.36 0.6956 N/A None All variables 73.36 0.6956
[1] 73.16 0.6932 7 Step 1: [1] [2,3,4,5,6,7] 73.16 0.6932
[2] 72.89 0.6902 6 Step 2: [1,2] [3,4,5,6,7] 72.79 0.689
[3] 72.42 0.6848 5 Step 3: [1,2,3] [4,5,6,7] 72.6 0.6868
[4] 70.15 0.6588 4 Step 4: [1,2,3,4] [5,6,7] 71.01 0.6687
[5] 65.76 0.6087 3 Step 5: [1,2,3,4,7] [5,6] 55.65 0.4931
[7] 63.03 0.5775 2 Step 6: [1,2,3,4,7,5] [6] 37.16 0.2818
[6] 19.15 0.076 1
Numbers in parenthesis represent variables: 1 is distance from roads, 2 is distance from towns, 3 is distance from streams, 4 is slope, 5 is population density
(2002), 6 is evidence likelihood of change to small scale farming, and 7 is distance from small scale farming in 1994
60
5L
and
use an
d lan
d co
ver o
utlo
ok
for sem
i-arid catch
men
tsTABLE 2. Variation in “all_to_Grass” sub-model skill with different combinations of variables, or one, held constant
Model with one variable held constant Model skill with less influential variables held constant
Variable held Accuracy Skill Influence Variables held Variables Accuracy Skill
constant (%) measure order constant included (%) measure
None 64.98 0.5998 N/A None All variables 64.98 0.5998
[1] 64.16 0.5904 7 Step 1: [1] [2,3,4,5,6,7] 64.16 0.5904
[7] 64.1 0.5897 6 Step 2: [1,7] [2,3,4,5,6] 64.6 0.5955
[5] 62.94 0.5764 5 Step 3: [1,7,5] [2,3,4,6] 62.11 0.567
[2] 62.61 0.5727 4 Step 4: [1,7,5,2] [3,4,6] 58.46 0.5252
[6] 60.26 0.5459 3 Step 5: [1,7,5,2,6] [3,4] 56.23 0.4997
[3] 59.11 0.5327 2 Step 6: [1,7,5,2,6,3] [4] 50.12 0.4299
[4] 18.46 0.0681 1
Numbers in parenthesis represent variables: 1 is population density (2002), 2 is distance from roads, 3 is slope, 4 is evidence likelihood of change to
grassland, 5 is total livestock values, 6 is distance from towns, 7 is distance from streams
R. OSALIYA et al.606
than 0.7 are quite good.” (Jamieson, Clark
Labs, communication through the Terrset
Support Center in response to Request #1345
on performance threshold, 09:41 EDT, Mar
26 2018). Thus, the performance of the MLP
during the test was satisfactory (Table 3)
because it attained accuracy of 73.4 and 65.0
percent; and skill measures of 0.70 and 0.60;
for the “all_to_farming” and “all_to_grass”
sub-models respectively. The MLP runs
prediction with the identified variables attained
an accuracy of 74.6 and 65.3 percent, and a
skill measure of 0.71 and and 0.60 for the
“all_to_farming” and “all_to_grass” sub-
models, respectively.
Prediction of land cover and land usechange. In the LCM, future demand for
(quantity of) land cover and land use change
in each transition was modelled using a
Markov Chain analysis. Markov chains method
determines the amount of change using the
earlier/past and later/present LULC images
along with the specified future date based on
a projection of the transition potentials into the
future and creates a transition probabilities
matrix (Eastman, 2009, 2016a; Bernetti and
Marinelli, 2010). The probability of moving
from one state, i to another state, j is called a
transition probability, Pij, and it is given for
every ordered set of states. These probabilities
can be represented in the form of a transition
matrix, P, as in the Markov equation:
In order to define the geographical localisation
of transitions obtained from the Markov chain
procedure, the multi-objective land allocation
algorithm (Eastman et al., 1995) and cellular
automata, built in the IDRISI’s Land Change
Modeler was used. As the process involves
using suitability maps for spatial allocation of
predicted time transitions, the aggregation of
transition potentials of all selected sets of
TABLE 3. Multi-Layer Perceptron performance for Lokere and Lokok Catchments for Karamoja
region in Uganda
Parameter All_to_Farming All_to_Grass
Test Prediction Test Prediction
Input layer neurons 7 6 7 5
Hidden layer neurons 7 7 7 6
Output layer neurons 8 8 8 8
Requested samples per class 10000 10000 10000 10000
Final learning rate 0.0001 0 0 0
Momentum factor 0.5 0.5 0.5 0.5
Sigmoid constant 1 1 1 1
Acceptable RMS 0.01 0.01 0.01 0.01
Iterations 10000 10000 10000 10000
Training RMS 0.2126 0.2173 0.2376 0.2383
Testing RMS 0.2145 0.2172 0.2387 0.2392
Accuracy rate (percent) 73.36 74.81 64.98 65.34
Skill measure 0.6956 0.7121 0.5998 0.6038
607Land use and land cover outlook for semi-arid catchments
transition, to obtain the predicted LULC was
achieved through calculation of the “logical
OR”.
Model validation. The Relative Operating
Characteristic (ROC) (Eastman, 2009; 2016b;
Pontius and Schneider, 2001; Eastman, 2009)
module of the IDRISI GIS, was used to
validate the quality of LULC prediction. The
ROC technique measures how well a modelled
continuous map of suitability of the likelihood
of a land cover and land use class occurring
predicts locations given the actual map of
distribution of the class (Pontius and
Schneider, 2001 and Eastman. 2016b).
Therefore, Boolean images of change from
all classes in 2003 to small scale farming, and
to grassland, in 2013, were respectively used
in the ROC module as reference images (actual
LULC layer) along with their corresponding
soft prediction images as input images, to
validate the trained sub-models for predictions
of changes to farming and grassland. No
constraints or incentives were applied in
predictions for validation purposes. Using
default settings and 100 as the number of
thresholds, the ROC analysis showed that the
models’ prediction of transitions to small-scale
farming and to grassland was strong, with
ROC values of 0.83 and 0.94, respectively;
illustrating the robustness of the prediction.
(Pontius and Schneider, 2001). The validated
model was then used to generate LULC for
2030 and 2050, after incorporating scenarios.
Incorporation of scenario development intoprediction. The LCM planning module was
used to incorporate three policy scenarios by
defining constraints and incentives for change
allocation and prediction (Eastman, 2016a and
b). Handled or prepared in the same manner,
constraints and incentives layers were used
to bar (constraints, with to values of 0 on the
layer), discourage (incentive, with values less
than 1 but greater than 0) or encourage
(incentives, with values greater than 1) change
in the specified locations, in favour of, or
against, small scale farming or grassland
(grazing).
In defining scenarios that were modelled,
major historical, present and plausible future
LULC were considered, along with
endogenous and exogenous influences in the
catchment in particular, and the region in
which it is located. Lokere and Lokok
catchments, particularly upstream, falls in a
rangeland, characterised by climate variability,
where livestock herding, mainly pastoralism,
has over the years been the economic or
livelihood mainstay of the people. Although
cropping had also been practiced, it was limited
to traditional crops, mainly sorghum, grown
on a very small scale; making grassland and
grazing the dominant land cover and land use
over the years. (Largely endogenous aspects.)
Recent developments in the sub-region
particularly following disarmament exercise
between 2001 and 2002 (OPM, 2007), have
seen aggressive promotion of agriculture by
Government and non-state actors. For
example, Karamoja subregion, in 2016, had 54
non-governmental organisations (NGOs)
which were implementing142 active projects
(Karamoja Resilience Support Unit, 2016).
Government Policy analysis has blamed among
others, overreliance on livestock resources as
one of the causes of poverty and chronic food
insecurity in the sub-region, and has embarked
on developing and implementing programmes
that, while seeking to improve on quality of
livestock, promote growing and marketing of
a diversity of crops (OPM, 2007; 2009), with
the Karamoja Integrated Disarmament and
Development Programme (KIDDP), being the
main development program for the region.
(Largely exogenous aspects.)
Business as usual scenario. The BAU
scenario assumed that trends of land use/cover
change between 1994 and 2003 will continue
as influenced by the identified and evaluated
drivers of LULC change. This development
would not occur in forest reserves, wildlife
reserves, and wetlands – thus assumes

R. OSALIYA et al.608
effective conservation of these areas. A
constraint layer with these areas with 0 values
was used in the prediction, which included
“all_grass” and “all_farming” sub-models. Net
transitions to woodland and bushland were
assumed insignificant.
The pro-farming policy scenario. This
scenario assumed that government policy, and
actions of state and non-state actors would
promote the growing of crops leading
prioritisation of cultivation by LULC change
agents. An incentive layer with values of 1.2
was created to increase rate of change of LULC
to farming. As a result of increased attention
to farming, grazing areas could either reduce,
not increase or increase at a lower rate than
present. Therefore, a disincentive of 20
percent, which would reduce the normal values
on the incentive layer from 1.0 to 0.8 was
created for the “all_to_grass” sub-model.
The pro-livestock policy scenario. The pro-
livestock policy scenario assumed increased
livestock production leading to increased
grazing land and subsequently grassland cover.
To model this scenario, a normal rate of change
(values of 1) was assumed in wildlife and
forest reserves, bar wetlands, and an incentive
of 1.2 values on incentive layer was placed
for the rest of the catchment – for the
“all_to_grass” sub-model. As a result of
increased attention to livestock husbandry,
farming could either reduce, not increase or
increase at a lower rate than present. A
disincentive of 20 percent, which would
reduce the normal values on the incentive layer
to 0.8 was created for the “all_to_farming”
sub-model.
RESULTS
The projected LULC for the three future (2030
and 2050) scenarios are presented in Figure
4, while the area that would be covered by the
LULC types are presented in Table 4.
Compared to the baseline, the projections show
that land under small scale farming would TA
BL
E 4
. P
roje
cted
LU
LC
for pro
-gra
zing, p
ro-f
arm
ing a
nd b
usi
nes
s as
usu
al s
cenar
ios
(are
a in
Km
2) an
d in
the
Loker
e an
d L
olo
k c
atch
men
ts in
Kar
amoja
in U
gan
da
Lan
d u
se a
nd
lan
d c
ov
er t
yp
e 2
003
20
30
2
05
0
B
asel
ine
BA
U
P
ro-g
razi
ng
P
ro-f
arm
ing
B
AU
P
ro-g
razi
ng
Pro
-far
min
g
Sm
all s
cale
far
min
g1,
891.
202,
996.
302,
940.
203,
832.
703,
125.
903,
070.
604,
158.
40
Wo
od
lan
d64
4.1
199.
319
3.2
575.
516
6.2
166.
153
2.4
Bu
shla
nd
2,93
2.70
666.
873
2.7
2,54
9.00
691
918.
32,
406.
60
Gra
ssla
nd
7,96
2.10
9,57
2.90
9,57
2.40
6,48
0.60
9,45
5.70
9,28
3.70
6,34
0.30
Buil
t-up a
reas
16.4
14.5
16.1
16.1
16.1
16.2
16.2
Wet
lan
d26
0.4
254.
424
9.7
250.
424
9.3
249.
325
0.2
Tota
l13
,706
.90
13,7
04.2
013
,704
.20
13,7
04.2
013
,704
.20
13,7
04.2
013
,704
.20
609Land use and land cover outlook for semi-arid catchments
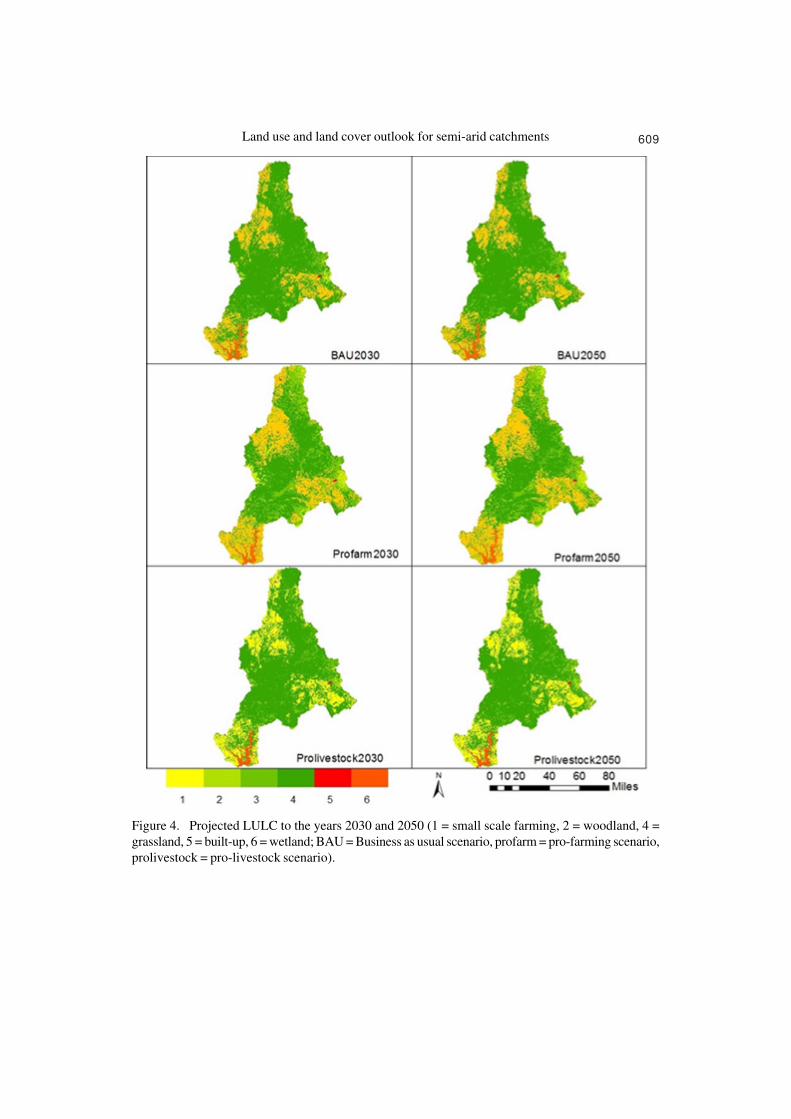
Figure 4. Projected LULC to the years 2030 and 2050 (1 = small scale farming, 2 = woodland, 4 =
grassland, 5 = built-up, 6 = wetland; BAU = Business as usual scenario, profarm = pro-farming scenario,
prolivestock = pro-livestock scenario).
R. OSALIYA et al.610
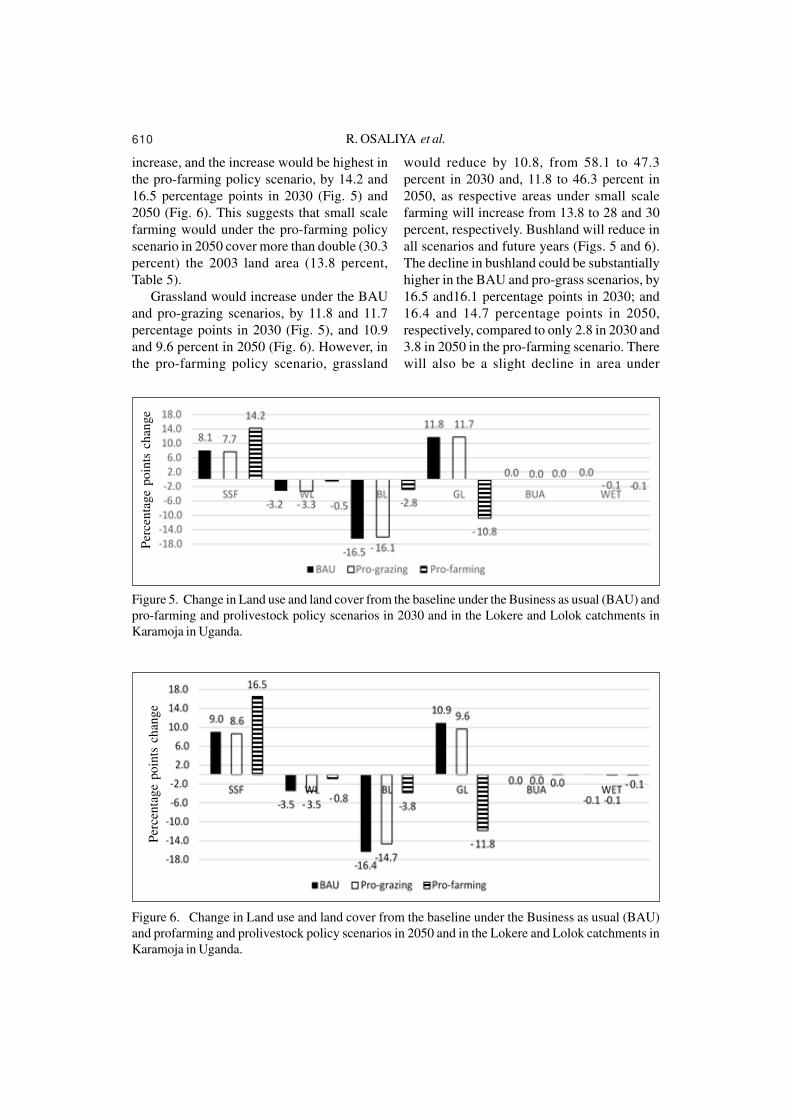
increase, and the increase would be highest in
the pro-farming policy scenario, by 14.2 and
16.5 percentage points in 2030 (Fig. 5) and
2050 (Fig. 6). This suggests that small scale
farming would under the pro-farming policy
scenario in 2050 cover more than double (30.3
percent) the 2003 land area (13.8 percent,
Table 5).
Grassland would increase under the BAU
and pro-grazing scenarios, by 11.8 and 11.7
percentage points in 2030 (Fig. 5), and 10.9
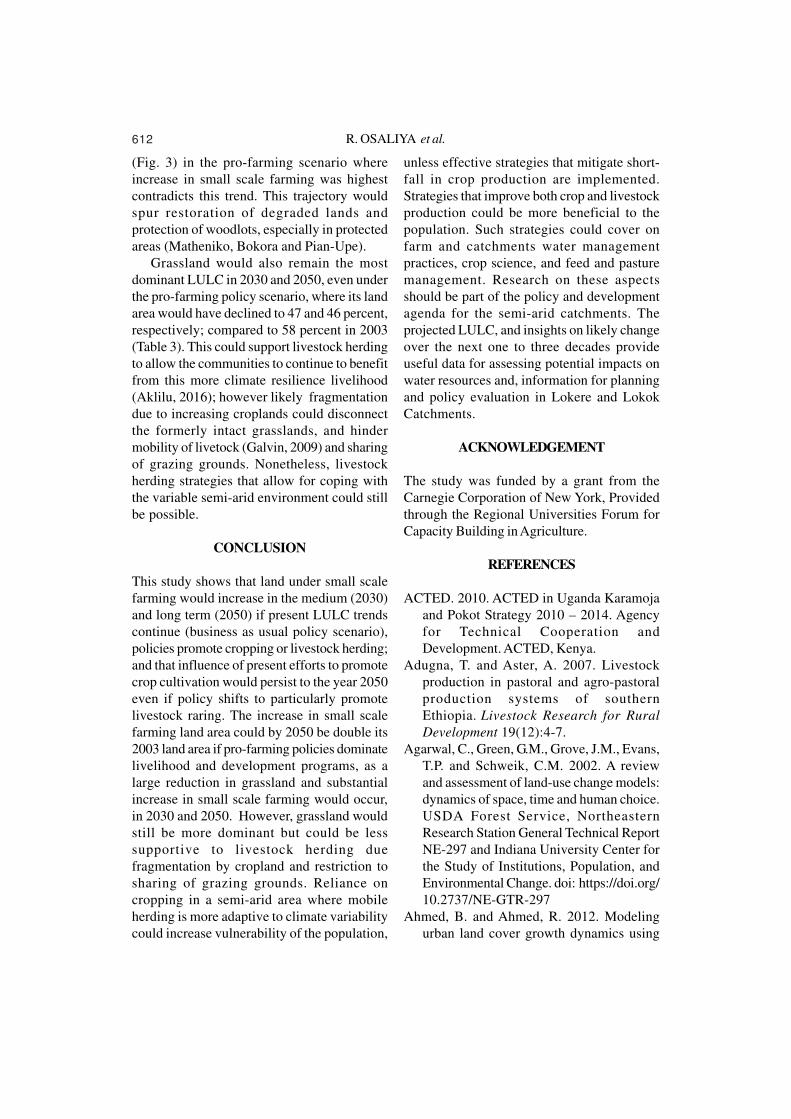
and 9.6 percent in 2050 (Fig. 6). However, in
the pro-farming policy scenario, grassland
would reduce by 10.8, from 58.1 to 47.3
percent in 2030 and, 11.8 to 46.3 percent in
2050, as respective areas under small scale
farming will increase from 13.8 to 28 and 30
percent, respectively. Bushland will reduce in
all scenarios and future years (Figs. 5 and 6).
The decline in bushland could be substantially
higher in the BAU and pro-grass scenarios, by
16.5 and16.1 percentage points in 2030; and
16.4 and 14.7 percentage points in 2050,
respectively, compared to only 2.8 in 2030 and
3.8 in 2050 in the pro-farming scenario. There
will also be a slight decline in area under
Figure 5. Change in Land use and land cover from the baseline under the Business as usual (BAU) and
pro-farming and prolivestock policy scenarios in 2030 and in the Lokere and Lolok catchments in
Karamoja in Uganda.
Figure 6. Change in Land use and land cover from the baseline under the Business as usual (BAU)
and profarming and prolivestock policy scenarios in 2050 and in the Lokere and Lolok catchments in
Karamoja in Uganda.
Per
cen
tag
e p
oin
ts c
han
ge
Per
cen
tag
e p
oin
ts c
han
ge
611Land use and land cover outlook for semi-arid catchments
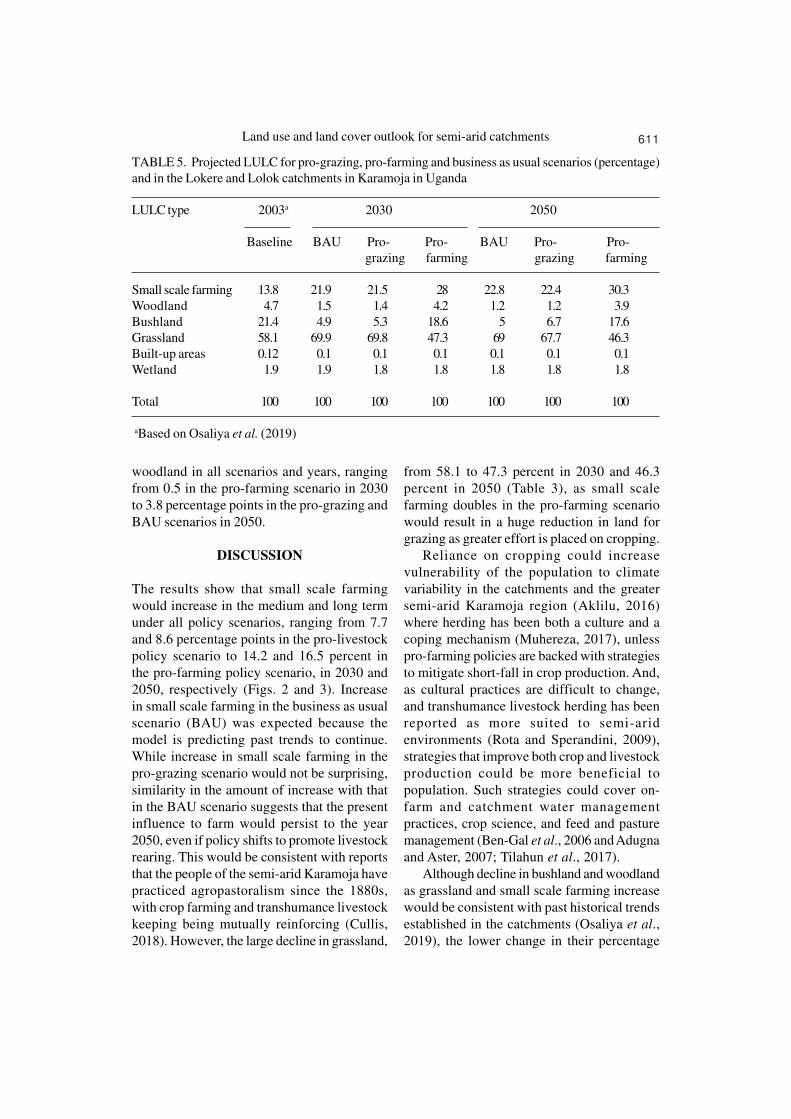
TABLE 5. Projected LULC for pro-grazing, pro-farming and business as usual scenarios (percentage)
and in the Lokere and Lolok catchments in Karamoja in Uganda
LULC type 2003a 2030 2050
Baseline BAU Pro- Pro- BAU Pro- Pro-
grazing farming grazing farming
Small scale farming 13.8 21.9 21.5 28 22.8 22.4 30.3
Woodland 4.7 1.5 1.4 4.2 1.2 1.2 3.9
Bushland 21.4 4.9 5.3 18.6 5 6.7 17.6
Grassland 58.1 69.9 69.8 47.3 69 67.7 46.3
Built-up areas 0.12 0.1 0.1 0.1 0.1 0.1 0.1
Wetland 1.9 1.9 1.8 1.8 1.8 1.8 1.8
Total 100 100 100 100 100 100 100
aBased on Osaliya et al. (2019)
woodland in all scenarios and years, ranging
from 0.5 in the pro-farming scenario in 2030
to 3.8 percentage points in the pro-grazing and
BAU scenarios in 2050.
DISCUSSION
The results show that small scale farming
would increase in the medium and long term
under all policy scenarios, ranging from 7.7
and 8.6 percentage points in the pro-livestock
policy scenario to 14.2 and 16.5 percent in
the pro-farming policy scenario, in 2030 and
2050, respectively (Figs. 2 and 3). Increase
in small scale farming in the business as usual
scenario (BAU) was expected because the
model is predicting past trends to continue.
While increase in small scale farming in the
pro-grazing scenario would not be surprising,
similarity in the amount of increase with that
in the BAU scenario suggests that the present
influence to farm would persist to the year
2050, even if policy shifts to promote livestock
rearing. This would be consistent with reports
that the people of the semi-arid Karamoja have
practiced agropastoralism since the 1880s,
with crop farming and transhumance livestock
keeping being mutually reinforcing (Cullis,
2018). However, the large decline in grassland,
from 58.1 to 47.3 percent in 2030 and 46.3
percent in 2050 (Table 3), as small scale
farming doubles in the pro-farming scenario
would result in a huge reduction in land for
grazing as greater effort is placed on cropping.
Reliance on cropping could increase
vulnerability of the population to climate
variability in the catchments and the greater
semi-arid Karamoja region (Aklilu, 2016)
where herding has been both a culture and a
coping mechanism (Muhereza, 2017), unless
pro-farming policies are backed with strategies
to mitigate short-fall in crop production. And,
as cultural practices are difficult to change,
and transhumance livestock herding has been
reported as more suited to semi-arid
environments (Rota and Sperandini, 2009),
strategies that improve both crop and livestock
production could be more beneficial to
population. Such strategies could cover on-
farm and catchment water management
practices, crop science, and feed and pasture
management (Ben-Gal et al., 2006 and Adugna
and Aster, 2007; Tilahun et al., 2017).
Although decline in bushland and woodland
as grassland and small scale farming increase
would be consistent with past historical trends
established in the catchments (Osaliya et al.,
2019), the lower change in their percentage
R. OSALIYA et al.612
(Fig. 3) in the pro-farming scenario where
increase in small scale farming was highest
contradicts this trend. This trajectory would
spur restoration of degraded lands and
protection of woodlots, especially in protected
areas (Matheniko, Bokora and Pian-Upe).
Grassland would also remain the most
dominant LULC in 2030 and 2050, even under
the pro-farming policy scenario, where its land
area would have declined to 47 and 46 percent,
respectively; compared to 58 percent in 2003
(Table 3). This could support livestock herding
to allow the communities to continue to benefit
from this more climate resilience livelihood
(Aklilu, 2016); however likely fragmentation
due to increasing croplands could disconnect
the formerly intact grasslands, and hinder
mobility of livetock (Galvin, 2009) and sharing
of grazing grounds. Nonetheless, livestock
herding strategies that allow for coping with
the variable semi-arid environment could still
be possible.
CONCLUSION
This study shows that land under small scale
farming would increase in the medium (2030)
and long term (2050) if present LULC trends
continue (business as usual policy scenario),
policies promote cropping or livestock herding;
and that influence of present efforts to promote
crop cultivation would persist to the year 2050
even if policy shifts to particularly promote
livestock raring. The increase in small scale
farming land area could by 2050 be double its
2003 land area if pro-farming policies dominate
livelihood and development programs, as a
large reduction in grassland and substantial
increase in small scale farming would occur,
in 2030 and 2050. However, grassland would
still be more dominant but could be less
supportive to livestock herding due
fragmentation by cropland and restriction to
sharing of grazing grounds. Reliance on
cropping in a semi-arid area where mobile
herding is more adaptive to climate variability
could increase vulnerability of the population,
unless effective strategies that mitigate short-
fall in crop production are implemented.
Strategies that improve both crop and livestock
production could be more beneficial to the
population. Such strategies could cover on
farm and catchments water management
practices, crop science, and feed and pasture
management. Research on these aspects
should be part of the policy and development
agenda for the semi-arid catchments. The
projected LULC, and insights on likely change
over the next one to three decades provide
useful data for assessing potential impacts on
water resources and, information for planning
and policy evaluation in Lokere and Lokok
Catchments.
ACKNOWLEDGEMENT
The study was funded by a grant from the
Carnegie Corporation of New York, Provided
through the Regional Universities Forum for
Capacity Building in Agriculture.
REFERENCES
ACTED. 2010. ACTED in Uganda Karamoja
and Pokot Strategy 2010 – 2014. Agency
for Technical Cooperation and
Development. ACTED, Kenya.
Adugna, T. and Aster, A. 2007. Livestock
production in pastoral and agro-pastoral
production systems of southern
Ethiopia. Livestock Research for Rural
Development 19(12):4-7.
Agarwal, C., Green, G.M., Grove, J.M., Evans,
T.P. and Schweik, C.M. 2002. A review
and assessment of land-use change models:
dynamics of space, time and human choice.
USDA Forest Service, Northeastern
Research Station General Technical Report
NE-297 and Indiana University Center for
the Study of Institutions, Population, and
Environmental Change. doi: https://doi.org/
10.2737/NE-GTR-297
Ahmed, B. and Ahmed, R. 2012. Modeling
urban land cover growth dynamics using
613Land use and land cover outlook for semi-arid catchments
multi-temporal satellite images: A case study
of Dhaka, Bangladesh. ISPRS.
International Journal of Geo-Information
1: 3-31, doi: 10.3390/ijgi1010003
Aklilu, Y. 2016. Livestock in Karamoja: A
review of recent literature. Karamoja
Resilience Support Unit, USAID/Uganda,
Kampala. https://karamojaresilience.org/
publications/item/livestock-in-karamoja-a-
review-of-recent-literature
Aklilu, Y. 2019. Trends in livelihood systems
and livestock markets in Karamoja.
Karamoja Resilience Support Unit
Pathways to Resilience in the Karamoja
Cluster A regional conference on recent
research, and policy options, Moroto,
Uganda, 21-23 May 2019. https://
karamojaresilience.org/images/news/2019/
201905-conference/theme-1-livestock-
and- l ive l ihoods /ak l i lu_ l ives tock_
trends_karamoja.pdf
Ben-Gal, A., Tal, A., Tel-Zur, N. 2006. The
sustainability of arid agriculture: Trends
and challenges. Annals of Arid Zone
45:227-258.
Bernetti, I. and Marinelli, N. 2010. Evaluation
of landscape impacts and land use change:
A Tuscan case study for CAP reform
scenarios. Aestimum 56:1-29. https://
doi.org/10.13128/Aestimum-8569
Bürgi, M., Hersperger A.M. and Schneeberger,
N. 2004. Driving forces of landscape
change - current and new directions.
Landscape Ecology 19:857-868.
Burnett, M. and Evans, J. 2014. How can we
survive here? The impact of mining on
human rights in Karamoja, Uganda. Human
Rights Watch, US. https://www.refworld.
org/docid/52f0a9584.html
Cullis, A. 2018. Agricultural development in
Karamoja, Uganda: Recent trends in
livestock and crop systems, and resilience
impacts. Karamoja Resilience Support Unit,
USAID/Uganda, UK aid, and Irish Aid,
Kampala. https://karamojaresilience.org/
publications?task=callelement&format=
raw&item_id=168&element=1e14ee27-
afba-442f-a2f3-712f8d683bab&method=
download
Eastman, J.R. 2016a. TerrSet geospatial
monitoring and monitoring system: Manual.
Clark Labs, Clark University, USA. https:/
/clarklabs.org/wp-content/uploads/2016/
10/Terrset-Manual.pdf
Eastman, J.R. 2016b. TerrSet geospatial
monitoring and monitoring system: Tutorial.
Clark Labs, Clark University, USA. https:/
/clarklabs.org/wp-content/uploads/2016/
10/TerrSet-Tutorial.pdf
Eastman, J.R. 2009. IDRISI Taiga: Guide to
GIS and Image processing. Manuel version
16.02. Clark Labs, Clark University, USA.
http://web.pdx.edu/~nauna/resources/
TaigaManual.pdf
Egeru, A., Wasonga, O., Kyagulanyi, J.,
Mwanjalolo Majaliwa, G.J.M., MacOpiyo,
L. and Mburu, J. 2014. Spatio-temporal
dynamics of forage and land cover changes
in Karamoja sub-region, Uganda.
Pastoralism 4(1):1-21.
Galvin, K.A. 2009. Transitions: Pastoralists
living with change. Annual Review of
Anthropology 38(1):185-198. doi:10.1146/
annurev-anthro-091908-164442
Gaur, M.K. and Squires, V.R. (Eds.). 2018.
Climate variability impacts on land use and
livelihoods in drylands. Springer
International Publishing AG. doi 10.1007/
978-3-319-56681-8_2
Gavigan, J., Mackay, R. and Cuthbert, M. O.
2009. Climate change impacts on
groundwater recharge in NE Uganda and
the potential role of groundwater
development in livelihood adaptation and
peacebuilding. In: Taylor, R., Tindimugaya,
C., Owor, M. and Shamsudduha, M.
(Eds.), Groundwater and climate change
in Africa. IAHS Publication 334:153-60.
Gonzales, I.C.A. 2009. Assessing the land
cover and land use change and its impact
on watershed services in a tropical Andean
watershed of Peru. Master of Science
Thesis. University of Jyväskylä. 57pp.
R. OSALIYA et al.614
Irwin, E.G. and Geoghegan, J. 2001. Theory,
data, and methods: Developing spatially
explicit economic models of land use
change. Agriculture, Ecosystems and
Environment 85:7-23
Karamoja Resilience Support Unit. 2016.
Karamoja NGO Mapping Report. Karamoja
Resilience Support Unit, USAID/Uganda,
Kampala. https://www.karamojaresilience.
org/publications/item/karamoja-ngo-
mapping-report
Kisauzi, T., Mangheni, M.N., Sseguya H. and
Bashaasha, B. 2012. Gender dimensions of
farmers’ perceptions and knowledge on
climate change in Teso sub - region, eastern
Uganda. African Crop Science Journal 20
(2):275-286
Li, X. and Yeh, A.G. 2002. Neural-network-
based cellular for simulating multiple land
use changes using GIS. International
Journal of Geographical Information
Science 16(4):323-343.
Linkie, M., Smith, R.J. and Leader-Williams,
N. 2004. Mapping and predicting
deforestation patterns in the lowlands of
Sumatra. Biodiversity and Conservation
13:1809-1818.
Majaliwa, M., Nkonya, E., Place, F., Pender,
J. and Lubega, J. 2012. Case studies of
sustainable land management approaches
to mitigate and reduce vulnerability to
climate change in Sub-Saharan Africa: The
case of Uganda. Uganda: International Food
Policy Research Institute (IFPRI) and
Makerere University Institute of
Environment and Natural Resources
(MUIENR).
Mbogga, M., Malesu, M., and de Leeuw, J.
2014. Trees and watershed management
in Karamoja, Uganda. Evidence on Demand
UK. doi: 10.12774/eod_hd.december2014.
mboggametal
Muhereza, E.F. 2017. Pastoralist and livestock
development in Karamoja, Uganda: A rapid
review of African regional policy and
programming initiatives. Karamoja
Resilience Support Unit, USAID/Uganda,
Kampala. https://www.karamojaresilience.
org/publications?task=callelement& format
=raw&item_id=164&element=1e14ee27-
afba-442f-a2f3-712f8d683bab&method
=download
Nakalembe, C., Dempewolf, J. and Justice,
C. 2017. Agricultural land use change in
Karamoja region, Uganda. Land Use Policy
62:2-12.
Nor, A.N.M., Corstanjea, R., Harris, J.A. and
Brewer, T. 2017. Impact of rapid urban
expansion on green space structure.
Ecological Indicators 81:274-284
Nyeko, M. 2012. GIS and multi-criteria
decision analysis for land use resource
planning. Journal of Geographic
Information System 4:341-348.
Office of the Prime Minister (OPM). 2007.
Karamoja integrated disarmament and
development programme. Programme
document. Office of the Prime Minister,
Goernment of Uganda. https://www.ref
world.org/docid/5b44c3ee4.html
Office of the Prime Minister (OPM). 2009.
Karamoja action plan for food security
(2009 - 2014) in Karamoja gricultural and
production zones (Karamoja region).
Programme document. Office of the Prime
Minister, Government of Uganda. https://
karamojaresilience.org/publications?task=
callelement&format=raw&item_id=78&
element=1e14ee27-afba-442f-a2f3-712f8d
683bab&method=download
Olson, J.M. 2006. Implications of trends in
land use change for livestock systems
evolution in East Africa: Lessons from the
LUCID Project. Targeting and Innovations
Discussion Paper No. 4. ILRI (International
Livestock Research Institute), Nairobi,
Kenya. 41pp. https://hdl.handle.net/10568/
856
Osaliya, R., Wasonga, O.V., Majaliwa, J.G.M.,
Kironchi, G. and Adipala, E. 2019. Land
conversion is changing the landscape in the
semi-arid Lokere and Lokok Catchments,
northeastern Uganda. African Journal of
Rural Development 3(3):913-923.
615Land use and land cover outlook for semi-arid catchments
Plantinga, A.J. and Irwin, E.G. 2006. Overview
of empirical methods and models of land
use. In: Bell, K. Boyle, K. Plantinga, A.
Rubin, J. and Teisl, M. (Eds.), The
Economics of Land Use Change, Ashgate
Press.
Pontius, R.G.Jr. and Schneider, L.C. 2001.
Land-cover change model validation by an
ROC method for the Ipswich watershed,
Massachusetts, USA. Agriculture,
Ecosystems and Environment 85:239-248.
Pontius, R.G., Shusas, E. and McEachern, M.
2004. Detecting important categorical land
changes while accounting for persistence.
Agriculture and Ecosystem Environment
101:251-268. http://dx.doi.org/10.1016/
j.agee.2003.09.008
Rota, A. and Sperandini, S. 2009. Livestock
and Pastoralists. Livestock Thematic
Papers. International Fund for Agricultural
Development, IFAD. https://www.ifad.org/
documents/10180/0fbe4134-4354-4d08-
bf09-e1a6dbee3691
Rufino, M.C., Thornton, P.K., Ng’ang’a, S.
K., Mutiea, I., Jones, P.G., van Wijk, M.T.
and Herrero, M. 2013. Transitions in
agropastoralist systems of East Africa:
Impacts on food security and poverty.
Agriculture, Ecosystems and Environment
179:215-230.
Rugadya, M.A. and Kamusiime, H. 2013.
Tenure in mystery: The status of land
underwildlife, forestry and mining
concessions in Karamoja Region, Uganda.
Nomadic Peoples 17:33-65. http://
dx.doi.org/10.3167/np.2013.170103
Serneels, S. and Lambin, E.F. 2001. Proximate
causes of land-use change in Narok District,
Kenya: A spatial statistical model.
Agriculture, Ecosystems and Environment
85:65-81.
Sleeter, B.M., Sohl, T.L., Bouchard, M., Reker,
R., Soulard, C.E., Acevedo, W., Griffith,
G.E., Sleeter, R.R., Auch, R. F., Sayler,
K.L., Prisley, S. and Zhu, Z. 2012.
Scenarios of land use and land cover
change in the conterminous United States:
utilizing the special report on emissions
scenarios at ecoregional scales. Global
Environmental Change 22:896-914.
Tilahun, A., Teklu, B. and Hoag, D. 2017.
Challenges and contributions of crop
production in agro-pastoral systems of
Borana Plateau, Ethiopia. Pastoralism 7 (2).
https://doi.org/10.1186/s13570-016-0074-
9
Tsegaye, D., Moe, S.R., Vedeld, P. and
Aynekulu, E. 2010. Land-use/cover
dynamics in Northern Afar rangelands,
Ethiopia. Agriculture, Ecosystems and
Environment 139(1-2):174-180.
UBOS, 2019. Poverty maps of Uganda:
Mapping the spatial distribution of poor
households and child poverty based on data
from the 2016/17 Uganda National
Household Survey and the 2014 National
Housing and Population Census Technical
Report October 2019. https://www.
ubos.org/wp-content/uploads/publications/
02_2020Poverty_Map_report__Oct_2019.pdf
Veldkamp, A. and Lambin E.F.2001. Predicting
land-use change. Agriculture, Ecosystems
and Environment 85:1-6.
Verburg, P.H., van Berkel, D.B., van Doorn,
A.M., van Eupen, M. and van den
Heiligenberg, H.A.R.M. 2010. Trajectories
of land use change in Europe: a model-
based exploration of rural futures.
Landscape Ecology 25:217-232.
Wainger, L.A., Rayburn, J. and Price, E.W.
2007. Review of land use change models
applicability to projections of future energy
demand in the Southeast United States.
Southeast energy futures project, UMCES
(CBL) 07-187. http://waingerlab.cbl.
umces .edu/docs /LUchangeReview
Revised.pdf. Accessed December 2018
Waiswa, C.D., Mugonola, B., Kalyango, R.S.,
Opolot, S.J., Tebanyang, E. and Lomuria,
V. 2019. Pastoralism in Uganda Theory.
Practice, and Policy (1st edn). https://
karamojaresilience.org/images/policy-
support/201907-publications/tufts_1939_

R. OSALIYA et al.616
pastoralism_uganda_text_book_v10_
online.pdf
Wilson, C.O. and Weng, Q. 2011. Simulating
the impacts of future land use and climate
changes on surface water quality in the Des
Plaines River watershed, Chicago
Metropolitan Statistical Area, Illinois.
Science of the Total Environment
409:4387-4405.
Wurzinger, M. Okeyo, A. Semambo, D. and
Sölkner, J. 2009. The sedentarisation
process of the Bahima in Uganda: An emic
view. African Journal of Agricultural
Research 4:1154-1158.