Rebels too old for a cause - · PDF fileRebels too old for a cause The dying motorcycle market...
22
Page 1 INTELLIGENCE, INDEPENDENCE, INTEGRITY www.analogica.jp Rebels too old for a cause The dying motorcycle market in Japan :; Mike Newman President & CEO Analogica K.K. May 23 rd , 2017
Transcript of Rebels too old for a cause - · PDF fileRebels too old for a cause The dying motorcycle market...

Page 1 INTELLIGENCE INDEPENDENCE INTEGRITY wwwanalogicajp
Rebels too old for a cause
The dying motorcycle market in Japan
Mike Newman President amp CEO Analogica KK
May 23rd 2017
Page 2 INTELLIGENCE INDEPENDENCE INTEGRITY wwwanalogicajp
1700000 gave up
motorcycle licenses in last 6 years
Who owns What
Executive Summary
The average age of motorcyclists in Japan is 53 years old and continuing to climb as younger riders
looking to obtain new licenses continues to drift Between 2010 and 2016 the Japanese National
Police Agency (JNPA) noted that large capacity motorcycle license holders (ogata ndash classified as
400cc+) have fallen by nearly 1500000 While mid-size (chugata ndash classified as below 400cc) have
risen around 715000 Female riders have shown a similar pattern of 178000 fall in ogata licenses
and 147000 increase in chugata respectively While there are still 9175mn men and 625000
women willing to get out on the highway with large capacity bikes the trend is alarming More
frighteningly new graduates arenrsquot lining up either 30000 fewer students lined up to get a mid or
large size bike license between 2014 and 2016 representing a 123 dip denoted by the red line in
Fig1
Source JNPA
Ownership
The Japanese motorcycle market is dominated by lt50cc scooters (referred to as gentsuki) Gentsuki
are popular because they can be ridden even with a standard Japanese car driverrsquos license The
gentsukirsquos low cost ($1000-1500) makes it practical to do short trips to the supermarket or
commutes especially considering the congested roads in Japan Fig2 Larger bore bikes are only
13 of the 12 million bikes on the road in Japan Motorcycles below 250cc do not require shaken
(compulsory inspection) unlike their bigger brothers
99
-2
7
-31
-4
0
-54
-5
5
-57
-6
0
-62
-6
6
-75
-7
6
-76
-8
0
-83
-8
5
-86
-8
9
-10
3-1
04
-10
7-1
10
-11
4-1
14
-11
7-1
17
-12
7-1
27
-13
2-1
33
-13
6-1
43
-14
5-1
45
-14
9-1
53
-15
8-1
60
-16
4-1
68
-17
2-1
73
-17
6-1
83
-19
3-2
01
-22
0
-350
-300
-250
-200
-150
-100
-50
00
50
100
150
Yam
agat
aFu
kui
Miy
azak
iK
agaw
aW
akay
ama
Saga
Ho
kkai
do
Shim
ane
Toky
oC
hib
aG
ifu
Niig
ata
Mie
Ku
mam
oto
Ehim
eSa
itam
aO
saka
Nar
aG
un
ma
Yam
anas
hi
Ibar
aki
Toch
igi
Yam
agu
chi
Nag
ano
Kyo
toIw
ate
Hir
osh
ima
Ko
chi
Nag
asak
iK
anag
awa
Ish
ikaw
aO
ita
Aic
hi
Fuku
oka
Ao
mo
riSh
iga
Oki
naw
aM
iyag
iH
yogo
Fuku
shim
aA
kita
Shiz
uo
kaTo
yam
aK
ago
shim
aTo
kush
ima
Oka
yam
aTo
tto
ri
Fig1 - Total New Motorcycle Graduates change (2016 vs 2014)
Page 3 INTELLIGENCE INDEPENDENCE INTEGRITY wwwanalogicajp
Gentsuki
Large bore only 13 of
total
Source JAMA
However ownership levels for gentsuki have been sliding for over a decade from around 980000
units per annum to just under 700000 Motorcycles over 50cc have shown the opposite although
at a very slow pace nudging over 500000 units before drifting back to 450000
Source JAMA
Larger bore motorcycle trends are slowly grinding higher In the 250cc+ market BMW holds an
effective 58 market share Harley Davidsonrsquos share is approximately 13 Yamaha made good
progress with the MT-0709 series which gave consumers a reasonably priced (yen700000-900000)
naked bike with ample performance The initial sales target of 1500 units annually was quickly raised
to 4000 after its release Simply put good product sells
Annual motorcycle sales in Japan hit a peak of 328 million in 1982 but decreased to 450000 by
2014 according to JAMA
6889459 58
1582925 13
1959845 16
1542856 13
Fig 2 Japan Motorcycle Ownership - Units (2012)
Scooter (lt50cc) 50cc-125cc) 125cc-250cc 250cc+
0
200000
400000
600000
800000
1000000
1200000
2001 2002 2003 2004 2005 2006 2007 2008 2009 2010 2011 2012
Fig3 Trend of Japanese Motorcycle Purchase (2001-2012)
Gentsuki Motorcycle
Page 4 INTELLIGENCE INDEPENDENCE INTEGRITY wwwanalogicajp
Return riders
Emissions laws
Product offerings are clearly important One of the most significant trends is the popularity of
motorcycle sales to middle-aged and older people wanting larger capacity bikes than the common
250cc These people are often return riders The average age of motorcycle riders is now 53 up 93
years on 2005 Multi bike ownership is on the rise after the Global Financial Crisis in 2008
Source JAMA
Japanrsquos large bore domestic market has been hindered by restrictive emissions laws and power
limiters Some Japanese motorcycle purchasers prefer overseas specification motorcycles known
as reverse imports to dispense with the restrictions of the domestic offerings
A good example of this is the Yamaha XJR1300 The domestic version has not changed for the last
six years but there is no plan to introduce the 2017 European model in the Japanese market The
EuropeanUS version of the bike is offered under the branding of lsquoborn customisedrsquo Fig6
Fig 6 Domestic (left) and Overseas (right) versions of Yamaharsquos XJR1300
Source Company Data
So what drives the Japanese motorcycle buyer What are the main concerns and what are the
trends we should pay attention to
lt50cc 51-125cc 126-250cc 250cc+
2012 246095 90291 45306 60715
2013 238786 100947 55441 65289
2014 228918 96249 54303 70151
2015 236000 97000 56000 68000
0
50000
100000
150000
200000
250000
300000
Fig 4 Japan - New Motorcycle Sales by Engine Size
2012 2013 2014 2015
1 Bike 2 Bikes 3 Bikes 4+ Bikes Average
2005 68 19 5 4 14
2007 64 21 6 5 15
2009 50 13 4 2 14
2011 69 21 5 5 15
2013 58 26 8 8 16
01020304050607080
Fig 5 Motorcycle Ownership by individual household (units)
2005 2007 2009 2011 2013
Page 5 INTELLIGENCE INDEPENDENCE INTEGRITY wwwanalogicajp
JAMA study
Age
Replacement
Parking
Desire
Women
No real change in 2013
survey
Average ownership up
Foreign brands more
popular in large bore market
The Japan Automotive Manufacturers Association (JAMA) conducted a survey of 5150 people on
trends in motorcycling in Japan in 2011 Their findings were
A) Ownership declined among users in their 30s or younger but increased among users in
their 50s or older underscoring the continued rise in the average age of motorcycle users
B) Replacement demand accounted for 59 of all new-model purchases up from 57 in the
2009 survey First-time purchases accounted for 15 of the total not significantly different from
the previous surveyrsquos figure but underscoring a sustained decline in first-time motorcycle
purchases
C) Over 76 of owners in Tokyo (ie its main 23 wards) reported experiencing difficulties in
finding a parking space for their motorcycles
D) Respondents expressing the desire to continue riding motorcycles in the future totaled
87 down from the 92 peak recorded in 2009
E) A large percentage of women respondents viewed motorcycles as a ldquoMeans of transportrdquo and
ldquoLifestyle commodityrdquo while a significant percentage of male respondents considered them
a ldquoHobby itemrdquo
In 2013 the results from JAMArsquos survey was largely unchanged
F) Ownership has continued to decline steadily among young men in their teens 20s and
30s Ownership by women has levelled off since fiscal 2009 although among women
respondents in their 50s or older the ownership rate surpassed 60 Meanwhile ownership of
scooters and business-use lightweight motorcycles under 50cc in engine capacity among users
in their 50s or older has grown more pronounced
G) The average period of motorcycle ownership prior to its replacement with a new purchase
was 66 years up from the previous surveyrsquos 61 years This confirms the trend towards longer
ownership which was particularly marked for scooters 50cc and under in engine capacity Large
capacity motorcycles have an average turnover of 41 years up from 39 years 250cc-400cc
motorcycle ownership periods remained flat at 34 years
H) Respondents expressing the desire to continue riding motorcycles in the future totaled
88 up slightly from the 87 indicated in the previous survey but still down from the peak of
92
While overall motorcycle license holders continue to increase in aggregate what is the rate of new
license holders Is it rising falling
Financing trends have remained pretty consistent at 12 of overall sales according to JAMA with
many preferring to pay cash
There is an inverse correlation between domestic brands and engine size Fig7 Foreign brand
popularity is driven in part due to the higher average engine capacity
Page 6 INTELLIGENCE INDEPENDENCE INTEGRITY wwwanalogicajp
Licenses
Below 400cc market rising
Source JAMA
Licensing
The number of new motorcycle licenses issued in Japan has been falling consistently In 2004 almost
320000 new licenses were issued In 2016 that number had fallen 40 Total motorcycle licenses
held in 2014 number 202mn with 104mn of those Ogata (400cc+ engine size) class
Source JNPA
Fig 9 shows the status of riders who possess a motorcycle licence separated by engine class
and gender There are two classes - Chugata (middle class) licenses are below 400cc and
Ogata licenses are available for those who wish to purchase bikes above 400cc We can clearly
see that Ogata numbers for both genders is declining but Chugata licenses are rising The
decline in licenses has to do with licenses not being renewed
lt50cc 51-125cc 126-250cc 251-400cc 401-750cc 751cc+
Domestic Maker 93 87 81 74 63 47
Reverse Import 3 5 8 8 15 16
Foreign Maker 3 8 10 17 21 37
0
10
20
30
40
50
60
70
80
90
100
Fig 7 Origin of manufacturer preference by Engine Size ()
319
369
304
842
274
842
267
724
236
355
226
844
215
041
199
945
188
362
190
331
179
585
198
456
185
422
0
50000
100000
150000
200000
250000
300000
350000
2004 2005 2006 2007 2008 2009 2010 2011 2012 2013 2014 2015 2016
Fig8 Newly issued Motorcycle Licenses
Page 7 INTELLIGENCE INDEPENDENCE INTEGRITY wwwanalogicajp
Driving schools
expensive
Source JNPA
Let us consider the cost to get a Japanese motorcycle license One cannot get an Ogata license
without getting Chugata first Fig 10 highlights the high cost of getting a license The dots represent
standard (blue) double time (red) and fast (green) So to get a full bore Ogata license from no license
at all could set one back over $3000 One could try to avoid the cost and try at the official test
centres but the tests are designed to test memory rather than skill to force schooling The schools
are authorised to give passing grades for licenses at the end of tuition and well over 95 of students
that go to these schools pass
Fig 10 Hinomaru Driving School costs to get a motorcycle license - $3000+ investment
Source Hinomaru Driving School
Ogata (400cc+)- Men Chugata (lt400cc)- Men Ogata (400cc+)- Women Chugata (lt400cc) - Women
2010 10670417 7842426 802520 1172508
2011 10427177 7956291 770726 1198582
2012 10193671 8086072 745259 1224714
2013 9997273 8220635 726418 1252057
2014 9732861 8343178 697214 1276514
2015 9454801 8453963 657783 1298578
2016 9175340 8557534 624476 1320082
0
2000000
4000000
6000000
8000000
10000000
12000000
Fig 9 Motorcycle Licence Holders in Japan by Type
2010 2011 2012 2013 2014 2015 2016
Motorcycle
Chugata
Ogata
Category License Class License Status
No
License
Car
License
Chugata
Plan Time Tuition Enrollment Fee
Page 8 INTELLIGENCE INDEPENDENCE INTEGRITY wwwanalogicajp
Young go small
Fig 11 denotes the number of chugataogata graduates from motorcycle license schools in 2016 The
yellow bars denote a GDPcapita ratio at 5 below the national average or above
Source JNPA
Fig12 shows at what age groups people move to take up their motorcycle licenses Chugata
licenses are the main target of the 20s-40s with Ogata picking up after 50s as the common
motorcycle license type It would be fair to assume that affordability is a likely factor in choosing a
license both schooling and motorcycle cost
Source JAMA Note some double counting due to multiple licenses taken out (eg Ogata amp car)
0
5000
10000
15000
20000
25000
Kan
agaw
a
Toky
o
Osa
ka
Kyo
to
Sait
ama
Aic
hi
Hyo
go
Ch
iba
Fuku
oka
Shiz
uo
ka
Hir
osh
ima
Toch
igi
Ho
kkai
do
Oki
naw
a
Ibar
aki
Miy
agi
Ku
mam
oto
Niig
ata
Oka
yam
a
Gif
u
Fuku
shim
a
Gu
nm
a
Mie
Kag
osh
ima
Shig
a
Ehim
e
Nag
ano
Yam
agat
a
Wak
ayam
a
Miy
azak
i
Nag
asak
i
Nar
a
Kag
awa
Oit
a
Saga
Yam
agu
chi
Yam
anas
hi
Ish
ikaw
a
Ao
mo
ri
Iwat
e
Shim
ane
Ko
chi
Toya
ma
Toku
shim
a
Fuku
i
Aki
ta
Tott
ori
Fig 11 - ChugataOgata Licence Graduates by prefecture (2016)
10s 20s 30s 40s 50s 60s 70+
Gentsuki Only 26 10 2 2 2 3 22
Car License incl Gentsuki 47 22 13 16 21 31 14
Bike license lt250cc 4 2 3 5 7 8 12
Chugata 22 57 61 61 37 11 7
Ogata 2 17 30 29 32 46 41
0
10
20
30
40
50
60
70
Fig 12 Age when Motorcyclists take up a license ()
Gentsuki Only Car License incl Gentsuki Bike license lt250cc Chugata Ogata
Page 9 INTELLIGENCE INDEPENDENCE INTEGRITY wwwanalogicajp
Female age rising
Sourcing information
Source JAMA
The average age of female and male riders has risen from 43-44yo range in 2005 to 53yo range in
2015 Thinking of it another way these 43-44yo group just grew 8 years old along with the survey
by JAMA Figs 15-16
Source JAMA
JAMArsquos 2013 motorcycle survey revealed that dealerships are a key source of information on
motorcycles followed by websites Fig 17
10s 20s 30s 40s 50+
2005 10 32 29 18 11
2007 3 27 29 22 19
2009 4 22 23 30 20
2011 3 23 21 29 24
2013 4 16 19 29 19
05
1015
20
2530
35
Fig 13 251cc-400cc Bike Ownership by Age ()
2005 2007 2009 2011 2013
10s 20s 30s 40s 50+
2005 1 22 23 35 18
2007 1 13 32 38 17
2009 0 12 30 33 23
2011 0 12 19 36 32
2013 0 6 15 33 42
05
1015202530354045
Fig 14 400cc+ Bike Ownership by Age ()
2005 2007 2009 2011 2013
10s 20s 30s 40s 50sAverage
Age
2005 7 14 21 23 34 429
2007 5 10 19 22 43 460
2009 4 8 18 25 45 470
2011 3 7 15 25 49 484
2013 3 5 10 24 58 510
0
10
20
30
40
50
60
70
Fig 15 Average Age of Motorcycle Riders Male ()
2005 2007 2009 2011 2013
10s 20s 30s 40s 50sAverage
Age
2005 11 19 16 13 42 442
2007 7 20 12 15 46 452
2009 6 8 11 16 59 489
2011 6 8 11 17 58 510
2013 8 6 9 17 61 520
0
10
20
30
40
50
60
70
Fig 16 Average Age of Motorcycle Riders - Female ()
2005 2007 2009 2011 2013
Page 10 INTELLIGENCE INDEPENDENCE INTEGRITY wwwanalogicajp
Large bore attracts
hobbyists
Source JAMA
However JAMA also highlights (Fig18) that as engine size grows motorcycle magazines become a
very important source of new information Although there are dedicated BMW magazines (including
a dedicated version lsquoBMW Boxer Journalrsquo in Japan other broader magazines lsquoBike Brosrsquo lsquoBikejinrsquo
and the like are equally important to attract new customers Larger bore motorcycle riders clearly
view motorcycles as a hobby
Source JAMA
DealerMaker
WebsiteMotorcycleMagazine
CataloguePamphlet
Otherwebsite
Heard fromFriendExp
ert
Saw parkedon Street
Saw RidingPast
Pamphlet Newspaper Direct MailMotorsho
wTV Ad
MagazineAd
2005 40 7 13 11 2 6 6 4 2 1 0 0 2 1
2007 38 9 12 11 2 6 5 5 2 1 0 0 1 1
2009 41 12 11 9 3 5 3 3 1 0 0 0 1 0
2011 40 14 10 9 6 6 5 4 1 0 0 0 0 0
2013 43 14 9 7 6 6 4 3 1 1 0 0 0 0
0
5
10
15
20
25
30
35
40
45
50
Fig 17 How motorcycle riders source information on bikes () by year
2005 2007 2009 2011 2013
DealerMaker
WebsiteMotorcycleMagazine
CataloguePamphlet
Otherwebsite
Heard fromFriendExp
ert
Sawparked on
Street
Saw RidingPast
Pamphlet Newspaper Direct MailMotorsho
wTV Ad
MagazineAd
lt50cc 54 11 2 8 3 5 3 3 2 1 0 0 0 0
51-125cc 30 19 12 7 7 8 6 5 1 1 0 0 0 0
126-250cc 18 19 29 4 14 5 3 3 0 0 0 1 0 0
251-400cc 14 24 26 5 10 5 4 6 0 0 0 1 0 0
401-750cc 13 18 41 2 12 4 1 0 0 0 0 4 0 0
751cc+ 16 16 37 1 8 6 2 2 0 0 0 5 1 0
0
10
20
30
40
50
60
Fig 18 How motorcyclists gain information on bikes () by engine size
lt50cc 51-125cc 126-250cc 251-400cc 401-750cc 751cc+
Page 11 INTELLIGENCE INDEPENDENCE INTEGRITY wwwanalogicajp
Trend of the Japanese
Source JAMA
The plight of the Japanese makers globally
Looking over the last 5 years Japanese motorcycle manufacturers have been struggling Honda
remains at the top of the production tree at 177 million units but Yamaha has trended down while
Suzuki continues to suffer the steepest drop of all makers declining 8-19 per annum Kawasaki
Heavy has maintained a more focused strategy with larger bore motorcycles
Source Custom Products Research Company data
When analysing the contribution that motorcycle segments make to the Japanese makersrsquo group
revenue and EBIT we see the following
0
10
20
30
40
50
60
70
Want adifferent
type
Want to ridedifferentengine
capacity
Want toseparate use
Conveniencevs Hobby
Want to addto hobby
StyleDesign Current bikereliability
gettingworse
New modelrelease
Current bikeservicinggetting
expensive
Economicsituationimproved
Cheap price Touring withFamily
Members
Dealerpushed hard
Fig 19 Why owners choose a second bike ()
2011 2013
15494000
6090000
2574000
544000
17661000
5154000
1367000 540000
-
2000000
4000000
6000000
8000000
10000000
12000000
14000000
16000000
18000000
20000000
Honda Yamaha Suzuki Kawasaki
Fig20 Japanese makers Global Motorcycle Production (units)
FY2012 FY2013 FY2014 FY2015 FY2016
Page 12 INTELLIGENCE INDEPENDENCE INTEGRITY wwwanalogicajp
EBIT marhins
Source Custom Products Research Company data
Unsurprisingly Yamaha is the purest motorcycle play (Fig21) in Japan However its contribution
from motorcycles has been declining as a percentage of total revenue There are two factors at play
One is the growth in sales of boat engines (where it commands 40 a global share) and second is
a focus on more profitability per unit Fig22 EBIT margins for the global motorcycle majors can be
seen here Honda has seen its motorcycle segment grow as a percent of group EBIT due to weaker
performances in cars Suzuki is the worst performer
Source Custom Products Research Company Data
00
200
400
600
800
Honda Yamaha Suzuki Kawasaki
Fig21 Japanese motorcycle makers revenue as of group
FY2012 FY2013 FY2014 FY2015 FY2016
-200-100
00100200
300400
Honda Yamaha Suzuki Kawasaki
Fig 22 Japanese motorcycle makers EBIT as of group
FY2012 FY2013 FY2014 FY2015 FY2016
101
39
-05
38
90 90
147
-100-500050
100150200
Fig23 Major Motorcycle Makers segmented (not group) EBIT Margins ()
FY2012 FY2013 FY2014 FY2015 FY2016
3972 84
30
100 90
175
00
50
100
150
200
250
Fig 24 Group EBIT Margins ()
FY2012 FY2013 FY2014 FY2015 FY2016
Page 13 INTELLIGENCE INDEPENDENCE INTEGRITY wwwanalogicajp
Foreign brands focused
Source Custom Products Research Company data
Analysing the foreign brands shows clear product focus has paid off The four major European large
bore makers have experienced double digit production growth
-
5000000
10000000
15000000
20000000
25000000
Fig25 Major Motorcycle Makers Segmental Revenue (US$euro000s)
FY2012 FY2013 FY2014 FY2015 FY2016
+34
-14
-32 -5 +39 +87
+7
-500000
-
500000
1000000
1500000
2000000
2500000
Fig26 Major Motorcycle Maker Segmental EBIT ($000s)
FY2013 FY2014 FY2015 FY2016
+65
+87+137-32NA+287
-12
Page 14 INTELLIGENCE INDEPENDENCE INTEGRITY wwwanalogicajp
Efficiency
Severe pressure
Source Custom Products Research Company data
One thing Figs 20 amp 27 point out is that focused strategies appear to be paying off for the Europeans
and to some extent Kawasaki which has moved away from a me-too approach Efficiency and brand
seems to be paying off for BMWrsquos continued rise and a broad range of product unlike Harley which
seems to be stuck in a divine franchise scenario Profitable but struggling to break out of cruisers It
has had a stab at sports bikes through Buell (business was spun off and EBR has since closed) and
the Porsche designed V-Rod (now out of production) Now that Ducati is potentially being sold by
Audi does Harley look to use a proper sports brand with no clash in its line up to fuel (no pun
intended) its growth
Summary The Japanese motorcycle market is under severe pressure It is little wonder that the domestic
makers arenrsquot exerting too much effort into the market given the long-term decline in the market Half
of the decline is driven by apathy and poor product placement The lsquobuild it and they will comersquo dealer
model is a sure fire way to ensure the market dies The foreign luxury brands appear to be gaining
share They continue to target the heart not the head like the Japanese makers Yamaha Motor has
been the most proactive of the domestic makers in providing a product that attracts new riders Such
has the success been of the Yamaha Bolt that Harley-Davidson has had to respond with a
yen1000000 entry level model Sadly with 1800000 male and female motorcycle license holders
giving up the right to ride over the last 6 years there is not much time left to save the remaining 10
million that remain
The differences between the focused foreign brands and the everything for everyone Japanese is
clear While Honda can grunt with its huge economies of scale sadly Suzuki needs to resurrect its
former glories of the 1980s rather than produce more me-too Kawasaki would seem to have worked
that out
On top of that the employment situation in Japan doesnrsquot lend itself to allow for investment in such
hobbies as motorcycles We outline that plight in the appendix
-
50000
100000
150000
200000
250000
300000
BMW Motorrad KTM AG Harley-Davidson Ducati Triumph
Fig 27 Non-Japanese Motorcycle Maker Production (units)
FY2012 FY2013 FY2014 FY2015 FY2016
+28
+15+26
+6
+70
Page 15 INTELLIGENCE INDEPENDENCE INTEGRITY wwwanalogicajp
Income
Assets
Unemployment
Appendix - Income amp Demographics
Assessing the demographics of financial assets by age group there is no question that the 40s-50s
segments have more assets than the 20-30s cohort This means that a makers are unlikely to make
huge inroads with the set (backed up by the JAMA survey) in a declining market targeting an age
group that has proved less interested in riding than the peak of 2009
Fig 28 bears out the trend Remember that the 50s set are far more likely to buy gentsuki according
to JAMA For the target BMW KTM Harley or Triumph motorcycle buyer 30s to 50s should be the
addressable market comprising around 40 of assets by age
Source Japan Central Council for Financial Service Information
Here is where it gets tricky After the Global Financial Crisis of 2008 unemployment rates in Japan
have drifted downwards Fig 29 However this masks the new reality of the composition of
employment The quality of employment is deteriorating
Source Statistics Bureau
The days have passed when most department stores had their elevator girls and train stations had
their confetti bag laden ticket clippers waiting at the exits But Japan if anything is moving further
20-29 05 30-39 56
40-49 128
50-59 21860-69 366
70+ 227
Fig 28 Total Financial Assets by Age Group
20-29 30-39 40-49 50-59 60-69 70+
00
20
40
60
80
100
15~24 25~34 35~44 45~54 55~64 65+
Fig 29 Unemployment Rate by Age Group (2007-2015)
2007 2008 2009 2010 2011 2012 2013 2014 2015
Page 16 INTELLIGENCE INDEPENDENCE INTEGRITY wwwanalogicajp
Changes in labour laws
FT vs PT
towards a service economy Unfortunately the labour productivity gains over the last 20yrs have
come almost exclusively from the manufacturing sector with retail transport restaurants hotels and
business services falling well below their global peers for productivity At least the service is still
great
Significant revisions to the labour personnel dispatch laws in rsquo95 and rsquo99 made it much easier to
employ irregular and subcontract workers and hence began a dumbing-down of the workforce since
less time was spent on education and training in general (putting Japanese workers in more direct
competition with their Asian neighbours) Average monthly wages (including overtime bonus and
social welfare deductions) have generally been flat over the last 5 years though increased 03 in
2015 due to overtime and bonuses but management is reticent to add to fixed costs with wage
increases as it would rather maintain flexibility through higher bonuses Legally mandated social
welfare costs mainly paid by employers have risen at a compound rate of 139 pa over the last
20 years while nominal wages have only increased 027 pa such that social welfare costs have
risen from 104 to 148 of wages during this time
Fig 30 Wages by type of employment by age (yenhour)
Source Ministry of Health Labor amp Welfare (MHLW)
The long running trend of full-time work in a regular capacity has given way to a lot more part-time
(lower paying) jobs which involves less lsquoother costsrsquo like insurance retirement and so on This
change puts pressure on the household budget The instance of lower paid part-time work has grown
since then from 30 to 374 of the total For women this is now 56
Page 17 INTELLIGENCE INDEPENDENCE INTEGRITY wwwanalogicajp
More PT women
Law changes
Source Statistics Bureau
Fig 32 shows that since 2003 more women are employed part time than full time The point to be
made here is that the long term underlying disposable income for Japanese is shrinking
Source Statistics Bureau
This coming May PM Abe wishes to introduce a policy which requires equal wages for full-time and
contract hires However such approaches are likely to marginalise hiring should the law be
introduced
The Japanese Institute for Labour Policy amp Training (JILPT) makes the case for employerrsquos reasons
to hire non-regular employees clear in Fig 33 ldquoTo economise on wagesrdquo and ldquoto economise on non-
labour costsrdquo are the two highest categories
00
100
200
300
400
500
600
700
800
900
19
84
19
85
19
86
19
87
19
88
19
89
19
90
19
91
19
92
19
93
19
94
19
95
19
96
19
97
19
98
19
99
20
00
20
01
20
02
20
03
20
04
20
05
20
06
20
07
20
08
20
09
20
10
20
11
20
12
20
13
20
14
20
15
Fig 31 Full-time vs Part-Time Trend as a of total employees in Japan ()
Regular Employee ( of total) Non Regular ( of total)
0
200
400
600
800
1000
1200
1400
1600
19
84
19
85
19
86
19
87
19
88
19
89
19
90
19
91
19
92
19
93
19
94
19
95
19
96
19
97
19
98
19
99
20
00
20
01
20
02
20
03
20
04
20
05
20
06
20
07
20
08
20
09
20
10
20
11
20
12
20
13
20
14
20
15
Fig 32 Full time vs Part-time Female Employees (000 people)
Women Regular Employees Women Non-regular employees
Page 18 INTELLIGENCE INDEPENDENCE INTEGRITY wwwanalogicajp
Supplement Income
Fig 33 Employerrsquos Reasons for Hiring non-regular employees ()
Source Japan Institute for Labour Policy amp Training
While convenient work hours are a high factor for part-time workers note that ldquolack of regular
employment opportunitiesrdquo is the most consistently high factor for male employees selecting non-
regular jobs Fig 34
Fig 34 Male Employeersquos Reasons for selecting non-regular employment ()
Source Japan Institute for Labour Policy amp Training
Female non-regular employees showed similar trends to that of men with regards to being unable
to secure regular employment but ldquodomestic reasonsrdquo (38) was a high factor however 47 said
that ldquosupplementing household incomerdquo was second to convenience in work hours (507) In short
the labour market is preventing stable employment which adds to individual concerns
Page 19 INTELLIGENCE INDEPENDENCE INTEGRITY wwwanalogicajp
Zero growth
Economic revival Scenario
City mergers
Fig 35 is an outline of the government projections of employment growth by industry according to
the JILPT Under a zero growth scenario they expect to see most job categories decline 20-30 by
2030 (based on 2012) One of the key assumptions is that JILPT expects that under zero growth
there is unchanged labour force participation while economic revival calls for progressive labour
participation
Source Japan Institute for Labour Policy amp Training
Fig36 looks at jobs growth by industry under the governmentrsquos bullish lsquoeconomic revivalrsquo scenario
This assumes workforce participation gradually recovers None-the-less a lot of jobs will go through
retirement and restructuring Once again this poses issues for the set-up of new dealerships with
this economic backdrop
Source Japan Institute for Labour Policy amp Training
It should be noted that since the 1990s the Japanese national government has run an aggressive
campaign to merge towns and cities known as lsquoshichison gappeirsquo in an attempt to streamline public
services to account for rapidly aging and shrinking populations in the regional areas Fig 36 shows
the large scale migration towards the cities as evidenced by population growth since 1920 There
could be no rational argument for a dealership in Shimane Prefecture based on zero population
-600
-500
-400
-300
-200
-100
00
100
200
300Fig 35 Jobs growth by industry in a Zero Growth outlook
Zero growth (2020) Zero growth (2030)
-400
-300
-200
-100
00
100
200
300Fig 36 Jobs growth by industry in Economic Revival outlook
Economic Revival (2020) Economic Revival (2030)
Page 20 INTELLIGENCE INDEPENDENCE INTEGRITY wwwanalogicajp
Divorce
Birth rates
growth since in the last 90 years Any children born in these areas will quickly realise that job
prospects will be highly limited much like the eastern areas of Germany immediately post
reunification
Source Statistics Bureau
Divorce rates have been surging since 2000 Since 2007 women are now entitled to 50 of their
ex-husbandrsquos pension
Source Statistics Bureau
Japanese births rates among females in their 20s continues to fall as women choose career and feel
a lack of suitable partners In 1990 557 of men and 433 of women were not married at 50 but
this has now reached 201 and 106 respectively Fig 31 highlights those women who married
583
9
445
1
365
3
255
7
254
6
242
5
148
0
144
1
143
5
142
9
142
7
133
4
131
8
128
8
120
0
116
7
104
8
945
920
907
855
816
743
735
597
572
566
510
489
480
474
469
394
392
377
367
346
337
336
295
261
256
208
206
205
172
139
03
00
1000
2000
3000
4000
5000
6000
7000
Kan
agaw
a
Sait
ama
Ch
iba
Toky
o
Aic
hi
Osa
ka
Nar
a
Miy
agi
Oki
naw
a
Shiz
uo
ka
Hyo
go
Ho
kkai
do
Fuku
oka
Jap
an
Ibar
aki
Shig
a
Kyo
to
Gif
u
Toch
igi
Gu
mm
a
Hir
osh
ima
Ao
mo
ri
Miy
azak
i
Mie
Oka
yam
a
Iwat
e
Ish
ikaw
a
Toya
ma
Fuku
shim
a
Yam
anas
hi
Ku
mam
oto
Kag
awa
Yam
agu
chi
Oit
a
Nag
ano
Ehim
e
Fuku
i
Niig
ata
Wak
ayam
a
Tott
ori
Saga
Nag
asak
i
Aki
ta
Yam
agat
a
Kag
osh
ima
Toku
shim
a
Ko
chi
Shim
ane
Fig 37 Population Growth by prefecture (2010 vs 1920)
15-19 20-24 25-29 30-34 35-39 40-44 45-49 50-54 55-59 60-64 65-69 70-74 75+
1990 00 04 16 29 42 52 53 48 43 42 39 31 21
1995 00 05 18 34 44 56 64 60 51 43 40 37 23
2000 00 07 24 42 56 63 70 74 65 53 43 39 28
2005 01 09 26 50 70 81 82 82 81 68 53 42 32
2010 00 08 25 45 68 86 95 92 88 84 68 52 35
00
10
20
30
40
50
60
70
80
90
100
Fig 38 Divorce Rates of females by age group ( of married population)
1990 1995 2000 2005 2010
Page 21 INTELLIGENCE INDEPENDENCE INTEGRITY wwwanalogicajp
by age group Age groups between 15 and 59 have seen declines in marriage over the last 20 years
One expects these women are looking for hobbies
Source Statistics Bureau
The 2012 MHLW white paper on the nationrsquos declining birth-rate showed women on average were
having their first child after the age of 303 (the first time ever 30 was breached as an average was
2011) Fig 40
Source MHLW
15-19 20-24 25-29 30-34 35-39 40-44 45-49 50-54 55-59 60-64 65-69 70-74 75+
1990 07 135 575 827 873 871 864 842 799 730 610 451 208
1995 06 126 496 764 847 861 850 838 806 747 656 507 252
2000 09 113 435 689 792 833 837 824 803 757 678 561 252
2005 08 104 382 627 724 775 805 809 792 761 696 593 291
2010 06 93 362 597 686 720 752 780 781 756 707 617 317
00
100
200
300
400
500
600
700
800
900
1000
Fig 39 Females Married by age group ( of age population)
1990 1995 2000 2005 2010
00
500
1000
1500
2000
2500
3000
15--19 20--24 25--29 30--34 35--39 40--44 45--49
Fig 40 Japanese Birthrates000 females(1925-2013) by age group
Page 22 INTELLIGENCE INDEPENDENCE INTEGRITY wwwanalogicajp
Important Disclosures
This material was prepared for you and is for your information and use only This material should only be distributed to other members of that organization on a need to know basis and should not be distributed or disseminated to any other person or entity
This material is for information purposes only and it should not be regarded as an offer to sell or as a solicitation of an offer to buy the securities or other instruments mentioned in it This material is based on current public information that Analogica KK (Analogica) considers reliable but we make no representation that it is accurate or complete and it should not be relied on as such No investment opinion or advice is provided intended or solicited Analogica offers no warranty either expressed or implied regarding the veracity of data or interpretations of data included in this report This material is provided with the understanding that Analogica is not acting in a fiduciary capacity Opinions expressed herein reflect the opinion of Analogica and are subject to change without notice
The products mentioned in this document may not be eligible for sale in some states or countries and they may not be suitable for all types of investors The value of and the income produced by products may fluctuate so that an investor may get back less than they invested Value and income may be adversely affected by exchange rates interest rates or other factors Past performance is not necessarily indicative of future results If a product is income producing part of the capital invested may be used to pay that income copy 2015 Analogica KK All rights reserved
Tokyo 17F Roppongi Hills North Tower 6-2-31 Roppongi Minato-ku Tokyo Japan 106-0032
Office Locations
Tokyo Michael Newman President amp CEO Analogica KK
+81-80-4446-8200 mcnanalogicajp
Contact
Headquarters 942 Win Aoyama 2-2-15 Minamiaoyama Minato-ku Tokyo Japan 107-0062
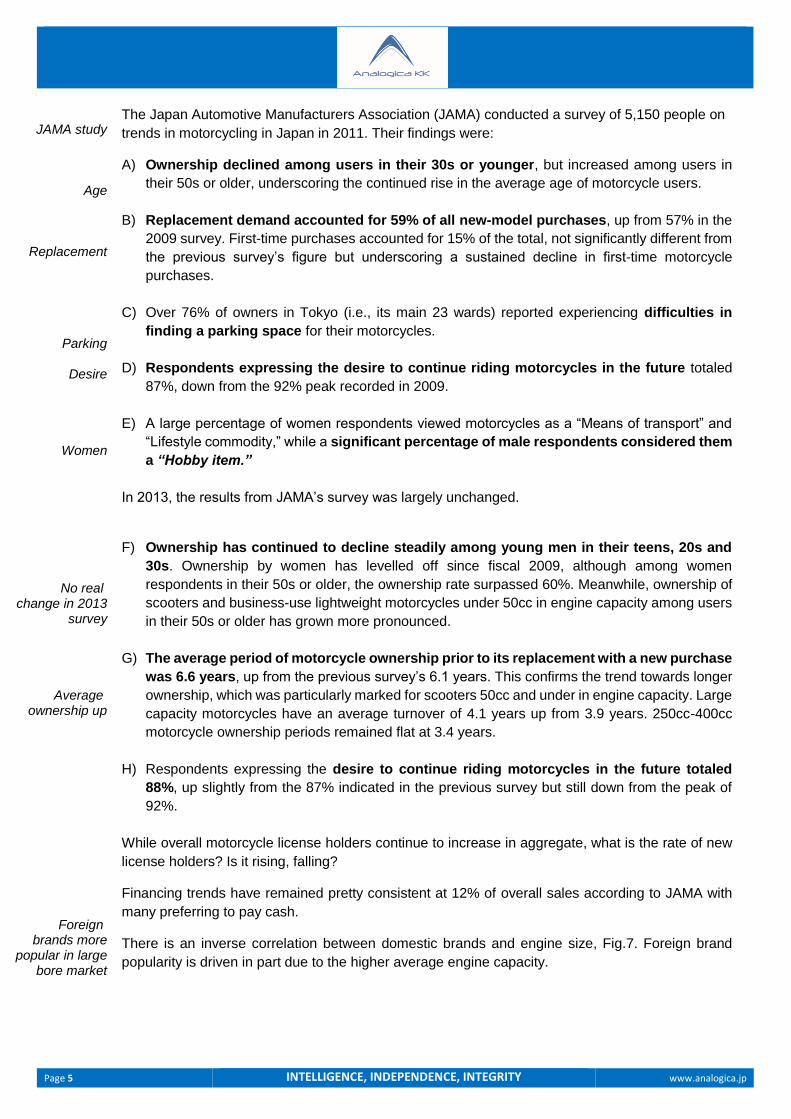
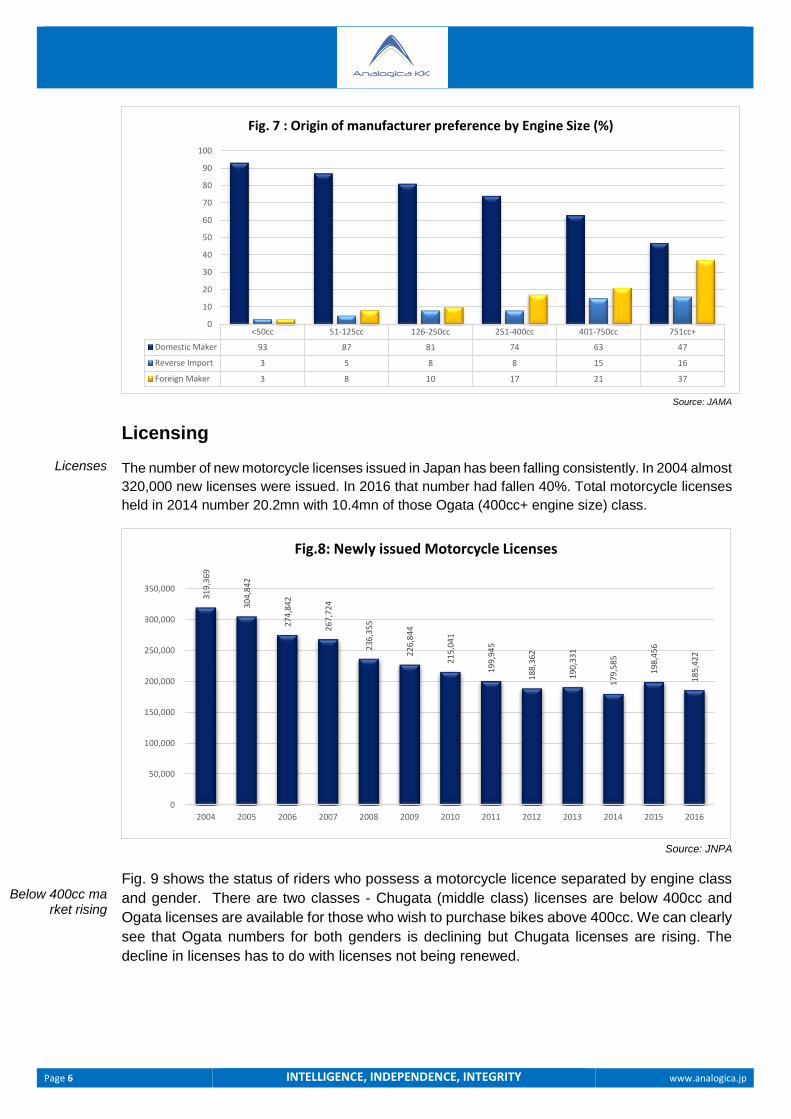
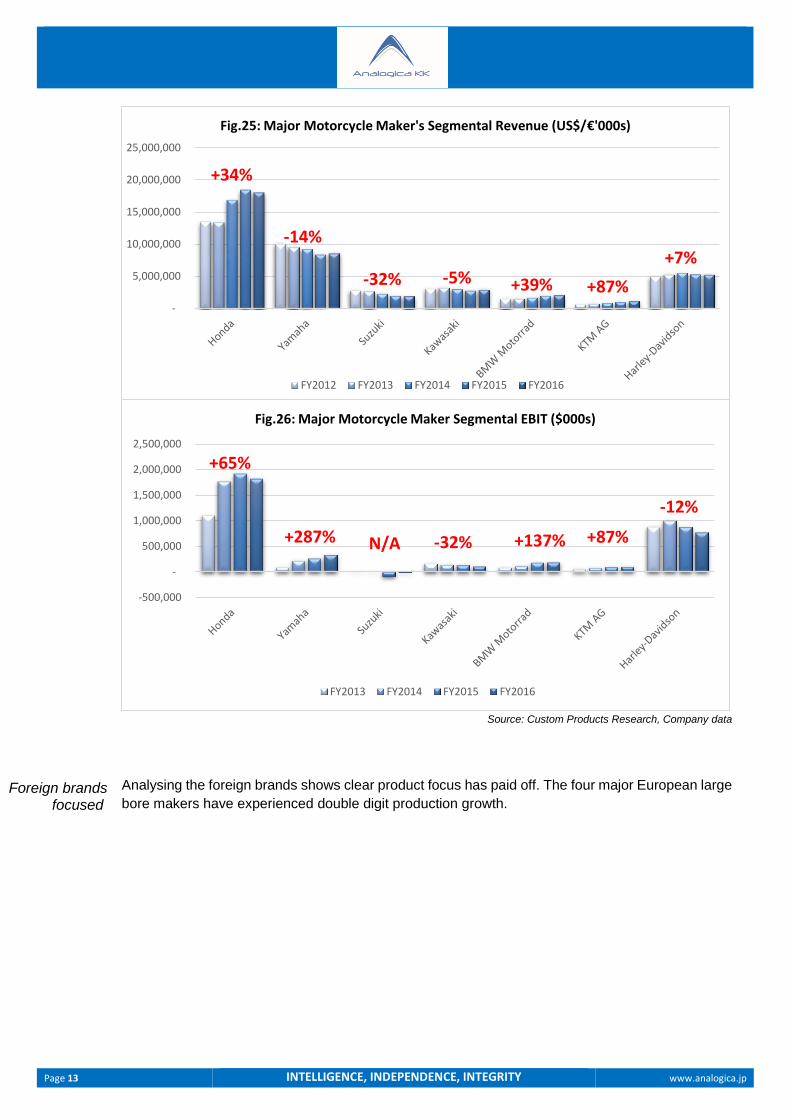
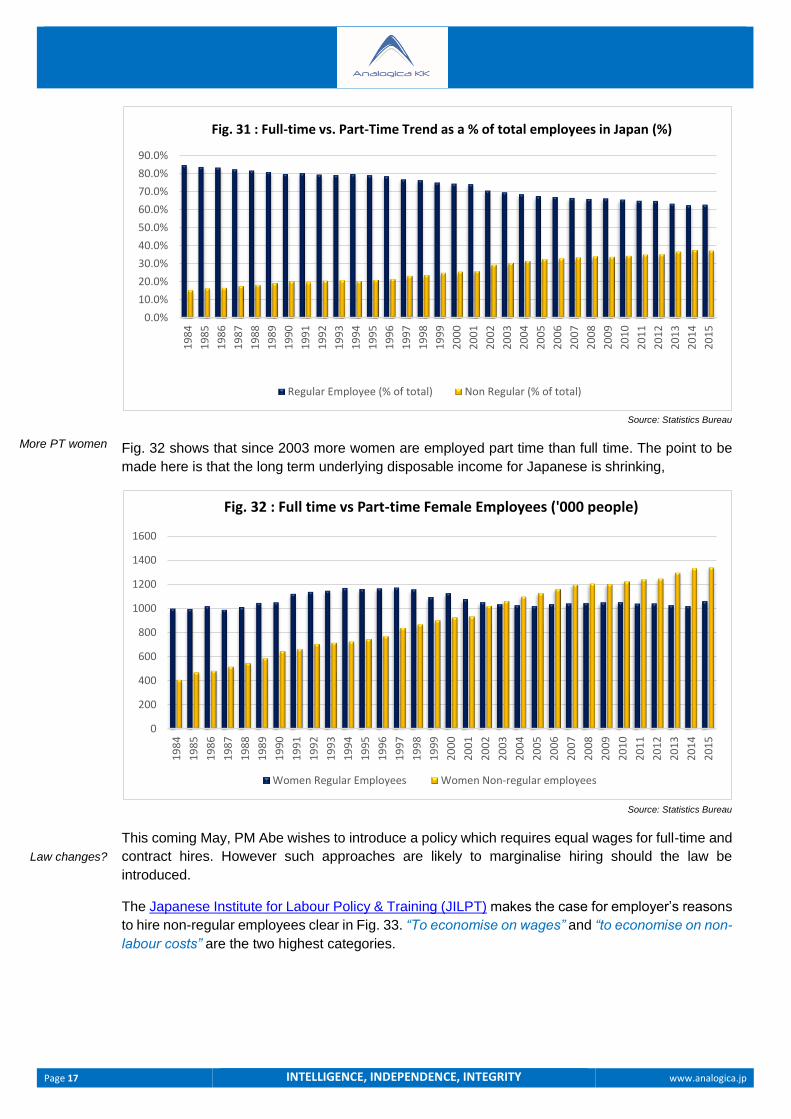
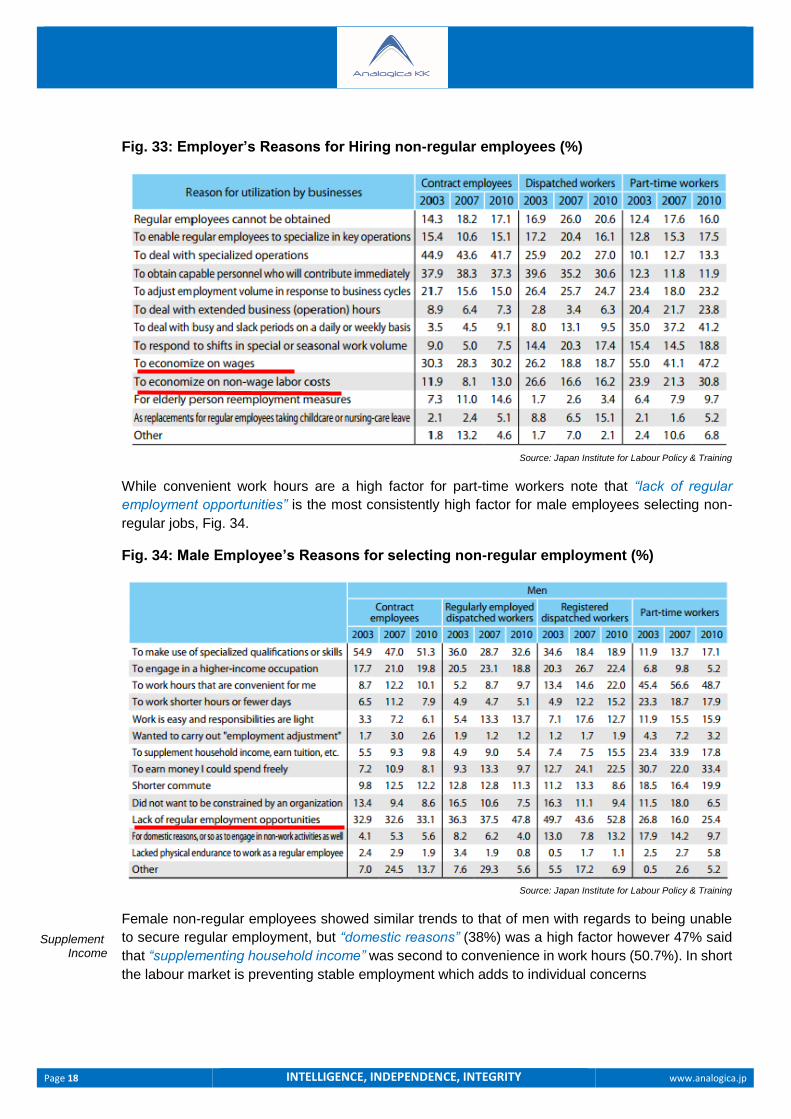
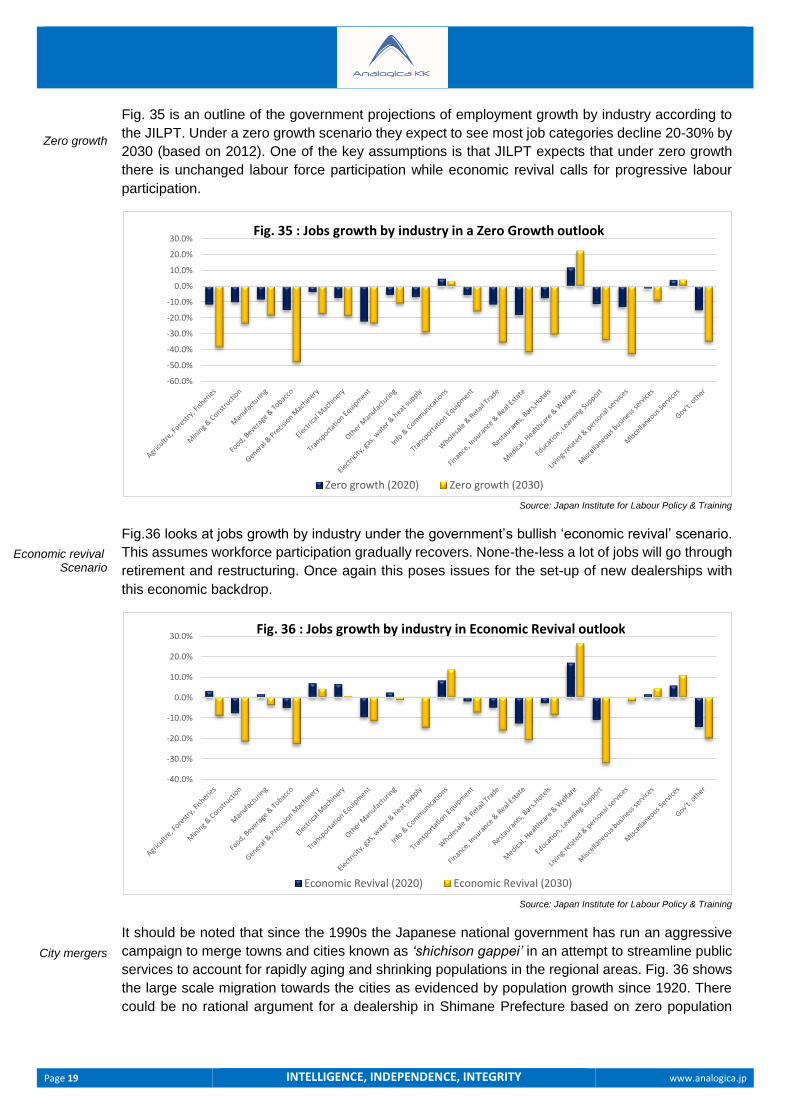
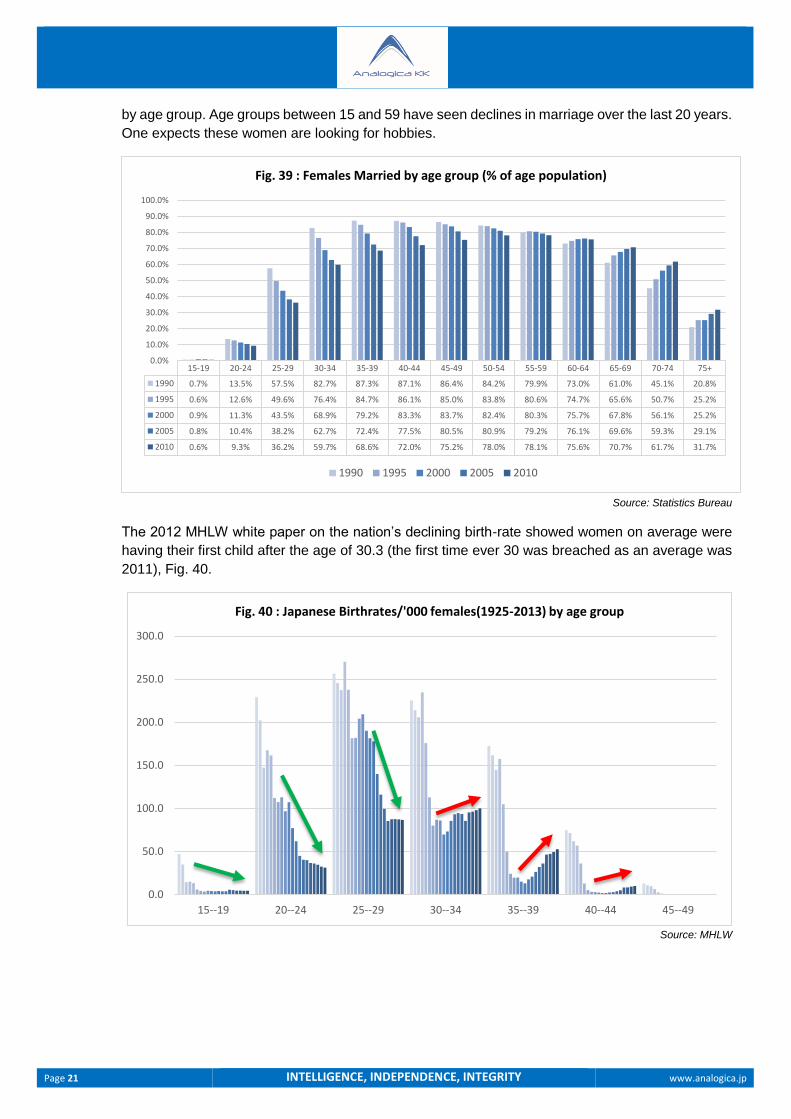