Review of side and underrun guard regulations and exemptions
Published Project ReportPPR517
Rear underrun protection for heavy goods vehicles: the potential effects of changes to the minimum technical requirements
R Minton and T Robinson


Transport Research Laboratory
PUBLISHED PROJECT REPORT PPR517
Rear underrun protection for heavy goods vehicles The potential effects of changes to the minimum technical requirements
by R Minton & T Robinson (TRL)
Prepared for: Project Record: S0601N7
The Heavy Vehicle Crash Injury Study (HVCIS)
Client: Department for Transport, Transport Technology and Standards division, Commercial Vehicles and Regulation branch
Copyright Transport Research Laboratory August 2010
This Published Report has been prepared for Department for Transport. Published Project Reports are written primarily for the Client rather than for a general audience and are published with the Client’s approval.
The views expressed are those of the author(s) and not necessarily those of Department for Transport.
Name Date
Approved
Project Manager
Brenda Watterson 01/09/2010
Technical Referee
Richard Cuerden 01/09/2010

When purchased in hard copy, this publication is printed on paper that is FSC (Forest Stewardship Council) registered and TCF (Totally Chlorine Free) registered.
Published Project Report
TRL i PPR517
Contents
Executive summary iii
1 Introduction 1
2 Background 3
3 Analysis of HVCIS data 4
4 What regulatory standards are required to prevent excessive underrun? 10
5 Discussion 12
6 Conclusions 13
Acknowledgements 14
References 14

Published Project Report
TRL ii PPR517
Published Project Report
TRL iii PPR517
Executive summary
Background
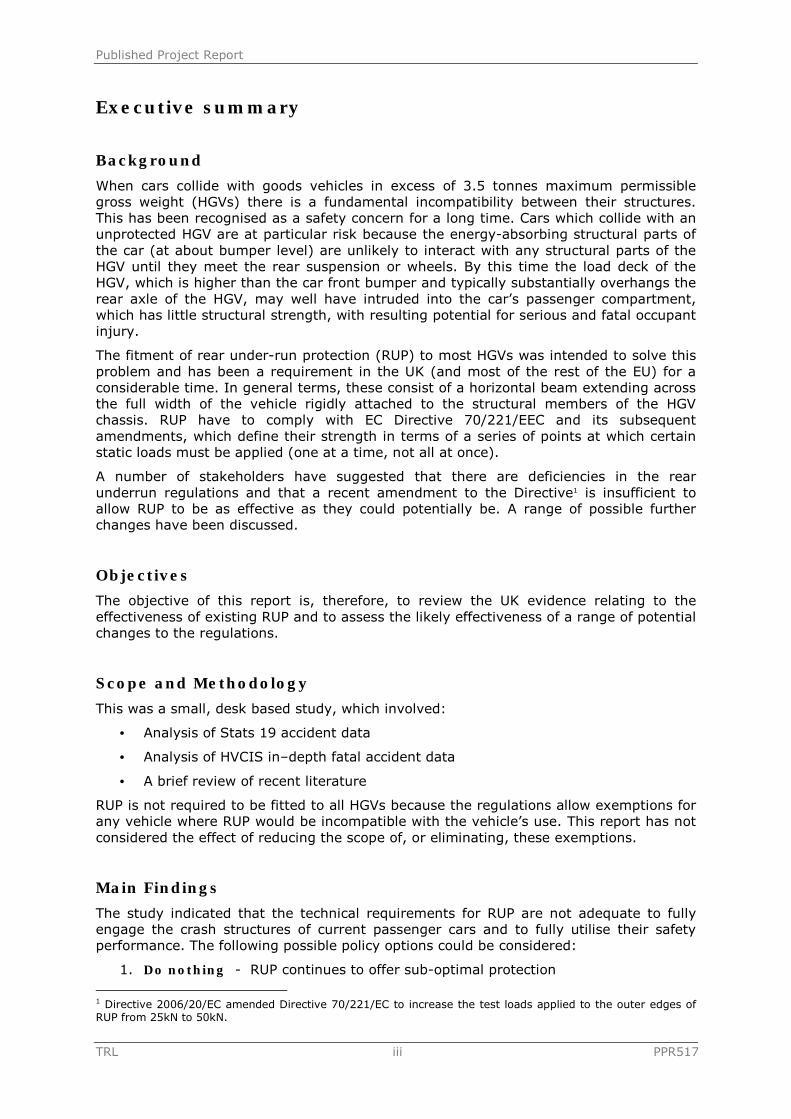
When cars collide with goods vehicles in excess of 3.5 tonnes maximum permissible gross weight (HGVs) there is a fundamental incompatibility between their structures. This has been recognised as a safety concern for a long time. Cars which collide with an unprotected HGV are at particular risk because the energy-absorbing structural parts of the car (at about bumper level) are unlikely to interact with any structural parts of the HGV until they meet the rear suspension or wheels. By this time the load deck of the HGV, which is higher than the car front bumper and typically substantially overhangs the rear axle of the HGV, may well have intruded into the car’s passenger compartment, which has little structural strength, with resulting potential for serious and fatal occupant injury.
The fitment of rear under-run protection (RUP) to most HGVs was intended to solve this problem and has been a requirement in the UK (and most of the rest of the EU) for a considerable time. In general terms, these consist of a horizontal beam extending across the full width of the vehicle rigidly attached to the structural members of the HGV chassis. RUP have to comply with EC Directive 70/221/EEC and its subsequent amendments, which define their strength in terms of a series of points at which certain static loads must be applied (one at a time, not all at once).
A number of stakeholders have suggested that there are deficiencies in the rear underrun regulations and that a recent amendment to the Directive1 is insufficient to allow RUP to be as effective as they could potentially be. A range of possible further changes have been discussed.
Objectives
The objective of this report is, therefore, to review the UK evidence relating to the effectiveness of existing RUP and to assess the likely effectiveness of a range of potential changes to the regulations.
Scope and Methodology
This was a small, desk based study, which involved:
• Analysis of Stats 19 accident data
• Analysis of HVCIS in–depth fatal accident data
• A brief review of recent literature
RUP is not required to be fitted to all HGVs because the regulations allow exemptions for any vehicle where RUP would be incompatible with the vehicle’s use. This report has not considered the effect of reducing the scope of, or eliminating, these exemptions.
Main Findings
The study indicated that the technical requirements for RUP are not adequate to fully engage the crash structures of current passenger cars and to fully utilise their safety performance. The following possible policy options could be considered:
1. Do nothing - RUP continues to offer sub-optimal protection
1 Directive 2006/20/EC amended Directive 70/221/EC to increase the test loads applied to the outer edges of RUP from 25kN to 50kN.
Published Project Report
TRL iv PPR517
2. Increase the cross-member height - This would improve the structural interaction between vehicles, which would have the effect of reducing the chance of intrusion where RUP did not fail but increasing the chance of RUP failure.
3. Reduce the ground clearance – A reduction to 400mm would also improve structural interaction with similar effects to option 2; potential reductions in intrusion set against potential increases in the incidence of RUP failure.
4. Implement both the geometric changes relating to cross-member height and ground clearance – The potential reductions in intrusions and increases in failure risks identified in options 2 & 3 would be greater if both options were implemented.
5. Increase the test loads – An increase to a 300kN distributed load would reduce the likelihood of RUP failure. However, the benefits may be limited where the ground clearance remained at the maximum allowed by legislation.
6. Implement the geometric changes and increase the test loads – This option would provide both improved geometric interaction and a stable structure to allow the safety performance of the passenger car to be fully utilised.
Published Project Report
TRL 1 PPR517
1 Introduction When cars collide with goods vehicles in excess of 3.5 tonnes maximum permissible gross weight (HGVs) there is a fundamental incompatibility between their structures. This has been recognised as a safety concern for a long time. Cars which collide with an unprotected HGV are at particular risk because the energy-absorbing structural parts of the car (at about bumper level) are unlikely to interact with any structural parts of the HGV until they meet the rear suspension or wheels. By this time the load deck of the HGV, which is higher than the car front bumper and typically substantially overhangs the rear axle of the HGV, may well have intruded into the car’s passenger compartment, which has little structural strength, with resulting potential for serious and fatal occupant injury.
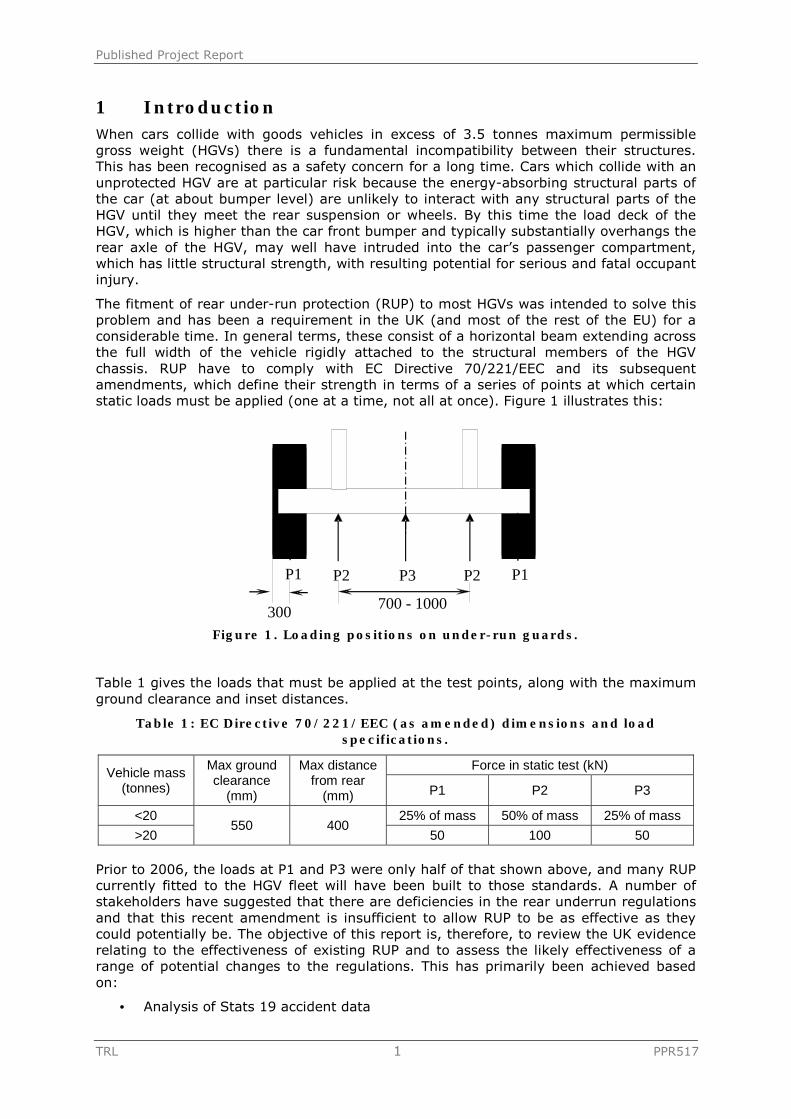
The fitment of rear under-run protection (RUP) to most HGVs was intended to solve this problem and has been a requirement in the UK (and most of the rest of the EU) for a considerable time. In general terms, these consist of a horizontal beam extending across the full width of the vehicle rigidly attached to the structural members of the HGV chassis. RUP have to comply with EC Directive 70/221/EEC and its subsequent amendments, which define their strength in terms of a series of points at which certain static loads must be applied (one at a time, not all at once). Figure 1 illustrates this:
Figure 1. Loading positions on under-run guards.
Table 1 gives the loads that must be applied at the test points, along with the maximum ground clearance and inset distances.
Table 1: EC Directive 70/221/EEC (as amended) dimensions and load specifications.
Vehicle mass(tonnes)
Max groundclearance
(mm)
Max distancefrom rear
(mm)
Force in static test (kN)
P1 P2 P3
<20550 400
25% of mass 50% of mass 25% of mass
>20 50 100 50
Prior to 2006, the loads at P1 and P3 were only half of that shown above, and many RUP currently fitted to the HGV fleet will have been built to those standards. A number of stakeholders have suggested that there are deficiencies in the rear underrun regulations and that this recent amendment is insufficient to allow RUP to be as effective as they could potentially be. The objective of this report is, therefore, to review the UK evidence relating to the effectiveness of existing RUP and to assess the likely effectiveness of a range of potential changes to the regulations. This has primarily been achieved based on:
• Analysis of Stats 19 accident data
300 700 - 1000
P1 P2 P3 P2 P1

Published Project Report
TRL 2 PPR517
• Analysis of HVCIS in–depth fatal accident data
• A brief review of recent literature
RUP is not required to be fitted to all HGVs because the regulations allow exemptions for any vehicle where RUP would be incompatible with the vehicle’s use. This report has not considered the effect of reducing the scope of, or eliminating, these exemptions.

Published Project Report
TRL 3 PPR517
2 Background The number of licensed HGVs on British roads2 increased by about 18%, from 441,000 to 519,000 between 1998 and 2008, although HGV traffic only increased by 6%, from 27.7 billion vehicle kilometres to 29.4 billion vehicle kilometres between 1998 and 2007, before falling back to 28.7 billion vehicle kilometres in 2008, likely to be a result of the recent economic climate. Meanwhile, car traffic has increased by about 8%, from 370.6 to 401.7 billion vehicle kilometres from 1998 to 2008 (all figures from RRCGB 2008). Other things being equal, the increasing traffic levels offer clear potential for increasing numbers of accidents involving cars and HGVs.
In 2008, out of 111,924 accidents involving a car and at least one other vehicle, 4,242 (3.8%) involved a car and a HGV. However, these accidents accounted for 8.9% (112 out of 1,257) of the car occupants killed in such crashes (RRCGB 2008), indicating that impacts with HGVs are much more dangerous for car occupants than impacts with other vehicles. Table 2 is based on Stats19 data from 2005 to 2008 inclusive, and examines the influence of impact configuration on car occupant injury severity (taxis are included with cars in this table).
Table 2. HGVs by First Point of Impact and Maximum Severity in Impacting Car (S19, 2005-08).
First pointof impacton HGV
Maximum injury severity in impacting car Totals
Fatal Serious Slight No injury
Num % Num % Num % Num % Num %
No impact 9 2.7 19 5.8 254 77.4 46 14.0 328 100
Front 397 3.4 1025 8.9 9270 80.5 830 7.2 1152
2 100
Back 112 3.3 347 10.3 2532 75.3 370 11.0 3361 100
Offside 62 1.2 416 8.0 4380 84.0 356 6.8 5214 100
Nearside 31 1.0 145 4.7 2690 87.0 226 7.3 3092 100
Unknown 0 0.0 0 0.0 2 66.7 1 33.3 3 100
Totals 611 2.6 1952 8.3 1912
881.3 1829 7.8 2352
0100
Rear impacts to the HGV constitute 14.3% of all car/HGV impacts and 18.3% of fatal car/HGV impacts. The vast majority of these are likely to be frontal impacts for the cars involved, although some could involve cars sliding sideways or even rear-end-on into the HGV. Comparing impacts with the front of the HGV to those with the rear, 12.3% of the former result in an injury severity of Killed or Seriously Injured (KSI) to the car occupants, while 13.6% of impacts to the rear result in KSIs. It should be noted that, in many HGV frontal impacts, the vehicles will have been travelling in opposite directions prior to impact, whereas a typical rear impact scenario would see the HGV stationary or moving in the same direction as the car. Thus, the higher KSI rate in rear impacts occurs despite the likelihood of a lower closing speed or change in velocity for the car in these impacts.
2 Note that this is registrations by body type HGV and will include some vehicles used privately and others classified as “other motor vehicles” in accident data collection. When registrations are considered according to taxation class the equivalent figures are 412,000 in 1998, 446,000 in 2007 and 436,000 in 2008, an increase from 1998 to 2008 of just 6%, which is much closer to the increase in traffic (3.6%). These figures are from Transport Statistics Great Britain, 2009.
Published Project Report
TRL 4 PPR517
3 Analysis of HVCIS data The HVCIS database contains data coded from police fatal accident reports, supplied to TRL on a regular basis by many of the police forces in England and Wales. The collection of the reports is funded by the DfT, and some 28,000 reports are currently held, dated from 1993 onwards. The HVCIS database currently (Release 2k) contains details of 3,788 accidents involving HGVs, OMVs, LGVs Buses/coaches/minibuses and agricultural vehicles, which occurred between 1995 and 2008 inclusive. Note that all the accidents in the database involved at least one fatality, so they represent the most severe end of the accident spectrum.
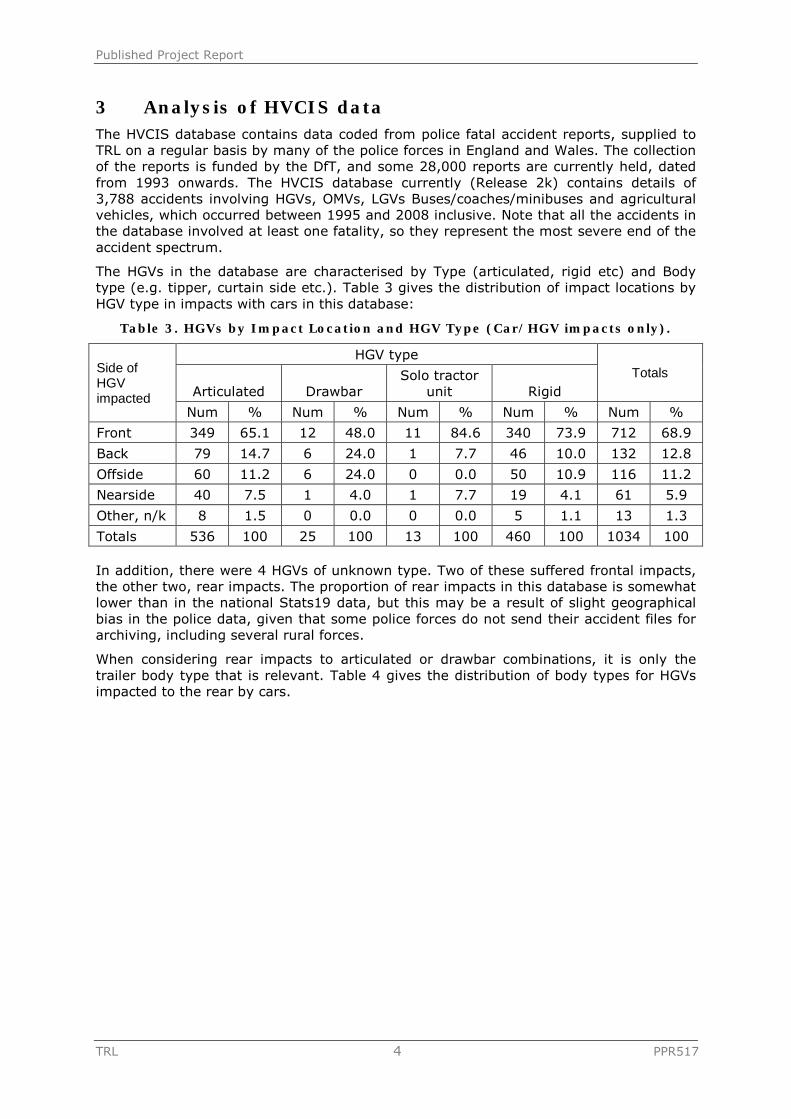
The HGVs in the database are characterised by Type (articulated, rigid etc) and Body type (e.g. tipper, curtain side etc.). Table 3 gives the distribution of impact locations by HGV type in impacts with cars in this database:
Table 3. HGVs by Impact Location and HGV Type (Car/HGV impacts only).
Side ofHGVimpacted
HGV type Totals
Articulated Drawbar Solo tractor
unit Rigid
Num % Num % Num % Num % Num %
Front 349 65.1 12 48.0 11 84.6 340 73.9 712 68.9
Back 79 14.7 6 24.0 1 7.7 46 10.0 132 12.8
Offside 60 11.2 6 24.0 0 0.0 50 10.9 116 11.2
Nearside 40 7.5 1 4.0 1 7.7 19 4.1 61 5.9
Other, n/k 8 1.5 0 0.0 0 0.0 5 1.1 13 1.3
Totals 536 100 25 100 13 100 460 100 1034 100
In addition, there were 4 HGVs of unknown type. Two of these suffered frontal impacts, the other two, rear impacts. The proportion of rear impacts in this database is somewhat lower than in the national Stats19 data, but this may be a result of slight geographical bias in the police data, given that some police forces do not send their accident files for archiving, including several rural forces.
When considering rear impacts to articulated or drawbar combinations, it is only the trailer body type that is relevant. Table 4 gives the distribution of body types for HGVs impacted to the rear by cars.

Published Project Report
TRL 5 PPR517
Table 4. HGVs by Body Type and HGV Type (Car/HGV rear impacts only).
HGV body type
HGV type TotalsArticulated
(semi-trailer) Rigid Drawbar (trailer)
Num % Num % Num % Num %
Box 20 25.0 15 32.6 1 16.7 36 27.4
Car transporter 1 1.3 0.0 0.0 1 0.8
Container 5 6.3 0.0 0.0 5 3.8
Curtain side 28 35.0 3 6.5 1 16.7 32 24.4
Flat/drop side 7 8.8 8 17.4 2 33.3 17 13.0
Livestock 0.0 2 4.3 0.0 2 1.5
Skip carrier 0.0 3 6.5 1 16.7 4 3.1
Tanker 5 6.3 1 2.2 0.0 6 4.6
Tipper 3 3.8 11 23.9 0.0 14 10.7
Other 6 7.5 1 2.2 1 16.7 8 6.1
N/k 4 5.0 2 4.3 0.0 6 4.6
Totals 80 100 46 100 6 100 131 100
Where known, more than 60% of the HGVs are articulated. Semi-trailer body types are dominated by box and curtain-sided bodies, both of which should normally be fitted with rear under-run guards. Tippers, which are often not fitted with rear underrun protection through claiming an exemption from the regulations, constitute a minority of articulated vehicles in this subset, although they represent the second most common type among rigid HGVs.
Table 5. HGVs by Body Type and Under-run Guard Fitment (Car/HGV rear impacts only).
HGV bodytype
Under-run guard fitment Totals Fitted as
% ofKnown
Fitted Not fitted Not known
Num % Num % Num % Num %
Box 32 88.9 2 5.6 2 5.6 36 100 94.1
Car transporter
0 0.0 1 100.0
0 0.0 1 100 0.0
Container 5
100.0
0 0.0 0 0.0 5 100 100.0
Curtain side 27 84.4 0 0.0 5 15.6 32 100 100.0
Flat/drop side 14 82.4 3 17.6 0 0.0 17 100 82.4
Livestock 2100.
0 0 0.0 0 0.0 2 100 100.0
Skip carrier 0 0.0 3 75.0 1 25.0 4 100 0.0
Tanker 2 33.3 2 33.3 2 33.3 6 100 50.0
Tipper 2 14.3 10 71.4 2 14.3 14 100 16.7
Other 3 37.5 3 37.5 2 25.0 8 100 50.0
N/k 6100.
0 0 0.0 0 0.0 6 100 100.0
Totals 93 71.0 24 18.3 14 10.7 131 100 79.5
Published Project Report
TRL 6 PPR517
Table 5 aggregates the HGV types and looks at RUP fitment as a function of body type. The single tractor unit is excluded because tractor units are not within the scope of rear underrun protection legislation. The information available in the police fatal accident reports is variable. The presence or absence of an under-run guard may be commented on in the written report, depending on how detailed the report is and whether the reporting officer thought it was relevant. If the presence of RUP is not mentioned in the report, then the fitment of RUP can often be identified from photographs. However, photographs may only be included in the reports received if there happen to be spare copies after the Coroner, solicitors or insurance companies have been supplied, although the inclusion of digital photographs in the main investigation report seems to be increasing. Finally, if photographs are present, it can happen that there is no picture of the rear of the HGV, from which to identify RUP. These factors account for the minority of cases where the fitment of RUP is not known.
Box, curtain side and flat/drop side body types dominate the distribution, and the vast majority of these are recorded as having under-run guards fitted. All Container and Livestock carrier body types have guards fitted and, together with the first three types mentioned, these account for about 70% of all the HGVs in the subset. As expected, most of the tippers, car transporters and skip carriers are recorded as not having under-run guards. Skip carriers generally have structural elements at the rear which would act to prevent under-run by an impacting car, although these can take the form of rather “crash-unfriendly” stabilisers for use when unloading.
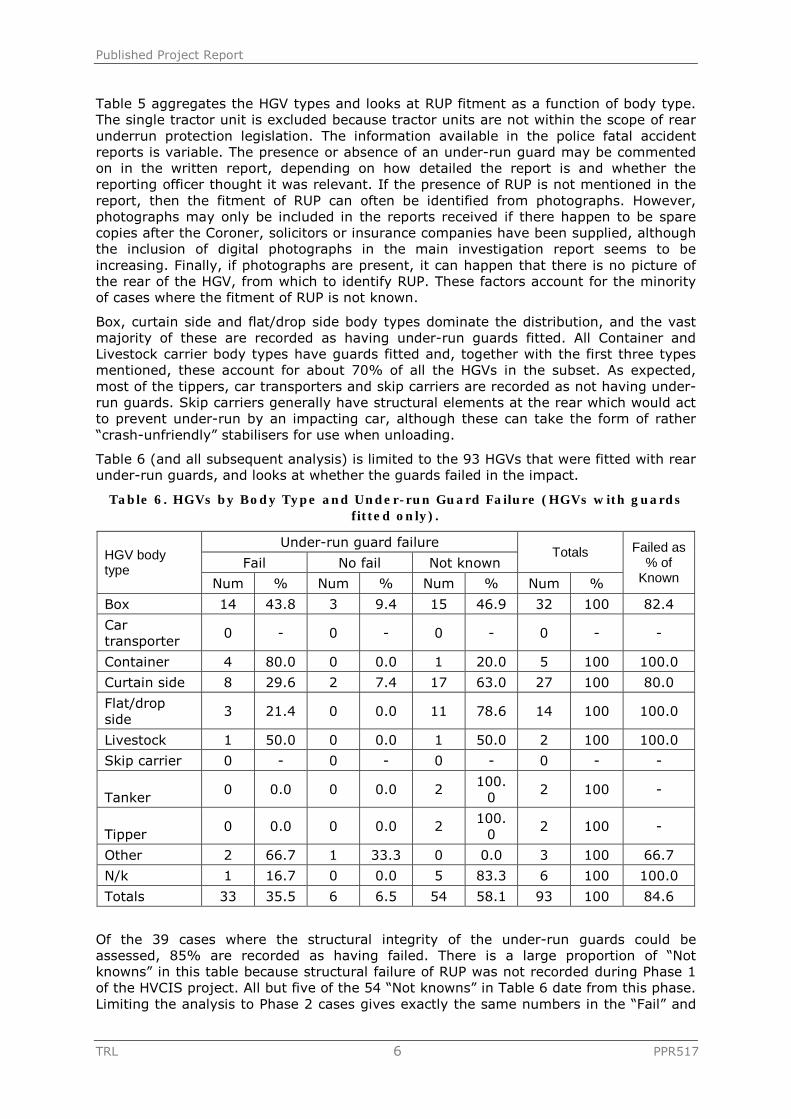
Table 6 (and all subsequent analysis) is limited to the 93 HGVs that were fitted with rear under-run guards, and looks at whether the guards failed in the impact.
Table 6. HGVs by Body Type and Under-run Guard Failure (HGVs with guards fitted only).
HGV bodytype
Under-run guard failure Totals Failed as
% ofKnown
Fail No fail Not known
Num % Num % Num % Num %
Box 14 43.8 3 9.4 15 46.9 32 100 82.4
Car transporter
0 - 0 - 0 - 0 - -
Container 4 80.0 0 0.0 1 20.0 5 100 100.0
Curtain side 8 29.6 2 7.4 17 63.0 27 100 80.0
Flat/drop side
3 21.4 0 0.0 11 78.6 14 100 100.0
Livestock 1 50.0 0 0.0 1 50.0 2 100 100.0
Skip carrier 0 - 0 - 0 - 0 - -
Tanker 0 0.0 0 0.0 2 100.
02 100 -
Tipper 0 0.0 0 0.0 2 100.
02 100 -
Other 2 66.7 1 33.3 0 0.0 3 100 66.7
N/k 1 16.7 0 0.0 5 83.3 6 100 100.0
Totals 33 35.5 6 6.5 54 58.1 93 100 84.6
Of the 39 cases where the structural integrity of the under-run guards could be assessed, 85% are recorded as having failed. There is a large proportion of “Not knowns” in this table because structural failure of RUP was not recorded during Phase 1 of the HVCIS project. All but five of the 54 “Not knowns” in Table 6 date from this phase. Limiting the analysis to Phase 2 cases gives exactly the same numbers in the “Fail” and
Published Project Report
TRL 7 PPR517
“No fail” columns. Thus, if the analysis were restricted only to phase 2 cases where this information was recorded, the analysis would show that in 11% of cases rear underrun failure was not known. The 89% of cases where structural integrity was known would be divided 85% failed, 15% did not fail.
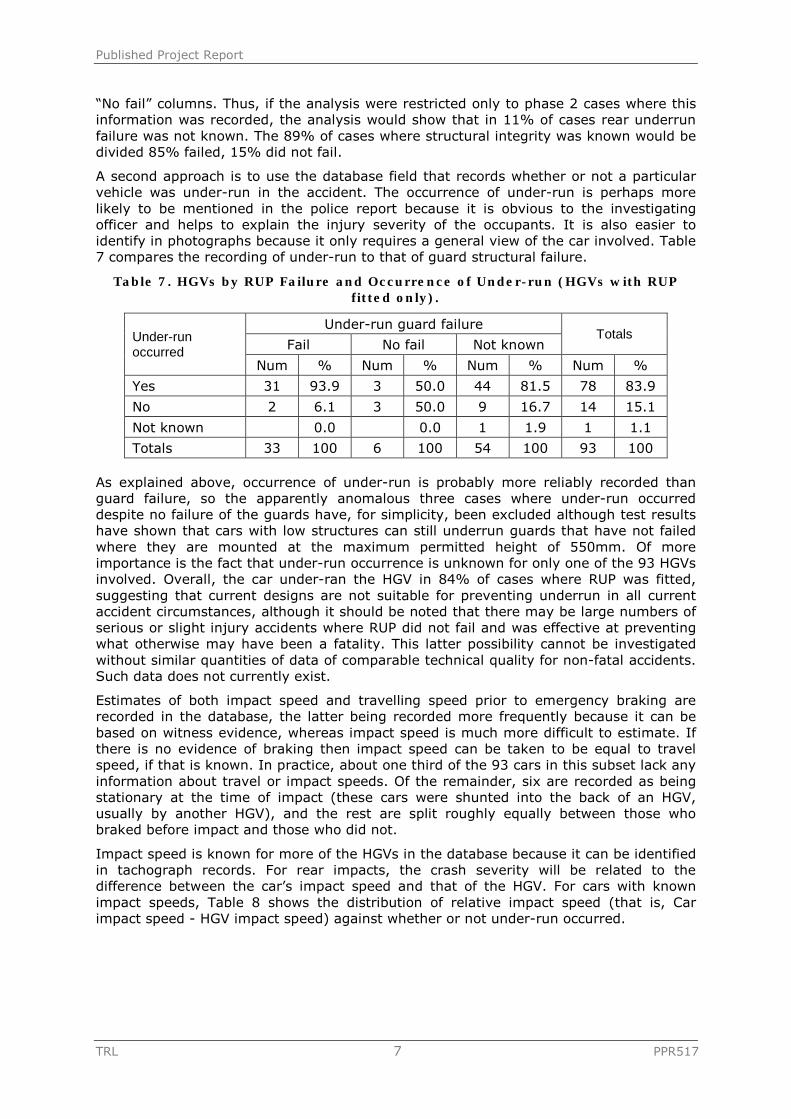
A second approach is to use the database field that records whether or not a particular vehicle was under-run in the accident. The occurrence of under-run is perhaps more likely to be mentioned in the police report because it is obvious to the investigating officer and helps to explain the injury severity of the occupants. It is also easier to identify in photographs because it only requires a general view of the car involved. Table 7 compares the recording of under-run to that of guard structural failure.
Table 7. HGVs by RUP Failure and Occurrence of Under-run (HGVs with RUP fitted only).
Under-runoccurred
Under-run guard failure Totals
Fail No fail Not known
Num % Num % Num % Num %
Yes 31 93.9 3 50.0 44 81.5 78 83.9
No 2 6.1 3 50.0 9 16.7 14 15.1
Not known 0.0 0.0 1 1.9 1 1.1
Totals 33 100 6 100 54 100 93 100
As explained above, occurrence of under-run is probably more reliably recorded than guard failure, so the apparently anomalous three cases where under-run occurred despite no failure of the guards have, for simplicity, been excluded although test results have shown that cars with low structures can still underrun guards that have not failed where they are mounted at the maximum permitted height of 550mm. Of more importance is the fact that under-run occurrence is unknown for only one of the 93 HGVs involved. Overall, the car under-ran the HGV in 84% of cases where RUP was fitted, suggesting that current designs are not suitable for preventing underrun in all current accident circumstances, although it should be noted that there may be large numbers of serious or slight injury accidents where RUP did not fail and was effective at preventing what otherwise may have been a fatality. This latter possibility cannot be investigated without similar quantities of data of comparable technical quality for non-fatal accidents. Such data does not currently exist.
Estimates of both impact speed and travelling speed prior to emergency braking are recorded in the database, the latter being recorded more frequently because it can be based on witness evidence, whereas impact speed is much more difficult to estimate. If there is no evidence of braking then impact speed can be taken to be equal to travel speed, if that is known. In practice, about one third of the 93 cars in this subset lack any information about travel or impact speeds. Of the remainder, six are recorded as being stationary at the time of impact (these cars were shunted into the back of an HGV, usually by another HGV), and the rest are split roughly equally between those who braked before impact and those who did not.
Impact speed is known for more of the HGVs in the database because it can be identified in tachograph records. For rear impacts, the crash severity will be related to the difference between the car’s impact speed and that of the HGV. For cars with known impact speeds, Table 8 shows the distribution of relative impact speed (that is, Car impact speed - HGV impact speed) against whether or not under-run occurred.

Published Project Report
TRL 8 PPR517
Table 8. Cars by Relative Impact Speed and Occurrence of Under-run.
Relative impactspeed (mile/h)
Under-run occurred
Yes No
0 3 4
1 - 10 0 1
11 - 20 5 1
21 - 30 5 2
31 - 40 3 1
41 - 50 5 0
51 - 60 6 1
61 - 70 2 0
71 - 80 2 0
>80 0 0
Totals 31 10
Total non-shunted
28 6
Median speed 42 30
Relative impact speed could only be determined for 31 of the 78 under-run cases and 10 of the 14 non-under-run cases. No conclusions regarding the effectiveness of RUP can be drawn from the seven cases with zero relative impact speed because, in all these cases, the car was shunted from behind by another HGV and so had the mass of this other HGV forcing it forwards. The median speeds indicated in Table 8 exclude these irrelevant cases, and are therefore based on 28 cases (under-run) and 6 cases (non-under-run) only. As might be expected, the median speed in the under-run cases is higher than that where no under-run occurred, although the small sample size for the latter group reduces the reliability of this result. In the single case where under-run was not known, all vehicle speeds were also unknown, so the case does not appear in Table 8. Note that all estimates of car impact speeds should be regarded as indicative only.
Of the remaining 47 under-run cases in the subset, 28 had no information on either travel or impact speed for the car, 16 had travel speeds only estimated and three had both travel and impact speed estimated for the car, but no impact speed estimate for the HGV. It can be assumed that there was evidence of braking in the 16 cases with car travel speed only estimated because otherwise impact speed would have been recorded as being equal to travel speed. Subtracting the speed of the HGV from these travel speeds, we obtain a median relative speed of 54mile/h (range 35 to 75mile/h).
In order to extract more useful information from the data, an attempt to deduce a likely impact speed for the 16 cases with travel speed only known has been made. Speed loss on braking is known for ten of the 34 non-shunted cases in Table 8 (including both under-run and non-under-run cases), and the average speed lost for these vehicles is about 20mile/h. Applying this to the median travel speed where speed loss due to braking is not known (16 cases, 54mile/h median relative travel speed) gives a median relative impact speed after braking of about 34mile/h. This compares well with the median speed of 42mile/h for the 28 non-shunted under-run cases in Table 8, this being dominated by cars that did not brake. Overall, we have a sample of 44 (28 + 16) non-stationary cars with estimated (directly or indirectly) relative impact speeds which under-ran HGVs at a median speed of between 34 and 42mile/h. The estimated median relative impact speed for the six non-stationary cars that did not under-run was 30mile/h.
Modern cars are designed such that when they are subjected to a 64 km/h test with an offset deformable barrier in a EuroNCAP test (intended to represent a head on collision

Published Project Report
TRL 9 PPR517
with an identical vehicle with a 50% overlap) they protect their occupants to the extent that the majority of healthy, belted adult occupants would survive. This test is nominally equivalent to a test with a rigid wall at 56 km/h (based on equivalent energy speed for a car of average mass). The original intention of RUP was to provide a rigid barrier that made a collision with the rear of a truck comparable to a collision with a solid wall. This analysis strongly suggests that current RUP are failing to achieve this objective at collision speeds where modern cars would be able to protect their occupants. Improving the design of RUP such that they did not fail and did prevent underrun at these collision speeds would be expected to prevent a significant proportion of the fatalities currently recorded.
Published Project Report
TRL 10 PPR517
4 What regulatory standards are required to prevent excessive underrun?
Smith et al (2004) reviewed current and proposed regulations and standards for under-run protection from a number of countries world-wide. The standard test forces were compared with load cell data from crash tests conducted by TRL and from US NCAP tests. Crash tests into standard and modified under-run guards were also reviewed. Smith et al concluded that, even if all the current regulatory test loads were to be applied at the same time, the total force on the guard would be about 50kN less than the maximum force exerted on a single row of load cells in a rigid barrier test at 56km/h. They also found that the ground clearance of the guards was too high to allow the RUP to interact with the structural members of a number of typical European cars.
Numerical simulation carried out as part of VC-Compat (Smith and Knight, 2006)) indicated that a RUP that is minimally compliant with respect to strength (pre-2006) failed when impacted by a car regardless of the ground clearance or cross-member height. This suggests that changes to the geometry alone are unlikely to produce improved real-world performance of RUP. Simulation of a RUP that met the strength and ground clearance requirements for front underrun (stiffer and lower than the 2006 amendment for RUP) but with a cross-member height of 200mm was almost effective at an impact speed of 56km/h, but just failed to meet the deformation criteria. This indicates that changes to the stiffness of the RUP need to exceed that currently prescribed for FUP if the geometric requirements are to be similar to that RUP which was simulated.
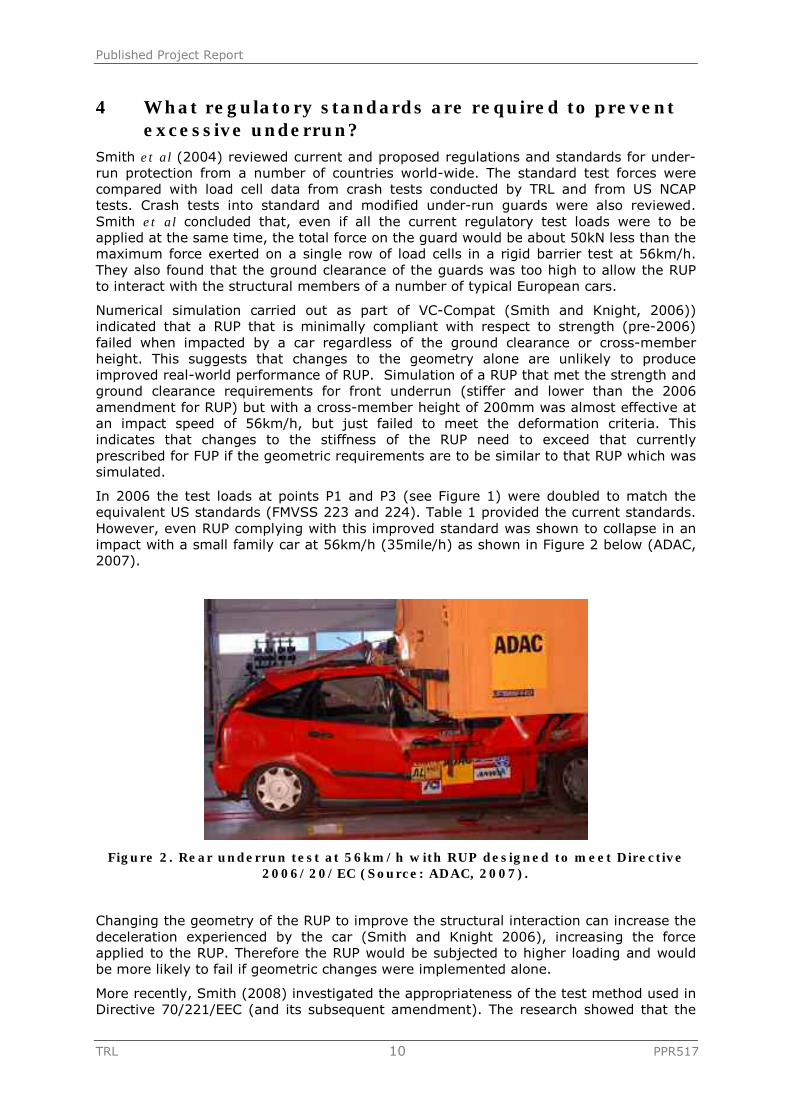
In 2006 the test loads at points P1 and P3 (see Figure 1) were doubled to match the equivalent US standards (FMVSS 223 and 224). Table 1 provided the current standards. However, even RUP complying with this improved standard was shown to collapse in an impact with a small family car at 56km/h (35mile/h) as shown in Figure 2 below (ADAC, 2007).
Figure 2. Rear underrun test at 56km/h with RUP designed to meet Directive 2006/20/EC (Source: ADAC, 2007).
Changing the geometry of the RUP to improve the structural interaction can increase the deceleration experienced by the car (Smith and Knight 2006), increasing the force applied to the RUP. Therefore the RUP would be subjected to higher loading and would be more likely to fail if geometric changes were implemented alone.
More recently, Smith (2008) investigated the appropriateness of the test method used in Directive 70/221/EEC (and its subsequent amendment). The research showed that the
Published Project Report
TRL 11 PPR517
existing regulatory test method and limit values are not representative of a 75% overlap, 56 km/h collision between a small family car and a truck equipped with a minimally compliant RUP device. The standard of current RUP is, therefore, failing to exploit fully the potential of modern cars to protect their occupants. The research proposed a test method that applies a total force of 300kN, three times the current maximum test load, evenly distributed at three test points along the cross-member. This research assumed that the cross-member height would be 200mm and the ground clearance would be 400mm.

Published Project Report
TRL 12 PPR517
5 Discussion The analysis of accident data clearly shows that the rear underrun protection fitted to trucks failed in the vast majority of accidents where cars collided with the rear and one or more car occupants were killed. Most such collisions also involved the car under-running the truck, the phenomenon that RUP was intended to prevent. About half occurred at speeds where the secondary safety performance of new cars leads to an expectation that an equivalent collision with a rigid fixed object would be survivable without serious injury for a normal, healthy adult wearing a seat belt. This data clearly suggests that, while it may have reduced the incidence of fatalities in collisions between the front of cars and the rear of trucks, it is not preventing as many fatalities as would be possible given the safety performance of modern cars.
The road freight industry is highly competitive and rear underrun protection adds to unladen mass, reducing productivity, and increases capital cost. Thus, if no changes are made to the rear underrun legislation to ensure a level playing field commercially, it is unlikely that improvements will be implemented voluntarily and RUP will continue to perform sub-optimally.
The various research reviewed in earlier sections shows that there are a number of areas of RUP design that could potentially be changed and these changes could be considered as potential future regulatory options.
Firstly, increasing the cross-member height would be expected to improve the interaction of the RUP with the crash structure of the car. Provided the ground clearance was sufficiently low and the RUP did not fail during impact, this would reduce the risk of intrusion into the passenger car because more energy could be dissipated in the cars frontal structures. If the ground clearance was too high then increasing the cross-member height would have little effect because the cross member would still not interact properly with the energy absorbing frontal structure of the car. However, increasing structural interaction means a greater quantity of the front of the car being crushed and, therefore, a larger crush force. This increased force must be provided by the RUP and could lead to an increase in the likelihood of the RUP failing.
Reducing the maximum ground clearance to 400mm would increase the chance that the crash structure of the car will interact with the RUP. Provided the RUP does not fail, then this would also reduce the likelihood of intrusion into the passenger compartment of the car. However, as for the increased cross member height, improving the structural interaction could increase the loading on the RUP resulting in failure of the RUP at a lower speed than would be likely with a higher ground clearance (assuming stiffness remains the same).
Implementing both the geometric changes relating to minimum cross-member height and maximum ground clearance will ensure structural interaction for the largest range of vehicle types. However, if this is implemented without increasing the strength requirements then it is very likely to increase the number of in-service failures, potentially at lower impact speeds.
Increasing the test loads to a 300kN load distributed across all three existing test points would reduce the likelihood of the RUP failing during a collision. However, there would be no improvement in the structural interaction where the ground clearance remained at the maximum allowed by existing legislation, thus limiting the potential benefits of such a change.
Implementing both of the geometric changes and increasing the test loads would provide both improved geometric interaction and a stable structure to allow the safety performance of the passenger car to be fully utilised.

Published Project Report
TRL 13 PPR517
6 Conclusions The research and accident data described above indicate that the technical requirements for RUP are not adequate to fully engage the crash structures of current passenger cars and to fully utilise the safety performance of the vehicles. The following possible policy options could be considered:
7. Do nothing - RUP continues to offer sub-optimal protection
8. Increase the cross-member height - This would improve the structural interaction between vehicles, which would have the effect of reducing the chance of intrusion where RUP did not fail but increasing the chance of RUP failure.
9. Reduce the ground clearance – A reduction to 400mm would also improve structural interaction with similar effects to option 2; potential reductions in intrusion set against potential increases in the incidence of RUP failure.
10. Implement both the geometric changes relating to cross-member height and ground clearance – The potential reductions in intrusions and increases in failure risks identified in options 2 & 3 would be greater if both options were implemented.
11. Increase the test loads – An increase to a 300kN distributed load would reduce the likelihood of RUP failure. However, the benefits may be limited where the ground clearance remained at the maximum allowed by legislation.
12. Implement the geometric changes and increase the test loads – This option would provide both improved geometric interaction and a stable structure to allow the safety performance of the passenger car to be fully utilised.
Published Project Report
TRL 14 PPR517
Acknowledgements The work described in this report was carried out in the Accident Research Group and Vehicle Engineering Group of the Transport Research Laboratory. The authors are grateful to Richard Cuerden who carried out the technical review and auditing of this report.
References ADAC (2007). Lkw-Unterfahrschutz im Crashtest. retrieved fromhttp://www.adac.de/Tests/Crash_Tests/Unterfahrschutz/default.asp?ComponentID=165159&SourcePageID=8645 2007. Supplemented by ADAC: Test report on rear impact with HGV. Unpublished testreport kindly supplied by ADAC for use in the project, available on direct personal application toADAC only.
DfT (2009). Reported Road Casualties Great Britain, 2008. DfT publication.
Smith T, Couper G and Knight I (2004). Analysing and Improving the Performance of Rear Under-run Protection Devices. Safety of Commercial Vehicles, 20-21 Oct, 2004, Neumunster, Germany.
Smith T and Knight I (2006). VC-Compat: Development of improved rear underrun protection. TRLPublished Project Report PPR120, TRL, Wokingham UK, 2006.
Smith T (2008). Rear Underrun Protection - A Revised Test Procedure Based on Research Carriedout for EC Building on VC-Compat Results. Safety of Commercial Vehicles, 9-10 Oct, 2008,Neumunster, Germany.

TRLCrowthorne House, Nine Mile RideWokingham, Berkshire RG40 3GAUnited Kingdom
T: +44 (0) 1344 773131F: +44 (0) 1344 770356E: [email protected]: www.trl.co.uk
ISSN 0968-4093
Price code: 2X
Published by IHSWilloughby Road, BracknellBerkshire RG12 8FBUnited Kingdom
T: +44 (0) 1344 328038F: +44 (0) 1344 328005E: [email protected]: http://emeastore.ihs.com PP
R51
7
Rear underrun protection for heavy goods vehicles: the potential effects of changes to the minimum technical requirements
When cars collide with goods vehicles in excess of 3.5 tonnes maximum permissible gross weight (HGVs) there is a fundamental incompatibility between their structures. This has been recognised as a safety concern for a long time as the energy-absorbing structural parts of the car (at about bumper level) are unlikely to interact with any structural parts of the HGV until they meet the rear suspension or wheels. By this time the load deck of the HGV, which is higher than the car front bumper and typically substantially overhangs the rear axle of the HGV, may well have intruded into the car’s passenger compartment, which has little structural strength, with resulting potential for serious and fatal occupant injury.
The fitment of rear underrun protection (RUP) to most HGVs was intended to solve this problem and has been a requirement in the UK (and most of the rest of the EU) for a considerable time.
This study undertook a review of the UK evidence relating to the effectiveness of existing RUP. The study concluded that the technical requirements for RUP are not adequate to fully engage the crash structures of current passenger cars and to fully utilise their safety performance. A number of policy options were proposed for consideration.
Other titles from this subject area
PPR291 Assessment of the Q dummy in the EC CHILD project. C Visvikis, M Le Claire, S Adams, J Carroll et al. 2007
PPR310 Adaptive vehicle structures for secondary safety. A Thompson, M Edwards, O Goodacre, G Coley et al. 2008
PPR260 Compatibility and frontal impact test procedures – additional work to support VC-COMPAT: final report. H Davies, M J Edwards and A Thompson. 2008
PPR211 Low-energy rear impact tests using RID3D, BioRID II and Hybrid III for EEVC Working Group 12. C Willis, J Carroll and R Torcal-Serrano. 2008
PPR258 Development of improved global harmonised side impact test procedures – final report. J Ellway. 2008
PPR311 UK cost-benefit analysis: enhanced geometric requirements for vehicle head restraints. D Hynd, J A Carroll and R S Bartlett. 2008
PPR293 An assessment of the durability and reliability of typical hydraulically operated parking brakes fitted to quadricycles. C J Grover. 2007