
Realising the Right to a Basic Education in South Africa
192
Working Paper 10 The Socio-Economic Rights Monitoring Tool Realising the Right to a Basic Education in South Africa: An analysis of the content, policy effort, resource allocation and enjoyment of the constitutional right to a basic education. November 2015 Shaun Franklin and Daniel McLaren
Transcript of Realising the Right to a Basic Education in South Africa

Wo
rkin
g P
aper
10The Socio-Economic Rights
Monitoring Tool
Realising the Right to a Basic Education in South Africa:An analysis of the content, policy effort, resource allocation and enjoyment of the constitutional right to a basic education.November 2015
Shaun Franklin and Daniel McLaren


Realising the Right to a Basic Education in
South Africa:An analysis of the content, policy effort,
resource allocation and enjoyment of the constitutional right to a basic education.
November 2015
By Shaun Franklin and Daniel McLaren
Working Paper 10
The Socio-Economic Rights Monitoring ToolRecommended citation: Franklin, S and McLaren, D ‘Realising the Right to Basic Edcuation: An analysis of the content, policy effort, resource allocation and enjoyment of the constitutional right to a basic education (2015) Studies in Poverty and Inequality
Institute, Working Paper 10.
Project made possible with funding from the
ISNB number 978-0-620-68425-5

Authors:Shaun Franklin: Freelance education lawyer and expert: [email protected]
Daniel McLaren: Senior Researcher, Studies in Poverty and Inequality Institute: [email protected]
Other publications by the Socio-Economic Rights Monitoring Tool (available at www.spii.org.za):
McLaren, D, Moyo, B and Jeffery, J ‘The right to food in South Africa: An analysis of the content, policy effort, resource allocation and enjoyment of the constitutional right to food’ (2015) Studies in Poverty and Inequality Institute, Working Paper 9.
Hannah Dawson & Daniel McLaren ‘A Framework for Monitoring and Evaluating the Progressive Realisation of Socio-Economic Rights in South Africa’ (2015) Studies in Poverty and Inequality Institute.
Daniel McLaren & Busiso Moyo ‘Monitoring and Evaluating Progressive Realisation of the Right to Sufficient Food and Basic Nutrition in South Africa’ (2014) Studies in Poverty and Inequality Institute, Policy Brief 8.
Hannah Dawson ‘Public participation and citizen-based monitoring in realising socio-economic rights’ (2014) Studies in Poverty and Inequality Institute, Policy Brief 7.
Hannah Dawson & Daniel McLaren ‘Monitoring the right of access to adequate housing in South Africa’ (2014) Studies in Poverty and Inequality Institute, Working Paper 8.
Khetho Lomahoza ‘Monitoring the right to health care in South Africa’ (2013) Studies in Poverty and Inequality Institute, Policy Brief 2.
Hannah Dawson ‘Monitoring the right to social security in South Africa’ (2013) Studies in Poverty and Inequality Institute, Policy Brief 1.
Hannah Dawson, Khetho Lomahoza & Tshego Monnana ‘The right to social security and primary health care in Zandspruit informal settlement South Africa’ (2013) Studies in Poverty and Inequality Institute.
Stephanie Brockerhoff ‘A Review of the Development of Social Security Policy in South Africa’ (2013) Studies in Poverty and Inequality Institute, Working Paper 6.

Contents1. Introduction ............................................................................................... iii
1.1. Rationale for the SER Monitoring Tool .............................................................................................................. iii
1.2. Objectives of the Tool and end users ................................................................................................................ iv
1.3. Bridging the gap: Citizen-Based Monitoring (CBM) ......................................................................................... 1
1.4. Overview of the paper ..................................................................................................................................... 1
2. THE RIGHT TO A BASIC EDUCATION .................................................................. 22.1. The unqualified nature of the right to a basic education .................................................................................. 2
2.2. The right to a basic education means a right to a basic education of an adequate quality ............................... 3
2.3. International instruments that add content to the right to a basic education ................................................. 5
2.4. Constitutional Court Jurisprudence on the right to a basic education .............................................................. 7
3. STATE LEGISLATION, REGULATIONS AND POLICIES PROVIDING FOR THE REALISATION OF THE RIGHT TO A BASIC EDUCATION ................................... 103.1. The Education system under democratic South Africa ...................................................................................... 10
3.2. Key Legislation Governing South Africa’s Education System ............................................................................. 11
3.3. Review of Legislation, Regulations and Policies Relating to Access to Basic Education ..................................... 15
3.4. Access to ordinary schools ................................................................................................................................ 15
3.5. School Admissions and the rights of learners to access schools ........................................................................ 16
3.6. School Fees and the rights of learners to economically access schools ............................................................. 18
School fee exemptions and the rights of poor learners to access schools that charge fees ............................................... 18
Access to no-fee schools .................................................................................................................................................. 19
Access to teaching and learning in a language that is accessible to learners ................................................................... 21
3.7. Laws and policies affecting the rights of learners to access education in his or her home language ................ 22
The Constitution and Language in Schools ...................................................................................................................... 22
The South African Schools Act and Language in Schools ................................................................................................. 22
Language in Education Policy, 1997 ................................................................................................................................ 22
3.8. Barriers Impacting Learner Access to Home Language Instruction ................................................................... 23

3.9. Access to Basic Education for Learners with Disabilities ................................................................................... 24
Inclusive Education Laws and Policies ............................................................................................................................. 24
3.10. The Implementation of Inclusive Education Policies ......................................................................................... 26
3.11. Access to Early Childhood Development Education .......................................................................................... 28
3.12. Access to social support programmes for learners in school ............................................................................. 31
National School Nutrition Programme ............................................................................................................................ 31
Child Support Grant ........................................................................................................................................................ 32
3.13. Access to transport for learners traveling long distances to school ................................................................... 33
3.14. Access to Adult Basic Education ....................................................................................................................... 35
3.15. Review of Legislation, Regulations and Policies relating to the quality and adequacy of basic education in South Africa ........................................................................................................................ 37
School Governance, Management, Oversight and Support ............................................................................................. 37
Roles and Responsibilities of School Governing Bodies to provide learners with quality schools ..................................... 39
The Roles and Responsibilities of School Principals to provide learners with functional schools ..................................... 41
The Roles and Responsibilities of Education Districts to ensure that public schools are monitored and supported .......... 44
School Monitoring and Accountability Systems ............................................................................................................... 47
The provision of trained, qualified, knowledgeable, skilled and motivated teachers in schools ...................................... 49
Teacher supply and post-provisioning policies ................................................................................................................ 50
Teacher training and Qualifications ................................................................................................................................. 52
Initial Teacher Training .................................................................................................................................................... 52
Teacher Qualifications ..................................................................................................................................................... 55
Shortcomings in the Initial Teacher Training and Qualification Framework ..................................................................... 56
Teacher Subject and Pedagogical Knowledge ................................................................................................................. 58
Teacher Support and In-Service Training ......................................................................................................................... 60
Teaching time and curriculum coverage in the classroom ............................................................................................... 62
The impact of Teachers Unions on Teaching and Learning in schools ............................................................................... 64
Policies governing monitoring and accountability of teachers ........................................................................................ 65
The provision of adequate school infrastructure capable of enabling teaching and learning to take place in a safe and effective environment ............................................................................................. 66
The poor and unequal state of school infrastructure in South Africa ................................................................................ 66
Legislation, Regulations and State Policies Governing School Infrastructure ................................................................... 67
3.16. CASE STUDY – The case for minimum norms and standards for school infrastructure ...................................... 69
Policies governing the curriculum taught in schools ....................................................................................................... 71
Curriculum 2005 (1998) .................................................................................................................................................. 72
Revised National Curriculum Statement (2002) .............................................................................................................. 73
Curriculum Assessment Policy Statements (CAPS)(2012) ................................................................................................ 73
Programmes to address historical backlogs in mathematics and science subjects ........................................................... 74
Summary of roles and responsibilities of government departments and schools to develop and ensure delivery of the curriculum to learners .............................................................................................. 75
The Provision of Learning and Teaching Support Materials to Schools and their Learners ............................................... 76
The provision of textbooks to learners in schools ............................................................................................................ 76

3.17. CASE STUDY – Textbook delivery failures in Limpopo ...................................................................................... 78
The provision of workbooks to learners and teachers ...................................................................................................... 80
The Provision of libraries and library resources to learners in schools .............................................................................. 81
The provision of Textbooks for Learners with Disabilities ................................................................................................. 82
Conclusion ....................................................................................................................................................................... 82
Examination and graduation requirements used to oversee and assess learner achievement and quality in the basic education system ................................................................................................. 83
National Senior Certificate Examination (NSC) ................................................................................................................ 83
Annual National Assessments (ANAs) ............................................................................................................................. 85
3.18. CONCLUSION .................................................................................................................................................... 87
4. Budget Analysis: assessing the resource allocations and expenditures of the Department of Basic Education ........................................................... 894.1. Budgeting for the right to a basic education: key constitutional and international
legal principles and obligations ....................................................................................................................... 89
1.1.1. Accounting for inflation: nominal to real conversions ..................................................................................... 90
1.1.2. Sources used .................................................................................................................................................. 91
4.2. Budgeting Frameworks ................................................................................................................................... 91
1.2.1. Consolidated basic education allocations, basic education as a percentage of total government expenditure and GDP and comparison with other developing countries ............................ 92
1.2.2. Review of National and Provincial Budgeting and Expenditures on Basic Education ...................................... 951.2.2.1. National allocations and expenditures on the right to basic education ......................... 95
1.3. Budgeting to Fulfil the Right to a Basic Education: the policy framework ........................................................ 95
1.3.1. Teachers / personnel funding ......................................................................................................................... 96
1.3.2. Non-personnel funding of schools under the Norms and Standards for School Funding ................................ 97
1.3.3. School Infrastructure Spending ...................................................................................................................... 1001.3.3.1. Education Infrastructure Grant (EIG) ...................................................................................................... 100
1.3.3.2. Accelerated School Infrastructure Delivery Initiative (ASIDI) funded by the School Infrastructure Backlogs grant to national DBE .............................. 105
1.4. Provincial allocations and expenditures on the right to basic education .......................................................... 106
1.5. Key Findings .................................................................................................................................................... 112
5. The Status of the Right to a Basic Education in South Africa: What indicators tell us ................................................................................. 1145.1. Access Indicators .............................................................................................................................................. 115
5.2. Adequacy Indicators ........................................................................................................................................ 126
5.3. Quality Indicators ............................................................................................................................................. 144
CONCLUSION .......................................................................................................... 166
BIBLIOGRAPHY ...................................................................................................... 168

INDICATORS (Chapter 5)Access Indicators ..................................................................................................................... 115School Attendance ........................................................................................................................................ 115Indicator 1.1: The proportion of 5 year-old children attending an educational institution .......................................................................... 115
Indicator 1.2: The proportion of 5 year-old children attending educational institutions by gender ...................................................... 115
Indicator 1.3: The number of learners enrolled in Grade R in Public and Independent Schools .............................................................. 115
Indicator 1.4: The number of 3 to 5 year-old children attending an ECD facility ................................................................................................ 116
Indicator 2: The proportion of 7 to 15 year-old children attending educational institutions by gender ......................................... 116
Indicator 3: The proportion of 16 to 18 year-olds attending educational institutions ................................................................................ 117
Indicator 4: The number of 5 to 18 year-olds not attending schools/educational institutions ............................................................. 118
Indicator 4.1: Reasons for not attending educational institutions amongst 7 to 18 year-olds not attending educational institutions .................................................................................................................................................................... 118
Indicator 5: Enrolment in select grades ..................................................................................................................................................................................... 119
Special Needs Education .............................................................................................................................. 120Indicator 6.1: Proportion of 5 year-old children with disabilities enrolled in educational institutions by province ...................... 120
Indicator 6.2: Proportion of 7 to 15 year-old children with disabilities attending educational institutions, by province .......... 120
Indicator 6.3: Proportion of 16 to 18 year-old youth with disabilities attending educational institutions, by province ............ 121
Indicator 6.4: Enrolment in Special Needs and Ordinary Schools by Special Needs Learners .................................................................... 121
School Fees ..................................................................................................................................................... 122Indicator 7: The proportion of learners attending schools who do not pay school fees ........................................................................... 122
Transportation ............................................................................................................................................... 123Indicator 8: Rate of learners who walk for more than 60 minutes to their educational institutions ................................................... 123
Indicator 8.1: Percentage of learners who walk all the way to school whose travel time exceeds 60 minutes, by province. . 123
Social Support Programmes for learners attending schools ................................................................ 124Indicator 9: The proportion of learners attending public schools who benefit from the National School
Nutrition Programme (NSNP), by province ................................................................................................................................................... 124
Indicator 9.1: The percentage of schools with a National School Nutrition Programme that serve a protein and fruit or vegetable every school day ................................................................................................................................................................... 124
Indicator 9.2: The percentage of individuals aged 5 years and older who attend school and receive child support grants .................................................................................................................................................................................. 125
Corporal Punishment .................................................................................................................................... 125Indicator 10: Percentage of learners who experienced corporal punishment at school .............................................................................. 125
Adequacy Indicators ................................................................................................................ 126Teachers ........................................................................................................................................................... 126Indicator 11.1: Learner-to-educator ratios by province .......................................................................................................................................................... 126
Indicator 11.1.1: Number of schools that have learner-to-educator ratios of greater than 40:1 ....................................... 126
Indicator 11.2: Proportion of educator posts that are vacant ............................................................................................................................................. 127
Indicator 11.2.1: The proportion of maths teacher posts that are vacant by province and school phase .................... 127
Indicator 11.3: Percentage of teachers who fulfil minimum qualifications ................................................................................................................ 128
Indicator 11.4: Percentage of teachers who demonstrate minimum standards in subject knowledge ................................................. 129
Indicator 11.5: Average number of hours spent by educators on professional development activities, by province and quintile .......................................................................................................................................................................................... 131
Indicator 11.6: Educators absent from school or not at school on an average school day, by province and quintile ................... 133
Curriculum Coverage .................................................................................................................................... 135Indicator 12.1: Written language and mathematics exercises completed per week in grades 6 and 9
by province and quintile .......................................................................................................................................................................................... 135

Learning and teaching support materials ................................................................................................ 136Indicator 13.1: The proportion of learners with his or her own textbook for each subject for the
entire school year ......................................................................................................................................................................................................... 136
Indicator 13.2: The proportion of learners with access to required workbooks ..................................................................................................... 136
School Infrastructure .................................................................................................................................... 139Indicator 14.1: Number of schools that lack or have inadequate access to critical school
infrastructural facilities. .............................................................................................................................................................................................. 139
Indicator 14.2: Percentage of schools with classroom sizes greater than 40 learners per class, by province ...................................... 142
Special Needs Education .............................................................................................................................. 143Indicator 15.1: The percentage of schools that have a support team to support learners with special
education needs, by province. ............................................................................................................................................................................. 143
Indicator 15.2: The percentage of schools that have been able to screen learners, identify learners or support learners with special education needs. ....................................................................................................................................... 143
Quality Indicators ................................................................................................................... 144Grade Progression and Educational Attainment ..................................................................................... 144Indicator 16.1: Percentage distribution of highest level of educational attainment for persons
aged 20 years of age and older. ........................................................................................................................................................................... 144
Indicator 16.2: Percentage of learners repeating their current grades ......................................................................................................................... 146
Indicator 16.3: Percentage of 15 year-olds who have completed primary school. ............................................................................................... 147
Indicator 16.4: Age-appropriate enrolment for 9 and 12 year-olds ................................................................................................................................ 148
Secondary School Completion Rates and National Senior Certificate Results .................................. 148Indicator 17.1: The percentage of 22 to 25 year-olds who have completed grade 12 (Matric)
and above by gender ................................................................................................................................................................................................. 148
Indicator 17.2: Percentage of NSC (Matric) passes and bachelors level passes as a proportion of Grade 10 enrolments from two years earlier, by province .................................................................................................................. 149
Indicator 17.3: Number of NSC candidates passing mathematics and physical sciences ................................................................................ 150
Grade 3, 6 and 9 performances on Annual National Assessments (ANAs) ......................................... 152Indicator 18.1: Percentage of learners who score 50% or higher on grade 3, 6 and 9 ANAs .......................................................................... 152
Performance on International Assessments ............................................................................................ 154Indicator 19.1: South Africa’s performance on Southern and East African Consortium for Monitoring
Educational Quality (SACMEQ) testing ............................................................................................................................................................ 154
Indicator 19.1.1: South Africa’s performance on SACMEQ testing compared to other partici pating SACMEQ countries. ............................................................................................................................... 154
Indicator 19.1.2: Percentage of South African learners reaching acceptable literacy and numeracy levels on SACMEQ assessments ............................................................................................................. 155
Indicator 19.1.3: Percentage of Grade 6 learners effectively enrolled in school ........................................................................ 156
Indicator 19.2: South Africa’s Performance on Trends in International Mathematics and Science Study (TIMSS) Assessment ................................................................................................................................................................... 157
Indicator 19.2.1: The percentage of Grade 9 TIMSS participants scoring above the minimum international math and science benchmarks. ................................................................................ 158
Indicator 19.3: Performance on the Progress in International Reading Literacy Study (PIRLS) ...................................................................... 159
Adult Basic Education ................................................................................................................................... 161Indicator 20.1: The number of South Africans attending Adult Basic Education and
Training or literacy programmes ......................................................................................................................................................................... 161
Indicator 20.2: Number of adults who enrolled in Adult Education and Training Centres and registered, wrote and completed GETC-AET Level 4 (Grade 9) qualification .......................................................................... 161
Post-schooling employment and enrolment in higher education institutions ................................. 162Indicator 21.1: Percentage of individuals aged 18 to 29 enrolled in higher education institutions ........................................................... 162
Indicator 21.2: Number and percentage of 15 to 24 year-old youth not employed and not in education or training (NEETs). ............................................................................................................................................................................... 163

Realising the Right to a Basic Education in South Africa
ACRONYMS:AET Adult Basic Education and Training
ACE Accelerated Certificate in Education
ANA Annual National Assessment
ANC African National Congress
APP Annual Performance Plan
ASIDI Accelerated School Infrastructure Development Initiative
ASS Annual School Survey
CAPS Curriculum Assessment and Policy Statements
CEM Council of Education Ministers
DBE Department of Basic Education
DHET Department of Higher Education and Training
DPME Department of Performance Monitoring and Evaluation
DHET Department of Higher Education and Training
DoE Department of Education
ECD Early Childhood Development
EIG Education Infrastructure Grant
EMIS Education Management Information System
FAL First Additional Language
FET Further Education and Training
GET General Education and Training
GHS General Household Survey
HL Home Language
HoD Head of Department
HSRC Human Sciences Research Council
IQMS Integrated Quality Management System
ITE Initial Teacher Education
KZN KwaZulu-Natal
LDoE Limpopo Department of Education
LiEP Language in Education Policy
LOLT Language of Learning and Teaching
LTSM Learning and Teaching Support Materials
MEC Member of Executive Council
NDP National Development Plan
NEEDU National Education and Evaluation Development Unit
NEPA National Education Policy Act
NICPD National Institute for Curriculum and Professional Development
NGO Non-Governmental Organisation
NPC National Planning Commission
NSC National Curriculum Statement

NMUNSPSI National Minimum Uniform Norms and Standards for School Infrastructure
NQF National Qualifications Framework
NSC National Senior Certificate
NSNP National School Nutrition Programme
PED Provincial Education Department
PIRLS Progress in International Reading Literacy Study
SA Subject Advisor
SACE South African Council of Educators
SACMEQ Southern Africa Consortium for Monitoring and Education Quality
SADTU South African Democratic Teachers Union
SAHRC South African Human Rights Commission
SAQA South African Qualifications Authority
SASA South African Schools Act
SGB School Governing Body
SIP School Improvement Plan
SMS School Monitoring Survey
SMT School Monitoring Team
SNAP School Analysis Package
StatsSA Statistics South Africa
TIMSS Trends in International Mathematics and Science Study
WC Western Cape
WCED Western Cape Education Department``
Preface and acknowledgementsStudies in Poverty and Inequality Institute (SPII) is an independent research think-tank that focuses on generating new knowledge, information and analysis in the field of poverty and inequality studies.
This working paper has been undertaken as part of the Socio-Economic Rights Monitoring Tool project conducted by SPII with the support of Ford Foundation, Foundation for Human Rights and in partnership with the South African Human Rights Commission (SAHRC). The objective of this project, through the combination of policy and budget analysis and statistical indicators, is to provide a comprehensive framework and set of tools to monitor and guide the progressive realisation of socio-economic rights. This includes investigating the manner in which policy making to expand access to socio-economic rights in fact aligns with Constitutional obligations and jurisprudential guidance handed down by the Constitutional Court. This analysis of policy is complemented by an assessment of the resources directed towards the fulfilment of rights and the evaluation of indicators designed to assess realisation of rights over time. The project aims to provide useful tools for policy makers, those that exercise oversight over the executive, including Parliament, the DPME and Chapter Nine institutions (notably the SAHRC), public interest litigants, and broader civil society.
This work is funded by the Ford Foundation whose funding contribution to this research is gratefully acknowledged.


iii Introduction
Introduction
The inclusion of socio-economic rights in South Africa’s Constitution envisioned the recon-struction and transformation of a divided and unequal society: to heal the divisions of the past and establish a society based on democratic values, social justice, and fundamental human rights.1 However, unacceptable and unsustainable levels of poverty and inequality, compounded by widespread unemployment and a lack of access to basic services for many poor communities, continue to violate people’s rights and undermine our fledgling democracy. There have undoubtedly been many achievements in the twenty years since South Africa’s political transition; what is unclear, however, is the extent to which the social and economic transformation envisioned by the Constitution has been realised, or even if we are on the right track. Moreover, there remains little consensus within government or civil society on what such transformation would actually look like, how it should be measured, by whom, against what benchmarks, and over what period of time.
The justiciable socio-economic rights (SERs) guaranteed to everyone in South Africa include the rights to health, social security, housing, food, water, education and the environment.
While the Constitution provides an overarching framework and the ‘supreme law’2 governing the rights and duties of citizens, private enterprises and the state, it does not set out the content of these rights: what measures the state should take, how it should finance access to SERs, and the timeframes within which they must be realised. The challenge for policy-makers and oversight bodies alike is how best we are able to evaluate government programmes and budget allocations against these binding Constitutional obligations if there is no methodology for monitoring and addressing critical issues relating to the progressive realisation of these rights.
It is for this reason that Studies in Poverty and Inequality Institute (SPII), in partnership with the South African Human Rights Commission, has developed a Socio-Economic Rights Monitoring Tool. The Tool uses a methodology for monitoring and evaluating the performance of government and the realisation of SERs that is based on a combination of policy (step 1) and budget (step 2) analysis, and the development of quantitative indicators for each of the rights (step 3). This involves unpacking the content of these rights and the obligations they impose on government, evaluating the extent to which government policies and budget allocations adequately address these obligations, and measuring the enjoyment of rights by people on the ground.
This Working Paper introduces our analysis of the content, policy effort, resource allocation and enjoyment of the constitutional right to a basic education.
The application of our SER Monitoring Tool to the right to a basic education has benefited from collaboration with a range of stakeholders, and provides a unique picture of the level of enjoyment of the right, and of the outcomes of government efforts to realise this right, twenty-one years into South Africa’s democracy. We identify areas of progress and regression, gaps and priority areas for action with the aim of guiding government in its obligations to fulfil the right to a basic education, while providing uniquely accessible information for progressive civil society to engage with.
1.1. Rationale for the SER Monitoring ToolSPII’s Socio-Economic Rights Monitoring Tool draws upon international best practice in human rights monitoring to create a unique methodology for SER monitoring relevant to the South African context. The 3-step model combines analyses of the socio-economic policy effort (step 1), the allocation and expenditure of resources for SERs (step 2), with the first two-steps laying the foundation upon which monitoring and evaluating of the actual enjoyment of rights on the ground through right-specific outcome indicators (step 3) can be assessed. This requires the development of performance and impact indicators relevant to the right in question that can be tracked and monitored over time.
1 Constitution of the Republic of South Africa, 1996, preamble. See: www.thepresidency.gov.za/docs/reports/annual/2008/preamble.pdf 2 Ibid, sec1(c).
CHAPTER
1
This Working Paper introduces
our analysis of the content, policy effort,
resource allocation and enjoyment of the
constitutional right to a basic education.

iv Realising the Right to a Basic Education in South Africa
Figure 1: The SER Monitoring Tool: 3-step methodology
Step 1: Policy Analysis
• Assess the Policy E�ort• Constitutional obligations: reasonableness test• Content of SER policies & legislation and the constitutionality
of the policy-making process• Implementation challenges & accountability mechanisms
Step 2: Budget
Analysis
• Assess Resource Allocation & Expenditure• Generation of government revenue• Allocation & expenditure of resources on SERs• Budget cycle process
Step 3: Indicators
• Monitor and Evaluate Attainment of the Right• Access indicators (physical and economic) • Adequacy indicators• Quality indicators
1.2. Objectives of the Tool and end usersThe purpose of the SER Monitoring Tool goes beyond building a framework for the assessment of constitutional and human rights compliance, and aims to achieve specific objectives. These include, first, to clarify and unpack the content of SERs and the concomitant obligations they place on the state, and in so doing, to move the country towards greater consensus on what progressive realisation of socio-economic rights means and requires in South Africa. Second, to develop an efficient and useful method for monitoring and evaluating progress made in realising SERs to date and in the future, to create an evidence-base for socio-economic policy-making, advocacy initiatives and legal interventions. Third, to determine the extent to which organs of the state have respected, protected, promoted and fulfilled their obligations to rights-holders. This involves identifying achievements, deprivations, disparities, and regression to illuminate both causation and accountability in terms of policies, resources spent, implementation and institutional capacity. Lastly, the Tool seeks to make recommendations to broaden and accelerate the progressive – and ultimately universal – enjoyment of all SERs.
As the importance placed on stakeholder engagement in the process of developing indicators testifies, the Tool aims to support and be of practical use to a variety of actors, including: civil society, government and policy-makers, advisory and oversight bodies such as the DPME and Chapter 9 institutions, especially the SAHRC, the judiciary and public interest lawyers, and academia.
For a detailed outline of the objectives of SPII’s 3-step methodology and anticipated use and users of the tool, please refer to SPII’s publication: ‘A Framework for Monitoring and Evaluating the Progressive Realisation of Socio-Economic Rights in South Africa.’3
3 Dawson, Hannah & McLaren, Daniel. 2015. ‘A Framework for Monitoring and Evaluating the Progressive Realisation of Socio-Economic Rights in South Africa’. Studies in Poverty and Inequality Institute. Available at: http://spii.org.za/wp-content/uploads/2015/03/SPII-A-Framework-for-Monitoring-the-Progressive-Realisation-of-SERs-....pdf
The purpose of the SER Monitoring
Tool goes beyond building a framework
for the assessment of constitutional
and human rights compliance

1 Introduction
1.3. Bridging the gap: Citizen-Based Monitoring (CBM)
The SER Monitoring Tool places emphasis on the importance of respecting and promoting human rights principles at all stages of the country’s development process. However, moving all actors towards thinking about how to develop roadmaps and timeframes for and by when to achieve universal access for all citizens can only go so far without inputs from the most vulnerable and marginalised within society. Thus far, the SER Monitoring Tool has emphasised quantitative measures that are well suited to mapping trends and patterns over time, but has side-lined citizen based monitoring (CBM4) and other mechanisms for public participation, as a result of a number of factors.5
SPII is currently considering how to incorporate and operationalize a CBM dimension to the SER Monitoring Tool. This is because, in addition to the reasons above, a bottom-up approach to monitoring the progressive realisation of SERs would provide a more effective mechanism for determining the relationship between individuals and groups with valid claims (right-holders) and the state and non-state actors with correlative obligations (duty-bearers). Consequently, it must be understood that one of the main causes preventing the realisation of human rights is the lack of capacity of duty-bearers to fulfil their obligations combined with a lack of capacity among rights-holders to claim and exercise their rights effectively. Developing these capacities and improving the relationship between these two groups is a cross-cutting and crucial element of the human-rights-based approach to development chosen by post-apartheid South Africa.
1.4. Overview of the paperThe first task of human rights policy-making and monitoring is to define the content of the right in question. International norms and constitutional jurisprudence, among other sources, are used in Chapter 2 to guide an analysis of the content of the right to basic education in South Africa.
Having established the content and obligations of the right to right to a basic education, as well as the context in which efforts to realise the right to a basic education are formulated and implemented in South Africa, the 3-step Monitoring Tool is then applied to evaluate government policies (chapter 3), programmes and budgets (chapter 4) and indicators, which track and measure the realisation of the right to a basic education over time (chapter 5).
Chapter 6 of the paper summarises and brings together the key findings and recommendations of the policy, budget and indicator analysis. The paper concludes with a call for citizens, the private sector, organised labour, civil society and government to organise and unite around these findings and recommendations in order to advance the realisation of the right to a basic education and move the country towards fulfilment of the right for all.
4 The SER Monitoring Tool is committed to ensuring that the tool meaningfully reflects the concerns, priorities and needs of people on the ground and is able to support and accommodate monitoring information from citizens and communities themselves. It is for this reason that the Tool has surveyed the existing organisations and their methodologies for community participation and monitoring, which the project aims to engage with going forward.
5 Dawson, Hannah. 2014. ‘Public participation and citizen-based monitoring in realising socio-economic rights’. Studies in Poverty and Inequality Institute, Policy Brief 7. Available at: http://spii.org.za/wp-content/uploads/2014/10/Policy-brief-7-Community-Monitoring-Report.pdf.
SPII is currently considering how
to incorporate and operationalize a CBM dimension to the SER
Monitoring Tool.

2 Realising the Right to a Basic Education in South Africa
THE RIGHT TO A BASIC EDUCATION
The right to a basic education is enshrined in Section 29(1) of the South African Constitution, which provides that:
“Everyone has the right -
(a) to a basic education, including adult basic education; and
(b) to further education, which the state, through reasonable measures, must make progressively available and accessible.”
Section 7(2) of the South African Constitution mandates that the state respect, protect, promote and fulfil the rights to a basic and further education.
The Constitutional Court has therefore held that the right to a basic education imposes a positive obligation on the state to provide and make basic education available to every person.6 Moreover, the Court has distinguished the right a basic education from other socio-economic rights in that it is unqualified and, as such, immediately realisable. Justice Nkabinde emphasised this point in Juma Musjid, stressing that:
“Unlike some of the other socio-economic rights, this right is immediately realisable. There is no internal limitation requiring that the right be “progressively realised” within “available resources” subject to “reasonable legislative measures”. The right to a basic education in Section 29(1)(a) may be limited only in terms of a law of general application which is “reasonable and justifiable in an open and democratic society based on human dignity, equality and freedom”. This right is therefore distinct from the right to “further education” provided for in Section 29(1)(b). The state is, in terms of the right, obliged, through reasonable measures to make further education “progressively available and accessible”.7
2.1. The unqualified nature of the right to a basic education
Distinguishing the right to a basic education as immediately realisable rather than subject to progressive realisation means that the right belongs to the individual. Accordingly, the realisation of the right to a basic education is not assessed in terms of whether the state has taken reasonable steps to provide basic education in South Africa progressively and over time but rather whether access to the right has actually been achieved.8 A person claiming that his or her right to a basic education has been violated would therefore not have to first prove that the government has acted unreasonably in the policies that it has developed or implemented or in its failure to act. Rather, once an individual has shown that the state has failed to provide for the realisation of his or her right to a basic education, the state instead bears the burden of showing that the limitation of the right is justifiable in an open and democratic society based on human dignity, equality and freedom.9 While the unqualified right to a basic education does not necessarily mean that all learners will immediately have access to high quality education, it does provide individuals who have been denied access to adequate basic education with certain benefits that litigants who seek to vindicate other socio-economic rights do not have.
6 Ex parte Gauteng Provincial Legislature: In re Dispute Concerning the Constitutionality of Certain Provisions of the Gauteng School Education Bill of 1996 1996 (3) SA 165 (CC) at para 9, finding that “Section 32(a) creates a positive right that basic education be provided for every person and not merely a negative right that such a person should not be obstructed in pursuing his or her basic education.”
7 Governing Body of the Juma Musjid Primary School & Others v Essay N.O. and Others 2011 (8) BCLR 761 (CC) at para 37 (Juma).8 Compare e.g. Grootboom where the Constitutional Court held that the state’s housing policy was unreasonable as it did not account for the
need for homeless people to have access to temporary housing against Soobromony where the Constitutional Court held that the state’s policy to limit access to dialysis treatment based on the patient’s chronic health characteristics was reasonable given budget constraints and the hospital’s need to limit scarce resources. For additional analysis of the implications the right to basic education being immediately realisable rather than progressively realisable see McConnachie, C. and McConacchie, C. ‘Concretising the Right to a Basic Education.’ (2012). 129: 3 South African Law Journal. 554 at 563.
9 Section 36(1) of the South African Constitution sets forth the grounds by which the state may limit the realisation of the right to a basic education, providing that: “The rights in the Bill of Rights may be limited only in terms of law of general application to the extent that the limitation is reasonable and justifiable in an open and democratic society based on human dignity, equality and freedom, taking into account all relevant factors, including - (a) the nature of the right; (b) the importance of the purpose of the limitation; (c) the nature and extent of the limitation; (d) the relation between the limitation and its purpose; and (e) less restrictive means to achieve the purpose.
CHAPTER
2
The Constitutional Court has therefore held that the right
to a basic education imposes a positive obligation on the state to provide and make basic
education available to every person

3 THE RIGHT TO A BASIC EDUCATION
A second important distinction between the right to a basic education and other socio-economic rights is its nature as a good rather than as an action. The Constitutional Court has adopted what has been termed a ‘reasonableness’ approach when interpreting qualified socio-economic rights, such as the rights to food, housing, social security and health care. Under that approach, the Constitutional Court has held that the right to access health care services, for instance, does not give rise to a self-standing and independent positive right. Rather, qualified socio-economic rights only provide for the scope of the rights that everyone has and the corresponding obligations on the state to take action to respect, protect, promote and fulfil that right through reasonable legislative and other measures, within available resources, to achieve the progressive realisation of the right.10 In essence, these limitations can be construed as meaning that qualified socio-economic rights are limited to state actions rather than the actual provision of goods and services. As such, individuals do not necessarily have a right to be provided with actual goods and services amounting to the provision of rights, such as food, housing and health care, but are rather entitled to have the state take certain actions through reasonable measures to provide these goods and services progressively and within available resources.11 The right to a basic education, on the other hand, is vested in each individual who not only has the right to have the state take action to affect the realisation of the right, but also has the right to immediately access the good itself…a basic education.
While the right to a basic education is different in nature from other qualified socio-economic rights, the Constitutional Court has not yet determined what the content of this right means for learners attending South African public schools. Given the widely acknowledged poor state of public education in South Africa and vast disparities in adequacy and quality of public schools made available along socio-economic, geographic and, invariably along racial lines, determining the content that the right is intended to guarantee is of paramount importance. Much attention amongst academic commenters has therefore revolved around the meaning of the term basic education and whether it refers to a period of schooling or whether it applies to a standard of schooling requiring a minimum level of adequacy and quality.12
2.2. The right to a basic education means a right to a basic education of an adequate quality
The history of apartheid era education and the constitutional provision guaranteeing everyone the right to a basic education demonstrate that the right must guarantee access to education that is of an adequate quality. The constitutional framework has placed particular importance on the right to education as an empowerment right which is necessary for each individual to be able to realise his or her constitutional rights and be able to exercise social and economic opportunities. All citizens must be able to realise their rights to a basic education for the constitutional system as a whole to function as a democracy because the system is contingent upon a well-informed and educated citizenry empowered to participate in the democratic process. Given the social, economic and educational imbalances that have carried over to the post-apartheid democratic republic, the realisation of the right to a basic education is a fundamental democratic principal of paramount importance.
The context of the right to a basic education and the role that basic education plays in advancing transformative principals of democracy, human dignity, equality and freedom.
When interpreting a provision of the Constitution, a reviewing court must take context and history into account13, and promote the values that underlie an open and democratic
10 See eg Minister of Health & Others v. Treatment Action Campaign & Others (No 2). 2002 (5) SA 721 (CC) Para 39.11 McConnachie, C. and McConnochie, C. 2012. at 562.12 For commentary that the meaning of the right to a basic education implies an education of “adequate” quality, see e.g. Woolman, S. and
Fleisch, B., Constitution in the Classroom: Law and education in South Africa 1994 – 2008, Pretoria University Law Press (2009) at 109.13 See Executive Council, Western Cape v Minister of Provincial Affairs and Constitutional Development and Another; Executive Council, KwaZulu-Natal
v President of the Republic of South Africa and Others (CCT15/99,CCT18/99) [1999] ZACC 13; 2000 (1) SA 661; 1999 (12) BCLR 1360 (15 October 1999), at para 44, holding that “[a} provision in a Constitution must be construed purposively and in the light of the constitutional context in which it occurs. Our history, too, may not be ignored in that process.” See also South African Police Service v Public Servants Association 2007 (3) SA 521 (CC) at para 19, holding that the Constitution “must be understood as responding to our painful history and facilitating the transformation of our society so as to heal the divisions of the past, lay the foundations for a democratic and open society, improve the quality of life for all and build a united and democratic South Africa.” Moreover “courts must pay “close attention to the socio-economic and institutional context in which a provision under examination functions.”
The constitutional framework has
placed particular importance on the
right to education as an empowerment right which is necessary for each individual to be
able to realise his or her constitutional rights
and be able to exercise social and economic
opportunities.

4 Realising the Right to a Basic Education in South Africa
society based on human dignity, equality and freedom14. It is therefore important to not only understand the history of education in South Africa when interpreting the content of the right, but to also comprehend the context under which the right to education has been codified in the constitution and the unique and necessary role a comprehensive public basic education system plays in achieving the transformative principals of democracy, human dignity, equality and freedom. That education is an empowerment right necessary for the realisation of other constitutional rights, as well as a collective means for South Africa to address entrenched historical inequality has long been acknowledged and emphasised throughout post-apartheid South Africa’s legislative, policy and constitutional court jurisprudential development.15
The Constitutional Court has consistently highlighted the discriminatory history of education in South Africa during apartheid and the role that institutionalised inequalities in education played in enforcing economic inequality and the lack of economic opportunity for non-white South Africans. The Constitutional Court in Ermelo and Juma Musjid recognised the historical impact that education had on inequality and the need for everyone in democratic South Africa to have access to an adequate education capable of enabling learners to be able to, among other things, achieve to their fullest potential and have sufficient educational foundations to access work opportunities. It follows that a public education system of this import can only achieve its constitutionally and legislatively enshrined purpose if it is able to function at an adequate level.
The Constitutional Court in Ermelo summarised the unjust and unequal nature of the apartheid era education system as follows:
“Apartheid has left us with many scars. The worst of these must be the vast discrepancy in access to public and private resources. The cardinal fault line of our past oppression ran along race, class and gender. It authorised a hierarchy of privilege and disadvantage. Unequal access to opportunity prevailed in every domain. Access to private or public education was no exception. While much remedial work has been done since the advent of constitutional democracy, sadly deep social disparities and resultant social inequity are still with us.
It is so that white public schools were hugely better resourced than black schools. They were lavishly treated by the apartheid government. It is also true that they served and were shored up by relatively affluent white communities. On the other hand, formerly black public schools have been and by and large remain scantily resourced. They were deliberately funded stingily by the apartheid government. Also, they served in the main and were supported by relatively deprived black communities. That is why perhaps the most abiding and debilitating legacy of our past is an unequal distribution of skills and competencies acquired through education.”16
The Constitutional Court in Ermelo then went on to emphasise that the right to a basic education must be read within the context of a constitution that by “unconcealed design”, ardently demands that inequalities created and perpetuated under this system “be addressed by a radical transformation of society as a whole and of public education in particular” through a cluster of warranties, which include, among others, respect for human dignity, achievement of equality and freedom; rights to formal and substantive equality; prohibition against discrimination, right to enjoy one’s language and culture, and “even more importantly...the right to basic education.”17
Two years later, the Constitutional Court in Juma Musjid echoed its emphasis that the history of education during apartheid and the context of the right to basic education within the Constitution demonstrate the unique role the right to education serves in terms of achieving social transformation.
14 See Section 39(1)(a) of the South African Constitution, which states in pertinent part that “When interpreting the Bill of Rights, a court tribunal or forum...must promote the values that underlie an open and democratic society based on human dignity, equality and freedom.
15 See eg MEC for Education, Gauteng Province & others v Governing Body, Rivonia Primary School & others 2013 (6) SA 582 (CC) (Rivonia) at para 2, noting that “[c]ontinuing disparities in accessing resources and quality education perpetuate socio-economic disadvantage, thereby reinforcing and entrenching historical inequity.” See also Head of Department, Mpumalanga Department of Education and Another v Hoerskool Ermelo and Another 2009 (2) SA 415 (CC); 2010 (3) BCLR 177 (CC) (Ermelo) at para 2 noting that “It is trite that education is the engine of any society. And therefore, an unequal access to education entrenches historical inequity since it perpetuates socio-economic disadvantage.”
16 Ermelo at para 45 and 46.17 Ermelo at para 47.
It is so that white public schools were hugely
better resourced than black schools.

5 THE RIGHT TO A BASIC EDUCATION
“The significance of education, in particular basic education for individual and societal development in our democratic dispensation in the light of the legacy of apartheid, cannot be overlooked. The inadequacy of schooling facilities, particularly for many blacks was entrenched by the formal institution of apartheid, after 1948, when segregation even in education and schools in South Africa was codified. Today, the lasting effects of the educational segregation of apartheid are discernible in the systemic problems of inadequate facilities and the discrepancy in the level of basic education for the majority of learners.
Indeed, basic education is an important socio-economic right directed, among other things, at promoting and developing a child‘s personality, talents and mental and physical abilities to his or her fullest potential. Basic education also provides a foundation for a child‘s lifetime learning and work opportunities. To this end, access to school – an important component of the right to a basic education guaranteed to everyone by section 29(1)(a) of the Constitution – is a necessary condition for the achievement of this right.”18
The White Paper on Education and Training (March 1995) described the primary “goal” of basic education as being: “[t]o enable a democratic, free, equal, just and peaceful society to take root and prosper in our land, on the basis that all South Africans without exception share the same inalienable rights, equal citizenship, and common national destiny.” The Preamble to the South African Schools Act not only echoed these attributes of education, but also emphasised the need for education to be carried out by a national public education system of “high quality” in order to address past injustices and:
“lay a strong foundation for the development of all our people’s talents and capabilities, advance the democratic transformation of society, combat racism and sexism and all other forms of unfair discrimination and intolerance, contribute to the eradication of poverty and the economic well-being of society, protect and advance our diverse cultures and languages, uphold the rights of all learners, parents and educators, and promote their acceptance of responsibility for the organisation, governance and funding of schools in partnership with the State.”19
The history and social significance of education in South Africa along with the role of basic education to advance critical transformative principals such democracy, equality, human dignity and freedom, requires the development and implementation of a high quality public education system capable of fulfilling these fundamental mandates that must be realizable by the individual, as well as by society as a whole.
2.3. International instruments that add content to the right to a basic education
The right to basic education is further recognised in international instruments, which through the state’s adoption, mandate that the state make quality basic education available to all regard-less of socio-economic standing.20 The Constitutional Court in Juma Musjid21 has emphasized
18 Juma at para 42 and 43.19 See also the preamble to the Employment of Educators Act, 1998, which states in pertinent part that “WHEREAS the advancement and
recognition of learning is an essential attribute of a free and democratic nation and a prerequisite for the development and well-being of its citizens”; See also Department of Education Policy Document on Adult Basic Education and Training, 2003, which states that “Education is an essential component of the reconstruction, development and transformation of South African society. The government’s policy for Adult Basic Education and Training (ABET) must be understood within the overarching goal of building a just and equitable system which provides good quality education and training to adult learners throughout the country.”
20 Section 39(1) of the South African Constitution states that “when interpreting the Bill of Rights, a court, tribunal...(b) must consider international law.” The Constitutional Court considered the international instruments described below in Juma at paras 40 and 41 when it interpreted the right to a basic education in the context of private property ownership. The Court in Juma cited the Committee on Economic, Social and Cultural Rights, General Comment 13 as providing the following content to the right to a basic education: “Education is both a human right in itself and an indispensable means of realizing other human rights. As an empowerment right, education is the primary vehicle by which economically and socially marginalized adults and children can lift themselves out of poverty and obtain the means to participate fully in their communities. Education has a vital role in empowering women, safeguarding children from exploitation and hazardous labour and sexual exploitation, promoting human rights and democracy, protecting the environment, and controlling population growth. Increasingly, education is recognised as one of the best financial investments States can make. But the importance of education is not just practical: a well-educated, enlightened and active mind, able to wander freely and widely, is one of the joys and rewards of human existence.”
21 Juma, at para. 40.
The significance of education, in particular
basic education for individual and
societal development in our democratic
dispensation in the light of the legacy
of apartheid, cannot be overlooked.

6 Realising the Right to a Basic Education in South Africa
that both the Universal Declaration of Human Rights (UDHR)22 and the International Covenant on Economic, Social and Cultural Rights (ICESCR)23 recognise the right to education without qualification. The United Nations Convention on the Rights of the Child (Child Rights Convention) also recognises that children have the right to education.24 Regionally, Article 11 of the African Union’s African Charter on the Rights and Welfare of the Child makes further provision for every child to have the right to a basic education which, among other things, is free and compulsory.25
South Africa ratified the ICESCR on 12 January, 2015 joining 163 other nations in their commit-ment to realising economic, social and cultural rights, including the right to education. The ratification of the covenant means that the ICESCR will be legally binding. The South African government is required to ensure that domestic legislation conforms with the obligations set forth in the instrument by April 2017. The ratification of the ICESCR also mandates that the state report every five years to the United Nation’s Committee on Economic, Social and Cultural Rights on how it has implemented the Covenant into law, as well as the measures that the state has taken towards the realisation of the rights recognised in the Covenant and the progress that has been achieved. While the state’s ratification of the ICESCR has been widely welcomed both domestically and internationally, a number of civil society organisations have raised objections to the state’s attempt to insert a qualification into the ratification of the covenant that seeks to limit the obligation towards the right to education to only require that the state give progressive effect to the right to education.26 It has been argued that this qualification conflicts with the Constitutional Court’s judgment in Juma Musjid which, as discussed above, emphasised the unqualified nature of the right to a basic education and the distinction that the right to a basic education is immediately realisable and not limited to “progressive realisation” within “available resources” and subject to “reasonable legislative measures”.
Additional content to the right to a basic education is outlined in the UN Committee on Economic, Social and Cultural Rights general remarks on the right to receive an education (known as the 4 A-s). In its General Comment 13, the CESCR stressed that “education in all its forms and at all levels shall exhibit the following interrelated and essential features:
(a) Availability - functioning educational institutions and programmes have to be available in sufficient quantity within the jurisdiction of the State party. What they require to function depends upon numerous factors, including the developmental context within which they operate; for example, all institutions and programmes are likely to require buildings or other protection from the elements, sanitation facilities for both sexes, safe drinking water, trained teachers receiving domestically competitive salaries, teaching materials, and so on; while some will also require facilities such as a library, computer facilities and information technology;
(b) Accessibility - educational institutions and programmes have to be accessible to everyone, without discrimination, within the jurisdiction of the State party. Accessibility has three overlapping dimensions:
22 Universal Declaration of Human Rights, GA Res 217A (III), UN Doc A/810 at 71 (1948), concluded on 10 December 1948. Article 26 provides: “Everyone has the right to education. Education shall be free, at least in the elementary and fundamental stages. Elementary education shall be compulsory. Technical and professional education shall be made generally available and higher education shall be equally accessible to all on the basis of merit; Education shall be directed to the full development of the human personality and to the strengthening of respect for human rights and fundamental freedoms. It shall promote understanding, tolerance and friendship among all nations, racial or religious groups, and shall further the activities of the United Nations for the maintenance of peace.”
23 ILM 360 (1967); 993 UNTS 3; adopted on 16 December 1966, ratified by the South African Government on 12 January 2015 and entered into force on 12 April 2015. Article 13 provides that: “1. The State Parties to the present Covenant recognize the right of everyone to education. They agree that education shall be directed to the full development of the human personality and the sense of its dignity, and shall strengthen the respect for human rights and fundamental freedoms. They further agree that education shall enable all persons to participate effectively in a free society, promote understanding, tolerance and friendship among all nations and all racial, ethnic or religious groups, and further the activities of the United Nations for the maintenance of peace. 2. The States Parties to the present Covenant recognize that, with a view to achieving the full realization of this right: (a) Primary education shall be compulsory and available free to all; (b) Secondary education in its different forms, including technical and vocational secondary education, shall be made generally available and accessible to all by every appropriate means, and in particular by the progressive introduction of free education; (c) Higher education shall be made equally accessible to all, on the basis of capacity, by every appropriate means, and in particular by the progressive introduction of free education; (d) Fundamental education shall be encouraged or intensified as far as possible for those persons who have not received or completed the whole period of their primary education; (e) The development of a system of schools at all levels shall be actively pursued, an adequate fellowship system shall be established, and the material conditions of teaching staff shall be continuously improved.”
24 j28 ILM 1456 (1989), 1577 UNTS 3; adopted on 20 November 1989, entered into force on 2 September 1990. The Child Rights Convention was ratified by South Africa on 16 June 1995. Article 28(1)(a) and (b) provide that: “State Parties recognize the right of the child to education, and with a view to achieving this right progressively and on the basis of equal opportunity, they shall, in particular: Make primary education compulsory and available free to all; Encourage the development of different forms of secondary education, including general and vocational education, make them available and accessible to every child, and take appropriate measures such as the introduction of free education and offering financial assistance in case of need”.
25 Secretary General of the Organisation of the African Union. 1990. African Charter on the Rights and Welfare of the Child, OAU resolution 21/8/49. Addis Adaba: OAU.
26 See Section 27 and others, Education declaration mars ICESCR ratification, available at www.http://section27.org.za/2015/01/education-declaration-mars-icescr-ratification/ citing the South Africa’s declaration which states that “‘The Government of the Republic of South will give progressive effect to the right to education, as provided for in Article 13 (2)(a) and Article 14, within the framework of its National Education Policy and available resources.’

7 THE RIGHT TO A BASIC EDUCATION
(a) Non-discrimination - education must be accessible to all, especially the most vulnerable groups, in law and fact, without discrimination on any of the pro-hibited grounds.
(b) Physical accessibility - education has to be within safe physical reach, either by attendance at some reasonably convenient geographic location (e.g. a neighbourhood school) or via modern technology (e.g. access to a “distance learning” programme);
(c) Economic accessibility - education has to be affordable to all. This dimension of accessibility is subject to the differential wording of article 13 (2) in relation to primary, secondary and higher education: whereas primary education shall be available “free to all”, States parties are required to progressively introduce free secondary and higher education;
(c) Acceptability - the form and substance of education, including curricula and teaching methods, have to be acceptable (e.g. relevant, culturally appropriate and of good quality) to students and, in appropriate cases, parents
(d) Adaptability - education has to be flexible so it can adapt to the needs of changing societies and communities and respond to the needs of students within their diverse social and cultural settings.”27
2.4. Constitutional Court Jurisprudence on the right to a basic education
The South African Constitutional Court has thus far only ruled on education cases relating to the rights of learners to access schools; the obligations placed on private individuals and public officials to respect, protect, promote and fulfill the right to a basic education; and legislation governing powers and relationships amongst various role players empowered to govern, manage and oversee schools. Though the Constitutional Court has yet to interpret the content of the right to a basic education in terms of the resources that must be made available to all learners, there have been a recent surge in lower court cases that have not been heard by the Constitutional Court that have involved assertions that the right to a basic education entails a level of adequacy that the applicants were unable to realise under current laws and policies and/or the manner and extent to which laws and policies had been implemented by national and provincial governments and schools. Three of these cases concerning the right to adequate school infrastructure, textbooks and adequate teacher post provisioning will be discussed throughout this paper and will serve as examples of how the right to a basic education has been utilised to enforce learners’ rights to access adequate educational facilities and resources.
The cases in which the Constitutional Court has reviewed the right to a basic education carry three similar themes: 1) all role players, including national and provincial officials and school governing bodies, have a duty to respect, protect, promote and fulfill the right to a basic education; 2) parties seeking to vindicate disputes affecting learners’ access to schools must enter into meaningful engagement that accounts for the best interest of the learners involved; and 3) schools are public resources that must be governed in a manner that best serves the community as a whole and not only the learners and parents of learners who attend them.
In Hoerskool Ermelo28, the Constitutional Court reviewed whether a provincial official re-sponsible for ensuring spaces for all learners seeking to enroll in schools could compel the School Governing Body (SGB) for an Afrikaans language school to accept English-speaking learners in contravention of the school’s language policy. The Constitutional Court held that the SGB’s power to determine a school’s language policy is subject to Constitutional and statutory limitations and must be understood within the broader constitutional scheme to make education available and accessible to everyone, taking into consideration what is fair, practicable and enhances historical redress. In finding that the Head of Department (HoD) acted reasonably by withdrawing the School Governing Body’s power to determine its
27 General Comment 13 at 6(a)28 Head of Mpumalanga Department of Education and Other v Hoerskool Ermelo and Others [2009] ZACC 32
The cases in which the Constitutional
Court has reviewed the right to a basic
education carry three similar themes

8 Realising the Right to a Basic Education in South Africa
language policy29, the Constitutional Court emphasised that an SGB does not exclusively serve the school’s current learners. Rather, “its fiduciary duty, then, is to the institution as a dynamic part of an evolving society. The governing body of a public school must in addition recognise that it is entrusted with a public resource which must be managed not only in the interests of those who happen to be learners and parents at the time but also in the interests of the broader community in which the school is located and in the light of the values of our Constitution.”30
In Juma Musjid31 the Constitutional Court reviewed whether private property owners of land that had been leased to a public school were entitled to evict the public school after the land owners gave notice that they intended to establish an independent school on the premises and the provincial education department had failed to make timely payments for rent. The Constitutional Court ruled that the provincial authorities must respect, protect, promote and fulfill the learners’ right to a basic education. The Court stated provincial authorities had a primary obligation to further the learners’ right to a basic education by providing access to schools, but private land-owners also have an obligation in terms of Section 8 of the Constitution not to infringe upon the learners’ rights. Once the Trust allowed the school on its property, its obligation was to minimise the potential impairment of the learners’ right to a basic education.
Welkom Harmony32 represents another case in which the Constitutional Court assessed the power dynamics between School Governing Bodies and provincial officials responsible for ensuring that learners are able to access their schools. When School Governing Bodies from two schools attempted to enforce pregnancy policies requiring pregnant learners to leave school for a period of time prior to and after giving birth, the HoD for the Free State sought to have the schools’ principals disregard the schools’ policies and readmit the pregnant learners. The School Governing Bodies then filed suit to block the HoD from intervening. The Constitutional Court held that the pregnancy policies, which effectively suspended pregnant learners, were unconstitutional violations of the learners’ rights to human dignity, freedom from unfair discrimination and the right to receive a basic education. The Court ordered the schools to review their pregnancy policies in light of the requirements of the Constitution, the Schools Act and the considerations set forth in the judgment. The Court emphasised the need for constructive and meaningful engagement between provincial government officials and SGBs where the best interests of the children are involved.
In another case involving the power of the provincial government to admit a learner in contravention of an SGB’s admission policy, the Constitutional Court in Rivonia33 concluded that the Provincial Head of Department had the power to admit a learner in excess of Rivonia Primary School’s admission policy, which placed a limit on the number of learners who could be admitted to the school. There, the Constitutional Court held that while the SGB may, in terms of the South African Schools Act, determine a school’s capacity as part of its admissions policy, that power is subject to other provisions of the South African Schools Act, including that the Department maintains ultimate control over the implementation of the admissions decisions. While the Constitutional Court did find hat the HoD had not exercised his power in a procedurally fair manner, the Court held that co-operation is the compulsory norm in disputes between School Governing Bodies and national or provincial governments because “such cooperation is rooted in the shared goal of ensuring that the best interests of learners are furthered and the right to a basic education is realised”34 The Court further reminded the parties that while the SGBs have an immediate interest in the quality of children’s education and that they play an important role in improving that quality by supplementing school resources with school fees, the school is a public resource which must not only act in the interests of those learners enrolled at the time, but also account for the interests of the broader community.
In addition to the themes and legal principals outlined above, these three cases demonstrate the complex relationships and power allocations that exist amongst state officials on the one hand, mandated to ensure that all learners in South Africa have access to quality schools, and School Governing Bodies on the other, empowered to govern schools and set school policies that are subject to constitutional and legislative limitations. These power struggles are, in part,
29 While the Constitutional Court ruled that the HoD had acted lawfully by removing the SGB’s power to determine its language policy, the Court found that the HoD violated procedural aspects of the South African Schools Act by appointing an interim committee to take the place of the SGB.
30 Ermelo, at para 80.31 Juma.32 Head of Department, Department of Education, Free State Province v Welkom High School and Another; Head of Department, Department of
Education, Free State Province v Harmony High School and Another [2013] CCT 103/12.33 MEC for Education in Gauteng Province and Others v Governing Body of Rivonia Primary School and Others [2013] CCT 135/12 34 Rivonia at para 69.
The Court stated provincial authorities
had a primary obligation to further the learners’ right to a basic education by providing access to schools, but private
land-owners also have an obligation in terms of Section 8 of the Constitution not to infringe upon the
learners’ rights.

9 THE RIGHT TO A BASIC EDUCATION
attributed to the lack of clarity in the laws and policies governing the roles and responsibilities of provincial officials, schools and school governing bodies. This tension, however, may also be attributed to the system’s failure to provide schools of equitable quality. The vastly disparate levels of quality amongst schools has tended to influence SGBs to insulate their schools from overcrowding and the admission of learners who do not conform to language preferences and/or are unable to pay the school fees needed to ensure that schools attended by wealthier learners are able to continue to offer public education of a very high quality through the provision of superior human and physical resources. The legal and policy frameworks that have contributed to this context will be explored in the following chapter.
The vastly disparate levels of quality
amongst schools has tended to influence
SGBs to insulate their schools from
overcrowding and the admission of learners
who do not conform to language preferences and/or are unable to pay the school fees
needed to ensure that schools attended by wealthier learners are
able to continue to offer public education of a very high quality through the provision of superior human and
physical resources.

10 Realising the Right to a Basic Education in South Africa
STATE LEGISLATION, REGULATIONS AND POLICIES PROVIDING FOR THE REALISATION OF THE RIGHT TO A BASIC EDUCATION
South Africa’s legislative, regulatory and policy framework provides for a public education system that seeks to give rise to the realisation of the right to basic education and provides content to the right. Both the legislation governing education, as well as the vast system of public administration that has been employed to carry out this framework, and which will be described in detail below, must be governed by the democratic values and principles enshrined in the Constitution, including that:
a) A high standard of professional ethics be promoted and maintained.
b) Efficient, economic and effective use of resources must be promoted.
c) Public administration must be development-oriented.
d) Services must be provided impartially, fairly, equitably and without bias.
e) People’s needs must be responded to, and the public must be encouraged to participate in policy-making.
f ) Public administration must be accountable.
g) Transparency must be fostered by providing the public with timely, accessible and accurate information.
h) Good human-resource management and career development practices, to maximise human potential must be cultivated.
i) Public administration must be broadly representative of the South African people, with employment and personnel management practices based on ability, objectivity, fairness, and the need to redress the imbalances of the past to achieve broad representation.35
An assessment of South Africa’s legal, regulatory and policy effort must therefore consider the extent to which South Africa’s education system, both in terms of its construct and its execution, fulfils these critical values and principles as well as the realisation of the right to a basic education. Additional attention must be paid to whether the system complies with other constitutional principles such as the rights to human dignity, equality and the rights of children, including the constitutional mandate that a child’s best interest are of paramount importance in every matter concerning the child.36
3.1. The Education system under democratic South Africa
South Africa’s education system has undergone extensive reinvention since the end of apart-heid. The education system inherited in 1994 consisted of 19 distinct and separate education departments which the apartheid government had segregated by race and geography based on the Apartheid ideology of racial segregation and for which the Department of National Education controlled policy and budgetary allocations. Prior to 1994, each system had its own structure predicated on racial segregation and extreme levels of inequality in all aspects of education, including school funding; teaching quality, teacher training and qualifications;
35 South African Constitution, Section 195.36 South African Constitution, Section 28(2).
CHAPTER
3

11 STATE LEGISLATION, REGULATIONS AND POLICIES PROVIDING FOR THE REALISATION OF THE RIGHT TO A BASIC EDUCATION
curriculum; school infrastructure and educational resources such as access to textbooks and reading books. The segregated apartheid system had been constructed around the intention of advancing white privilege while at the same time limiting social and economic opportunity and mobility for blacks by educating students of different races in accordance with the social and economic roles the apartheid government expected them to fulfill.
The democratic government’s new education system, which sought to “open the doors of learning and culture to all”, replaced the segregated and splintered education departments with a single national public education system with decentralised roles allocated amongst national and provincial governments, districts and schools. Since then, a number of significant pieces of legislation have been enacted into law as well as a wide range of regulatory frameworks and policy initiatives covering all aspects of the education system, including school governance; teacher training, qualifications and post provisioning; curriculum content, grade promotion and National Senior Certificate requirements; school monitoring and support; school infrastructure; school funding; rights of learners; early childhood development; special needs education; as well as a range of others.
The Constitutional Court in Hoerskool Ermelo summarised the legal framework of South Africa’s education system as:
“An overarching design of the Act is that public schools are run by three crucial partners. The national government is represented by the Minister for Education37 whose primary role is to set uniform norms and standards for public schools. The provincial government acts through the MEC for Education who bears the obligation to establish and provide public schools and, together with the Head of the Provincial Department of Education, exercises executive control over public schools through principals. Parents of the learners and members of the community in which the school is located are represented in the school governing body which exercises defined autonomy over some of the domestic affairs of the school.”38
3.2. Key Legislation Governing South Africa’s Education System
The South African government has enacted the following significant pieces of legislation to govern the public basic education system:
� South African National Qualifications Act, 1995 (Act No. 58 of 1995)
� The South African Qualifications Act established the South African Qualifications Authority (SAQA) responsible for overseeing the development of the National Qualifications Framework and formulating and publishing policies and criteria for bodies responsible for establishing education and training standards and qualifications. The Act further empowered SAQA to oversee the accreditation of bodies responsible for monitoring and auditing achievements in terms of such standards or qualifications.
� National Education Policies Act of 1996 (Act No. 27 of 1996)
� The National Education Policies Act empowers the Minister of Basic Education to determine national policy for the planning, provision, financing, staffing, co-ordination, management, governance, monitoring, evaluation and well-being of the education system. Under this Act, which essentially functions as a framework instrument, the Minister of Basic Education is able to work with the provinces to determine national norms and standards for the education system which the provincial departments of education are in turn responsible for implementing.
� The South African Schools Act of 1996 (Act No. 84 of 1996)
37 In 2009 the Department of Education was divided between the Department of Basic Education (DBE) and The Department of Higher Education (DHE). The Court in Ermelo would have therefore been referring to what is now the position of the Minister of Basic Education.
38 Ermelo, at para 56
The democratic government’s new education system,
which sought to “open the doors of learning
and culture to all

12 Realising the Right to a Basic Education in South Africa
� The South African Schools Act provides for a uniform system for the organisation, governance and funding of schools. The Act, among other things, makes schooling compulsory for children aged 7 to 15; regulates school governance within a local structure within the school community through the creation of School Governing Bodies empowered to administer school property, recommend the appointment of staff and determine policies such as language of instruction, admission and school fees; lays out the rights of learners, including the prohibition against exclusion of learners based on entrance exams and inability to pay school fees; Establishes independent schools and Section 21 schools with the ability to control the school’s finances, including the purchase of textbooks, as well as other school services; and sets forth reporting requirements amongst school management, provincial education departments and the Department of Basic Education to be used for monitoring, support and accountability purposes. A 2007 amendment to the Act empowers the Minister of Basic Education to set regulations governing minimum norms and standards for school capacity, infrastructure and the provision of learning and teaching support materials and sets forth accountability mechanisms through which provinces are responsible for reporting compliance with norms and standards, and if they have not been complied with, measures that will be taken to comply.
� Higher Education Act, 1997 (Act No. 101 of 1997)
� The Higher Education Act regulates the Higher education system by providing for the establishment, composition and functions of a Council on Higher Education, the establishment, governance and funding of public higher education institutions, the appointment and functions of an independent assessor, registration of private higher education institutions, and quality assurance and quality promotion in higher education.
� Employment of Educators Act, 1998 (Act No. 76 of 1998)
� The Employment of Educators Act provides for the employment of educators by the State and regulates the conditions of service, discipline, retirement and discharge of educators.
� Adult Basic Education and Training Act, 2000 (Act No. 52 of 2000)
� The Adult Basic Education and Training Act provides for: (1) the establishment, governance and funding of public adult learning centres; (2) registration of private adult learning centres; (3) and quality assurance and quality promotion in adult education and training.
� General and Further Education and Training Quality Assurance Act, 2001 (Act No. 58 of 2001)
� The General and Further Education Training Quality Assurance Act provides for monitoring and quality assurance of general and further education and training through the establishment of the General and Further Education and Training Quality Assurance Council. The Act also provides for the control over norms and standards of curriculum and assessment and regulation over the issuance of certificates at exit points and the conduct of assessments.
� Education Laws Amendment Act, 2005 (Act No. 24 of 2005)
� This Act, among other things, amended SASA to authorise the Minister of Basic Education to declare schools in poverty-stricken as “no-fee schools”.
� National Qualifications Framework Act, 2008 (Act No. 67 of 2008)
� The National Qualifications Framework Act provides for the establishment of the national qualifications framework, a qualifications system used to recog-nise learner qualifications and achievements from grade 9 through doctoral degrees. The Act mandates the South African Qualifications Authority (SAQA) to (1) develop, foster and maintain an integrated and transparent qualifications framework; (2) ensure that South African qualifications meet criteria determined by the Minister of Education; and (3) ensure that South

13 STATE LEGISLATION, REGULATIONS AND POLICIES PROVIDING FOR THE REALISATION OF THE RIGHT TO A BASIC EDUCATION
African qualifications are of an acceptable quality. This Act replaced the South African Qualifications Authority Act of 1995 which first established the National Qualifications Framework.
� The Further Education and Training Colleges Amendment Act, 2013 (Act No. 1 of 2013)
� This Act, among other things, amends the Further Education and Training Colleges Act of 2006 to provide for the addition of Community Education and Training Colleges.
In 2009, the Department of Education was split into two separate departments, each of which is overseen by its own Minister. Under this division, the Department of Basic Education (DBE) is responsible for governing South Africa’s primary and secondary education system and the Department of Higher Education and Training (DHET) is responsible for overseeing all post-school education and training institutions, including all higher education institutions, colleges and adult education institutions, as well as the skills levy institutions formerly under the Department of Labour.
Key institutions empowered to oversee the implementation of education laws and policies and ensure quality and compliance
� The South African Council of Educators (SACE) is empowered under the Employment of Educators Act, 1998 and then subsequently in the South African Council of Educators Act, 2000 to register educators, set qualification standards governing the registration of educators and advises the Minister on matters relating to the education and training of educators, including standards for pre-service and in-service training programmes.
� The Council for Quality Assurance in General and Further Education and Training (UMALUSI) is mandated under the National Qualifications Act, 2008, as council for the qualifications authority, to set and monitor standards for general and further education and training, including certification and quality assurance of the National Senior Certificate and teacher training degree and certificate programmes. In order to issue learners with certificates that are credible, Umulasi develops and evaluates qualifications and curricula to ensure that they meet expected standards; moderates assessments to ensure that they are fair, valid and reliable; accredits providers of education and training and assessments; conducts research to ensure educational quality; and verifies the authenticity of documents.
� National Education Evaluation and Development Unit (NEEDU) is an independent body tasked with evaluating and reporting on the quality of teaching and learning in South African Schools. Through visits to schools and district offices, interviews with personnel, classroom observations and learner assessments, including reviews of learners’ written work and other methodologies, NEEDU identifies the factors that inhibit or advance school improvement; analyses and identifies approaches and strategies necessary for achieving equality in the provision of quality education; evaluates the way in which provincial education departments monitor and evaluate schools; evaluates the support that schools receive from the education districts and departments; evaluates the state of South African schools, including the quality of school leadership, teaching and learning; and publishes reports on the state of the education system.39
� Education Labour Relations Council (ELRC) is a bargaining council that serves the public education sector nationally and provincially. The stated purposes of the ELRC are to promote the maintenance of labour peace in the public sector through the provisioning of dispute resolution and prevention services, as well as through the facilitation of negotiations between trade unions and the state as the Employer.
39 See DBE, 9 Feb 2012 Press Release, National Education Evaluation and Development Unit (NEEDU) Bill: Call for Comments, available at http://www.gov.za/national-education-evaluation-and-development-unit-needu-bill-call-comments.
In 2009, the Department of
Education was split into two separate
departments, each of which is overseen by its
own Minister.

14 Realising the Right to a Basic Education in South Africa
Key government planning documents developed to guide education policy and monitor the progress of South Africa’s public education systemThe DBE and other Departments and Commissions within national and provincial governments have published a number of planning documents that guide South Africa’s basic education system. Some of the key planning documents include the following:
� Action Plan to 2014 – Towards the Realisation of Schooling 2025 (2011).
� In 2010, the Minister of Basic Education, along with all nine provincial education ministers, signed a delivery agreement with the Presidency’s Department of Planning, Monitoring and Evaluation to undertake the following four outputs: (1) improving the quality of teaching and learning through improved teacher capacity and practices and increased access to high quality learning materials; (2) undertaking regular assessments to track progress; (3) improving early childhood development through universal access to grade R and improved quality of early childhood development programmes; and (4) ensuring a credible, outcomes-focused planning and accountability system through strengthened school management and district office capacity. To monitor the progress towards these outcomes, the DBE produced its Action Plan to 2014 policy document in 2011. That plan lists 27 goals and 37 indicators used to assess progress towards achieving those goals. The first 13 goals deal with measurable indicators relating to testing performance, enrolment and throughput that can be used to assess the impact of policy interventions on learning outcomes. The final 14 goals measure the quality of inputs necessary to achieve improved outcomes. Inputs measured include teacher professionalism and teaching skills; school infrastructure; access to textbooks and workbooks; school-level access to district monitoring and support; school management and curriculum coverage; the implementation of the inclusive education policy and improved access to special needs schools; and reduction of classroom size. The DBE has thus far reported twice on its progress towards achieving these goals in its 2011 Action Plan to 2014 and 2015 Action Plan to 2019 reports. The DBE has also undertaken School Monitoring Surveys in over 2000 schools to monitor progress towards the achievement of the input goals. The School Monitoring Survey was first conducted in 2011 and is scheduled to be repeated in 2015.
� National Development Plan 2030: Our future – make it work (2013)
� The National Development Plan (NDP) was released by the Presidency’s National Planning Commission in 2013 with the objective of creating a cohesive policy framework to eliminate poverty and reduce inequality in South Africa by 2030. The NDP sets a number of goals and actions to be achieved by 2030, as well as identifies core challenges that must be addressed in order to achieve the economic and social progress envisaged. Basic education plays a prominent focus in the plan given its fundamental role of building capabilities necessary for economic growth to occur. The NDP stresses that the quality of education for most black children is poor, resulting in denied access to employment and reduced earnings potential and job mobility for learners, as well as limited economic opportunity and growth for businesses. The NDP focuses on the need to provide quality early childhood education, including two and improve (1) management of the education system and district support to schools; (2) the competence and capacity of school principals; and (3) teacher performance through enhanced training, professional development, teacher recruitment and retention and accountability measures. The development of school infrastructure and need to improve the provisioning of learning and teaching support materials are also identified as development priorities.
� Medium Term Strategic Framework (MTSF)
� The MTSF document was produced by the Presidency and seeks to translate the National Development Plan into actions to be taken during the 2014 – 2019
The DBE and other Departments and
Commissions within national and provincial
governments have published a
number of planning documents that guide
South Africa’s basic education system.

15 STATE LEGISLATION, REGULATIONS AND POLICIES PROVIDING FOR THE REALISATION OF THE RIGHT TO A BASIC EDUCATION
election cycle. The MTSF addresses 14 priority outcomes, including education. The MTSF sets a number of enrolment, testing assessment, throughput and graduation targets to be achieved by 2019 and 2030. A number of Actions, Indicators, Baselines and Targets are listed in the MTSF that seek to monitor and improve (1) teaching and learning; (2) provision of school infrastructure and learning materials; (3) regular national assessments; (4) access to Grade R and the extension of early childhood development programmes; (5) planning and accountability systems; and (6) partnerships.
� Strategic plan of the DBE 2014 – 2019
� The strategic plan guides each annual performance plan for the DBE. It is required by treasury and is primarily focused on how the DBE will allocate and expend its budget to improve the basic education system. Because the majority of education spending comes from provincial education department budgets, provinces are responsible for developing their own five-year strategic and annual performance plans.
3.3. Review of Legislation, Regulations and Policies Relating to Access to Basic Education
The South African Government and Department of Basic Education have developed an exten-sive legislative and policy framework in furtherance of the state’s obligations to ensure the rights of learners to have access to schools. As a result of the post-1994 system, access and commensurate enrolment rates have increased to near universal enrolment for children of compulsory schooling age.
South Africa’s Department of Basic Education now oversees 13 years of formal schooling from Grade R through Grade 12. The Foundation phase runs from Grade R through Grade 3 while the intermediate phase runs from Grade 4 through 6 and the Senior phase runs from grades 7 through 9. Section 3 of the South African Schools Act makes education compulsory for children between the ages of 7 and 15 or through the completion of grade 9, whichever occurs first. The Further Education and Training (FET) phase runs from grades 10 through 12.
3.4. Access to ordinary schools
Compulsory AttendanceSection 3(1) of the South African Schools Act (SASA) makes education compulsory for children between the ages of 7 and 15 or through the completion of grade 9, whichever occurs first, and mandates that parents must cause every learner for whom he or she is responsible to attend a school during this compulsory period.40 Moreover, the National Policy for Learner Attendance (2010) requires all schools to monitor attendance and intervene where learners are absent for extended periods of time. SASA places a further obligation on provincial Member of the Executive Council (MEC) to ensure that there are enough school places so that every child who lives in his or her province can attend a public school as required by the Act.
Section 3(2) of SASA requires the Minister of Basic Education to determine the ages of compulsory attendance at schools for learners with special needs. However, to date the Minister has not made such a determination.
While school attendance is limited in application to children up to the age 15, consideration must also be paid to policies that impact the ability of learners to complete primary and secondary schooling. Laws and policies which impact retention rates are particularly important in South Africa’s context given the high rate of learners who drop-out of the education system after grade 9. In 1998, the then Minister of Education in South Africa
40 Section 3(6)(a) of SASA criminalises a parent’s failure to ensure the education of his or child by providing that “any parent who, without just cause and after a written notice from the Head of Department, fails to comply with subsection (1), is guilty of an offence and liable on conviction to a fine or to imprisonment for a period not exceeding six months”
The South African Government and
Department of Basic Education have
developed an exten-sive legislative and
policy framework in furtherance of the state’s obligations
to ensure the rights of learners to have access to schools.

16 Realising the Right to a Basic Education in South Africa
responded to the impact that a rapid rise in school enrolment had on educational and fiscal resources by implementing a policy restricting the ability of over-aged learners from enrolling in schools. The Department of Education’s theory was that many of the over-aged learners were learning little, were unlikely to pass matric and therefore faced low employment prospects regardless of enrolment and were diverting resources from younger learners. The issue of over-aged learners was particularly problematic where classrooms were overcrowded and stretched budgets left little in the way for improvements to the system suffering from massive backlogs.41
The Department responded to these concerns, which were raised at a time when over 60% of grade 12 learners were older than the correct grade-age, by publishing its policy on the Age Requirements for Admission to an Ordinary Public School. This policy, which defined the appropriate age for admission to a certain grade as “the grade number plus 6”, called for schools to fast-track learners and refer over-aged learners older than 16 to adult education centres and specified that schools could only hold repeat learners once during each of the four phases of education. The result was that the number of over-aged learners decreased by 865 000 between 1999 and 2003. Burger, van der Berg and von Fintel show that this policy significantly contributed to an increase in South Africa’s unemployment rate from 36.4% to 41.8% between the years 1997 and 2003 as a result of the labour force participation rate increasing by 11.8% from 56% to 67.8%.42 Moreover, matric candidates decreased by 20% during the years 1998 to 2003 while this policy remained in place.43
These findings demonstrate the careful balancing that the DBE must take with respect to implementing policies that impact the ability of learners to complete their primary and secondary education. 2014 General Household Survey StatsSA statistics show that a substantial percentage of learners enrolled in primary and secondary schools are over-aged with 30,2% of 14-year olds and 13,5% of 15-year olds enrolled in primary schools and 42,9% of 19 year-olds, 25,3% of 20 year-olds, 13,3% of 21 year-olds 6,6% of 22 year-olds and 3,4% of 23 year-olds enrolled in secondary schools.44 While it is a challenge for the basic education system to accommodate learners who are older than their correct cohort, policies dictating enrolment requirements and age limitations must be implemented in a manner that accounts for and accommodates the challenges faced by learners that could lead to over-aged learners. These challenges include late-aged enrolment, lack of access to adequate early childhood development programmes resulting in primary school learners who are inadequately prepared to enter the school system; language barriers; and literacy and numeracy backlogs caused by inadequate primary-level schooling. Enrolment policies must also account for poverty-related challenges that implicitly impact learners’ ability to achieve in school such as learners who come from illiterate households, HIV/AIDS-affected communities, child-headed households and other challenges that can affect a child’s ability to show up at school on-time every day and ready to learn.
3.5. School Admissions and the rights of learners to access schools
Many parents of learners in South Africa are well aware that a vast disparity exists between schools and the quality of education that different schools are able to provide to South African learners. As a result, in part, of massive inequalities that have been carried over into post-apartheid South Africa, schools in wealthier areas are far better resourced and able to provide superior levels of education than most schools located in poor communities. While the DBE has cited school fee exemptions as a redistributive policy that has enabled some learners to access better quality schools that they otherwise would be unable to afford, school admissions policies, if unlawfully determined or implemented, can have the unfortunate and unlawful effect of maintaining segregation based on race, language, culture or socio-economic class if not properly monitored. Lack of access to better resourced schools in more affluent areas is also
41 Burger, R., van der Berg, S., von Fintel, D. 2012. ‘The unintended consequences of education policies on South African Participation and Employment.’ Stellenbosch Working Papers 11/2012. & the Equal Education Law Centrevestigtion of Economics, tion. Pretoria, Educationary School & others 2013 (6) SA 582(CC) ic eu & the Equal Education Law Centrevestigtion of Economics, tion. Pretoria, Educationary School & others 2013 (6) SA 582(CC) ic eu
42 Ibid.43 Ibid.44 StatsSA. 2015. ‘General Household Survey 2014 - Statistical Release P0318.’ Pretoria: Statistics South Africa. Available at http://www.statssa.gov.
za/publications/P0318/P03182014.pdf
The Department responded to these
concerns, which were raised at a time when over 60% of grade 12 learners were older
than the correct grade-age, by publishing
its policy on the Age Requirements for Admission to an
Ordinary Public School.

17 STATE LEGISLATION, REGULATIONS AND POLICIES PROVIDING FOR THE REALISATION OF THE RIGHT TO A BASIC EDUCATION
problematic, as schools serving poor communities are often overcrowded. Wealthier schools, on the other hand, are able to offer far smaller classroom sizes through superior infrastructure featuring adequate classroom space and greater number of classrooms combined with fee-subsidised additional teacher posts. The Ermelo and Rivonia Constitutional Court judgments discussed above touched on the impact that access to schools has on the right to a basic education through assessing the powers and limitations of School Governing Bodies to refuse admission based on the school’s language or capacity policy determinations. It is therefore important to assess laws and policies affecting school admissions in the context of Constitutional notions of freedom and equality and SASA’s goal of redressing past injustices through the provision of education and access to quality public schools.
The South African Schools Act and the DBE’s Admission Policy for Ordinary Public Schools govern the rights of learners and schools with respect to the development of school admissions policies and the implementation of admissions decisions.
Section 5 of SASA, which, among other things, empowers a school’s SGB to determine its admissions policy, prohibits schools from unfairly discriminating against learners during the admissions process and prohibits public school SGBs, principals and other school administrators, from administering admissions tests related to the admission of any learners. Finally, no learners may be refused admission to a public school on the grounds that his or her parents are unable to pay, or have not paid, school fees, does not subscribe to the school’s mission statement or has refused to enter into a contract waiving claims for damages arising out of the education of the learner.
The Department of Basic Education’s admission’s policy for ordinary public schools sets forth additional powers, responsibilities and limitations with respect to Provincial Education Departments (PEDs) and SGBs in terms of the administration, determination and implementa-tion of admission policies and decisions. The policy also sets forth the admissions procedures that parents must follow when applying for admission to a school; extends the right of admission to non-citizens when certain conditions are met and addresses circumstances under which ordinary schools must accommodate learners with special education needs and the responsibilities of schools and HoDs to refer learners elsewhere when educational needs cannot be provided for.
HoDs are empowered under the admissions policy, after consultation with representatives from school governing bodies, to determine feeder zones for ordinary public schools in order to control the learner numbers of schools and to co-ordinate parental preferences. Once created, preference for school admission is first given to learners whose parents live in the feeder zone, second to learners whose parents work in the feeder zone and third to other learners on a first come, first served basis.
A school’s capacity determination is also relevant in admissions decisions since it enables schools to limit the size of their classrooms. This is particularly relevant for wealthier schools that, either through inheriting superior infrastructure or having constructed additional classrooms via school fee funds, are able to offer, among other things, smaller classrooms by limiting the number of learners admitted. Parliament amended SASA in 2007 to empower the minister to set norms and standards for school capacity in respect of the number of learners a school can admit. The Minister of Basic Education, however, has not exercised this power and as a result, conflicts have emerged amongst schools who have implemented their own capacity policies to limit the number of learners who may attend the school, provincial education departments who are tasked with the responsibility of ensuring that all learners are able to enroll in schools and parents and learners who seek to vindicate their rights to attend quality schools that are not overcrowded.45
45 See eg MEC for Education in Gauteng Province and Others v Governing Body of Rivonia Primary School and Others [2013] CCT 135/12 described above where school provincial education department sought to force a school to enroll a learner in excess of the school’s capacity policy.
A school’s capacity determination is also
relevant in admissions decisions since it enables schools
to limit the size of their classrooms.

18 Realising the Right to a Basic Education in South Africa
3.6. School Fees and the rights of learners to economically access schools
One of the central components of the construct of South Africa’s post-apartheid’s public education system has been the state’s decision to decentralise public education to the provinces and empower schools with the autonomy to, among other things, charge school admission fees. Under this system, schools are provided with teacher and school administrator posts which are paid for directly by provinces and allocated to schools based on learner enrolment.46 Additional base funding is also provided to schools for other necessary inputs such as physical resources and learning and teaching support materials, including textbooks and stationary. Schools are empowered to charge school fees to supplement the base-level of human and physical resources which the province supplies to schools either directly or through the provision of school funds. School fees may be used to improve a school’s physical resources or add additional resources such as classroom space, sports facilities, fully stocked libraries and computer and science laboratories. Fees may also be used to hire additional teachers so learners may have access to additional courses, as well as increase teacher : learner ratios so classroom sizes may be decreased.
The implementation and expansion of no-fee schools has been a significant development in terms of providing access to basic education for poor South Africans. However, the issue of school fees, who must pay them and the provision of adequate funding and human and physical resources to schools serving learners who do not pay fees continues to substantially impact the ability of learners to access schools of an adequate quality and remain in school through the completion of secondary education. Moreover, the ability of SGBs to charge school fees has resulted in the consequence that much of the inequality from apartheid has carried over into today’s post-democracy public education system where public schools attended by wealthy learners continue to provide far greater resources than are made available at the schools attended by the vast majority of South Africa’s youth.47
School fee exemptions and the rights of poor learners to access schools that charge feesIn furtherance of its stated purpose to “redress past injustices in educational provision [and] provide an education of progressively high quality for all learners”48, SASA contains redistributive mechanisms that enable learners from poor households to attend fee-charging schools through fee exemptions. Section 5(3)(a) of SASA prohibits schools from refusing admission to a public school on the grounds that the applicant’s parent is unable to pay the school fees determined by the SGB. Section 40 of SASA provides that partial or total fee exemptions must be made available to parents unable to pay school fees. Fee-paying schools are not compensated for admitting fee exempt learners. Non-paying learners are thus effectively subsidised by learners whose parents are able to afford to pay school fees.
In 2006, the Department of Education enacted Regulations Relating to the Exemption of Parents from Payment of School Fees in Public Schools. Those regulations, among other things, set out the procedures that must be followed by parents and SGBs when parents apply for partial or total school fee exemptions and entitles parents to full exemption if school fees account for more than 10% of the combined annual gross income of the learners’ parents. The regulations further exempt certain children, automatically, from paying school fees, including orphans in orphanages and child headed households, learners whose parents receive a social grant on their behalf such as the Child Support Grant, and learners in the care of foster parents.
There has been a great deal of concern expressed over whether schools that have an interest in admitting fee paying learners are acting appropriately when determining whether to admit
46 Schools are empowered to charge school fees through Section 39 of SASA. Moreover, a school community’s decision to impose school fees is largely consistent with Section 36 of SASA, which mandates that SGBs must take all reasonable measures within their means to supplement the resources supplied by the State in order to improve the quality of education provided by the school to all learners at the school.
47 See Department of Education, Norms and Standards for School Funding, 2006 at p. 10. “Ironically, given the emphasis on redress and equity, the funding provisions of the Act appear to have worked thus far to the advantage of public schools patronised by middle-class and wealthy parents. The apartheid regime favoured such communities with high-quality facilities, equipment and resources. Vigorous fund-raising by parent bodies, including commercial sponsorships and fee income, have enabled many such schools to add to their facilities, equipment and learning resources, and expand their range of cultural and sporting activities. Since 1995, when such schools have been required to down-size their staff establishments, many have been able to recruit additional staff on governing body contracts, paid from the school fund.”
48 SASA preamble
The implementation and expansion of
no-fee schools has been a significant
development in terms of providing access
to basic education for poor South Africans.

19 STATE LEGISLATION, REGULATIONS AND POLICIES PROVIDING FOR THE REALISATION OF THE RIGHT TO A BASIC EDUCATION
poor learners or approve fee exemptions.49 Moreover, while Section 40(2) of SASA entitles parents who have been denied fee exemptions to appeal the SGB’s decision to the HoD, United Nations Special Rapporteur on the right to education Katarina Tomaskevski has questioned the validity of these safeguards because “the procedure [to help poor parents get an exemption] assumes that all parents are literate and can cope with the necessary paperwork, which is not the case.”50 While 6.7% of learners in 2013 have reported benefitting from total or partial fee exemptions or partial bursaries, this figure includes both learners attending public and private schools.51
The issues of school fees and exemptions are particularly concerning when one considers the history of former Model C schools that were allocated far greater physical resources during apartheid than non-white schools.52 Former Model C schools continue to enroll wealthier learners who through the imposition of school fees, are afforded even greater physical and human resources, including smaller classroom sizes due to enhanced classroom space and additional SGB-funded teacher posts, greater curriculum options, fully stocked school libraries, computer and science facilities and sports fields. Not surprisingly, these former Model C schools have far more successful outcomes than schools attended by learners in poor township and rural communities. As the Constitutional Court, however, made clear in Ermelo and Rivonia, SGBs must recognise that they are entrusted with public resources which must be managed not only in the interests of learners who currently attend schools but also in the interests of the broader community. As such, SGBs must make their schools available and accessible to the community at large and are therefore prohibited from imposing certain policies or taking prohibited actions that effectively bar certain learners from gaining admission based on socio-economic status, race or culture. Given the need for high quality state resources to be available for everyone and not just privileged and wealthy learners, as well as the interest of having integrated schools that reflect South Africa’s diverse racial, cultural and socio-economic construct, it is of vital necessity that the DBE and provincial education departments oversee the lawful and transparent implementation of fee exemption policies to ensure that schools are not unlawfully prohibiting certain learners from qualifying for admission. The provincial education departments should be proactive in overseeing school determinations of applications for fee-exemptions since it is clear, as set out above, that schools have a financial incentive to deny admission to non-fee paying learners and, as Tomaskevski stressed, it is often the case that parents, particularly from poor households, are ill-equipped to maneuver through the appeals process.
Access to no-fee schoolsSouth Africa’s implementation of no-fee school polices has been an important development in terms of ensuring that all learners are able to access schools regardless of their socio-economic circumstances. Concerns, however, have been raised that the implementation of policies that enable learners to access no-fee schools do not go far enough both in terms of expanding access to no-fee schools and ensuring that no-fee schools are sufficiently funded through means other than the collection of school fees. In her 2006 report on the State of the Right to Education Worldwide: Free or Fee: 2006 Global Report, former United Nations Special Rapporteur on the right to education Katarina Tomaskevski found that “[t]he post-apartheid government has not managed to universalize education or to make it free after a full decade of having in place a constitutional guarantee of basic education for all.”53
In 2005, the South African Schools Act was amended to provide for a process to establish norms and standards for school funding by means of a quintile system that seeks to categorise schools
49 Woolman and Fleisch have commented extensively on the conflict of interest that inherently exists at fee-charging schools where “the conflict between open enrolment, school fees and fee exemption genrates the somewhat perverse, but expected, consequence that parents of children entitled to full or partial exemption from fee payment (because their family meets the statutory test for relief ) are often coerced into paying fees...SGBs have a vested interest in intimidating parents into paying fees beyond their means and in dissuading parents who cannot pay those fees from seeking admittance for their children.” Constitution in the Classroom, at p. 30. There have also been a number of court cases and appeals that have been launched on behalf of parents of learners who had either been discriminated through denial of school admissions or who had not received exemptions when they should have otherwise qualified. See eg Centre for Applied Legal Studies and Others v Hunt Road Secondary School and Others, Case No. 10091/2006. High Court of South Africa, Durban and Coast Local Division (DCLD) [Unreported]; Dean Carelse v MEC, Western Cape Education Department & Others [WCHC] 21602/2012. and Michelle Saffer v HOD, Western Cape Education Department & Five Others (WCHC) 18775/13
50 Tomaskevski, Katarina, State of the Right to Education Worldwide: Free or Fee: 2006 Global Report, Copenhagen, August 2006, at 58 – 61. Available at www.katarinatomasevski.com/images/Global_Report.pdf.
51 StatsSA. 2014. ‘General Household Survey, 2013 – Statistical Release P0318.’ (18 June 2014), 19. Pretoria: Statistics South Africa. Available at www.statssa.gov.za/publications/P0318/P03182013.pdf
52 DoE. 1996. Education White Paper 2: The Organisation, Governance and Funding of Schools, 42. Available at http://www.education.gov.za/DocumentsLibrary/Legislation/WhitePapers/tabid/191/Default.aspx.
53 Tomaskevski, K. 2006. The State of the Right to Education Worldwide: Free or Fee: 2006 Global Report, Copenhagen, 58.

20 Realising the Right to a Basic Education in South Africa
according to poverty rankings. Under this system, Norms and Standards Funding provides for greater levels of non-personnel funding to schools serving poor communities to compensate them for revenue they do not collect through school fees. This funding is used to pay for non-personnel expenditures such as school maintenance, books and stationary. Quintiles are established on a national basis to account for the income and wealth of the surrounding school communities, with schools located in the poorest communities classified as Quintile 1 and schools serving the wealthiest communities classified as Quintile 5.54 In 2006, the Department of Education declared all Quintile 1 and 2 schools to be no-fee schools, meaning they were prohibited from charging school fees to supplement the school’s finances and are instead were compensated through increased government per-learner allocation. Parents are, however, allowed to make voluntary contributions to no-fee schools. The DBE expanded no-fee schools to all schools classified as Quintiles 1, 2 and 3 in 2009 and in 2014, more than 60% of learners attending public schools in South Africa did not pay school fees.
At the beginning of each year the DBE amends the Norms and Standards for School Funding to update the Schedule and National Table of Targets for the School Allocation to detail the funding that each school is entitled to receive. The Schedule also features the National Poverty Distribution Table, which lists the percentage of learners in each province that attend no-fee public schools.
The development of no-fee school policies has resulted in a significant increase in learners who do not pay tuition fees from just 2.9% in 2006 before this policy had gone into effect to 65.4% in 2014.55 Provincially, 92% of learners in Limpopo and 81.5% of learners in the Eastern Cape attended no-fee schools in 2014 while 40.7% of learners in the Western Cape and 45.3%% of learners in Gauteng Provinces pay no school fees. Moreover, 7.2% of learners benefitted from fee reductions or partial bursaries in 2014.56
Learners who attend no-fee schools or who receive fee exemptions, however, continue to have educational costs by way of school uniforms, books, stationary and transportation. Moreover, there have been reports of Quintile 1 through 3 schools continuing to charge school fees despite their no-fee classifications, indicating that improved monitoring systems need to be developed and implemented to ensure that attendance at no-fee schools is not predicated on school fees or other costs.57
Additional concerns have been raised around how schools have been classified into quintiles and whether the system adequately allocates no-fee status and commensurate funding to all schools serving poor learners. Because the quintile classification is based on the socio-economic conditions of the surrounding school communities rather than the circumstances of the learners who actually attend the schools, there is concern that schools that primarily serve poor learners in areas adjacent to wealthier neighborhoods will be mis-classified. This problem particularly occurs in urban areas where informal settlements or townships are situated near wealthier areas and further ignores the reality that many learners travel from poorer communities to schools that are equipped with superior teachers and facilities. Moreover, the DBE uses census data to determine each school’s poverty score, which often becomes quickly outdated in areas with high rates of urban migration. The result is that many schools have learner populations that do not necessarily reflect the populations of surrounding communities. This shortcoming therefore causes poor learners to either pay school fees or go through the rigorous process of applying for fee exemptions that can in turn cause their schools to be inadequately funded.
Despite the state’s significant expansion of access to no-fee schools, school fees (in addition to other schooling costs) continue to act as barriers to learner enrolment and have been found to contribute to South Africa’s high drop-out rate prior to the completion of grade 12. The 2014 GHS found that 23.5% of persons aged 7 to 18 cited “no money for school fees” as the main reason for not attending an education institution.58 This figure indicates that issues surrounding school fees, including quintile determinations, should be further explored and that no-fee and fee waiver policies and implementation efforts should be enhanced and monitored to ensure that learners are able to complete their schooling.
54 The DBE amends the National Norms and Standards for School Funding Limpopo has the highest number of Quintile 1 schools where 28.2% of schools located in the Province have been classified as Quintile 1 Schools. 27.3% of
55 StatsSA. 2015. General Household Survey 2014 - Statistical Release P0318. Pretoria: Statistics South Africa. 27 May 2015, p 20.56 Ibid.57 See eg. Mtshali, N. ‘No-fee school forcing parents to pay.’ iol News. 25 July 2013. Available at: http://www.iol.co.za/news/crime-courts/no-fee-
school-forcing-parents-to-pay-1.1552430#.VYrCW1yqqko.58 StatsSA. General Household Survey 2014 - Statistical Release P0318. Pretoria: Statistics South Africa. 27 May 2015, p 20. Available at http://
www.statssa.gov.za/publications/P0318/P03182014.pdf.
The development of no-fee school policies
has resulted in a significant increase in learners who do not pay tuition fees from
just 2.9% in 2006 before this policy had gone into effect to 65.4%
in 2014.

21 STATE LEGISLATION, REGULATIONS AND POLICIES PROVIDING FOR THE REALISATION OF THE RIGHT TO A BASIC EDUCATION
RECOMMENDATIONS1. Provincial education departments should take steps to ensure that schools are
transparent and acting appropriately when making admission and fee-waiver determinations, particularly given the incentive that schools have to deny admission to learners who are unable to pay school fees. Measures should include the development of databases used to track admission and fee-waiver applications to schools, demographic information about applicants applying for admission and fee-waivers and admission and fee-waiver determinations made by schools. Education districts should monitor determinations made and proactively offer support to parents of learners who have been improperly denied admission or fee-waivers.
2. Efforts should be made by national and provincial education departments to ensure that parents understand their rights when it comes to applying for fee waivers.
3. Issues surrounding school fees and other school costs should be further investigated to better understand how quintile determinations may better reflect the poverty characteristics of the actual learners who attend schools and not just the surrounding school communities. Findings should be used to implement improved measures that ensure that all learners have access to no-fee schools or are able to gain fee waivers at schools that do charge fees.
4. The Minister of Basic Education should promulgate regulations governing norms and standards for school capacity.
Access to teaching and learning in a language that is accessible to learnersSouth Africa has long emphasised the important role that language in the classroom plays with respect to enabling learners to access quality basic education, comprehend the curriculum and achieve in school. The DBE in its 2010 report on the Status of Language of Learning and Teaching (LOLT) in South Africa stressed that “where learners do not speak the language of instruction, authentic teaching and learning cannot take place” and that “such a situation largely accounts for school ineffectiveness and low academic achievement experienced by students in South Africa.”59 The World Bank has further stressed the finding that learning in one’s own language holds various advantages for learners, including increased access, improved learning outcomes, reduced chances of repetition and drop-outs and socio-cultural benefits. 60Further studies have shown that in South Africa’s context, mother tongue instruction during the Foundation Phase of learning significantly improves English language acquisition in later grades.61 South African language policies have therefore focused on encouraging the use of home language as the LOLT during the Foundation phase and then transitioning learners to English or Afrikaans instruction in grade 4. Carrying out these language policies in schools, however, has proven to be a complex and difficult endeavor, particularly for the approximately 84% of learners attending schools who do not speak English or Afrikaans as a home language due to the fact that:
1. there are 11 official languages in South Africa
2. There is a shortage of teachers in the system qualified and skilled at teaching in African home languages,
3. SGBs are responsible for determining the school’s language policies including LOLT and many parents prefer their children to be taught in English even if that is not the language spoken at home, and
4. teaching materials are often not properly procured for learners speaking African home language, which accounts for the vast majority of South Africa’s learners.
59 DBE. 2010. The Status of the Language of Learning and Teaching (LOLT) in South African Public Schools: A Quantitative Overview. Pretoria. Available at http://www.education.gov.za/DocumentsLibrary/Reports/tabid/358/Default.aspx.
60 Ibid, citing World Bank. 2005. In their own language. Education for All. Education notes. Retrieved from: http://siteresources. worldbank.org/EDUCATION/Resources/Education-Notes/EdNotes_Lang_of_Instruct.pdf.
61 See eg Taylor, S. and Coetzee, M. 2013. ‘Estimating the impact of language of instruction in South African Primary Schools: A fixed effects approach.’ University of Stellenbosch. Stellenbosch Working Papers: 21/13. Available at http://www.ekon.sun.ac.za/wpapers/2013/wp212013.
There is a shortage of teachers in the system
qualified and skilled at teaching in African
home languages

22 Realising the Right to a Basic Education in South Africa
The issue of language in South African classrooms therefore raises two main concerns. Firstly, learners must have access to Foundation Phase instruction in their mother tongue so that they are able to understand the curriculum being taught to them. Secondly, learners must be prepared during the Foundation Phase to transition into English or Afrikaans language of instruction by grade 4 so they are capable of understanding the curriculum at that stage going forward. Addressing these challenges is particularly complex in South Africa’s context given that only 7.1% of learners attending South African ordinary schools speak English as a home language while 67.7% of learners attend classes in English LOLT.62
Language rights and policies with respect to the state’s obligation to make public basic education available and accessible to learners in the language of his or her choice are set forth in the South African Constitution, the South African Schools Act and the Language in Education Policy of 1997.
3.7. Laws and policies affecting the rights of learners to access education in his or her home language
The Constitution and Language in SchoolsSection 29(2) of the South African Constitution provides that “everyone has the right to receive education in the official language or languages of their choice in public educational institutions where that education is reasonably practicable.” The Constitution further provides that “[i]n order to ensure the effective access to, and implementation of, this right, the state must consider all reasonable educational alternatives, including single medium institutions, taking into account (a) equity; (b) practicability and (c) the need to redress the results of past racially discriminatory laws and practices.” The DBE has interpreted this provision to mean that “although the constitution affords learners the right to learn in the language(s) of his or her choice, this right is tempered by the state’s ability to provide for its implementation.”63
The South African Schools Act and Language in SchoolsSection 6 of the SASA authorises the Minister of Basic Education to determine norms and standards for language policy in public schools and empowers a school’s SGB to determine its school’s language policy subject to the Constitution, SASA and provincial law. SASA further prohibits the practice of racial discrimination when implementing language policies and recognises sign language as a language of teaching and learning for deaf learners.
Language in Education Policy, 1997The DBE has emphasised that the underlying principle of the Language in Education Policy (LiEP) is to maintain the use of home language as the language of learning and teaching (LOLT), especially in the foundation phase, while at the same time incrementally providing for access to additional languages.64 Accordingly, under the LiEP, the LOLT provided by a school depends to a large extent on the language choices made by learners and parents since SASA empowers each school’s SGB to determine the LOLT at that school. The LiEP further provides for the following:
� All learners shall be offered at least one approved language as a subject in grades 1 and 2.
� From Grade 3 and up, all learners shall be offered their LOLT and at least one additional approved language as a subject.
� All language subjects shall be allocated equitable time and resource allocation.
62 DBE. 2013. Annual Surveys: Report for Ordinary Schools 2010 – 2011. Available at http://www.education.gov.za/DocumentsLibrary/Reports/tabid/358/Default.aspx
63 DBE. 2010. The Status of the Language of Learning and Teaching (LOLT) in South African Public Schools: A Quantitative Overview. Pretoria: Department of Basic Education. p 20. Available at www.education.gov.za/DocumentsLibrary/Reports/tabid/358/Default.aspx.
64 Ibid, p 6.

23 STATE LEGISLATION, REGULATIONS AND POLICIES PROVIDING FOR THE REALISATION OF THE RIGHT TO A BASIC EDUCATION
� Learners must choose their LOLT upon application for admission to a particular school. When the school uses the LOLT chosen by a learner, and where there is a place available in the relevant grade, the school must admit the learner.
� When no school in a school district offers the desired LOLT, the learner may request that the PED make arrangements for instruction in the language of choice and the PED must distribute the request to all schools in the relevant school district, as well as keep a running register of requests which have not been accommodated by schools.
� It is reasonably practicable for schools to provide education in a particular LOLT if at least 40 learners in Grades 1 to 6 or 35 learners in Grades 7 to 12 request it in a particular school.
The CAPS curriculum has introduced First Additional Language (usually English) as a subject beginning in Grade 1 beginning in 2012 to improve the transition to instruction in English for learners who do not speak English as a home language.
3.8. Barriers Impacting Learner Access to Home Language Instruction
South Africa’s National Education, Evaluation and Development Unit (NEEDU) has identified that a core problem with the DBE’s language policy is that while the government advocates teaching children in their home languages, parents may, and increasingly do, opt for English or Afrikaans as the LOLT, rather than the home language that is used by the majority of learners attending the school.65 The NEEDU study on the State of Literacy Teaching and Learning in the Foundation Phase found that a mismatch between LOLT and the learners’ home language in many of the 133 primary schools visited during that study “renders visible the fact that a large number of learners are schooled in a language that is different to the one they speak at home.”66 Causes for mismatch in LOLT and home language during the Foundation Phase ranged from parents of leaners who spoke African home languages choosing to send their children to schools that taught in English or Afrikaans due to their reputations as offering superior schooling to SGBs in African home language communities choosing an English language policy under the belief that it would help address other disadvantages or because parents in the community demanded it. A school’s choice of LOLT may also be further complicated by the school being attended by a learner population that is divergent in home background and home language, a problem that occurs in many schools in urban township areas. Not surprisingly, NEEDU found that “learners whose home language was different to the school LOLT found it difficult to understand their teachers” and that differences in LOLT and home language “made it difficult for [learners’] parents and guardians to assist them with homework.”67 Other language-related challenges identified by NEEDU are differences in dialect between learners and teachers and difficulties that African home languages pose for mathematics vocabulary.
Other barriers to mother-tongue literacy are the lack of reading materials at many primary schools. UNESCO has emphasised the need for improved access to materials, such as reading books, that support learners in the acquisition of reading skills in mother tongue language.68
Further concern has been raised around how the system should address language backlogs that negatively impact African home language learners, particularly at the secondary school level. Many secondary school learners who never properly learned to read, write and speak English at the primary school level are expected to learn and perform in English at the secondary level. The language policy, which focuses on transitioning learners to English at the primary school level, can therefore be extremely problematic and detrimental to learners who attended weak primary schools. Research into underperforming schools in the Western Cape identified inadequate language skills as a common challenge for many learners attending underperforming secondary schools who in some cases exhibited zero competence
65 NEEDU. 2013. National Report 2012: The State of Literacy Teaching and Learning in the Foundation Phase, p 32. Available at http://www.education.gov.za/NEEDU/tabid/687/Default.aspx.
66 Ibid, p 33. NEEDU found in its 2012 study that across the limited sample of 133 schools that the Foundation Phase LOLT matched the home language of most teachers and most learners in just over 70% of the schools visited.
67 Ibid, p 34.68 UNESCO. 2013. General Education System Quality Assessment: Country Report South Africa. p 31. Available at www.education.gov.za/
LinkClick.aspx?fileticket=jG5BCzd2IMk%3D&tabid=708&mid=2785.
Other barriers to mother-tongue
literacy are the lack of reading materials
at many primary schools. UNESCO has emphasised the need for improved access to materials, such as reading books, that support learners in the acquisition of
reading skills in mother tongue language.

24 Realising the Right to a Basic Education in South Africa
in comprehending English.69 That study found that due to the absence of clear policies and guidelines on how to address these often times debilitating backlogs, schools dealt with these challenges in different ways, including switching back and forth between languages while teaching the curriculum. The Western Cape study found that the present LOLT policy was not working to address these backlogs, contributing to high repetition rates.70
Another issue that poses a challenge for schools is the shortage of teachers qualified to teach Foundation Phase African home language. The DBE has emphasised the need to attract a greater number of prospective teachers to the profession that are qualified to teach foundation phase African home languages, stating that “the low levels of producing qualified educators at Higher Education Institutions has resulted in a dearth of African Language Foundation Phase teachers.”71 This shortfall in qualified teachers capable of teaching important foundation skills such as reading, writing and mathematics during the Foundation Phase in African home language is particularly concerning given that the vast majority of Foundation Phase learners speak African languages. While the DBE points to the Funza Lushaka bursary programme as improving the number of young teachers entering the profession, that programme fails to incentivise adequate numbers of teachers in needed subject areas, including languages.
RECOMMENDATIONS:1. The DBE should fund programmes that specifically incentivise prospective
teachers to become trained in teaching African home languages to Foundation Phase learners
2. Foundation Phase learners should have improved access to sufficient quantities of reading materials in their home language to ensure that learners are able to achieve appropriate home language reading skills prior to transitioning to first additional language.
3. The LOLT policy should be amended to accommodate learners who have graduated from primary schools without achieving sufficient levels of comprehension in English or Afrikaans to succeed at the secondary level. Programmes need to be developed and implemented to identify and address learner backlogs in English comprehension, particularly at the secondary school level.
3.9. Access to Basic Education for Learners with Disabilities
Inclusive Education Laws and PoliciesIn 2001, the Department of Education published its White Paper 6 on Special Needs Education: Building an Inclusive Education and Training System. The White Paper, which commits to building an inclusive education and training system capable of accommodating and supporting learners with a diverse range of special needs, provides a framework governing the establishment of the special needs education system along with funding strategies necessary for implementation. Central to the policy is a focus on basing the provision of education for learners with disabilities on the intensity of support needed to overcome the debilitating impact of the disability through a range of institutions offering different levels of support. The policy therefore provides for a system whereby ordinary public schools would be enabled and capacitated to support mainstreamed learners with low-level barriers to learning, including disabilities, through accommodating infrastructure and teachers trained to identify disabilities and address learner needs. Children with moderate disabilities are accommodated at full-service schools, which are essentially ordinary public schools equipped with additional
69 Louw, W., Bayat, A., Eigelaar-Meets, I. 2011. A Report on Underperforming Secondary Schools in the Western Cape: Report 3: Exploring Repetition at Underperforming Schools. Cape Town: University of the Western Cape. p 14.
70 Ibid.71 DBE. 2013. Annual Report 2012/2013. Pretoria: Department of Basic Education. p 30. Available at http://www.education.gov.za/
DocumentsLibrary/Reports/tabid/358/Default.aspx
Another issue that poses a challenge for
schools is the shortage of teachers qualified to
teach Foundation Phase African home language.

25 STATE LEGISLATION, REGULATIONS AND POLICIES PROVIDING FOR THE REALISATION OF THE RIGHT TO A BASIC EDUCATION
specially trained personnel, infrastructure and other resources needed to accommodate learners requiring specialised support. Finally, learners requiring high-intensive support are accommodated at special schools.
While Section 3 of the South African Schools Act makes basic education compulsory for learners aged 7 to 15 or through grade 9, SASA carves out an exception for compulsory attendance for learners with special education needs by empowering the Minister of Basic Education to set the age of compulsory attendance for special needs learners. At the time of this publication the Minister of Basic Education has yet to determine the age for compulsory attendance for learners with special needs. Moreover, unlike Section 3(3) of SASA, requiring the MEC for each province to ensure that there are a sufficient number of school places available for every child to attend school, Section 12(4) seeks to dilute the right to basic education for disabled learners by obligating the MEC for each province to provide education for learners with special education needs at ordinary public schools and provide relevant educational support services for such learners “where reasonably practicable.”
Section 12(5) of SASA obliges all MECs to take all reasonable measures to ensure that the physical facilities at public schools are accessible to disabled persons. The DBE has since regulated physical accessibility for disabled learners in the Norms and Standards for School Infrastructure, which requires all schools for learners with special needs to be fully accessible by 2030.
The DBE published three sets of guidelines for the implementation of White Paper 6 in 2005. The Conceptual and Operational Guidelines for the Implementation of Inclusive Education: Full-Service Schools describes the characteristics of full-service schools along with outlining the development process for such schools. The Conceptual and Operational Guidelines for the Implementation of Inclusive Education: Full Service Schools as Resource Centre provides a conceptual framework for an inclusive education system and, among other things, emphasises that disability should be seen not only in medical terms, but also should be viewed in terms of the rights of disabled persons. Finally, the Conceptual Guidelines for the Implementation of Inclusive Education: District Support Teams outline the roles and responsibilities of district level support providers employed by the then National Department of Education to assist education institutions and ECD centres with respect to identifying and addressing barriers to learning and promoting effective teaching through classroom and organizational, and institutional development and administrative support. These policies, however, made no provision for how these programmes would be funded by provinces and/or national governments. Nor do they provide performance benchmarks outlining the extent to which inclusive education policies must be made available to learners.
South Africa ratified the UN Convention on the Rights of Persons with Disabilities in 2007, which, among other things, makes provision for children with disabilities to access an inclusive, quality and free primary and secondary education on an equal basis with others in their communities and prohibits persons with disabilities from being excluded from the general education system on the basis of disability.
Courts have recognised the rights of disabled learners to access basic education services despite government claims that budgetary constraints prevent immediate universal implementation of inclusive educational policies. In Western Cape Forum for Intellectual Disability v. Government of the Republic of South Africa and Another72, the applicant filed suit against the government on behalf of learners with severe intellectual disabilities who had been denied access to schools capable of meeting their needs due to the government’s failure to fund and provide schools for learners with profound intellectual disabilities. The Western Cape High Court found that the state’s failure to adequately fund and provide special needs education for these learners violated the learners’ rights to a basic education, protection from neglect or degradation, equality and human dignity. The court ordered national and provincial authorities to ensure that every child in the Western Cape who is severely and profoundly disabled has affordable access to basic education of an adequate quality. The province was also directed to adequately fund organisations capable of carrying out the court’s directive, provide appropriate transportation and make provision for training of persons to provide education for children with severe and profound intellectual disabilities.
72 Western Cape Forum for Intellectual Disability v Government of the Republic of South Africa and Another, 2011 (5) SA 87 (WCC).
Courts have recognised the rights of disabled
learners to access basic education services
despite government claims that budgetary
constraints prevent immediate universal
implementation of inclusive
educational policies.

26 Realising the Right to a Basic Education in South Africa
3.10. The Implementation of Inclusive Education Policies
South Africa has responded to these inclusive education policies through a number of teacher training initiatives. Both the Policy for the Minimum Requirements for Teacher Education and Development in South Africa (2011) and the Integrated Strategic Planning Framework for Teacher Education and Development in South Africa (2011) make provision for inclusive education as a component of Initial Teacher Education and Continued Teacher Development Programmes. The extent to which pedagogical skills and knowledge that teachers should gain through their training to equip teachers to identify and address barriers to learning and disabilities, however, is not addressed in these policy documents. As such, these policies appear to award large degrees of discretion and autonomy to individual teacher training institutions and teacher development programme administrators to devise their own ways of equipping teachers and prospective teachers on how to react to inclusive education needs. The need to equip both teachers and district officials with the knowledge and skills to identify and address learners with special needs is particularly important given that the majority of special needs learners attend public ordinary schools.
The DBE’s Report on the 2011 School Monitoring Survey emphasised that “learners with special needs often do not receive the specialised attention they require due to inadequate resources and skills.”73 As one of the indicators assessed during that Survey, the DBE investigated the percentage of schools with at least one educator who has received specialised training in the identification and support of special needs. The report qualified educators as having specialised training if they had either a tertiary degree, a post-matriculation diploma, a post-graduate diploma, an Advanced Certificate in Education (ACE) or an accredited short course in special or remedial training. The study found that 70% of the schools visited satisfied this criteria.74 Provincially, the Eastern Cape, Mpumalanga and Limpopo had the lowest with 59%, 64% and 65% of schools respectively satisfying the criteria while the Western Cape and Gauteng scored the highest with 86% and 87% of schools respectively satisfying the criteria. The standards which the DBE used in this study to qualify teachers and schools, however, is concerning given the lack of standards required by the programmes cited. Moreover, it is doubtful that one teacher in a school will be have the capacity to address all special needs issues within a school given other teaching obligations.
The DBE has cited a number of persistent challenges that have limited the ability of disabled learners from accessing schools capable of accommodating their needs. Among these concerns are (1) an incoherent understanding by schools and provincial education departments of the intent of the inclusive education and training programme; (2) disparities amongst provinces in resourcing inclusive education, including personnel provisioning and funding; (3) limited access to specialist support services resulting in too many learners being referred out of ordinary schools or learners remaining in mainstream schooling without adequate support; (4) lack of specialist professional support and non-teaching staff at special schools; and (4) lack of structured stakeholder engagement. 75 A 2015 Human Rights Watch Report on South Africa’s Failure to Guarantee an Inclusive Education for Children with Disabilities cited additional concerns, including that learners with disabilities are often discriminated against when applying for admission to schools that often operate unchecked when making enrolment determinations. Other concerns raised in that report include disabled learners attending special schools being subjected to fees that mainstream learners do not pay, including admission fees, fees for their own class assistants and burdensome transportation costs. Human Rights Watch also found that special needs learners are subjected to greater incidences of violence, abuse and neglect in schools; and receive low quality education from teachers who have not had the knowledge and practical training necessary to implement inclusive education policies in their classrooms and understand the needs of learners with disabilities.76
73 DBE. 2013. Report on the National School Monitoring Survey 2011 (DBE013, Conducted in 2011). Pretoria: Department of Basic Education. p 205. Available at http://www.education.gov.za/LinkClick.aspx?fileticket=nbaa%2Bhb1H%2Bw%3D&tabid=741&mid=3176.
74 Ibid, p 208.75 DBE. 2015. Report on the Implementation of Education White Paper 6 on Inclusive Education: An Overview of the Period: 2013 – 2015.
Department of Basic Education. Pretoria, p 6 – 7. Available at http://www.thutong.doe.gov.za/ResourceDownload.aspx?id=49049.76 Human Rights Watch. 2015. “Complicit Exclusion”: South Africa’s Failure to Guarantee an Inclusive Education for Children with Disabilities, p
2 – 3. Available at https://www.hrw.org/sites/default/files/report_pdf/southafrica0815_4up_0.pdf.
the DBE investigated the percentage
of schools with at least one educator who has received
specialised training in the identification
and support of special needs.

27 STATE LEGISLATION, REGULATIONS AND POLICIES PROVIDING FOR THE REALISATION OF THE RIGHT TO A BASIC EDUCATION
Despite the existence of these policy initiatives, many disabled learners in South Africa are denied access to public schools capable of identifying and addressing their needs. A 2015 report by the DBE estimated that as many as 597,953 children between the ages of 5 and 18 with disabilities are not attending schools, which amounts to 4.2% of children in that age group and a majority of the 5.8% of children between those ages who are estimated to suffer from a disability.77 GHS data shows that 92.4% of learners with disabilities between the ages of 7 and 15 attended primary schools and 66.7% of learners with disabilities between the ages of 16 and 18 attended secondary schools .78 Given these comparatively high rates of non-attendance, the background paper for the Presidency’s Twenty Year Review has stressed that compulsory school attendance for children with disabilities has not been effectively monitored and enforced.79 116,504 learners in 2013 attended special needs schools, comprising approximately 0.97% of learners in the public education system.80 These numbers are concerning when compared to 2011 census data referenced in the DBE’s report that shows that 5.8% of children between the ages of 5 and 18 suffer from a disability, leading one to question the extent to which disabled learners are attending schools and having their disabilities properly identified and appropriately addressed. Provincial breakdowns of these statistics are also concerning when one considers that nearly 55% of learners attending special needs schools do so in Gauteng and the Western Cape provinces, which together account for only 24% of disabled learners attending public schools.81 Only .48% of learners in the Eastern Cape and .51% of learners in Limpopo attend special needs schools, statistics that appear to indicate that the vast majority of disabled learners in those provinces do not attend schools or are forced to attend ordinary public schools that carry a strong likelihood that they are ill-equipped to respond to the needs of learners with disabilities as these provinces also had the lowest rates of schools staffed with teachers qualified to accommodate special needs learners.
77 DBE. 2015. Report on the Implementation of Education White Paper 6 on Inclusive Education: An Overview of the Period: 2013 – 2015. Department of Basic Education. Pretoria p 20. The DBE report estimated the total figure of disabled learners not attending schools by using census data showing that 5.8% of children between the ages of 5 and 18 suffered from a disability, multiplying that figure against the total number of children aged 5 – 18 and then subtracting the total number of learners with disabilities enrolled in ordinary and special needs schools.
78 Van Der Byl, Chantelle. 2014. Twenty Year Review South Africa 1994 – 2014: Background Paper: Disability. The Presidency, p 28. Available http://accesstech.co.za/wp-content/uploads/2014/06/12%20Disability_20YR.pdf. The background paper cites GHS data from 2009 General Household Survey showing that of 703 159 children with disabilities, only 111 619 attend Special Schools and 124 535 attend Ordinary Schools.
79 Ibid.80 DBE. 2015. Education Statistics in South Africa 2013. Department of Basic Education. Pretoria, p 37 – 38. Available at http://www.education.
gov.za/EMIS/StatisticalPublications/tabid/462/Default.aspx.81 Ibid.
Given these comparatively
high rates of non-attendance, the
background paper for the Presidency’s Twenty Year Review
has stressed that compulsory school
attendance for children with disabilities
has not been effectively monitored
and enforced.

28 Realising the Right to a Basic Education in South Africa
RECOMMENDATIONS:1. Inclusive education policies should be improved to better guide provinces in
terms of their roles and responsibilities to ensure that learners with disabilities are able to be identified and adequately accommodated. Enhanced policies should specifically address the types of educational facilities and accommodations that must be made available to learners with disabilities, and should detail specific resources that must be made available to learners with disabilities and schools serving them, such as support staff and teacher post-provisioning allocations and qualifications, transport and hostile accommodations and school infrastructure. Norms and Standards should be developed to address how these facilities and ordinary schools should be funded to accommodate learners with special needs and supported by districts and qualified district officials.
2. Guidelines governing inclusive education should include delivery timeframes and should provide for improved monitoring, including improvements to data systems used to track the number of learners with disabilities in each education district and province, the types of disabilities that must be accommodated and how each learner identified as having a disability is being or will be accommo dated. Provinces should be required to report annually on the extent to which they are accommodating learners with disabilities, numbers of learners who are not being accommodated and their plans detailing how they intend to accommodate learners with disabilities in the future. Schools should be monitored regularly to ensure that they are staffed with the requisite number of educators who are qualified to screen, identify and support learners with disabilities.
3. Programme initiatives in Initial Training Education and professional development programmes should be investigated to assess how clear standards should be developed to ensure that special needs learners in ordinary and Special Needs Schools have access to teachers equipped to respond to their needs.
4. The South African Schools Act should be amended to explicitly provide for free and compulsory education for learners with disabilities.
5. Policies should address provincial responsibilities to undertake community out-reach to ensure that parents of learners with disabilities understand their rights, options and responsibilities with respect to securing placement and transport to schools or other institutions equipped to accommodate learners with disabilities.
3.11. Access to Early Childhood Development Education
The DBE has emphasised the significant role of access to quality early childhood development programmes as laying the critical foundation for lifelong learning, stressing that:
“The early years of a child are critical for the acquisition of the concepts, skills and attitudes that lay the foundation for lifelong learning. These include the acquisition of language, perceptual/motor skills required for learning to read and write, basic numeracy concepts and skills, problem-solving skills and a love of learning. With quality ECD provision, educational efficiency would improve, as children would acquire the basic concepts, skills and attitudes required for successful learning and development prior to or shortly after entering the system, thus reducing the chances of failure. The system would also be freed of under-aged and under-prepared learners who have proven to be the most at risk in terms of school failure and drop-out.82
82 DBE. 2014. Education for All (EFA) 2014 Country Progress Report. Department of Basic Education. Pretoria, at p 11. Available at http://www.education.gov.za/researchreports/tabid/708/Default.aspx.

29 STATE LEGISLATION, REGULATIONS AND POLICIES PROVIDING FOR THE REALISATION OF THE RIGHT TO A BASIC EDUCATION
The National Development Plan has placed a strong emphasis on the need to develop universally available quality early childhood education programmes. Specifically, the NDP has recommended that the government “increase state funding and support to ensure universal access to two years of early childhood development.”83
In its 2001 White Paper 5 on Early Childhood Development, the then Department of Education characterised Early Childhood Development as “a comprehensive approach to policies and programmes for children from birth to nine years of age with the active participation of their parents and caregivers.” That document set a policy target of universal access to Reception year programmes by 2010 with a vision that 85% of all five year olds would be accommodated within primary school-based Grade R programmes with the remaining children attending Government subsidised community-based sites. In its 2011 Action Plan to 2014, the DBE reset its target for universal access to grade R to 2014. Under the current construct of early development education, the DBE and provincial counterparts provide subsidies for formal grade R programmes, which take place mainly in primary schools. National and provincial Departments of Social Development subsidise and oversee early childhood development programmes that take place prior to reception year education.
The Minimum Requirements for Teacher Education Qualifications (MRTEQ) policy requires grade R teachers to hold matric certifications plus a diploma in Grade R Teaching or a Bachelor of Education in Foundation Phase Teaching. A report by the Auditor General which was tabled for parliament in 2015, however, found that in 2013, 16,520 out of 21,207 Grade R teachers did not hold the requisite qualifying diploma or degree.84 The DBE, in response to these findings, has emphasised that it is assisting all provinces to ensure that teachers complete NQF Level 4 (Matric) and is providing support to 4000 to receive Bachelors Degrees in Education or a Diploma in Grade R teaching.85
While the number of five year olds accessing grade R education has increased dramatically since 2002, outcomes of learners attending grades R through 3 have shown low performance, including an inability to read, write and perform mathematics at the appropriate grade level.86 Moreover, concern has been raised through multiple studies over the extent to which the current grade R system, as developed and implemented, is capable of impacting learners’ subsequent performance in later grades. Hoadley attributes the lack of effectiveness in Grade R programmes to the home background and general preparedness of learners to enter formal schooling, as well as the quality and capacity of the school resources, teachers and teaching methodologies.87 Much of the home background and preparedness of learners is closely related to issues of poverty, including the health and nutrition status of the child, particularly as it relates to stunting, disability status, access to grants, psycho-social support and early stimulation such as access to books and parental engagement.88 Hoadley therefore stresses that improving results requires offering earlier interventions, including improvements to maternal health and education and adequate nutrition. Emphasis is further placed on the need to improve teaching and learning practices that take place in classrooms that are all too often plagued by overcrowded learner : teacher ratios and ineffective pedagogical practices that favor oral drill sequences and with limited opportunities for reading and writing, low level of cognitive demand and lack of direct or explicit instruction.89 Hoadley therefore recommends that the South African Schools Act be amended to make grade R compulsory, that norms be amended to provide for grade R post provisioning and that grade R teachers, who are “overwhelmingly under-qualified” with a majority carrying only matriculation without exemption certificates, become professionalised through integrating intensive and ongoing training, qualification and remuneration requirements into the grade R post structure.90
These findings have been largely echoed in a 2013 report commissioned by the Department of Performance Monitoring and Evaluation (DPME) in the Presidency and the DBE assessing
83 National Planning Commission. 2013. National Development Plan 2030: Our future – Make it work. Pretoria: Department of the Presidency, South Africa. p 72.
84 DBE. Media Statement: “Basic Education on improving qualifications for Grade R teachers”, (4 August 2015). Available at http://www.gov.za/speeches/department-basic-education-working-hard-improve-qualifications-grade-r-teachers-4-aug-2015.
85 Ibid.86 Spaull N. 2012. Poverty and privilege: Primary school inequality in South Africa. International Journal of Educational Development, 33(5),
September 2013: 436-447.87 Hoadley, U. ‘Building Strong Foundations: Improving the quality of early education.’ South Africa Child Gauge 2013. University of Cape Town.
2013. p 73 – 74. Available at http://www.ci.org.za/depts/ci/pubs/pdf/general/gauge2013/SouthAfricanChildGauge2013.pdf 88 Ibid.89 Ibid.90 Ibid. at 76.
While the number of five year olds accessing grade R education has increased dramatically since 2002, outcomes of learners attending
grades R through 3 have shown low
performance, including an inability to read, write and perform
mathematics at the appropriate grade level.

30 Realising the Right to a Basic Education in South Africa
the impact of the Grade R programme.91 That study found that although access to Grade R programmes has been significantly expanded from 2001, when 242 000 learners were enrolled in Grade R programmes, to 2012 when 768 000 learners were enrolled in Grade R, “the impact of Grade R in South Africa is small and there is virtually no measurable impact for the poorest three school quintiles, while there are some impacts for the higher quintile schools.”92 This critical conclusion was based on the study’s findings that on average and despite a school year of 200 days, enrolment in Grade R programmes converts to only 12 days normal learning gains in mathematics and 50 days in home languages, though results were better in higher quintiles, better performing schools and educationally stronger provinces, including Gauteng, Western Cape and Norther Cape. The report therefore concludes that instead of reducing inequalities, the implementation of the Grade R programme under its current construct has the perverse effect of rather extending the advantage of more affluent schools.93 One caveat is that while these outcomes are poor, the report identified that it may be the result of a wider endemic failure of schools known to exist in South Africa and not only a problem with the Grade R programme. Key strategies identified for improvement are for the government to assess the programme not by access alone, but also by achievements which have the effect of narrowing inequalities. The report also advises that greater attention should be on the quality of the programmes offered, including teacher knowledge, training, qualification requirements and support, as well as more clear curriculum guidance and standards and a greater understanding amongst teachers of how children learn and how to facilitate learning in a manner that leads to improved outcomes.
In March 2015 the Department of Social Development published its Draft Early Childhood Development Policy for public comment. The draft policy, which was developed under the South African Integrated Programme for Early Childhood Development, recognizes early childhood development as a universal right. It focuses on the delivery of an essential package of ECD services across four service areas, including (a) health care and nutrition; (b) social protection; (c) parenting support; and (d) opportunities for learning. While this policy seeks to coordinate services available through a range of departments offering support to parents and children aged 0 to 5 years old, the policy as currently drafted is likely to carry similar shortfalls as the Grade R programming policy, as it lacks direction on capacity building and clear programming standards that have been identified as contributing factors of the poor Grade R outcomes. The policy outlines the introduction of a pre-grade R programme to be phased in for children aged 3.5 to 5 years old over the next 6 to 9 years. This programme, however, as outlined in the policy lacks specifics in terms of the qualifications, knowledge and training of teachers responsible for carrying out this education initiative, how clear standards will be imposed and how monitoring and support of these programmes will occur. An additional concern is the primary role that the Department of Social Development is playing in developing and implementing the ECD policy rather than the DBE. This allocation of responsibility over ensuring access to quality ECD programmes appears to contradict the National Development Plan’s recommendation that “there should be a policy and programme shift to ensure that the Department of Basic Education takes the core responsibility for the provision and monitoring of ECD” and that “other departments should continue to provide services in a supportive capacity.”94
91 Van Der Berg, S., et al., 2013. The Impact of the Introduction of Grade R on Learning Outcomes: Policy Summary, Executive Summary & Evaluation Report. University of Stellenbosch. Available at http://evaluations.dpme.gov.za/sites/EvaluationsHome/Evaluations/The%20Impact%20of%20the%20Introduction%20of%20Grade%20R%20on%20Learning%20Outcomes/Final%20Report%20(long)/Impact%20of%20introduction%20of%20Grade%20R%20on%20subsequent%20learning%20outcomes.pdf.
92 Ibid, p 2.93 Ibid.94 National Planning Commission. 2013. National Development Plan 2030: Our future – make it work. Department of the Presidency. p 302.
available at http://www.gov.za/issues/national-development-plan-2030.
One caveat is that while these outcomes
are poor, the report identified that it may
be the result of a wider endemic failure of
schools known to exist in South Africa and not only a problem with the
Grade R programme.

31 STATE LEGISLATION, REGULATIONS AND POLICIES PROVIDING FOR THE REALISATION OF THE RIGHT TO A BASIC EDUCATION
RECOMMENDATIONS:1. Access to quality Early Childhood Development, including Grade R, should be
improved and capable of reducing deficits that impact the ability of learners to achieve in the Foundation Phase. Grade R should be made compulsory and teachers should be professionalised through in-service training and the implementation of qualification training standards.
2. The Early Childhood Education Policy should be reviewed to determine whether the DBE should play a more prominent role in terms of that policy’s development and implementation.
3.12. Access to social support programmes for learners in school
The National Government, through the DBE and the South African Social Security Agency, make provision for social support programmes for many poor and impoverished learners in South African schools. Programmes such as the National School Nutrition Programme and the Child Support Grant provide qualifying learners with nutritional and financial support while they are in school. Given the vast amounts of poverty and stark inequalities in South Africa, these programmes represent important redistributive measures which are capable of supporting and encouraging learners to attend and complete their schooling.
National School Nutrition Programme95
The National School Nutrition Programme aims to “foster better education by enhancing children’s active learning capacity” and addressing “barriers to learning associated with hunger and malnutrition by providing nutritious meals to learners in all schools.96 The programme further serves as a means for the state to fulfill its mandate to ensure that children and youth attending public schools are able access sufficient food pursuant to Section 27 of the South African Constitution.
The South African Government first introduced feeding plans into primary schools in 1994 under the Primary School Feeding Programme (PSFP). As a component, of the Integrated Nutrition Programme (INP), the PSFP, was co-managed by the departments of health education before the programme was renamed as the National School Nutrition Programme (NSNP) and transferred solely to the Department of Education in 2004.
The objectives of the NSNP are:
� to contribute to enhanced learning capacity through school feeding programs;
� to promote and support food production and improve food security in school communities; and
� to strengthen nutrition education in schools and communities.97
Additionally, the DBE has emphasised the important role that the NSNP plays with respect to enabling learners to access basic education services through providing an incentive for children to attend school regularly and punctually. The NSNP provides meals to all learners attending no-fee schools from grades R to 12 in quintiles 1 to 3 primary and secondary schools. Previously only serving primary schools, the DBE expanded the NSNP to quintile 1 secondary schools in 2009, quintile 2 secondary schools in 2010 and quintile 3 secondary schools in 2011.
According to the DBE, the NSNP reached an average of 8 827 419 learners in 19 877 quintile 1, 2 and 3 schools during the 2013/2014 financial year.98 The programme aims to provide five
95 For detailed analysis on South Africa’s National School Nutrition Programme, please see McLaren, D, Moyo, B and Jeffery, J ‘The right to food in South Africa: An analysis of the content, policy effort, resource allocation and enjoyment of the constitutional right to food’ (2015). Studies in Poverty and Inequality Institute, Working Paper 11.
96 DoE. 2009. National School Nutrition Programme. A Guide for Secondary Schools. Pretoria: Department of Education.97 DBE. 2014. DBE Annual Report, 2013/2014. Department of Basic Education. p 151. Available at http://www.education.gov.za/
DocumentsLibrary/Reports/tabid/358/Default.aspx.98 Ibid.

32 Realising the Right to a Basic Education in South Africa
nutritious meals per week, each of which should provide a protein and fruit or vegetables. The NSNP is funded through a Conditional Grant that is transferred to provinces according to the allocation criteria outlined in the poverty distribution table used in the Norms and Standards for School funding gazetted each year by the Minister of Basic Education.
While the NSNP has been highly successful in reaching a large number of South Africa’s learners, reports of delivery failures in certain provinces and allegations of corruption with respect to provincial contracts with vendors responsible for food service provisioning give rise to the need for the DBE to undertake additional measures to monitor and support the programme’s implementation. The DBE has noted various performance irregularities by provinces and districts that failed to submit performance indicators for the second and third quarters during the 2013 to 2014 school year detailing the number of learners that had been served by the programme.99 This failure to properly monitor and report delivery of school meals raises concern that at least some learners in need of the benefits of this programme are not receiving their meals. The DBE has most recently stated that reports of non-feeding arose in districts in Kwazulu-Natal and Limpopo during the 2013/2014 financial year, impacting a total of 220 schools and that threat of litigation by nongovernmental organisation Section 27 at one school led to a settlement which caused feeding to resume at that school.100
Other common problems that have been reported to the DBE involve issues around lack of adequate school infrastructure to allow for proper and safe storage of food and cooking space, as well as lack of indoor eating space.101
A recent assessment of the NSNP undertaken during the DBE’s School Monitoring Survey in 2011 shows that minimum standards were not always met. While 97%, 98% and 94% of learners attending Quintile 1, 2 and 3 schools respectively received a nutritious meal every day, there remained a considerable number of qualifying learners attending schools in those quintiles who did not receive school meals.102 Moreover, the survey found that the food provided through these programmes did not always comply with nutrition mandates, as only 72% of schools fed learners protein five days a week and only 54% of schools fed learners the requisite fruit and vegetables five times a week. 103
Child Support GrantAnother important social programme that the South African government has made available to learners has been the provisioning of child support grants to caregivers of children in school. This programme advances the Constitutional rights of learners and their parents or guardians to access appropriate social assistances if they are unable to support themselves and their dependents. In 1998, the government first made the child support grant available to caregivers of children below the age of 7 who satisfied a financial means test. Since then, the grant has steadily increased both in terms of the nominal amount of the support provided, as well as the age of the children who, still subject to means testing, qualify for the social assistance grant. The programme was expanded to include means-qualifying 7 and 8 year-olds in 2003, 9 and 10 year-olds in 2004 and qualifying children under the age of 14 in 2005. In 2010 the grant was expanded to qualifying children under the age of 16 and then to youth under the age of 18 in 2012. In 2014 the Minister of the Department of Social Development announced plans to expand the child support to include youth between the ages of 18 to 21 years of age, though as of 2015, these plans remain subject to parliamentary approval. Currently, child support grants are available to primary caregivers of children earning up to R39,600 per year if they are single or a combined R79,200 per year if the primary caregivers are married. Child support grants amount to R330 per month and both the means test and the allocated amounts increase nominally each year, though the increase is not tied to inflation.
A study reviewing data from 2008 through 2012 tracked by the National Income Dynamics Study (NIDS) concluded that child support grant recipients between the ages of 15 and 19 years of age are 6% more likely to be enrolled in school than non-recipients after controlling for age and other important characteristics.104 This finding is particularly significant given
99 Ibid.100 Ibid, 152.101 Ibid.102 DBE. 2013. Report on the School Monitoring Survey. p 196.103 Ibid, 197.104 Eyal, K., Woolard, I. 2013. School Enrolment and the Child Support Grant: Evidence from South Africa. South African Labour and Development
Research Unit. NIDS Discussion Paper 23/7. p 9 – 10.
Other common problems that have
been reported to the DBE involve
issues around lack of adequate school
infrastructure to allow for proper and safe storage of food and cooking space, as
well as lack of indoor eating space.

33 STATE LEGISLATION, REGULATIONS AND POLICIES PROVIDING FOR THE REALISATION OF THE RIGHT TO A BASIC EDUCATION
South Africa’s high incidences of drop-out rates, high rates of over-aged learners attending primary and secondary schools and high incidences of 7 to 18 year-olds not attending school citing financial circumstances such as lack of ability to pay school fees as the reason for not attending schools.
RECOMMENDATIONS:1. Monitoring of the School Nutrition Programme should be enhanced to ensure
that all learners who qualify for the programme receive the benefits to which they are entitled and enable education districts and provinces to swiftly intervene in instances where service delivery does not occur. Monitoring should not only assess frequency of meals but also nutritional content.
2. The School Nutrition Programme should be reviewed to determine how to ensure that poor learners who attend schools classified as quintile 4 and 5 have access to state funded school nutrition programmes. A review of this nature is particularly important since quintile determinations are made based on the socio-economic conditions of the surrounding school communities and not the circumstances of the learners that actually attend the schools. Accordingly, measures should be developed to assess the nutrition needs of learners attending quintile 4 and 5 schools and provide meals to learners whose needs would otherwise qualify them for school nutrition assistance.
3. South Africa should extend child support grants to qualifying youth age 18 and above who are attending education institutions.
3.13. Access to transport for learners traveling long distances to school
In her 2015 Department of Basic Education Budget Speech, Minister Angie Motshekga stressed that “learner transport, which is provided to learners who have to travel 5kms or more from their homes to the nearest school, ha[s] been key in ensuring access and the retention of our learners in our basic education system. It must be stressed that scholar transport must be reliable and ensure the safety of learners while in transit.”105 Despite the importance of safe and reliable learner transport, especially in rural provinces where many learners must travel long distances to get to school, there has been no official learner transportation policy at the national level. In 2009, the Department of Transportation published a Draft National Scholar Transport Policy. That draft policy stressed the finding that “the absence of a national policy on scholar transport has resulted in fragmented provision of scholar transport services administered by the Provincial Departments of Education and transport” and that “[c]onsquently, the amount of funding made available for scholar transport varies and is often insufficient to meet the existing need.”
While the Minister of Transport has reported that 360,248 learners benefit from scholar transportation programmes, significant numbers of learners continue to walk long distances to their schools. GHS data shows that nationally 5.5% of learners walk more than 60 minutes to education institutions and that learners in rural provinces such as Kwazulu-Natal and the Eastern Cape, 9.9% and 6.5% of learners respectively walk 60 minutes or longer to get to education institutions. These statistics are particularly worrying given the fact that these provinces account for approximately 39% of all learners attending public ordinary schools.106 The DBE further highlighted the lack of adequate school transportation provided to learners at a provincial level in its 2015 Presentation to the Portfolio Committee on Basic Education. That report found that 40% of learners in the Eastern Cape, 69% of learners in Kwazulu-Natal, 48% of learners in Limpopo and 54% of learners in the Northwest Provinces who qualified for learner transport in 2014 – 2015 were not provided with transport to their schools.107 The
105 Motshekga. A., Basic Education Budget Vote 2015/16. (6 May 2015). Available at http://www.gov.za/speeches/minister-angie-motshekga-basic-education-dept-budget-vote-201516-6-may-2015-0000.
106 DBE. 2015. Education Statistics in South Africa 2013, p 4.107 DBE. 3 March 2015 Learner Transport Presentation to the Portfolio Committee on Basic Education, at slide 11. Available at https://pmg.org.za/
files/150303Learner.ppt.
While the Minister of Transport has
reported that 360,248 learners benefit from
scholar transportation programmes,
significant numbers of learners continue to
walk long distances to their schools.

34 Realising the Right to a Basic Education in South Africa
DBE has attributed the shortcomings in the provincial provisioning of learner transportation to insufficient budgets, increasing learner transport need, lack of capacity in provincial learner transport units, use of un-roadworthy vehicles and overloading of vehicles.108
Under the current scholar transport system, provincial departments of education have implemented their own policies for learner transport and enter into contracts with service providers. It is up to each province to set its own budget for learner transport, resulting in different allocations between provinces which are not consistent with the transport needs of learners. For instance, the Eastern Cape budgeted R 356 million for scholar transport for the 2015/2016 fiscal year while Kwa Zulu-Natal, which has approximately 33% more learners, budgeted only R 168 million to ensure that learners are able to travel safely to school.109
The lack of clear national policy directive further complicates issues surrounding roles and responsibilities of different provincial departments. In the Eastern Cape, for example, the provincial education department is responsible for determining the number of learners and schools eligible to receive subsidised scholar transport, while the provincial department of transport sets the budget and determines routes and modes of transport. The NGO Equal Education, which, among other things, works with learners attending rural schools in the Eastern Cape and Kwa Zulu-Natal, has underscored that this lack of clear policy makes it difficult to hold provinces accountable for service delivery failures.110
In 2014 the South African Human Rights Commission highlighted the nexus between learner transport and the right to a basic education when it found that the Eastern Cape Departments of Education and Transport violated the rights of learners when they failed to provide subsidised transport to learners traveling over 5 km to school.111
In 2014, the Department of Transport published a new draft learner transport policy for public comment in partnership with the DBE, as the 2009 policy was never finalised or implemented. The current draft policy, however, does little more than make the case that a uniform way of managing and operating learner transport is needed and outlines very general responsibilities that national and provincial departments of transport and education should fulfill. Most of these responsibilities, however, centre around very general roles such as “identify beneficiaries and develop preliminary routes”, “develop learner transport plans”, “monitor transportation needs of learners”, “register and license operators” and “develop and monitor the implementation of safety regulations, norms and standards with regard to learner transport operations.”112 The policy reads more like a plan to develop a policy and it fails to provide guidance on critical components of scholar transportation, such as the criteria that provinces should use to determine which learners qualify for transport or transport subsidies; a budgeting framework which ensures that provinces are able to provide transport to all qualifying learners; and safety standards and processes that ensure that any 3rd party vendors contracted to transport learners do so safely and efficiently, in terms of cost, time and distance. The policy should further specify how monitoring by provincial and national transport and education departments will occur and list the criteria for transportation service delivery, budgeting and expenditure that should monitored.
108 Ibid, at slide 14.109 Ibid, at slide 13.110 Equal Education & the Equal Education Law Centre. 2014. Basic Education Shadow Report: A Review of the Department of Basic Education’s
Performance in the 2013/14 Financial Year. Equal Education. Cape Town, p 14. Available at http://www.equaleducation.org.za/attachment/download/2015-02-03-EqualEducation_ShadowReport_20132014_WebRes_Final.pdf
111 South African Human Rights Commission report dated 28 August 2014 concerning a complaint regarding a lack of transport at a senior Secondary School in Queenstown, Eastern Cape Province at paras 10.1 & 10.2. Available at http://www.sahrc.org.za/home/21/files/Lindiwe%20Mazibuko.pdf
112 Department of Transport. Draft Learner Transport Policy. 13 November 2014, Notice 1004 of 2014. p 15 – 16.
The policy reads more like a plan to develop a policy and it fails to provide guidance on
critical components of scholar transportation,
such as the criteria that provinces should
use to determine which learners qualify
for transport or transport subsidies;

35 STATE LEGISLATION, REGULATIONS AND POLICIES PROVIDING FOR THE REALISATION OF THE RIGHT TO A BASIC EDUCATION
RECOMMENDATIONS:1. The Departments of Basic Education and Transport should implement a
comprehensive national scholar transport policy that clearly regulates provincial roles and responsibilities with respect to ensuring that learners in need of transport to their schools are provided with services that are accessible, safe and reliable. The DBE should be in charge of implementing a national transport policy since it is the department that is best situated to gather data concerning learners and their transportation needs and should therefore be held ultimately accountable for scholar transportation service delivery.
2. Data should be collected and verified to determine the number of learners, particularly in rural areas, that qualify for subsidised school transport;
3. Conditional school transport grants should be allocated to provinces according to need to ensure that transport programmes are appropriately funded. Grant spending should be audited to ensure that it is being used efficiently and effectively to transport all qualifying learners to and from their schools safely and on time.
3.14. Access to Adult Basic EducationThe need to provide access to adult basic education services is particularly vital in South Africa given the educational backlogs that were propagated under apartheid’s education policies. In 2002, 27.3 % of South Africans aged 20 or above had either no formal education or had achieved less than Grade 7. While this figure has been reduced to 15.8% by 2014, mostly due to significant increases in childhood and youth enrolment in Primary and Secondary Schools since the end of apartheid, 19.7% of South African men between the ages of 40 and 59 and 21.6% of women between those ages continue to have either no formal education or have achieved less than grade 7. South African men and women over the age of 60 have fared far worse, with 40.4% and 47.9% respectively reporting in 2014 having received either no formal education or less than a grade 7 education.113 Given the state’s constitutional mandate to make access to adult basic education immediately realizable and the substantial need for those services to address past educational backlogs, there is a great need for the Departments of Basic Education and Higher Education and Training to provide accessible and adequate adult basic education services and programmes.
The DBE and DHET have supported adult basic education through a number of Acts and Programmes that have been promulgated and implemented to, among other things, address adult illiteracy in South Africa. The Adult Education and Training Act was promulgated in 2000 to establish and regulate public and Private Adult Learning Centre (PALS). Parliament later amended that Act and renamed it the Adult Education and Training Act and added a legislative framework governing the regulation of the employment of educators in the public learning centres.
The DBE promotes the Kha Ri Gude Mass Literacy Campaign as designed to fulfil the UN: Education for All commitment to reducing South Africa’s illiteracy rate by half by 2015 The programme, which the DBE has managed and operated since 2008, aims to enable 4.7 million South Africans aged 15 years and over to become literate and numerate at no cost in one of the official eleven languages. Classes take place in participants’ communities in homes, churches, schools and other community centres. 75% of the programme’s expenditures go to volunteers who are paid a monthly stipend on short-term six month contracts. The programme provides workbooks, available in all eleven official languages and braille to participants who commit themselves to attending classes for 240 hours.
In 2012, the DHET published its Green Paper on Post-school Education and Training. That policy paper, among other things, reconsidered the implementation of Public Adult Learning Centres, underscoring that up until that time, they have been the only institution that offers
113 StatsSA. General Household Survey 2014. p 26
In 2012, the DHET published its Green
Paper on Post-school Education and Training.

36 Realising the Right to a Basic Education in South Africa
education to adults and has been doing so at a capacity that serves about 265 000 learners - “a tiny fraction of the adults who have need of education and training.”114 The Green Paper further emphasised that while these institutions are focused on offering adult basic education and training qualifications “there is no core curriculum and there is insufficient standardisation of assessment across provinces.”115 Other criticisms focused on the fact that very few learners enrolled in the Centres move on to further education institutions following the completion of their National Senior Certificates and that most learners enrolled for grade 12 are either recent school drop-outs or people who want to rewrite the Matric examination, making these Centres ill-suited for and without the capacity to offer the more suitable National Senior Certificate for Adults.116 Finally, the Green Paper drew attention to the part-time and temporary nature of the teaching force at the adult learning centres and the need to implement long-term management and planning, especially since adult learners often study-party time and are therefore relatively slow at proceeding through the curriculum.
Declaring the Public Education Learning Centres to be “inadequate”, the Green Paper further highlighted the programme’s failure to attract large numbers of adults and young people interested in not only completing their qualification certificates, but also in gaining labour market and sustainable livelihood skills, as well as those interested in learning for general self-improvement. To address these concerns, the Green Paper proposed a community education and training approach to adult learning, whereby Public Adult Learning Institutions would be absorbed into Community Education and Training Centres (CETS) capable of offering more diverse programmes better suited towards local needs and which are able to provide knowledge and job skills beyond the more rigid focus on preparing learners to pass the National Senior Certificate examination. 117
In response to the Green Paper’s findings and the recommendations set forth in the Report of the Task Team on Community Education and Development, the Minister of Higher Education and Training published the White Paper for Post-School Education and Training in 2014, which, among other things, introduced the implementation of community colleges established to cater for youth and adults who did not complete their schooling or who never attended school and thus do not qualify to study at a Technical and Vocational Education and Training colleges and universities. The White Paper describes a community college system characterised by multi-campus institutions that group together a number of existing public adult learning centres. Moreover, the policy commits to providing all community colleges with adequate infrastructure and a critical mass of full-time staff and proposes expanding the new campuses where demand necessitates. Community colleges under the policy will link directly with the work of public programmes, such as the Expanded Public Works Programme and the Community Works Programme, to provide appropriate skills and knowledge and work-integrated learning opportunities, while the colleges provide classroom and workshop-based learning. The White Paper envisages enrolment of one million people by 2030, a substantial increase over the 265 000 learners who attended the PALCs in 2011.
The DHET further published its National Policy on Community Colleges on 3 July 2015, which lays out the policy framework for the Community Colleges envisioned in the Minister’s 2014 White Paper, including the governance and management of these institutions, employment of staff, the funding framework programmes and qualification offerings, quality assurance, examinations and assessment and monitoring and evaluation. The National Policy highlights that it seeks to respond to finding that adults and young people who are outside of the formal economy and formal workplace and not in educational institutions are particularly disadvantaged and have few opportunities for access to first or second-chance learning and lifelong learning. In addition to laying out the above framework, the policy shifts the Adult Education and Training function from the provincial education departments to the national competence of the DHET.
While the new policy seeks to improve the quality, adaptability and flexibility of adult education services, including adult basic education, the policy lacks detail concerning a number of important considerations. These include how curricula for various subjects and fields of study will be developed, approved and assessed for quality; the qualifications and training that
114 DHET. 2012. Green Paper for Post-School Education and Training. p 31. Available at http://www.che.ac.za/sites/default/files/publications/DHET_green_paper_post_school_education_training.pdf.
115 Ibid, p 31.116 Ibid.117 Ibid, p 32.
While the new policy seeks to improve the quality, adaptability
and flexibility of adult education services,
including adult basic education, the policy
lacks detail concerning a number of important
considerations.

37 STATE LEGISLATION, REGULATIONS AND POLICIES PROVIDING FOR THE REALISATION OF THE RIGHT TO A BASIC EDUCATION
teachers and principals must attain to become employed at community colleges and how their posts will be allocated; how enrollment capacity will be determined and community outreach programmes will be developed and funded; the degree to which learning and teaching support materials will be made available to learners at community colleges; how subject offerings will be determined at community colleges; the quality of infrastructure that will be provided, such as classroom capacity, electricity and internet connectivity, physical accommodation for disabled learners, computer laboratories and libraries; and monitoring and accountability systems that will be put in place to ensure quality of programming and classroom instruction. Funding is also a concern and an issue that should be investigated further, as the policy does not make clear the extent to which the state will subsidise adult learners, particularly from poor and impoverished backgrounds, who enroll in community college programmes to address backlogs in education attainment. Other funding concerns involve the ability of the Community College system to gain sufficient capacity to quadruple enrollment to meet the Green Paper’s goal of enrolling 1 million learners by 2030 while at the same time providing full-time staff and a more broad curriculum that is not only able to sufficiently prepare learners to pass the National Senior Certificate examination, but to also respond to community knowledge and job skill needs.
3.15. Review of Legislation, Regulations and Policies relating to the quality and adequacy of basic education in South Africa
While the policies discussed in the previous section of this chapter have been successful in significantly increasing enrolment in primary and secondary schools to nearly universal levels amongst learners aged 7 to 18, the quality of South Africa’s public education system continues to require substantial reform. Poor educational outcomes, systemic inefficiencies and human capacity constraints, reports of corruption and patronage and high degrees of inequality within the system have been largely cited as evidence that South Africa’s education system is in a state of crisis.
The post-apartheid education system has had to address a number of historical backlogs, including inherited school infrastructural backlogs resulting from decades of unequal spending practices and teachers who received inadequate training under the Apartheid system. School management and support systems needed to be developed, along with curriculum reform that is capable of ensuring that all learners regardless of their socio-economic circumstances and backgrounds are provided with the opportunity to develop the knowledge and skills necessary to graduate and live socially and economically productive lives in a transformative South Africa. What has ensued from the legal and policy framework is a system where outcomes successes are highly dependent on the successful performances by all role players, including teachers, principals, SGBs, school communities, district offices and national and provincial education departments responsible for developing and implementing policies that ensure adequate teacher training and support; the delivery of a high quality curriculum in classrooms by qualified, skilled and motivated teachers; provisioning of quality learning and teaching support materials; adequate school funding and the provision of school infrastructure capable of providing a school environment that is conducive to learning and teaching. The following section will assess the construct and implementation of the policy framework that ultimately affects the quality of education taught in classrooms.
School Governance, Management, Oversight and SupportA key approach to restructuring South Africa’s education system following apartheid was the implementation of a system featuring cooperative governance amongst national, provincial and local bodies. The Department of Education laid out the construct and reasons for its decentralised system of school governance and management in its Education White Paper 2: The Organisation, Governance and Funding of Schools, which states in pertinent part that:
Other funding concerns involve the ability of the Community
College system to gain sufficient capacity to
quadruple enrollment to meet the Green
Paper’s goal of enrolling 1 million learners by
2030 while at the same time providing full-time staff and a more broad curriculum that is not
only able to sufficiently prepare learners to pass
the National Senior Certificate examination, but to also respond to
community knowledge and job skill needs.

38 Realising the Right to a Basic Education in South Africa
The huge disparities among South African schools require a new structure of school organisation and system of governance which will be workable as well as transformative. Both organisational structure and governance must be adequately uniform and coherent, but flexible enough to take into account the wide range of school contexts, the significant contrasts in the material conditions of South African schools, the availability or absence of management skills, parents’ experience or inexperience in school governance, and the physical distance of many parents from their children’s schools. The South African population has a right to expect that a redesigned school system for a democratic South Africa will be manifestly new, more equitable, and empowering to all who have a direct stake in the success of schooling.
Public school governance is part of the country’s new structure of democratic governance. It must be a genuine partnership between a local community and the provincial education department, with the education department’s role being restricted to the minimum required for legal accountability. Because communities have such varied experience of school governance, it is inevitable that the department’s role in ensuring accountability will differ considerably from one school to another. The balance of decision-making would rest with the school governing body in accordance with its capacity.118
Functions of school management, oversight and support are shared between the PEDs, through their district offices, which are responsible for monitoring, evaluating and supporting teaching and learning at schools; School Governing Bodies (SGBs) responsible for determining various school policies, including admissions and language policies, recommending the appointment of school staff and overseeing the school’s finances and administration of its property; and school principals responsible for day-to-day management of the school, including overseeing curriculum delivery and time management of teachers, management of school finances and resources, as well as managing the school’s relationship with the community and district office. The National Development plan has identified human capacity weaknesses in teaching, management and support as three of the primary causes of South Africa’s poor educational outcomes.119
The South African Schools Act provides the framework governing the roles and responsibilities of SGBs and school principals, as well as oversite functions fulfilled by PED officials, including provincial heads of departments (HODs) and MECs. The Department of Basic Education has also published a Policy on the Organisation, Roles and Responsibilities of Education Districts.
The interconnectedness of the various actors at national, provincial, district, school and local levels is best exhibited in the below diagram taken from the DBE’s Action Plan 2014 policy document. The diagram lays out the roles and responsibilities of the various actors involved in the system, as well as illustrates how the overall functionality of the education system as a whole is reliant on all of the role players fulfilling their mandates effectively and efficiently.
118 Department of Education. 1996. White Paper 2: The Organisation, Governance and Funding of Schools. Available at http://www.gov.za/documents/organisation-governance-and-funding-schools-education-white-paper-2-0.
119 National Planning Commission. 2013. National Development Plan 2030: Our future – make it work. Department of the Presidency. p 302.
The South African Schools Act provides
the framework governing the roles and responsibilities of SGBs and school principals,
as well as oversite functions fulfilled by
PED officials, including provincial heads of
departments (HODs) and MECs.

39 STATE LEGISLATION, REGULATIONS AND POLICIES PROVIDING FOR THE REALISATION OF THE RIGHT TO A BASIC EDUCATION
Figure 3. 1: Illustration of accountability and support functions of role players involved in the provision of basic education in South Africa’s public schooling system
Source: DBE. 2012. Action Plan to 2014 – Towards the Realisation of Schooling 2019. Department of Basic Education.
Pretoria, p 99
Roles and Responsibilities of School Governing Bodies to provide learners with quality schoolsThe South African Schools Act provides for democratically elected School Governing Bodies (SGBs) to preside over all public schools in South Africa. SGBs consist of the school’s principal who represents the HoD and is uniquely positioned to articulate the needs and challenges of the school, and elected representatives of the school’s community, including parents, teachers and if the school is a secondary school, learners. To maintain the school as a community-based institution, SASA mandates that parents comprise the majority of SGB members.
Each SGB is empowered under SASA to determine the school’s admission policy and impose codes of learner conduct and discipline; recommend and consult with PEDs on the appointment of staff, including the school’s principal and teachers; determine, collect and administer school fees; fund and appoint additional teachers if funds allow; and prepare the school’s fund and annual budget. SGBs are also responsible for determining the school’s language policy which has a profound impact on teaching and learning, particularly during the foundation phase when it is recommended that language of instruction be taught in mother tongue languages. In addition to these responsibilities, schools may apply for Section 21 powers, which enable approved schools to maintain and improve school property, determine extra-mural curriculum, purchase learning and teaching support materials such as textbooks, library books and laboratory equipment; and pay for school services such as utilities.
Section 36 of SASA mandates that SGBs take all reasonable measures within their means to supplement the resources supplied by the State in order to improve the quality of education provided by the school to all learners at the school. This provision enables SGBs to obtain additional funding through school fees, as well as through other measures such as fundraising drives or by approaching 3rd parties for donations or grants.
While the policy to decentralise school governance to local school communities can have the effect of fostering grass root involvement in schools and empowering school communities

40 Realising the Right to a Basic Education in South Africa
to oversee that conduct, funding, language, staff appointment and budgeting policies and decisions serve local needs, SGBs can only be effective if they have the capacity to fulfill their mandates. Concerns, however, have been raised about the ability of parents, particularly from poor and impoverished communities, to have the ability to fulfill these important roles. The National Planning Commission recognized the systems’ failure to account for and respond to these challenges when it found that “many governing bodies are significantly hampered by parents’ lack of expertise and social status relative to school staff” and recommended that the DBE “give additional support to governing bodies.”120 That schools communities are not equally situated to exercise these responsibilities further contributes to inequalities across schools, as the DBE has acknowledged that schools that are capable of exercising Section 21 powers do not suffer from the same degree of late delivery of resources such as textbooks as non-section 21 schools.121 Other inequalities can be found in the degree of resources that SGBs of wealthier schools may provide when compared to SGBs from poor communities. These resources range from time and financial expertise, as well as connections to corporate donors or political muscle that can be used to gain improved access to state resources that can be used to improve a school’s physical resources such as school infrastructure, library facilities or sports fields.122
Nick Taylor has also stressed the need to improve the capacity of SGBs to ensure that they are able to effectively exercise the duty to, among other things, select effective school leadership and oversee that their schools are managed properly. Taylor has stated that “Getting the kind of skills onto an SGB able to select and support an excellent principal is the first problem in poor communities where unemployment and illiteracy are rife, the principles of institutional governance little understood, and unions dominate proceedings, even though they only have observer status on SGBs.”123 Given the vital role that the principal and other staff involved with managing a school play, it is fundamentally important that SGBs be capacitated to ensure that effective hiring of school leaders takes place and that union patronage and cadre deployment not interfere with hiring the most qualified staff members available.
While some SGBs lack the capacity to effectively fulfil their roles and responsibilities, a number of instances have also come to light where SGBs have abused their powers to limit learners’ ability to access quality schools. Three of the four Constitutional Court cases outlined above, namely Ermelo, Rivonia, and Harmony, concern the ability of SGBs to limit access to schools through (1) language policies that refuse to accommodate learners who speak a different language from the school’s chosen language of instruction; (2) admissions policies that limit school capacity to ensure far smaller classroom sizes than other nearby overcrowded schools; and (3) disciplinary policies that exclude learners who fall pregnant. While the Constitutional Court ultimately ordered the schools to admit the affected learners, the refusal of the SGBs at those schools to accommodate learners in contravention of their right to a basic education demonstrates the potential conflict that exists when SGBs use their powers to advance the exclusive interests of learners already enrolled in their schools at the expense of excluding other learners. This conflict is particularly problematic given the high degree of inequality within the system attributed at least in part to the imposition of school fees and the superior school infrastructure inherited by former model-C schools, demand from parents to send their children to better resourced schools that achieve greater outcomes and the need for provincial authorities to place all learners in a limited number of schools and to efficiently utilise government resources.
A recent High Court case in Gauteng between the Federation of Governing Bodies of South African Schools (FEDSAS) and the Gauteng Department of Basic Education illustrates the tension between SGBs who set school language and admissions policies and provincial officials responsible for ensuring adequate placement of all learners in schools. SGBs in that case had brought an urgent court application to prevent the provincial education department from following through with its stated plans to convert 124 single-medium Afrikaans schools to parallel-medium schools. The provincial education department contended that the conversion of under-attended single medium Afrikaans language schools is necessary to address overcrowding at Gauteng schools and is therefore necessary to ensure the realisation of the right to education for all learners by ensuring that there are a sufficient number of places at
120 National Planning Commission. 2013. National Development Plan Vision 2030, p 311.121 DBE. 2011. Action Plan to 2014 – Towards the Realisation of Schooling 2025. Pretoria: DBE. p 146. 122 Van Wyk, N. 2007. ‘The rights and roles of parents on school governing bodies in South Africa.’ 2007. 1:0 International Journal about Parents in
Education, 132.123 Taylor, N. 2011. Priorities for Addressing South Africa’s Education and Training Crisis: A Review Commissioned by the National Planning
Commission. Johannesburg: JET Services. 20 June 2011. p 54. Available at http://jet.org.za/publications/research.
Nick Taylor has also stressed the need to improve the capacity
of SGBs to ensure that they are able to effectively exercise the duty to, among other things, select
effective school leadership and oversee
that their schools are managed properly.

41 STATE LEGISLATION, REGULATIONS AND POLICIES PROVIDING FOR THE REALISATION OF THE RIGHT TO A BASIC EDUCATION
schools to accommodate all of the province’s learners.124 The Gauteng High Court ruled in favor of FEDSAS, finding that the Department must consider, along with other relevant and lawful considerations, the admission and language policies of the schools when making decisions which affect school admissions.125 The Gauteng Department of Education has indicated that it will appeal the judgment.
RECOMMENDATIONS:1. Measures should be taken to ensure that SGBs have the capacity to effectively
carry out their roles and responsibilities, particularly with respect to the hiring of quality school leadership. This should include support from district offices that are capable of identifying areas where support is needed and addressing insufficiencies through training programmes and other partnerships.
2. Provincial authorities should link SGBs struggling with capacity to skilled individuals from civil society, academia and the private sector that would be capable of working with members of school communities and SGBs to understand their needs and assist with the development of effective school policies, plans and budgets.
3. Provinces should monitor the actions of SGBs to ensure that they are fulfilling their mandates properly and in accordance with the law. Provincial authorities should ensure that policies and actions of SGBs do not violate the rights of learners nor their fiduciary duty to manage their schools in the interests of the broader community and not only in the interests of those who happen to be learners and parents at the time.
The Roles and Responsibilities of School Principals to provide learners with functional schoolsThe principal manages the school under the authority of the provincial Head of Department. Principals are responsible for overseeing teaching and learning of the curriculum and time use by teachers, managing school finances and records, including educator and learner attendance and evaluation records; school resources including LTSM; and managing the school’s relationship with the community and local district office. Principals are ultimately responsible for ensuring that teachers are in class on time, teaching during the school day and covering the curriculum while they are in class.
Each year, school principals are required to prepare School Improvement Plans in collaboration with district officials and SGBs in response to recommendations made in the school’s Whole School Evaluation Report.126 The principal is then responsible for consulting with all stakeholders and thereafter working with the District Manager and support services to implement the plan within stipulated time frames.
In 2007, Parliament amended SASA to include Section 16A, outlining the Roles and Functions of principals at public schools. In addition to describing the functions outlined above, the Amendment requires principals to prepare and submit certain reports to the HoD on an annual basis, including reports detailing the school’s academic performance and effective use of resources. Principals of schools determined to be underperforming schools must work with HODs to develop and implement an academic performance improvement plan setting how academic performance at the school will be improved.
Nick Taylor has emphasised that the “appointment of a good principal who is both an inspiring leader and a good technical manager has been shown to make a difference to the quality of
124 See eg Rehlaga, M. GDE to Appeal FEDSAS School Language Ruling. Eyewitness News. 27 May 2015. available at http://ewn.co.za/2015/05/27/Education-MEC-prepared-to-appeal-SGB-language-ruling
125 FEDSAS v the Member of the Executive Council, Department of Basic Education, Gauteng Province and others, High Court of South Africa, Gauteng Local Division, Johannesburg, Case No. 2015/18246, 26 May 2015.
126 The Whole School Evaluation is part of the IQMS process and is used to evaluate the overall effectiveness of a school as well as the quality of teaching and learning. The evaluation consists of a combination of external evaluations of the school by the education district overseeing the school and an internal assessment of the school and must include strategies to improve (1) school functionality; (2) leadership, management and communication; (3) governance and relationships; (4) the quality of teaching and learning and educator development; (5) curriculum provision and resources; (6) learner achievement ; (7) school discipline; (8) school infrastructure; (9) parent and community relationships. See DBE, Integrated Quality Management System (IQMS) for School-Based Educators.

42 Realising the Right to a Basic Education in South Africa
schooling, even in schools which serve the poorest communities.”127 Stephen Taylor has similarly found that the indicator most associated with school achievement is not simply the resources, such as adequate learner : teacher rations, teachers with high rates of subject knowledge or school resources, but rather how well these resources are managed. Accordingly, Stephen Taylor found indicators such as an organised learner environment signified by curriculum planning for the full year, a functional timetable, good quality inventories of learner and teaching support materials, low teacher-absenteeism and up-to-date teacher assessment records to be strongly linked to higher rates of learner achievement.128
NEEDU has emphasised the principal’s key role with respect to ensuring that classroom time is maximised, stating that:
“The first responsibility of a school principal is to ensure that learning time is maximised. Insisting on attendance, punctuality and a focus on work when in class not only optimises the use of time, but through such behavior learners learn self-discipline and the value of good school work habits. NEEDU estimates that such a culture is maintained in around 60% of rural schools, which is far too low. Changing a culture of loose time management is not easy and requires a combination of inspirational leadership and consistent application.”129
Results from the National School Effectiveness Study administered in 2007 through 2009 further highlight the need for principals to be aware of the teaching practices occurring in their schools, as gains in learner achievement scores over that time were higher in schools where internal monitoring occurred through classroom visits.130 This finding demonstrates the need for principals to be trained through professional development and training programmes in assessing teacher practices and understanding that the role of the principal is not just disciplinary and administrative, but also includes supporting teachers and ensuring that quality teaching and learning takes place in classrooms. Principals must also be aware of challenges that teachers at the school have so support measures, such as targeted teacher training programmes, may be coordinated with district offices and implemented through district and school-level support.
Widespread focus has been on how to ensure that schools hire principals that satisfy certain competency criteria and are capable of fulfilling the roles and responsibilities of the position. The National Development Plan underscores the need for school principals to be appropriately qualified and competent, recommending that the DBE:
“Change the appointment process to ensure that competent individuals are attracted to become school principals. As in other senior management positions, candidates should undergo a competency assessment to determine their suitability and identify the areas in which they would need development and support.
Eliminate union influence in promoting or appointing principals. Unions play an important role in recruitment to ensure that proper procedures are followed, but not in deciding who gets promoted and appointed. Most of the undue influence by unions is possible because the district officials responsible for recruitment and human resources management have a limited understanding of labour laws. The Department of Basic Education and provincial departments of education must ensure that human resources management capacity is improved.”131
The National Development Plan further demands that the DBE implement an entry qualification for principals, as well as introduce performance contracts for principals and deputy principals to help principals find ways to improve their performance every year, including identifying training needs and replacing principals who repeatedly fail to meet performance targets.132
127 Taylor, N. 2011. Priorities Addressing South Africa’s Education and Training Crisis: A Review commissioned by the National Planning Commission. Johannesburg: JET Education Services. 10 June 2011. p 54.
128 Taylor, S. 2011. ‘Uncovering indicators of effective school management in South Africa using the National School Effectiveness Study.’ Stellenbosch Economic Working Papers 11/12, p 43. Available at http://www.ekon.sun.ac.za/wpapers/2012/wp112012/wp-11-2012.pdf
129 NEEDU. 2013. National Report 2013: Teaching and Learning in Rural Primary Schools. Pretoria: The National Education Evaluation and Development Unit. p. 29. Available at www.education.gov.za/LinkClick.aspx?fileticket=N%2bblTtd9Ofw%3d&tabid=687&mid=2604.
130 Taylor, S. 2011. ‘Uncovering indicators of effective school management in South Africa using the National School Effectiveness Study.’ University of Stellenbosch. Stellenbosch Economic Working Papers 11/12, p 42.
131 National Planning Commission. 2013. National Development Plan: Vision to 2030. p 309 – 310.132 Ibid, at p 310.
Widespread focus has been on how to
ensure that schools hire principals that satisfy certain competency
criteria and are capable of fulfilling the roles
and responsibilities of the position.

43 STATE LEGISLATION, REGULATIONS AND POLICIES PROVIDING FOR THE REALISATION OF THE RIGHT TO A BASIC EDUCATION
The need to remove union influence from the process of the appointment of principals, as well as other education posts such as school-level Heads of departments and education district positions, has been widely viewed as necessary to improve the functionality of schools. Nick Taylor has highlighted the damage that patronage appointments to important managerial posts has caused to the functionality of schools and district offices, stating that:
“Institutionalised nepotism undermines the use of expertise as the main criterion in the recruitment and promotion of teachers, principals, and system level officials. It has become clear that in many parts of the country appointments to all positions in the school system are subject to union regulation. The result is widespread nepotism, which is destructive in two ways. First, it results in inappropriate people being appointed to positions for which they are ill equipped: under these conditions institutional dysfunctionality becomes the norm. Second, and far more important, the distribution of opportunity by patronage signals that expertise is irrelevant and its development and deployment is not the way to get ahead; instead, the livelihood of teachers and principals depends on the cultivation of networks held together by unions and political and civic associations. It is obvious that the systemic improvement of schooling is dependent on a political solution to this problem.”133
The effects of nepotism in promotional posts are echoed in Fleisch’s finding that there is a deep distrust of teachers for their immediate supervisors, as teachers are not convinced that they have the content knowledge or the supervisory skills required to fulfil the function that they are supposed to fulfil.134
NEEDU has similarly emphasised the need for principals, as well as other candidates for other promotional posts such as school HODs, district office Subject Advisors and Circuit Managers, to be appointed based on merit and demonstrated expertise rather than patronage. To this end, NEEDU has recommended that competency tests be developed and administered to applicants seeking appointments to leadership and managerial positions.135 Once suitable tests have been identified and piloted, NEEDU recommends that the Minister of Basic Education promulgate regulations mandating their use during the appointment process of principals, Subject Advisors and school-level HODs. The DBE announced plans to implement a number of programmes to improve the qualifications and performance of school principals and others in school leadership and management positions in a 12 May 2015 presentation to the Parliamentary Portfolio Committee on Basic Education. The DBE’s planned programmes include developing standards for South African principals; the development of an advanced diploma in leadership and management; the review of appointment procedures of School Management Teams (SMTs) and principals with clear selection criteria in terms of teaching and managerial experience, competency, learner results and cases of misconduct; competency assessments for principals; training of principals on curriculum and financial management; and induction programmes for principals.136 The DBE’s announcement underscored a number of problems which the above programmes aim to address, including that teachers are not trained to be managers and as a result, newly appointed managers find themselves in promotional posts unprepared. The lack of availability of pre-service training programmes then requires new managers to learn on the job. While improved access to management training and qualifications programmes could be a valuable tool in terms of advancing the need for high quality management in schools if implemented effectively, issues remain in terms of how these programmes will be developed and rolled out to principals and other school managers, particularly in rural areas, who have limited access to transportation and whose absence while attending these programmes could cause additional problems for school functionality.
In 2014, the Western Cape Education Department (WCED) piloted Competency Based Assess-ments for shortlisted candidates for principal posts to ensure that the most qualified candidates are appointed and that training needs are identified. The WCED now plans to expand these
133 Taylor, N. 2011. ‘Priorities Addressing South Africa’s Education and Training Crisis: A Review commissioned by the National Planning Commission.’ Johannesburg: JET Education Services, 10 June 2011. p 18.
134 Fleisch, B. 2015. ‘Some Thoughts on Teachers.’ In Equal Education. Taking Equal Education in the Classroom: The challenges to teaching and learning and possible campaigns to address the crisis of quality and equality in the pedagogic encounter. Equal Education. p 84. Available at https://www.equaleducation.org.za/file/2015-06-29-taking-ee-into-the-classroom.
135 NEEDU. 2013. National Report 2013: Teaching and Learning in Rural Primary Schools. Pretoria: The National Education Evaluation and Development Unit. p 57.
136 DBE. 12 May 2015 Presentation to the Portfolio Committee on Basic Education. ‘Improving Leadership and Management in Schools.’ Available at https://pmg.org.za/committee-meeting/20830/.

44 Realising the Right to a Basic Education in South Africa
assessments to applicants for Deputy Principal and Head of Department positions, though assessments as of the 2015 school year have not been made into prerequisites for appointment.137
RECOMMENDATIONS:1. School principals at poorly performing schools should be assessed to determine
whether they have the capacity to carry out the needed school leadership functions. Assessment should include, among other things, the extent that teachers at a school are executing effective time management practices and whether systems, such as attendance registers and class timetables are in place and being utilised.
2. Systems, including competency testing and regulations, should be put in place to ensure that principals and other school leadership positions are filled based on merit and demonstrated expertise, such as applicants having served as successful HODs or deputy principals, and not as a result of patronage or union influence.
3. Support to principals should include enhanced guidance on how principals can ensure that effective and efficient teaching and learning is occurring in classrooms. This support should guide principals to better understand their roles and responsibilities with respect to ensuring that the curriculum is effectively being covered in each classroom every day.
4. Performance agreements should be introduced that make clear the roles and responsibilities that principals must fulfil. The performance agreements should lay out improvements that the principal is to make for the school year, as well as identify training needs that the principal is to address.
5. Principals should be trained to incorporate results from Annual National Assessment into school improvement plans and to match needs identified in the tests to available targeted interventions, such as teacher training programmes or other programmes that are available to assist struggling learners.
The Roles and Responsibilities of Education Districts to ensure that public schools are monitored and supportedEducation District offices serve as the link between Provincial Education Departments, schools and the public. As the primary institution responsible for monitoring and supporting schools, the DBE has referred to the role of education districts as “pivotal” in ensuring that learners are able to realise their rights to a basic education.138 Educational districts are organised and staffed by provincial education departments under national post provisioning norms and as a whole, constitute the primary institution tasked with implementing national education policies, such as curriculum training programmes, in schools. District offices are subdivided into circuits. Officials include the District Director, Circuit Managers, Curriculum Management and Professional Development officials, Institution Management, Development and Support officials, e-learning officials, Special Education Programme Officials and District Operation Officials.
Despite the important roles that district offices play in terms of supporting and ensuring the implementation of national education policies, no district policy existed at the national level until 2013 when the DBE published the policy guidelines, The Organisation, Roles and Responsibilities of Education Districts. This policy, among other things, provides a national framework for the organisation and staffing of education district offices and defines the roles and responsibilities of districts officials. 139 Subject to provincial plans, District offices work collaboratively with principals and educators in schools to improve access and retention, provide management and professional support and help schools improve teaching and learning. The policy describes education districts as being responsible for fulfilling the following four roles:
137 Schafer, Debbie. ‘WCED to roll out further competency assessments.’ politics web. 21 April 2015. Available at: http://www.politicsweb.co.za/news-and-analysis/wced-to-roll-out-further-competency-assessments--d
138 DBE. 2013. Policy on the Organisation, Roles and Responsibilities of Education Districts. Notice 300 of 2013. Government Gazette, 3 April 2013. p 4. Available at http://www.gov.za/documents/national-education-policy-act-policy-organisation-roles-and-responsibilities-education
139 Ibid.
Education District offices serve as
the link between Provincial Education
Departments, schools and the public.

45 STATE LEGISLATION, REGULATIONS AND POLICIES PROVIDING FOR THE REALISATION OF THE RIGHT TO A BASIC EDUCATION
1. Planning, which District offices fulfil by collecting and analysing school and district data and assisting schools with compiling and implementing school improvement plans;
2. Support, whereby District offices provide schools with physical resources and targeted support necessary for schools to comply with education law and policy. District offices are responsible for supporting principals and teachers to improve the quality of teaching and learning through school visits, classroom observation, feedback, provision of curriculum experts such as Subject Advisors and the provision of professional development programmes;
3. Oversight and Accountability through holding principals and schools accountable for their performance and accounting to the PED for the performance schools; and
4. Engaging with the public.
The National Development Plan has specifically identified District offices as being one of the areas of the public education system suffering from weak capacity restraints and states that “many of the weaknesses in schools are a reflection of weaknesses at the district level.” The DBE’s district policy similarly acknowledges that many district offices suffer from capacity constraints and other institutional organisational shortcomings, including that: (1) districts are responsible for too many schools; (2) there is a lack of clarity in terms of the roles, responsibilities and authority of district offices and officials; (3) there is a lack of delegated authority to plan and develop programmes, manage budgets and recruit and deploy staff members, causing intolerable bureaucratic delays and an inability to plan and develop programmes and manage budgets; (4) districts lack necessary financial resources; and (4) districts suffer from inefficient post-provisioning resulting in unevenly disbursed posts amongst districts and circuits, unfilled posts and under-qualified staff lacking the training necessary to handle their administrative, management and professional responsibilities.
Schools often complain that district support is infrequent, as District offices are often under-staffed140 and lack the human and capital141 resources needed to conduct regular visits to schools and offer the support that schools need in terms of specialised targeted interventions by Subject Advisors. Other complaints have been that district officials, such as Subject Advisors and Circuit Managers, themselves often lack the capacity to fulfil their mandates in terms of supporting school principals and teachers. The national policy on education districts does not appear to remedy these shortcomings as it does not instruct provinces on how much of the provincial education budget should be directed to education districts or what their staffing levels must be. Nor does the policy provide norms and standards for qualifications that individuals appointed to key staff positions must possess. This is a significant shortcoming given that there have been widespread allegations that the appointment of District officials responsible for fulfilling important functions such as implementing teacher training programmes, overseeing school management, teaching curriculum coverage at schools and ensuring that schools are equipped with adequate infrastructure and textbooks, are often based on patronage, nepotism and union demands rather than merit.142
The School Monitoring Survey which the DBE administered in 2011 showed that district support, particularly with respect to school visits by curriculum/subject advisors, varies widely amongst provinces and is least frequent in the worst performing provinces. The report on the School Monitoring Survey found that while curriculum/subject advisors are required to visit schools twice per term, amounting to eight times per school year, this standard was not being met in the majority of schools. Moreover, 34% of educators received only one visit per school year. Provincially, 46% of educators in Limpopo, 40% of educators in Kwazulu-Natal and 39% of educators in the Eastern Cape received only one visit from a Curriculum Advisor per year while 84% of educators in Gauteng and 85% of educators in the Western Cape received more
140 NEEDU highlights the lack of sufficient support that District officials such as Subject Advisors are able to provide to schools. NEEDU states in its 2013 report on the State of Literacy Teaching and Learning in the Foundation Phase that “while these [school] visits are no doubt good for morale, and while they may be more effective in addressing management issues, they can have little substantive effect on teacher knowledge. Consider the typical situation of FP language Subject Advisors responsible for over 100 schools. At best, she can visit each school once a year, spending at most a few hours with each teacher in the school, contact which is quite inadequate in addressing the kinds of knowledge shortcomings described under section 3.3 above.” - at p. 61.
141 See, eg Task team appointed to conduct an investigation into the implementation of Maths, Science and Technology Strategy. 2013. Investigation into the Implementation of Maths, Science and Technology.’ Department of Basic Education. p 22. Available at http://www.education.gov.za/LinkClick.aspx?fileticket=rMWDa1cHh3I%3d&tabid=358&mid=1301, which lists that district offices lack adequate access to computers, printing and photocopying facilities, internet connectivity, access to vehicles needed to visit schools and office space.
142 See, eg NEEDU. 2013. National Report 2013: Teaching and Learning in Rural Primary Schools. Pretoria: The National Education Evaluation and Development Unit. p 22.
The School Monitoring Survey which the DBE administered in 2011 showed that district support, particularly
with respect to school visits by curriculum/
subject advisors, varies widely amongst provinces and is least frequent in the worst performing provinces.

46 Realising the Right to a Basic Education in South Africa
than one visit per year.143 The School Monitoring Survey accordingly found that “schools which are most likely to need monitoring and support, namely those in the lowest two quintiles, were less likely to have received at least two visits from a district official during the year.144” NEEDU’s report on rural schools further highlighted that district support is often either lacking altogether or insufficient. 10% of monograde and 19% of multigrade schools visited during the course of preparing that report indicated that they had received no visits from Circuit Mangers in the past year. Even more remarkably, 24% of monograde and 36% of multigrade schools visited by NEEDU reported not having had a single visit from a Subject Advisor in the past year.145
Of additional concern is the low level of satisfaction that school principals have reported with respect to visits by district officials. The School Monitoring Survey found that nationally, only 60% of principals were satisfied with visits by District officials at least 50% of the time while only 34% of principals reported that they were satisfied with the level of support provided.146 Provincially, only in Gauteng and the Western Cape did the majority of principals report being satisfied with district support services (63%). On the other hand, only 26% of principals from KwaZulu-Natal, 24% of principals in the Eastern Cape and 28 % of principals from Limpopo reported that they were satisfied with the level of support provided. A 2013 Ministerial Investigation Into the Implementation of Maths, Science and Technology echoed these concerns, finding that “teachers are generally desperate to upskill themselves and have become frustrated with the lack of proper training offered and supplied by their District Departments” and that “There may also be a sense that many district officials are not trained or skilled to oversee and support teachers, i.e. that many district officials lack professional credibility.”147
NEEDU has further underscored and attributed the capacity constraints of district officials, particularly in Circuit Manager and Subject Advisor positions, as largely due to improper appointment processes that allow many under-skilled and under-qualified principals and school-level HODs to be promoted to district posts. NEEDU states that “[i]n many schools teachers with poor subject knowledge receive little help from school leaders, whose knowledge resources are little stronger. HODs and principals, in turn, are promoted to positions in circuits, districts and provinces without necessarily exhibiting superior subject knowledge, pedagogical skills or management capacity.”148
District support is a vitally important aspect of the structure of South Africa’s education system. Given the decentralised construct of South Africa’s education system which emphasises local management and operation of schools, it is essential that schools have access to monitoring and support services capable of identifying and addressing shortcomings in governance, management and teaching and learning. This is particularly the case in provinces and geographic regions that suffer from high rates of poverty and other socio-economic challenges, including undereducated parents and teachers. The lack of capacity at the district level identified in the National Development Plan, described in various surveys of schools and apparent through poor teaching and managerial practices must be addressed through not only improved policy initiatives that ensure greater capacity and accountability at the district level, but also through improved implementation and hiring practices.
143 DBE. 2013. Report on the National School Monitoring Survey 2011 (DBE013, Conducted in 2011). Pretoria: Department of Basic Education. 144 Ibid, at p 220. The School Monitoring Survey found that 84% of Quintile 1 and 83% of Quintile 2 schools reported having had at least two
visits from district officials per year, while 95% of Quintile 5 schools reported having at least two visits from district officials per year.145 NEEDU. 2013. National Report 2013: Teaching and Learning in Rural Primary Schools. Pretoria: The National Education Evaluation and
Development Unit. p 35. 146 DBE. 2013. Report on the National School Monitoring Survey 2011 (DBE013, Conducted in 2011). Pretoria: Department of Basic Education.
p 226.147 Task team appointed to conduct an investigation into the implementation of Maths, Science and Technology Strategy. 2013. ‘Investigation
into the Implementation of Maths, Science and Technology.’ Department of Basic Education, p 18 – 21.148 NEEDU. 2013. National Report 2013: Teaching and Learning in Rural Primary Schools. Pretoria: The National Education Evaluation and
Development Unit. p 22.
NEEDU has further underscored and
attributed the capacity constraints of district officials, particularly in Circuit Manager
and Subject Advisor positions, as largely
due to improper appointment processes that allow many under-
skilled and under-qualified principals
and school-level HODs to be promoted to
district posts.

47 STATE LEGISLATION, REGULATIONS AND POLICIES PROVIDING FOR THE REALISATION OF THE RIGHT TO A BASIC EDUCATION
RECOMMENDATIONS:1. The DBE’s district policy fails to commit to a core level of service that districts
are required to perform in terms of supporting and monitoring schools under their care. Given concerns with capacity constraints at the district level and the vital role that these offices play in terms of ensuring that schools are functioning properly and that adequate teaching and learning takes place in classrooms, the DBE should either perform audits or mandate reporting by provincial authorities on (1) the extent that personnel vacancies exist that must be filled; (2) deficiencies in subject knowledge and administrative skills of district officials so that training programmes may be designed and implemented; and (3) financial and other resource constraints that negatively impact the services that district offices are able to provide to schools.
2. The national district policy should detail the minimum core services that district offices and their officials should provide to schools and should guide provinces in terms of the staffing and capital requirements needed to support and monitor schools.
3. As outlined in the principal section above, the appointment of District officials, such as Circuit Managers, Subject Advisors and Curriculum Advisors must be based on merit and not patronage. The DBE should set appointment norms with respect to the qualifications and experience necessary to be promoted to district office positions.
4. District officials should be trained and qualified to work with data obtained from sources such as Annual National Assessments so trends may be identified and used to develop effective intervention strategies to improve learner performance and teacher skill and subject knowledge, and reduce drop-out rates.
School Monitoring and Accountability SystemsSouth Africa’s Constitution and legislation governing the education system provide for a number of accountability mechanisms that enable national and provincial education departments to oversee the functioning of school management and governance, identify areas where support is needed and intervene when necessary and justified. These processes include Annual National Assessment and National Senior Certificate examinations that enable provinces and national government to assess the outcomes of teaching and learning in schools, education districts and provinces.
Section 8 of the National Education Policy Act of 1996 provides for the monitoring and evaluation of the basic education system. That Section, among other things, states that “the Minister shall direct that the standards of education provision, delivery and performance throughout the Republic be monitored and evaluated by the Department annually or at other specified intervals, with the object of assessing progress in complying with the provisions of the Constitution and with national education policy.” NEPA further specifies that the monitoring and evaluation shall include the analysis of data gathered by means of education management information systems (EMIS) in co-operation with provincial education departments. The DBE is required to prepare a report on the results of each investigation which it undertakes. If the report indicates that the standards of education, provision, delivery and performance in a province do not comply with the Constitution or education policy, the Minister must inform the relevant provincial head of education. The Provincial head of education must then respond with a plan to remedy the situation within 90 days.
In 2007, Parliament amended SASA to provide for the monitoring and support of under-performing schools through Section 58(B), which among other things requires identification and reporting protocols at various levels of government. Specifically, Section 58B requires provinces to notify schools identified as underperforming. The school’s principal is then required to submit a School Improvement Plan (SIP) identifying how the school will address and remedy the underperformance to the provincial HoD and table the plan at a SGB Meeting.

48 Realising the Right to a Basic Education in South Africa
The HoD is then required to approve the plan, as well as take all reasonable steps to assist the school, including assessing the capacity of the school’s educators, principal and SGB and taking action to support or replace school officials and governing bodies if necessary. Moreover, each provincial MEC is then required to report to the Minister of Basic Education within three months after the end of the school year on the actions he or she has taken to support the schools identified as underperforming in his or her province.
Concern has been raised over the extent to which this provision has been implemented by national and provincial education departments. The DBE has defined underperforming schools as secondary schools that have a pass rate of below 60% in the NSC examination and primary schools with more than 50% of learners performing at grade 3 or below on the literacy portion of the grade 3 and 6 ANA examinations.149 Firstly, this interpretation fails to identify dysfunctional schools with high rates of learners who drop-out prior to taking the NSC examination, a common problem in a system where nationally, approximately 50% of learners who enter the system never sit for the NSC examination. Secondly, this criterion can lead to perverse incentives for schools to hold back learners or encourage them to drop-out in order to ensure a higher NSC pass rate. Secondly, the use of ANAs to determine underperformance can also be seen as a concern since ANA examinations are graded by the schools themselves rather than externally, leading to questions of whether such a system with such low levels of verification and oversight can be viewed as reliable and transparent given the incentives involved. Also concerning is the high rates of non-compliance by provinces with respect to their reporting obligations and the DBE’s failure to take action against provinces who have failed to report on underperforming schools under their care. Following a request for information on provincial reporting on underperforming schools in 2012 by the Equal Education Law Centre, the DBE admitted that it had not received a single report from any provincial education department on the actions taken with respect to underperforming schools.150 The national and provincial education departments’ failure to comply with these reporting mandates is even more troubling considering that Section 58B had been in effect for five years when this oversight was first discovered and during that time over 1400 secondary suffered from pass rates below 60%.151
Whole School Evaluations are conducted every three years to evaluate the overall effectiveness of a school as well as the quality of teaching and learning. The evaluation policy, which was implemented at a national level in 2001, consists of a combination of external evaluations of the school by the education district overseeing the school and an internal assessment of the school led by the school’s principal. Whole School Evaluations are conducted at each school every 3 to 5 years and include a practice whereby district officials review key school management documents and the school’s self-evaluations, as well as observe a sample of educators teaching in their classrooms. Key areas of evaluation are (1) the school’s basic functionality; (2) School leadership, management and communication; (3) Governance and relationships; (4) Quality of teaching and learning and educator development; (5) Curriculum provision and resources; (6) Learner achievement; (7) School safety, security and discipline; (8) School infrastructure; and (9) the school’s parents and community. Results from the Whole School Evaluation are used to develop improvement strategies for schools. The evaluation policy is specifically distinguished from the school inspection system carried out by the apartheid regime and is instead viewed by the DBE as a “partnership between supervisors, schools and support services at one level, and national and provincial government at another.”152
149 Equal Education & the Equal Education Law Centre. 2014. Basic Education Shadow Report: A Review of the Department of Basic Education’s Performance in the 2013/14 Financial Year. Khayelitsha: Equal Education. p 25.
150 Ibid, at p 24.151 Ibid, at p 25.152 Department of Education. 2001. The National Policy on Whole-School Evaluation. Government Gazette Vol. 433, No. 22512. Pretoria. Available
at http://www.education.gov.za/TheDBE/DBEStructure/GET/WholeSchoolEvaluation/tabid/102/Default.aspx.
Concern has been raised over the extent to which this provision has been implemented
by national and provincial education
departments.

49 STATE LEGISLATION, REGULATIONS AND POLICIES PROVIDING FOR THE REALISATION OF THE RIGHT TO A BASIC EDUCATION
RECOMMENDATIONS:1. The DBE and provincial education departments must comply with the mandates
outlined in Section 58B of SASA;
2. An investigation should be undertaken to consider additional criteria that the DBE should use to identify underperforming schools, including drop-out and repetition rates;
3. The DBE should use the information gained from provincial reporting to assist in the development of future policies that may be used to guide provinces on effective intervention measures to support underperforming schools.
The provision of trained, qualified, knowledgeable, skilled and motivated teachers in schoolsOne of the greatest challenges for the post-democratic South African education system has been how to ensure that all schools are allocated with sufficient numbers of qualified, skilled and motivated teachers. Despite the implementation of numerous policy initiatives and attempts by government to improve training for new teachers and advance the professional development of more experienced teachers, South Africa’s teaching force continues to be plagued by a number of deficiencies. These include shortages of teachers in key subject areas such as maths, sciences and African home language of instruction, teachers with poor subject and pedagogical knowledge and teaching skills, inadequate teacher performance in classrooms and high rates of late coming and teacher absenteeism resulting in lost teaching time and poor curriculum coverage. The DBE’s 2011 Action Plan to 2014 policy outlined some of the challenges that the democratic government has faced since the end of apartheid in terms of providing sufficient numbers of adequately trained, qualified, motivated and capable teachers to schools and their learners. That policy noted that:
“Apartheid, especially following the 1953 Bantu Education Act, was characterised, not only by segregation in schools, but also, most crucially, by segregation in the training of teachers. Different groups of teachers experienced training that was different in terms of its resourcing, its quality and its ideological thrust. Individual teachers, teachers unions, NGOs and government have done much work over the years to erode the apartheid teacher training legacy through, for instance, new in-service training programmes and the promotion of common values through the mass media. Yet, this apartheid legacy will remain present for many years to come. To some extent it will continue to be necessary to address these legacy problems directly in the design of in-service training and in the way training programmes are targeted towards teachers.”153
The National Development Plan has further identified the need to improve the capacity of teachers as one of the primary areas of South Africa’s education system requiring attention, emphasising the need to produce more and better qualified teachers.154 The DBE has similarly identified problems regarding teachers’ lack of capacity, need for professional development through district support services, improvement to provincial implementation of post provisioning norms and need for qualified teachers in subjects such as mathematics, sciences and African languages.155
Due to the segregated and vastly unequal education system propagated under apartheid, many of today’s teachers, particularly those teaching in township and rural schools, were themselves educated and trained under inferior conditions and subjected to different standards of qualifications. Accordingly, many of the massive disparities that existed amongst teachers
153 DBE. 2011. Action Plan to 2014 – Towards the Realisation of Schooling 2025. Pretoria: DBE.A12 June 2015. n Shocking State.’2013.BEsionouth Africa. ducation 1994 to 2014. Johanesburg: Gauteng Department of Educationc eu
154 NPC. 2013. National Development Plan 2030: Our future – make it work. Pretoria: Department of the Presidency, p 306.155 DBE. 2014. Annual Performance Plan 2014 – 2015. Pretoria: Department of Basic Education. p 41 – 46. Available at http://www.education.gov.
za/DocumentsLibrary/Reports/tabid/358/Default.aspx
One of the greatest challenges for the
post-democratic South African education
system has been how to ensure that all
schools are allocated with sufficient numbers of qualified, skilled and
motivated teachers.

50 Realising the Right to a Basic Education in South Africa
in black and white schools during apartheid have continued into today’s schools where the average teacher was educated and trained under these vastly unequal conditions.156
Teacher supply and post-provisioning policiesIn 1997, the Department of Education implemented its teacher rationalisation policy, which equalised teacher salaries that had previously been significantly unequal under the apartheid-era education budgets that favored learners attending white schools. That policy, among other things equalised learner-to-teacher ratios among all schools at 40:1 in primary schools and 35:1 in secondary schools. Later that same year, the national guidelines for redeployment were abolished and provincial education departments were empowered to determine the number of teachers employed within their provincial education budgets.157 While this policy strove to ensure that all schools were provided with adequate numbers of teacher, learners continued to attend schools with overcrowded classrooms due to lack of sufficient classroom space for all teachers, inefficiencies in teacher post provisioning processes as well as vacant teacher posts.
The Department of Education in 1998 promulgated the Regulations for the Creation of Educator Posts in a Provincial Department of Education and the Distribution of Such Posts in a Provincial Department of Education. These regulations provide a formula for the allocation of teacher posts to schools based on a number of factors including the maximum ideal class size, period load of educators, need to promote certain subjects, language of instruction, school phases and the number of grades taught at the school, disabilities of learners, and the number of learners attending the school. Accordingly, dual medium schools that teach in multiple languages, for instance, receive more teachers than single medium schools. After the provincial MEC determines how many posts the province can afford, the Provincial HoD is then responsible for distributing the posts to schools by 30 September of the previous year following consultation with unions and SGB organisations. While schools are empowered to field applications for teacher post vacancies and choose their own teachers, teachers hired through post allocations are employed by PEDs, which use personnel funding from their provincial equitable share to pay teachers directly. SASA empowers SGBs to hire and pay additional teachers through school funds collected via school fees and other initiatives. As will be discussed in the budgeting section of this report, poverty is used as a factor for distributing teacher posts, but only accounts for 5% of posts distributed. The Norms and Standards for School Funding sets a target of 80:20 for personnel to non-personnel costs and sets a further target of 85:15 for educators and support staff in order to ensure that provinces have sufficient funds remaining to pay non-personnel costs such as learning and teaching support materials, school maintenance and stationary costs, as well as other school expenses.
This system of provincial post allocation, however, has led to disparities in provinces, particularly in the Eastern Cape and Limpopo, where provinces overspent their education budgets due, in part, to the failure to plan and implement procedures to redeploy teachers from rural schools suffering from decreasing learner populations to newer schools in more urbanised areas exhibiting population growth. The DBE commissioned a report in 2013 on provincial post provisioning allocation and expenditure following sharp increases in personnel costs that led to overspent personnel budgets which caused other education obligations, such as textbooks in Limpopo, to go underfunded. That report revealed significant overspending on personnel costs in nearly all provinces with the Eastern Cape and Limpopo personnel costs reaching 90% and 93% of their education budgets respectively.158 NEEDU has pointed out that these findings show that with the national average of personnel costs approaching 86% of education budgets, a number of other provinces are at risk of having insufficient funds left to cover non-personnel expenses such as textbooks, school infrastructure and provision of norms and standards funding to Section 21 schools.159 NEEDU attributes this unhealthy growth in personnel expenditures to:
156 The DBE in its action plan to 2014 policy emphasised that “[m]any, and perhaps most, of South Africa’s teachers did not receive all the training they need to cope with the responsibilities of teaching and the curriculum changes that have taken place since 1994” because often, the pre-service training of teachers was not of sufficient quality as most teachers entered the profession prior to 1994. DBE. 2011. Action Plan to 2014 – Towards the Realisation of Schooling 2025. p 108.
157 Organisation for Economic Cooperation and Development (OECD). 2008. Reviews of National Policies for Education – South Africa. OECD, at 294. Available at http://www.oecd.org/southafrica/reviewsofnationalpoliciesforeducation-southafrica.htm.
158 Deloitte. 2013. National Implementation of Post Provisioning: National Report. p 36. Available at http://www.education.gov.za/LinkClick.aspx?fileticket=Ub4vJ%2BeV9ds%3D&.
159 NEEDU. 2013. National Report 2013: Teaching and Learning in Rural Primary Schools. Pretoria: The National Education Evaluation and Development Unit. p 15.

51 STATE LEGISLATION, REGULATIONS AND POLICIES PROVIDING FOR THE REALISATION OF THE RIGHT TO A BASIC EDUCATION
1. Growth in urbanisation leaving rural schools with declining learner populations but static teacher posts due to refusal by teachers and unions to move posts to schools where they are more needed. This policy causes urban schools to hire temporary teachers, resulting in provincial systems having to pay excess teachers. NEEDU cites a report estimating that at least half of the 48,124 temporary teachers in the system are effectively double parked.160
2. Pressure from interest groups whereby trade unions are able to influence the process of post provisioning through the mandated consultation process. As a result of this process, trade unions have been able to exert pressure on provincial departments to maintain constant or increasing teacher numbers regardless of the provinces’ needs or budgeting allowances.161 The NEEDU report highlights flaws in the unions’ involvement in the post provisioning process, including the finding that this process perversely prioritises finding places for existing teachers over the school’s need of finding the most appropriate candidate for the job in terms of subject knowledge and pedagogical expertise.162
3. Rising wages at the provincial level that exceed incremental increases awarded at the national level.
4. Failure to follow national post provisioning policies that essentially causes provinces to implement unaffordable post establishment models. Here, the Deloitte report concluded that rather than first determining the personnel : non-personnel and teacher : support staff splits and then dividing the educator budget by the average cost of an educator, overcommitted provinces start with the number of educators they intend to hire without regard for cost and then determine the personnel-to-non-personnel and teacher-to-support staff splits after determining the costs of educators.163
5. Lack of timeous and accurate data collection at the national level tied to a universally used online system aligned to a clear gazetted post provisioning policy. The Deloitte report points out that the National Norms and Standards for School Funding called for enhanced data collection back in 1998, these shortcomings and subsequent reports of poor funding allocation mechanisms demonstrates that these systems are still not in place.
In 2012 the Legal Resources Centre brought a court case against the Eastern Cape Department of Education and others in the provincial and national education departments on behalf of the Centre for Child Law and seven schools that had been affected by the province’s post provisioning irregularities. In 2012, the Eastern Cape’s failure to properly allocate and pay teacher posts resulted in a large number of schools in that province having to either operate with teacher shortages or hire temporary teachers to fill posts left vacant by the province with their own funds. At the time, SADTU – the dominant teacher’s union in South Africa, had been in a dispute with the Eastern Cape Department of Education over the province’s need to redeploy teachers from schools suffering from population decline to schools exhibiting growth in learner numbers. The post-provisioning irregularities stemming from this dispute resulted in approximately 4500 excess teacher posts at under-attended schools and 3200 vacant posts at schools in need of teachers.164 The schools ultimately prevailed in that case, as well as in subsequent cases brought on behalf of similarly affected schools, with the courts ordering the Department to pay the teachers that had been hired on a temporary basis and the province agreeing in a settlement agreement to appoint the temporary teachers permanently.165 The state, however, failed to comply with the settlement, citing its inability to move the excess teachers to schools that needed them. Class action cases on this issue have therefore continued, with schools claiming tens of millions of Rands in temporary teacher costs that they claim
160 Ibid, at p 16 citing Gustaffson, M., 2012. ‘Incentives for teachers within the Salary System. Department of Basic Education. Pretoria. Unpublished.
161 Ibid, at p 18.162 Ibid.163 Deloitte. 2013. National Implementation of Post Provisioning: National Report. p 40.164 Veriava, F. ‘Every Class should have a teacher.’ Mail & Guardian. 12 Sep 2014. Available at http://mg.co.za/article/2014-09-12-every-class-should-
have-a-teacher-1.165 See eg Linkside and Others v Minister of Basic Education and Others (3844/2013) [2015] ZAECGHC 36 (26 January 2015). In Linkside, the
Grahamstown High Court reviewed a class action lawsuit concerning 90 schools that had been affected by post-provisioning irregularities in the Eastern Cape following the Department’s repeated failures to either appoint educators to vacant posts or pay school-appointed educators from 2011 to 2014.
The state, however, failed to comply with the settlement, citing its inability to move the excess teachers
to schools that needed them.

52 Realising the Right to a Basic Education in South Africa
should have been borne by the state, as well as the appointment of teachers to vacant posts that should have been filled by the province.166
NEEDU has emphasised that the DBE has the ability to improve monitoring measures that could prevent provinces from failing to properly allocate teacher posts to schools and fill vacant posts with paid teachers by improving timeous and accurate collection of data at schools. This, however, would require that provinces hire staff and invest in systems to ensure proper data collection – an expense that overextended provinces cannot afford when their education budgets have been depleted through ill-advised funding allocation provisions.
RECOMMENDATIONS:1. The DBE should improve systems used to track the allocation of teacher posts,
teacher and administrator vacancies at schools and school staffing needs. These systems should either be funded by the DBE directly or through conditional grants to provinces. The national government should enact provincial reporting regulations so monitoring of teacher post allocations can take place at a national level and irregularities can be identified and addressed prior to the start of the school year.
2. Norms and standards for post-provisioning should be established to ensure that provinces have effective personnel : non-personnel and educator : support staff ratios in place. Provincial education departments should be trained to initiate procedures set out in Collective Agreement No. 2 of 2003 governing the transfer of serving educators in terms of operational requirements. That agreement, among other things, requires provincial heads of departments to inform schools of educator post establishments and empowers provinces to reduce posts to schools based on learner enrollment rates and operational requirements, as well as lays out procedures for transferring educators made excess as a result of post-provisioning determinations.
3. The role of organised labour in the post provisioning process should be reviewed to ensure that the interests of learners are of paramount importance when provinces make post provisioning determinations.
Teacher training and QualificationsOne of the greatest challenges facing the post-apartheid South African government has been how to transform a fragmented education system that provided teachers of varying levels of training and qualification to racially segregated schools. That system not only resulted in poorly educated students and high rates of illiteracy amongst black learners who attended former homeland and township schools, but had also developed a teacher cohort that was poorly trained in both subject knowledge and pedagogical practices. Moreover, because teachers at schools attended by non-white learners were subject to less stringent qualification standards during apartheid, many teachers employed at the time of the democratic transition held low levels of qualifications or were unqualified despite having years of teaching experience. The realisation of quality education therefore relies largely upon the government’s ability to make provision for a greatly improved teaching force that is adequately trained, motivated, capacitated and equipped with the resources and working conditions necessary to teach the curriculum effectively.
Initial Teacher TrainingIn 1997 the Department of Education restructured the South Africa’s teacher education system, implementing the Higher Education Act 101 of 1997. Around that time the democratic government imposed a massive transformation of the teacher qualification, employment and training systems. During Apartheid, each of South Africa’s education departments had established their own teacher training institutions without consideration for he needs of the
166 Ibid.
One of the greatest challenges facing
the post-apartheid South African
government has been how to transform a
fragmented education system that provided teachers of varying
levels of training and qualification to racially
segregated schools.

53 STATE LEGISLATION, REGULATIONS AND POLICIES PROVIDING FOR THE REALISATION OF THE RIGHT TO A BASIC EDUCATION
country as whole. A National Teacher Education Audit in 1995 found 281 institutions comprised of universities, technikons, colleges of education, private colleges, and non-governmental organisations offering in-service and pre-service teacher education to some 481 000 students. The audit further discovered that the decentralised teacher education model made available during apartheid was generally poor, inefficient and was not cost-effective. The Department of Education then consolidated the teacher education system by closing many of these institutions and incorporating them into faculties, schools and departments of education at universities. The implementation of this policy effectively changed the teacher education system from a provincial responsibility to a function managed and overseen by the national department of education. As a result, teacher training is now a joint responsibility of the DBE and the Department of Higher Education. One negative aspect of this policy was that it caused teacher training programmes to significantly increase in cost since prospective teachers were now required to enroll in more costly higher education universities to obtain the degrees necessary to qualify for teaching posts.
Another challenge facing post-apartheid South Africa was how to set universal standards for teaching qualifications when teachers were subjected to varying forms of training and qualifications during apartheid’s segregated and unequal education system. The Department of Education first implemented the Norms and Standards for Educators in 2000, which among other things, introduced seven interrelated roles for educators as key criteria for the development of teacher qualifications and learning programmes.167
In 2007, the Department of Education, in response to the report of the Ministerial Committee on Teacher Education developed the National Policy Framework for Teacher Education and Development in South Africa, which aimed to provide an overall strategy for the successful recruitment, retention and professional development of teachers to meet the social and economic needs of South Africa. The Criteria for the Recognition and Evaluation of Qualifications for Employment in Education Based on the Norms and Standards for Educators required teachers to have obtained a National Senior Certificate at the end of grade 12 and a minimum of four years of appropriate training thereafter, either through a bachelor of education degree or a three-year degree plus a one-year certificate programme. UMALUSI is mandated under the National Qualifications Framework Act No. 67 of 2008 as council for the qualifications authority, to set and monitor standards for general and further education and training, including certification and quality assurance of the National Senior Certificate.
This policy was replaced in 2011 by the Minimum Requirements for Teacher Education Qualifications (MRTEQ) which provides a basis for the core curricula for initial teacher education, as well as for continuing professional development programmes that accredited institutions must use in order to develop programmes leading to teacher education qualifications. The policy identifies three broad qualification pathways that teachers may follow to advance their careers, namely teaching and learning; management and leadership; and educational planning, research and/or policy development. The MRTEQ further seeks to respond to identified shortcomings in previous policy initiatives by: (1) describing clear, specific requirements for teaching programmes; (2) allowing for institutions to be flexible in the allocation of credits within programmes, encouraging teachers to become engaged with curriculum design, policy implementation and research; (3) requiring all teacher education programmes to address the critical challenges facing South Africa’s education system, including poor content knowledge and conceptual knowledge amongst teachers; (4) emphasising the inter-connections between different types of knowledge and practices; and (5) re-interpreting the roles of teachers as roles carried out collectively by schools and their faculties rather than only by teachers themselves. Teacher education under the policy is intended to equip student teachers with disciplinary learning (subject knowledge), pedagogical learning (the knowledge of learners, learning, curriculum and assessment strategies), practical learning (the study of teaching practices and student teaching in authentic learning environments), fundamental learning (learning to converse in a second official language, the ability to use information and communication technologies, and the acquisition of academic literacies), and situational learning (knowledge of the various learning situations, contexts and environments, including learning diverse challenges faced by children in schools and the communities they serve). The MRTEQ further
167 The Norms and Standards for Educators described the seven roles of educators as learning mediator; interpreter and designer of learning programmes and materials; leader, administrator and manager; scholar; researcher and lifelong learner; assessor; and a community, citizenship and pastoral role.

54 Realising the Right to a Basic Education in South Africa
requires teachers to be proficient in the use of at least one official language as a language of learning and teaching, which for teachers training to teach in the initial phase is usually English. Nick Taylor has questioned whether student teachers who require additional courses to become proficient in English should be placed on an extended track programme to ensure that becoming proficient in English as LOLT does not come at the expense of other training needs, such as acquiring subject or pedagogical knowledge.168 All Initial Phase teachers are also required, under the MRTEQ, to have a sufficiently broad background of knowledge to understand the requirements of all subjects in the Initial Phase Curriculum.
To incentivise matric graduates to fulfil the country’s teaching needs, the DBE has funded the Funza Lushaka Bursary Programme (FLBP), a multi-year programme that promotes teaching in public schools through full cost bursaries available to students to pursue a full teaching qualification in an area of national priority, such as under-supplied phases (i.e. Foundation Phase) and subjects (i.e. mathematics, sciences and African languages) and under-served geographic regions (i.e. rural schools). Each bursary recipient is required to teach at a public school for the same number of years he or she was enrolled in the bursary programme. The programme seeks to fund 25% of students studying to become teachers enrolled in Initial Teacher Education (ITE) programmes. The below table describes the number of Funza Lushaka Bursary recipients between 2009 and 2015.
Year Number of Bursaries awarded Allocation amount R, 000
2009 9190 400 000
2010 10073 424 000
2011 8677 449 400
2012 11455 671 912
2013 14512 893 867
2014 14349 947 499
2015 13972 991 084
Source: DBE. (2015). Consolidated Action Plan to Improve the Funaza Lushaka Bursary Programme Recruitment and
Placement. April 2015. At p. 6.
The above table shows that the number of Funza Lushaka bursary recipients has increased significantly since 2009, two years after the programme was first implemented, with the number of recipients increasing from 9,190 in 2009 to 13,972 in 2015.
The FLBP, however, has been noted to suffer from a number of shortfalls in achieving its stated goals. Van Broekhuizen has shown that the number of Funza Lushaka bursary recipients has fallen short of the goal of funding 25% of students enrolled in ITE programmes. While the programme came closest to reaching its goal in 2009 when it funded 21.8% of students enrolled in ITE programmes, that rate has since dropped to 15.4% in 2013.169 A 2015 survey undertaken by JET Education Services further found that 45.6% of FLBP recipients were specialising in the FET phase, an area of teacher supply that is not urgently in need of new teachers.170 The report on that study therefore recommended that the programme award process should be more closely aligned with the university admission process to ensure that the programme advances the national priority school phases, subjects and geographic regions that suffer from the most severe backlogs in teacher supply.
Placement of FLBP recipients has also proven to be a problem. The DBE has reported that of the 4827 FLBP graduates seeking placement in schools in 2015, only 62% (2994) had been placed in schools by provincial education departments. Lack of teacher placement following
168 Taylor, N. 2014. ‘Initial Teacher Education Research Project: An examination of aspects of initial teacher education curricula at five higher education institutions. Summary Report.’ Johannesburg: JET Education Services. p 18.
169 Van Broekhuizen, H. ‘Teacher Supply in South Africa: A Focus on Initial Education Graduate Production.’ (2015). University of Stellenbosch. Stellenbosch Economics Working Papers: WP07/15, p 24. Available at http://www.ekon.sun.ac.za/wpapers/2015/wp072015.
170 Deacon, R. 2015. ‘Initial Teacher Education Research Project. Report on the 2013 Survey of final year initial teacher education students.’ Johannesburg: Jet Education Services. p 28. Available at http://jet.org.za/publications/initial-teacher-education-research-project/deacon-report-on-the-student-survey.pdf.
The programme seeks to fund 25%
of students studying to become teachers
enrolled in Initial Teacher Education (ITE) programmes.

55 STATE LEGISLATION, REGULATIONS AND POLICIES PROVIDING FOR THE REALISATION OF THE RIGHT TO A BASIC EDUCATION
graduation is most severe in the Eastern Cape, where only 20% of 2014 graduates from the FLBP in that province were placed in schools the following year, a problem that is closely tied to the inefficiencies discussed above in the Eastern Cape’s teacher post provisioning process.
ProvinceAllocation from 2014 graduates and
unplaced 2013 graduates Total Placed % Placement
Eastern Cape 617 126 20%
Free State 302 230 76%
Gauteng 948 637 67%
Kwazulu-Natal 1180 781 64%
Limpopo 326 180 55%
Mpumalanga 341 200 83%
North West 184 189 103%
Northern Cape 139 107 77%
Western Cape 890 564 63%
Total 4827 2994 62%
Source: DBE. (2015). Consolidated Action Plan to Improve the Funaza Lushaka Bursary Programme Recruitment and
Placement. April 2015. At p. 6.
Teacher QualificationsThe 15 years between 1990 and 2005 saw a massive increase in the proportion of qualified171 teachers, from just over half of public school teachers categorised as qualified in 1990 to over 90% of teachers having achieved qualified status by 2005. The rates of qualified teachers improved the most amongst Black African teachers, who improved from just over 1/3 being qualified in 1990 to just over 90% achieving qualified status by 2005. The qualification status of White teachers on the other hand has remained steady at approximately 99%. (See Indicator 11.3). In 2013, 97% of South African teachers were considered to meet minimum qualification levels with Limpopo demonstrating the highest rate of teacher qualification amongst provinces at 100% while teachers in KwaZulu-Natal were the least likely to be qualified with 92% of teachers being classified as qualified.172
Improvements to the proportion of qualified teachers do not mean, however, that all “qualified” teachers possess a bachelor of education degree. NEEDU has stressed its concern over what it has identified as a massive growth in teacher qualifications over the last decade fueled by the part-time Accelerated Certificates of Education (ACE), the quality of which has been heavily criticised by the Council on Higher Education.173 Moreover, many non-white teachers achieved qualification status through the completion of programmes during apartheid that offered far less intensive curriculum content with respect to subject knowledge and teaching methodologies through a system that intentionally trained teachers unequally based on race. Other teachers achieved their qualification status through gaining experience while teaching during the apartheid system that did not require teachers in non-white schools to be qualified
171 The DBE has categorised teachers as qualified if they have completed three years of appropriate post-school training. See eg. DBE. 2013. Macro Indicator Report. Pretoria: Department of Basic Education. p 62. Available at http://www.education.gov.za/DocumentsLibrary/Reports/tabid/358/Default.aspx.
172 DBE. 2014. Education for All (EFA) 2014 Country Progress Report. Pretoria: Department of Basic Education. p 37.173 NEEDU. 2013. National Report 2012: The State of Literacy Teaching and Learning in the Foundation Phase. Pretoria: National Education
Evaluation and Development Unit. p 57. See also Council on Higher Education. 2010. Report on the national review of academic and professional programmes in education. HE Monitor No. 11. Pretoria, at p. 135, which stated that “HEIs end up paying insufficient attention to the ACE Mathematics, and indeed to other ACEs, because the ACE is perceived as being the lowest of their priorities. In consequence, the institutions extensive capacity is often not placed at the disposal of students. The most vulnerable students in the institution then come to be the recipients of the minimal amount of attention, time and support that the institution can provide. It could be said HEIs are meeting the requirements for fulfilling ACE’s purpose only formally and in a spirit of compliance rather than substantially...The absence of a sustained plan that addresses the continuum of learning that is required, and in particular that addresses poor subject specialisation knowledge, is perhaps the greatest weakness of the ACE programme.”
Improvements to the proportion of qualified teachers do not mean,
however, that all “qualified” teachers
possess a bachelor of education degree.

56 Realising the Right to a Basic Education in South Africa
and then upskilling through part-time distance learning certificate programmes that are far less intensive than today’s bachelor in education programme. Registration requirements for the South African Council of Educators (SACE), which is the body mandated to determine registration requirements for teachers and register teachers qualified to teach in schools under the South African Council of Educators Act, reflects the ability of teachers with little to no intensive pre-service training to maintain employment in schools. SACE, for instance, allows for teachers to be registered, and to therefore be eligible for appointment to teaching posts, even if they did not attain a minimum three-year post matriculation teacher education qualification, if they were employed as a teacher prior to the implementation of the Constitution of the Republic of South Africa.174
While these figures demonstrate considerable improvement in terms of teachers technically qualified to teach, the DBE has stressed that “the dramatic improvement in educator qualifications over the past 20 years does not appear to have had a visible impact on learner performance.”175 Nick Taylor has similarly found that the “increase in the proportion of teachers reaching qualified status is in stark contrast to the absence of any discernible improvement in learner performance in the same period, a striking case of qualification inflation”, and that “these considerations reveal a sharp distinction between qualifications and competence.”176
Shortcomings in the Initial Teacher Training and Qualification FrameworkThe failure of high increases in qualified teachers to result in commensurate improved learner outcomes can be attributable, at least in part, to inadequate initial teacher education programmes and ineffective in-service training programmes. Moreover, Taylor has found that amidst calculations that South Africa is not producing enough teachers, it remains difficult for many newly qualified teachers to attain teaching posts largely due to agreements with unions that recruits for posts need to be taken from existing union lists. The result is that often times better trained teachers find it very difficult to become employed despite the system’s need to attract well-trained teachers.177
The vast majority of teachers in South Africa are older than 40, meaning that many of them were themselves educated and initially trained under the apartheid system. Of the 390,164 teachers in the public education system, 299,403 are aged 40 and above.178 This age distribution not only speaks to the limited unequal and poor quality initial teacher training that would have been attained by the vast majority of South Africa’s teachers, but also raises the question of whether the teacher training programmes will be able to produce enough teachers to compensate for older teachers who will eventually retire and leave the system. Between 1994 and 2005, the proportion of teachers under the age of 30 declined dramatically from 54% to just 5.4% with rates improving only marginally to 6.5% in 2012.179
Teacher supply is further complicated by the low graduation and slow progression rates of teachers from teacher education programmes. A 2015 study on teacher supply in South Africa published by the Centre for Development and Enterprise showed that graduation rates at teacher programmes are very low, which suggests that student teachers are either slow in passing through the system or are dropping out prior to finishing their degrees. UNISA, for instance, which is the largest teaching university and enrols mainly distance-education students, only graduates 2.5% of their 40,124 students enrolled in the university’s 4-year bachelor of Education programme each year.180 The CDE study further shows that there is a mismatch between graduates with subject specialisation and school needs, causing an undersupply of mathematics and language teachers and an oversupply of life orientation teachers.181
Taylor has also questioned the effectiveness of an initial teacher training system that neglects to prepare student teachers to teach mathematics and literacy at the primary level. In
174 SACE registration requirements are available at http://www.sace.org.za/Registration/jit_default_14.Registration.html.175 DBE. 2010. Education for All 2010 Country Report. Department of Basic Education. Pretoria, p 48. Available at http://www.education.gov.za/
researchreports/tabid/708/Default.aspx.176 Taylor, N. 2010. Priorities for Addressing South Africa’s Education and Training Crisis: A Review commissioned by the National Planning
Commission. Johannesburg: JET Education Services. 10 June 2011. p 15.177 Ibid., at p. 20.178 Simkins, C. 2015. ‘Technical Report: Teacher Supply and Demand in South Africa 2013 – 2025.’ Johannesburg: Centre for Development and
Enterprise. p 34. Available at http://www.cde.org.za/wp-content/uploads/2015/03/CDE-TSD-Technical-report-March-2015-final-version.pdf.179 Van Broekhuizen, H. 2015. ‘Teacher Supply in South Africa: A Focus on Initial Education Graduate Production.’ University of Stellenbosch.
Stellenbosch Economic Working Papers: WP07/15. p 55.180 Simkins, C. 2015. ‘Technical Report, Teacher Supply and Demand in South Africa: 2013 to 2015.’ Johannesburg: Centre for Development and
Enterprise. p 13. The number of students cited as enrolled at UNISA comprises all students enrolled at the university’s bachelor’s programme. If all of the students graduated from the programme on time, then the graduation rate would therefore be 25%.
181 Ibid, at p 14.
While these figures demonstrate considerable
improvement in terms of teachers technically
qualified to teach, the DBE has stressed
that “the dramatic improvement in
educator qualifications over the past 20 years does not
appear to have had a visible impact on
learner performance.

57 STATE LEGISLATION, REGULATIONS AND POLICIES PROVIDING FOR THE REALISATION OF THE RIGHT TO A BASIC EDUCATION
a 2014 JET Education Services study examining the curricula offered at five higher education institutions, Taylor identified that even though most Intermediate Phase teachers will end up teaching mathematics and language classes to learners who do not speak English as a home language at some point in their careers, teacher education programmes fail to ensure that teachers are adequately prepared to teach these subjects in that context following graduation.182 Firstly, Taylor’s research emphasised that Intermediate Phase years (Grades 4 – 6 ) are critically important years of schooling. Most learners are transitioning during that time from learning in home language to learning in English and all learners must convert from using rudimentary methods in mathematics, such as counting, to becoming proficient in more sophisticated mathematics tools. Backlogs during this time, however, are severe, as most learners are two years behind by the time they reach grade 5 in both language and mathematics subjects.183 Secondly, Taylor found that many universities differ substantially in entrance requirements. For example, to specialise in mathematics, one university required enrollees to achieve at least a 65% in mathematics on the NSC examination while another university which enrols many times more student teachers than the first university, only required a 30% pass in mathematics literacy. Thirdly, though many teachers go on to teach subjects that they did not specialise in, such as mathematics, a very small percentage of the curriculum consists of mathematics courses. One university featured in the study that enrols by far the highest number of learners out of all of the universities reviewed, provides a curriculum to non-maths specialists that offers only 2.5% of credits for maths even though many of these graduates will go on to teach mathematics despite not having specialised in the subject. Even worse, student teachers not specialising to be English teachers receive no English teaching at all at three of the five universities reviewed.
Taylor’s study speaks to many of the challenges faced by South Africa’s education system. While many teachers are considered to be qualified, their initial training backgrounds do not ensure that they are necessarily adequately equipped in terms of subject and pedagogical knowledge to teach the subjects that they are teaching. Secondly, a shortage of mathematics and language subject teachers, particularly for primary and intermediate phase learners, makes it all the more likely that schools will hire teachers who did not specialise in those subjects and therefore likely did not receive sufficient exposure to the subject content to ensure that they will be able to adequately teach the curriculum upon entering the teaching system. The DBE has identified this issue in its Integrated Strategic Planning Framework for Teacher Education and Development in South Africa 2011 – 2025 by recommending that “norms and standards should be developed to ensure that, except in exceptional circumstances, teachers qualified in particular subjects, learning areas and phases do in fact teach those subjects, learning areas and phases (and only those subjects, learning areas and phases).”184
RECOMMENDATIONS:1. Initial teacher training programmes should be reviewed to improve exposure of
student teachers to mathematics and literacy subjects. Programmes should also be assessed to determine the adequacy of initial training for student teachers who intend to teach intermediate phase African home language learners.
2. Initial teacher training programmes should be reviewed to determine whether student teachers who require additional courses to become proficient in English should be placed on an extended track programme to ensure that becoming proficient in English as LOLT does not come at the expense of other training needs.
3. The DBE should investigate implementing norms and standards to ensure that learners are exposed to teachers who are adequately trained and qualified to teach the particular subjects that they are teaching, particularly math, science and language.
182 Taylor, N. 2014. ‘Initial Teacher Education Research Project: An examination of aspects of initial teacher education curricula at five higher education institutions. Summary Report.’ Johannesburg: JET Education Services. p 22.
183 Ibid, at 23.184 DBE. 2011. Integrated Strategic Planning Framework for Teacher Education and Development in South Africa 2011 – 2025. Technical Report.
Department of Basic Education. April 2011. Pretoria: DBE. p 12. Available at http://www.dhet.gov.za/Teacher%20Education/Technical%20Report%20-%20Intergrated%20Strategic%20Planning%20Framework%20for%20Teacher%20Education%20and%20Development%20In%20SA,%2012%20Apr%202011.pdf.

58 Realising the Right to a Basic Education in South Africa
Teacher Subject and Pedagogical KnowledgeInternational tests have shown that teacher content knowledge in South Africa is very poor and lags behind even other sub-Saharan African countries where teachers spend less time becoming qualified to teach. Moreover, NEEDU classroom observations have found widespread use of poor teaching methodologies that reveal a qualified teaching cohort that continues to lack the capacity needed to teach learners to read and write and become literate in mathematics. Taylor has identified the following conditions as endemic in schools across the country:
� Low levels of English Proficiency among both teachers and learners, which funda-mentally limit academic progress since English is the medium of teaching and learning in around 90% of schools;
� Lack of adequate reading pedagogies, resulting in a number of learners reaching grade 5 essentially illiterate;
� Lack of adequate pedagogies for basic numeracy, resulting in learners using rudimentary processes, such as stick counting, to solve relatively complex arithmetic operations;
� Low levels of subject knowledge among teachers;
� The common practice whereby schools fail to recruit and deploy primary school teachers according to subject specialisation under the assumption that all qualified educators are capable of teaching all subjects. Accordingly, most primary school teachers will be required to teach maths and English at some point in their careers regardless of whether they have specialised in these subjects or whether they have even demonstrated certain core competencies.185
The Southern and Eastern African Consortium for Monitoring Educational Quality (SACMEQ) survey conducted in 2007 tested, among other things, grade 6 mathematics and language teachers to determine levels of comprehension in those subjects. Not only did South African teachers score poorly on the test, ranking 7th out of 14 countries in language and 9th out of 14 countries in mathematics, South Africa is the country in the region with the highest proportion of teachers with a degree and has the second highest average years teaching training amongst the countries tested.186 Using the same SACMEQ III data, Venkat and Spaull have found that 79% of grade 6 mathematics teachers tested showed content knowledge below the grade 6/7 band (answer fewer than 60% of questions correctly) and that the few teachers that did perform well were highly concentrated in the wealthiest quintile schools.187
NEEDU’s 2012 Report on the State of Literacy Teaching and Learning in the Foundation Phase emphasised similarly concerning findings from the SACMEQ III data. The language portion of the 2007 teacher test consisted of 11 separate texts ranging in difficulty from simple vocabulary to what NEEDU characterised as “relatively dense technical descriptions and complex discursive passages.” NEEDU highlighted that “[w]hile South African teachers did relatively well on questions requiring the simple retrieval of information explicitly stated in the test (75,1%), scores dropped dramatically as soon as the higher cognitive functions of inference (55,2%), interpretation (36,6%) and evaluation (39,7%) were invoked.”188
While international research has shown that teacher subject knowledge alone is not dispositive of poor learner results, this poor subject content knowledge is particularly concerning when combined with NEEDU’s findings in primary and rural schools that slow paced and improper teaching practices, such as chorusing and failure to use unfamiliar texts, are often used in classrooms.189 While NEEDU attributes some of the poor practices observed in primary school classrooms tasked with teaching learners to read and write to a lack of LTSM such as Big Books, the demonstrated lack of understanding of the teachers’ role of teaching learners to read independently, as well as the failure to incorporate other areas of the curriculum into daily classroom activities, such as extended writing sessions, were also identified as common
185 Taylor, N. 2011. ‘Priorities for Addressing South Africa’s Education and Training Crisis: A Review commissioned by the National Planning Commission.’ Johannesburg. JET Education Services. 10 June 2011. p 7.
186 DBE, Macro Indicator Report 2013, at p. 63.187 Venkat, H. and Spaull, N., What do we know about primary teachers’ mathematical content knowledge in South Africa? An analysis of
SACMEQ 2007, Stellenbosch working papers 13/14 (2014). Venkat and Spaull’s review of the SACMEQ data further found that 17% of grade 6 students in South Africa were taught by maths teachers who had content knowledge below a grade 4 or 5 level, 62% of grade 6 students were taught by maths teachers who had a grade 4 or 5 level of content knowledge, 5% of grade 6 students were taught by maths teachers who had a grade 6 or 7 level of content knowledge, and 16% of grade 6 students were taught by maths teachers who had at least a grade 8 or 9 level of content knowledge.
188 NEEDU. 2013. National Report 2012: The State of Literacy Teaching and Learning in the Foundation Phase. National Education Evaluation and Development Unit. Pretoria, p 28 - 29.
189 Ibid, at p 38
While international research has shown that teacher subject
knowledge alone is not dispositive of poor learner results,
this poor subject content knowledge is
particularly concerning when combined with
NEEDU’s findings in primary and rural schools that slow
paced and improper teaching practices,
such as chorusing and failure to use unfamiliar
texts, are often used in classrooms.

59 STATE LEGISLATION, REGULATIONS AND POLICIES PROVIDING FOR THE REALISATION OF THE RIGHT TO A BASIC EDUCATION
shortcomings contributing to poor reading and writing outcomes.190 NEEDU has therefore recommended that National Norms be implemented for reading fluency and writing exercises. Learner progress should then be monitored by School Management Teams and District Subject Advisors, as teachers are failing to systematically monitor learner reading and writing.191 The DBE, in response to this recommendation, initiated reading norms as a component of the Curriculum and Assessment Policy Statement (CAPS) for Home Language and First Additional Language Programmes in grades R – 12. As part of the CAPS curriculum policy, teachers are required to, among other things, assess each learner’s reading abilities and progress throughout the year and provide particular attention to those learners experiencing difficulties.192 While the reading norms prescribed by CAPS advances the need to improve the identification of struggling learners and measure reading improvement throughout the school year, the DBE’s policy does not respond to NEEDU’s call to put improved monitoring and accountability systems in place to ensure that reading and writing activities take place in classrooms consistently throughout the school year.
Fleisch has emphasised the extent to which teaching practices may vary between lower quintile schools and former white model-C schools. Poor practices are particularly commonplace in primary school classrooms where reading skills are being taught through chorusing methods routinely used during apartheid’s Bantu education system and demonstrate the pedagogical skill gap that often exists in schools.193 Fleisch has described a grade 4 reading lesson in an English as a first additional language classroom as follows:
“the lesson begins with the teacher having a conversation in isiZulu with the learners about the flood – an animated conversation with key concepts around the flood. The first five-seven minutes is a discussion in isiZulu. The next part of the lesson is the reading, the English text on the flood. It’s a story about a boy who rescues his youngest sibling because the floodwaters are rising. He wakes up, realises it and remembers his cell phone has a torch. So he switches on the torch and he rescues his sister and they go to the neighbour who is on higher ground. It’s a nice story, at the appropriate level, and the context is relevant. The teacher reads the passage and then gets one of the learners in the class to read it again. Then she reads it line by line and the kids appear to be reading it using a kind of repeat method. It’s very clear from what happens afterwards, when the teacher shifts back to isiZulu for an explanation of what the story is about, due to the fact that the kids can’t read the story, because their reading skills and speeds are not sufficiently developed and they don’t have the vocabulary. So the teacher is being very sensitive to the realities of the kids in the class. She understands very clearly that she is dealing with kids who haven’t developed the vocabulary or the reading ability needed to manage the standard grade 4 story. For the last step in the lesson she writes the answers on the board to the exercise in the DBE workbook. The kids then write out the teacher’s answers in their workbooks. Her explanation for doing this is that the HOD is going to check that the kids have been working in their workbooks.”194
Fleisch has stressed that this example of classroom teaching methodology helps to explain a number of challenges and competing tensions that occur within classrooms. In this example, learners struggle with reading backlogs along with the transition to learning in English. Teachers have to somehow manage curriculum demands and policy compliance, often without a firm understanding of sound teaching practices. It is easy to see how reading and writing backlogs only worsen over time in this immensely challenging environment which is not only plagued by lack of learner preparedness and language difficulties which wealthier learners do not experience, but is also characterised by teachers who are poorly equipped to respond.
The lack of subject content and pedagogical knowledge and skills is compounded by findings that teachers are often unaware of their own shortcomings and have demonstrated a tendency to overstate their own competencies and overestimate the performance and improvement that
190 Ibid.191 Ibid.192 See, eg DBE’s written reply to National Assembly Question 1735, 15 May 2015. Available at http://www.education.gov.za/Newsroom/
ParliamentaryQuestions/2015ParliamentaryQuestions/tabid/884/ctl/Details/mid/3407/ItemID/3419/Default.aspx193 See eg Hoadley, U. 2011. ‘Knowledge, Knowers and Knowing: Curriculum Reform in South Africa. p 144. In L. Yates & M. Grumet (eds.)
Curriculum in Today’s World: configuring knowledge, identities, work and politics. Routledge. Available at http://www.education.uct.ac.za/sites/default/files/image_tool/images/104/hoadley2011.pdf.
194 Fleisch, B. 2015. ‘Some Thoughts on Teachers.’ In Equal Education. Taking Equal Education into the Classroom: The challenges to teaching and learning and possible campaigns to address the crisis of quality and equality in the pedagogic encounter. Equal Education. 85.
Fleisch has stressed that this example of classroom teaching methodology helps to explain a number
of challenges and competing
tensions that occur within classrooms.

60 Realising the Right to a Basic Education in South Africa
learners in their classrooms make over the course of the school year. Spaull has highlighted findings from the 2010 Western Cape Systemic Evaluations which, among other things, asked teachers at 45 primary schools to estimate the progress that learners in their classrooms had made during the year. On average, grade 3 teachers believed that 55% of learners in their classrooms were performing at the appropriate level at the start of the school year, but that 84% of their learners were performing at the appropriate level at the end of the school year. The study, however, found that in actuality only 22% of learners had achieved at the requisite level at the completion of the school year.195 Findings from the 2011 TIMSS study also show that South African teachers tend to overestimate their competency levels. 89% of South African grade 9 mathematics teachers surveyed in that study answered that they felt “very confident” in teaching mathematics.196 Spaull has stressed that these findings are in stark contrast to the poor outcomes demonstrated by grade 9 learners on the TIMSS test and raises the concern that teachers who believe that they are adequately competent in terms of content knowledge and pedagogical skills are less likely to seek out needed training and professional development programmes.197
Teacher Support and In-Service TrainingTo address the poor teacher knowledge and pedagogical skills of teachers, the DBE and Provincial Education Departments have implemented a number of in-service training programmes. Nick Taylor, however, has stressed that “in-service education and training has proved to be singularly ineffective in addressing shortcomings in teaching practices despite many millions being spent on this area over the last three decades.”198 In 2011 the DBE produced the Integrated Strategic Planning Framework for Teacher Education and Development in South Africa 2011 – 2025. Recognising that teachers’ poor subject matter knowledge and pedagogical content knowledge are important contributors to the poor state of education in South Africa, this policy aims to improve the quality of teacher education and development in order to improve the quality of teachers and teaching. The plan’s stated goal is to address the career path of a teacher through a number of phases from recruitment through retirement by coordinating teacher recruitment, preparation, induction into work and continuing professional learning and development. The Framework establishes the National Institute for Curriculum and Professional Development (NICPD) responsible for developing and managing a system for teachers to identify their development needs and access quality development opportunities to address these needs; and for ensuring that a viable, relevant curriculum is always in place for schooling in South Africa. The Framework also aims to develop and deliver teacher diagnostic self-assessments so teachers may confidentially assess curriculum competence. A range of other developmental programmes geared towards advancing teachers’ content and pedagogical knowledge, as well as providing development opportunities and funding for programmes directed at improving the capacity of school principals and other school leaders and district officials offering provincial support, such as subject advisors, are also provided for in the policy. The Framework plan also delinks teacher appraisal for purposes of development from appraisal for remuneration and salary progression.
The Education Labour Relations Council Resolution no. 7 of 1998 on the Workload of Educators requires that all educators, as part of their conditions for service, spend 80 hours per year on professional development activities (See Indicator 11.5). The DBE’s Report on the National School Monitoring Survey assessed, among other things, whether teachers were adhering to these professional development requirements and whether attendance at these programmes occurred outside of school hours or during the school vacation. The Survey also looked at whether teachers were fulfilling these requirements through self-initiated, school-initiated or externally-initiated (i.e. courses organised by education districts or NGOs) activities. The results of the Survey and a 2015 report by the Auditor General showed that teachers are overwhelmingly not completing their mandated in-service training obligations and that large numbers of teachers are failing to complete or account for the fulfillment of any of their obligated hours of professional development training.199
195 Spaull, N. 2013. ‘South Africa’s Education Crisis: The quality of education in South Africa 1994 – 2011.’ Johannesburg: Centre for Development and Enterprise, p 29. Available at http://www.section27.org.za/wp-content/uploads/2013/10/Spaull-2013-CDE-report-South-Africas-Education-Crisis.pdf.
196 Ibid., citing Mullis, Martin, Foy, & Arora. 2012. TIMSS 2011 International Results in Mathematics. Chestnut Hill, USA: TIMSS & PIRLS International Study Center and IEA, at p. 315
197 Ibid.198 Taylor, N. 2014. ‘Initial Teacher Education Research Project: An examination of aspects of initial teacher education curricula at five higher
education institutions. Summary Report.’ Johannesburg: JET Education Services, p 6.
199 Ibid. These results are explained in further detail in the section assessing the outcomes of Indicator 11.5.
To address the poor teacher knowledge and
pedagogical skills of teachers, the DBE and Provincial Education Departments have
implemented a number of in-service training
programmes.

61 STATE LEGISLATION, REGULATIONS AND POLICIES PROVIDING FOR THE REALISATION OF THE RIGHT TO A BASIC EDUCATION
NEEDU has stressed that the IQMS teacher appraisal system that is currently in place is unlikely to be effectively used for development purposes when appraisals are tied to salaries and promotions. Moreover, appraisers must be trained and capacitated to distinguish good practices from bad, a shortcoming that the system servicing teacher assessments does not currently address.200 NEEDU has further emphasised the need for District Level Subject Advisors to prioritise training school-level Heads of Department so they are able to provide in-school professional development to teachers. Other areas for improvements are through in-service professional development coaching and discussions led by School Management Team Members. NEEDU recommends that discussions should involve curriculum, pedagogy and assessment experiences and practices.201
Taylor has identified the in-service training models implemented by the Cape Teaching and Leadership Institute in the Western Cape, the science centre Scibono in Gauteng and the Maths, Science and Technology Education College in Limpopo as the only models proven to have an impact on teacher capacity.202 These intensive programming models are presented in two blocks over the course of the year in two-week long residency programmes wherein teachers spend the day in class and then work together after hours on assignments. The province pays for substitute teachers while teachers are away on these programmes. Studies have demonstrated that this intensive training format is far more effective than other models of in-service training, such as afternoon, weekend or holiday workshops or the ACE programmes that have been heavily criticised by government.203
In 2012 the DBE negotiated delivery agreements with teacher unions through which public funding would be allocated to teacher unions to provide in-service training to teachers. These measures were taken, in part, to advance the roles and responsibilities of teacher unions envisaged in the DBE’s 2011 Integrated Strategic Planning Framework for Teacher Education and Development in South Africa 2011 – 2025. That Framework tasks teacher unions with the responsibility to promote teacher professionalism through advocating, supporting and encouraging teachers to access opportunities to identify and address their development needs, in part, through the establishment of peer learning communities. Another component of the Integrated Strategic Planning Framework has been the establishment of Provincial Teacher Development Institutes (PTDIs). PTDIs are physical sites that serves as the base from which provinces coordinate and deliver all national and provincial priority Continuous Professional Development courses. The Teacher Centres are run by managers and include space for teacher training workshops and other training spaces, as well as are intended to provide teachers with access to information technology services, including internet connectivity. PTDIs should also be staffed with Subject Advisors who are responsible for developing and running teacher, principal and school management team training programmes. A 2014 DBE audit of PTDIs exposed a number of challenges and revealed that out of 147 Teacher, only 74 centres were functional. Teacher Centres were considered functional based on the availability of a knowledgeable manager and information communications technology, including internet connectivity; the number of teaching development programmes; the availability of training spaces, the frequency of training workshops conducted and the provision of community programmes. The below chart shows the extent to which provinces have established Teacher Centres.204
Province EC FS GP KZN LP MP NC NW WC Total
No. of Centres 16 5 21 49 9 17 3 24 3 147
No. of Functional Centres
6 4 7 28 8 6 5 7 3 74
No. of Schools 5544 1306 2070 5915 3929 1762 551 1515 1458 24060
No. of educators 61260 23631 60782 90497 54704 33613 8880 25004 32237 390608
The DBE’s 2014 audit identified a number of challenges faced by provinces in terms of ensuring that adequate numbers of Teacher Centres are made available to teachers and principals in
200 NEEDU. 2013. National Report 2013: Teaching and Learning in Rural Primary Schools. The National Education Evaluation and Development Unit. Pretoria, p 58.
201 Ibid, at p 59.202 Taylor, N. 2011. ‘Priorities for Addressing South Africa’s Education and Training Crisis: A Review Commissioned by the National Planning
Commission.’ Johannesburg: JET Services. 20 June 2011. p 21.203 Council on Higher Education. 2010. Report on the national review of academic and professional programmes in education. HE Monitor No. 11.
Pretoria, at p. 135204 DBE. 22 September 2015 Presentation to Portfolio Committee on Basic Education on the Status of Functionality of Teacher Centres in the
Education Sector. Available at https://pmg.org.za/committee-meeting/21516/.
In 2012 the DBE negotiated delivery
agreements with teacher unions through
which public funding would be allocated to teacher unions to
provide in-service training to teachers.

62 Realising the Right to a Basic Education in South Africa
all provinces. These challenges include the lack of adequate infrastructure and training space; insufficient staffing of managers and general assistants; lack of availability of Subject Advisors; failure to provide training schedules to teachers and a lack of regular/daily training programmes due to no on-site Subject Advisors. In order to assist provinces with these challenges, the DBE has developed Draft Minimum Norms and Standards for Provincial Teacher Development Institutes and District Teacher Development Centres in South Africa. These standards, among other things, address infrastructural and staffing requirements and require each Centre to be linked to 20 – 30 schools. Given the substantial need for improved provision of teacher training programmes, it is vital that the provinces make these Centres available and accessible to teachers. The lack of functioning Centres in the Eastern Cape, Limpopo and Mpumalanga is particularly concerning given the identified need for teacher training in those provinces.205 Also concerning is the overall lack of Teacher Centres both nationally and provincially. Under the Norms and Standards, Provinces would need to make at least 800 functional Teacher Centres available to schools in order to comply with the mandate that each Centre be tied to 20 – 30 schools. The 74 Teacher Centres identified by the DBE as functional falls well short of that standard.
RECOMMENDATIONS:1. Further studies should be undertaken to better understand which teacher
development programmes are most effective within the contexts of different schools and schooling communities.
2. Training and support programmes should be further developed to take results from the Annual National Assessments into account so that shortcomings in teaching can be identified and training can be more specifically tailored to improve subject knowledge and introduce teaching methods that have been proven to impact similarly situated classrooms.
3. District offices should work more closely with school leadership to make them more aware of professional development requirements and programmes which are accessible and well-tailored to their schools’ needs. The DBE should work with SACE to develop frameworks to ensure that school principals have systems in place to monitor teacher professional development activities and principals should be responsible for ensuring that teachers at their schools are fulfilling their mandates. Professional development activities should be undertaken in a way that does not disrupt in-class teaching time and should adhere to the educator workload policy which provide for in-service training to occur outside of formal school hours.
4. Schools and their management teams should be capacitated to constructively observe teachers in their classrooms and provide coaching as a way to support improved teaching methodologies and help teachers identify and address gaps in subject knowledge.
Teaching time and curriculum coverage in the classroomNEEDU has stressed that poor time management practices are common in low-performing schools and that one feature that distinguishes well-functioning schools is the ability to minimise school closures for matters such as union meetings, memorial services and staff training.206 Other inefficient uses of time are attributable to high levels of late-coming, teacher absenteeism and the failure to cover the curriculum efficiently while in the classroom. Time lost due to examination grading amounting to four weeks a year further limits learners’ access to much needed in-class instruction.
Abuse of teacher leave, and sick time in particular, has enabled teachers to spend less time in classrooms teaching. Teachers are allotted 36 days of sick leave over the course of a three-year period. Taylor has stressed though that teachers tend to view this leave as an entitlement
205 See Indicators 11.4 and 11.5.206 NEEDU. 2013. National Report 2013: Teaching and Learning in Rural Primary Schools. Pretoria: The National Education Evaluation and
Development Unit. Pretoria, p 53.
Abuse of teacher leave, and sick time
in particular, has enabled teachers to spend less time in
classrooms teaching.

63 STATE LEGISLATION, REGULATIONS AND POLICIES PROVIDING FOR THE REALISATION OF THE RIGHT TO A BASIC EDUCATION
rather than as a benefit that is intended to be exercised in the case of a serious illness.207 While the true extent of teacher leave is largely unknown due to poor tracking systems, a 2010 study undertaken by the Human Sciences Research Council for the Department of Education found teacher leave rates in 2008 to be between 10% and 12%, amounting to an average of 20-24 days of instructional time lost by each educator each year as compared to a rate closer to 5% to 6% in developed countries.208 Moreover, the HSRC’s study found that most leave was for two days or less, thus not requiring certification from a doctor, and teachers are twice as likely to take sick leave on Mondays and Fridays as opposed to Tuesdays and Thursdays, signaling that the system is being abused. Principals are responsible for tracking teacher leave and NEEDU has stressed that Circuit Managers should monitor time management practices in schools through unannounced visits.209 Circuit Managers should then work with principals of poorly performing schools to implement viable timekeeping practices, including up-to-date tracking of teacher leave and more intensive oversite of leave taken for illegitimate reasons. However, the HSRC study found that PERSAL data used to track the national recorded leave rate only recorded leave rates of between 3% and 4%, far below the leave rates estimated through study findings, indicating that schools are not appropriately tracking leave rates of teachers or are failing to record educator absenteeism records kept at school-level onto the PERSONAL system.
The HSRC report made a number of recommendations to reduce the high rates of teacher absenteeism, including (1) reducing the days that educators are away from school on professional development and training workshops which should occur outside of school hours and capping the number of days that principals are away on official business to ensure that schools function properly; (2) improving management of high levels of discretionary leave, especially on Mondays and Fridays by improving record systems that can be used to show patterns of misused leave; (3) working with district offices to reduce leave at schools where the leave rate is greater than 10% of teachers absent on an average day; (4) improving working conditions at schools; (5) implementing an improved leave administration system in schools that is capable of tracking teacher leave electronically; (6) ensuring that all schools are staffed with an administrative clerk who has computer skills who is responsible for overseeing the completion of leave forms; and (7) recording leave for official business on a central database so loss of teaching time for these purposes may be monitored and managed.
In 2013 the Minister of Basic Education announced a plan to install fingerprint-powered attendance monitoring devices in all 25 000 public schools in order to monitor and reduce the high rates of teacher absenteeism.210 The Minister’s plan, however, was met with fierce opposition from teachers unions, including SADTU, who claimed that these measures were insulting and demeaning to teachers and essentially offered a diversion from the focus that should rather be placed on improving teacher competence. While Minister Motshekga revived her intention to install biometric systems in schools to track teacher absenteeism in 2014, such a plan has yet to take effect.211
Moreover, and as referenced above, the slow pace of classroom instruction in many schools when combined with high rates of teacher absenteeism and other poor managerial and teaching practices that negatively impact teaching time further contributes to shortcomings in curriculum coverage over the course of the school year. The DBE’s 2011 School Monitoring Survey found that nationally the vast majority of Grade 6 and Grade 9 learners surveyed did not complete the minimum required weekly maths and language exercises. Grade 6 learners completed only 37.5% of required the language exercises required to be completed each week and 65% of the required maths exercises. Grade 9 learners surveyed completed on average only 25% of the required weekly language exercises and 45% of the required weekly maths exercises.212 These findings echo results taken from a 2009 study comparing South African
207 Taylor, N. 2011. ‘Priorities for Addressing South Africa’s Education and Training Crisis: A Review Commissioned by the National Planning Commission.’ Johannesburg: JET Services. 20 June 2011. p 16.
208 Reddy, V., et al. 2010. An Investigation into Educator Leave in the South African Ordinary Public Schooling System. HSRC. July 2010. Available at: http://www.education.gov.za/LinkClick.aspx?fileticket=bst5D5eBID0%3D&tabid=358&mid=1300
209 NEEDU. 2013. National Report 2013: Teaching and Learning in Rural Primary Schools. Pretoria: The National Education Evaluation and Development Unit. p 54.
210 Nkosi, B. ‘Teachers Give Minister Motshekga the Finger.’ Mail & Guardian. 1 March 2013, available at http://mg.co.za/article/2013-03-01-teachers-give-minister-the-finger.
211 Phakathi, B. ‘Electronic clocking-in plan to combat teacher absenteeism.’ Business Day. 25 March 2014, available at http://www.bdlive.co.za/national/education/2014/03/25/electronic-clocking-in-plan-to-combat-teacher-absenteeism.
212 DBE. 2013. Report on the National School Monitoring Survey 2011 (DBE013, Conducted in 2011). Department of Basic Education. Pretoria, p 81-85. the School Monitoring Survey found that only 7% of Grade 6 learners met the minimum standard of completing four language exercises per week and only completed on average 1.5 language exercises per week. 31% of Grade 6 learners met the minimum standard of four maths exercises per week while the average number of written maths exercises completed per week nationally was 2.6. Nationally, 95% of the Grade 9 learners surveyed did not meet the minimum requirements of four language exercises per week while the average Grade 9 learner completed only 1 language exercise per week. And 91% of Grade 9 learners surveyed did not complete the required 4 Maths exercises per week with the average number of Maths exercises completed nationally being 1.8.

64 Realising the Right to a Basic Education in South Africa
schooling outcomes to those in neighboring Botswana. That study, which assessed 62 grade 6 mathematics teachers and 3 800 learners in 58 schools in North West province found, among other things, that the average number of mathematics lessons given by most teachers was considerably less than the number of lessons officially intended, “indicating that ‘time on task’ is a problem in many of the sample schools and classrooms.”213 Specifically, South African teachers observed in that study did not teach 60% of the lessons that they were scheduled to teach.214
The impact of Teachers Unions on Teaching and Learning in schoolsA great deal of attention has been focused on the impact that organised labour has had on the quality of South Africa’s education system. Inefficiencies in teacher post-provisioning and promotional appointments, as well as challenges in observing and assessing teachers in classrooms and ensuring adequate teaching time in classrooms have been largely attributed to teachers unions and to SADTU in particular.
Teachers unions serve as the intermediary between the government, as employer, and teachers as employees, and have been heavily involved in all aspects of the development of government policies impacting teacher employment, appointments and roles and responsibilities. They have been closely involved with policy development and implementation as they are represented on joint policy-making institutions such as the ELRC and SACE. The Committee to Review the Organisation, Governance and Funding of Schools in 1995, which developed recommendations for SASA, included teacher union representatives. While unions have positively contributed to certain aspects of teaching and learning through their involvement in advocating for curriculum improvement and implementing in-service professional development programmes for teachers, their powerful influence, particularly within the politics of the tripartite alliance of the ruling African National Congress, the South African Communist party and the SADTU aligned Congress of South African Trade Unions (COSATU), has been viewed by many critics as negatively impacting learners. This has especially been the case at a local level where teacher unions have been criticised for inappropriately influencing the appointment of key managerial positions, such as principals and educational district officials215, as well as interfering with the placement of newly qualified non-member teachers.216 The involvement by unions in the post-provisioning process, as described above, has further contributed to a lack of efficient allocation of teachers amongst schools and has caused a large number of schools in union dominated provinces, such as the Eastern Cape, to be understaffed. Teachers unions have also opposed implementation measures which seek to improve teacher accountability, such as the monitoring of teachers in their classrooms217, testing of teacher knowledge218 and improved oversite of teacher absenteeism. Opposition to those measures have resulted in teacher evaluation systems that revolve largely around teacher self-appraisals and very limited observations by a colleague chosen by the teacher being evaluated. Union meetings, which generally occur during school hours and for which attendance constitutes an excused absence by the teachers from the classroom, have been viewed as contributing towards the problem of low curriculum coverage in schools, a problem which has also been exacerbated by union-led and mandatory219 teacher strikes. This contribution towards the already high rates of teacher absenteeism has in turn led some, including the ANC’s National Executive Committee, to question whether teachers should be considered an essential service, which would render strikes by teachers illegal.
The impact of teacher unions on the ability of learners to realise their right to quality basic education raises a number of conflicting concerns. On the one hand, teachers need a voice to ensure that the teaching profession is able to attract new teachers and support and
213 Carnoy, M., Chilisia, B. Chisholm. The Low Achievement Trap: ‘Comparing Schooling in Botswana and South Africa.’ (2012). Cape Town: HSRC Press. p xviii. Available at http://www.hsrcpress.ac.za/product.php?cat=1&browse=l&freedownload=1&productid=2293.
214 Ibid.215 National Planning Commission. 2013. National Development Plan 2030: Our future – make it work. Department of the Presidency. p 309. The
National Development recommends the elimination of “union influence in promoting or appointing principals. Unions play an important role in recruitment to ensure that proper procedures are followed, but not in deciding who gets promoted or appointed.”
216 See eg NEEDU. 2013. National Report 2012: The State of Literacy Teaching and Learning in the Foundation Phase. National Education Evaluation and Development Unit. Pretoria. p 56
217 See eg Taylor, N. 2011. Priorities for Addressing South Africa’s Education and Training Crisis: A Review Commissioned by the National Planning Commission. JET Education Services. p 5, stating that “it is common knowledge that teachers frequently disrupt schooling for meetings, bar district officials and principals from entering classrooms, ‘suspend’ district officials whose decision they don’t agree with, and the like.”
218 See eg South African Press Association, ‘Ramaphosa demands competency tests for teachers.’ Mail & Guardian. 07 November 2013. Available at http://mg.co.za/article/2013-11-07-ramaphosa-wants-tests-for-teachers. See also Louw, Poppy. ‘Teacher must take pupils’ tests.’ Times Live. 17 March 2015. Available at http://www.timeslive.co.za/thetimes/2015/03/17/teachers-must-take-pupils-tests.
219 See eg Pattillo, Kathlyn. 2012. Quiet Corruption: Teachers Unions and Leadership in South African Township Schools. Bachelors Thesis. Wesleyan University. p. 50 – 56. Available at http://wesscholar.wesleyan.edu/cgi/viewcontent.cgi?article=1912&context=etd_hon_theses. Finding that during the 2010 SADTU-initiated South African teacher strike, teachers and school administrators were commonly intimidated, pressured and threatened into participating.
Teachers unions serve as the intermediary
between the government, as
employer, and teachers as employees, and have been heavily
involved in all aspects of the development
of government policies impacting
teacher employment, appointments and roles
and responsibilities.

65 STATE LEGISLATION, REGULATIONS AND POLICIES PROVIDING FOR THE REALISATION OF THE RIGHT TO A BASIC EDUCATION
retain existing ones. On the other hand, however, union demands and the state’s repeated willingness to appease organised labour on issues that compromise the ability of learners to access quality education is troubling. As the Constitutional Court has emphasised in Juma, Ermelo, Harmony and Rivonia, a child’s best interests are of paramount importance in every matter concerning the child.220 Accordingly, both teacher unions and government authorities involved with the provision of basic education to children must place the interests of children ahead of the interests of teachers. One must therefore question whether union-demanded and state-endorsed practices such as allocating teacher posts based on the needs of teachers rather than the needs of schools, appointing teachers and administrators based on patronage rather than qualification and shielding teachers from being subject to effective monitoring and accountability systems needed to ensure that teachers are in class, supported and properly teaching the curriculum each day are consistent with the state’s obligation to prioritise the interests and rights of learners.
Policies governing monitoring and accountability of teachersTeachers are evaluated and monitored through the IQMS (Integrated Quality Management System) process, which consists of three programmes aimed at enhancing and monitoring performance of teachers at schools221. First implemented in 1998, the Developmental Appraisal Programme is used to appraise teachers to determine areas of strengths and weaknesses and to draw up programmes for individual professional development. The Performance Measurement programme evaluates teachers for salary progression, grade progression, promotional appointments and rewards and incentives. Finally, the Whole School Evaluation is used to evaluate the overall effectiveness of a school as well as the quality of teaching and learning. The IQMS process consists of annual self-appraisals of teachers as well as an annual appraisal conducted by the teacher’s Development Support Group made up of the teacher’s immediate supervisor and a colleague selected by the teacher. Whole School Evaluations are conducted every 3 to 5 years and include a combination of external evaluations undertaken by education district offices and an internal assessment of the school which looks at key areas of performance. The IQMS process was expanded in 2008 to include the deployment of external IQMS moderators who monitor the implementation of the performance management system, though the monitors themselves are not tasked with evaluating teachers. The IQMS monitoring consists largely of ensuring that various documents, such as School Improvement Plans, Educator Growth Plans, as well as other records are in place.
The effectiveness of the IQMS process has been criticised by a number of bodies. NEEDU has emphasised that “the question of teacher observation has become politicised and bureaucratised to the point where it not only misses serving a useful function, but indeed has become counterproductive, taking up enormous amounts of time and energy without much being achieved.”222 The NEEDU report on rural schools highlighted that the IQMS policy has led to inappropriate teacher ratings where in 2012, only one-half of one percent of the 444 395 teachers, school HODs, deputy and principals were considered to be unacceptable while 69.7% were considered to be good and outstanding and 29.7% were considered to be acceptable.223 NEEDU found these figures to be diametrically at odds with conclusive evidence derived from international tests, such as SACMEQ, TIMSS and PIRLS, that South Africa scores poorly on literacy and numeracy compared to other poorer African countries. The DBE has similarly acknowledged the need to revisit the rating system used to evaluate teachers, as IQMS officials found that the ratings were inconsistent with qualitative comments about one-third of the time.224 Reasons for these inappropriate teacher ratings are likely because (1) most teachers and their development support groups lack the skills necessary to undertake effective evaluations; (2) the criteria used for teacher assessment does not measure effective teaching practices such as time on task, appropriate use of textbooks and materials, communication skills, motivation and the importance of positive feedback; and (3) the evaluations inappropriately combine
220 South African Constitution, Section 28(2).221 The IQMS is used to fulfil Schedule 1 of the Employment of Educators Act.222 NEEDU. 2013. National Report 2013: Teaching and Learning in Rural Primary Schools. The National Education Evaluation and Development
Unit. Pretoria, p 30.223 Ibid citing DBE. 2013. IQMS Annual Report 2012 – 2013. Pretoria: Department of Basic Education. Available at http://www.education.gov.za/
LinkClick.aspx?fileticket=uUsJLgUHiKM%3D&tabid=358&mid=2597.224 DBE. 2011. Action Plan to 2014 – Towards the Realisation of Schooling 2025. Pretoria: DBE. p 138.
The effectiveness of the IQMS process has been criticised by a number
of bodies.

66 Realising the Right to a Basic Education in South Africa
evaluations used to identify and address where development is needed and appraisals used for promotion and salary upgrades.225
Additional concern has been further raised with respect to the failure of SMT members to observe teachers in classrooms. NEEDU found that SMT members observed teachers in their classrooms outside of the IQMS process in less than half of the rural schools surveyed.226 SMT members complained that they did not have time to observe teachers in their classrooms more than the IQMS process called for and that union policy did not allow SMT members into the classrooms of union members.
RECOMMENDATIONS:1. Teachers should be evaluated on a more consistent basis by School Management,
school level HODs and Principals trained to evaluate teaching and learning practices. These evaluations should be used for development purposes only and should be distinctly separate from evaluations undertaken to determine promotion and salary upgrades.
2. Further consideration should be paid to the criteria used to evaluate teachers to ensure that focus areas of evaluations are able to accurately measure effective teaching practices.
3. SMT and principal roles and responsibilities should include observing teachers in their classrooms and time should be allocated for that purpose.
4. Employment agreements with teachers and unions should be reconsidered to allow for productive in-classroom evaluations of teachers so that skill and knowledge backlogs may be identified and addressed through teacher training programmes and SMT coaching and assistance.
5. Programmes should be developed and piloted to assess teacher subject knowledge in schools. Incentive programmes, such as bonuses, should be considered to reward teachers, particularly in schools serving poor learners, who show improved subject knowledge.
The provision of adequate school infrastructure capable of enabling teaching and learning to take place in a safe and effective environment
The poor and unequal state of school infrastructure in South AfricaMassive inequality and deficiencies in school infrastructure continue to exist at many schools throughout South Africa where hundreds of thousands of learners attend schools each year which suffer from poor infrastructure that is not conducive to effective teaching and learning. While Parliament and the Department of Basic Education have implemented significant legislative and policy advancements directed towards improving the state of school infrastructure and ensuring that all learners attend schools that satisfy minimum standards necessary for them to provide safe and effective learning environments, substantial backlogs continue to exist.
The DBE has implemented the National Education Infrastructure System (NEIMS) to track areas of school infrastructure where backlogs exist in the various provinces throughout South Africa. The latest NEIMS report, published in May 2015, indicates that schools located in the Eastern Cape and Kwazulu-Natal are in the worst condition and details the following national school infrastructure backlog:
Of 23 740 ordinary schools:
� 913 schools are without electricity and an additional 2 854 schools are without a reliable electricity supply;
� 452 have no water supply and an additional 4773 have an unreliable water supply;
225 Ibid, at p. 30.226 Ibid, at p. 31.
Additional concern has been further raised
with respect to the failure of SMT members
to observe teachers in classrooms.

67 STATE LEGISLATION, REGULATIONS AND POLICIES PROVIDING FOR THE REALISATION OF THE RIGHT TO A BASIC EDUCATION
� 128 schools are without ablution facilities and 6 783 have only pit latrines available;
� 18 150 schools do not have libraries and only 3 287 schools have stocked libraries;
� 20 312 are without science laboratories;
� 15 984 are without computer centres; and
� 9 966 are without sports facilities
The extent of South Africa’s school infrastructure backlog is particularly concerning given the frequently articulated emphasis the Department of Basic Education has placed on the need for adequate school infrastructure facilities to be made available to learners, teachers and school administrators. In the National Policy on an Equitable Provision for an Enabling School Environment implemented in 2010, the DBE highlighted that:
“recent studies show, there is a link between the physical environment learners are taught [in], and teaching and learning effectiveness, as well as learning outcomes. Poor learning environments have been found to contribute to learner irregular attendance and dropping out of school, teacher absenteeism and the teacher and learners’ ability to engage in the teaching and learning process. The physical appearance of school buildings are shown to influence learner achievement and teacher attitude toward school. Extreme thermal conditions of the environment are found to increase annoyance and reduce attention span and learner mental efficiency, increase the rate of learner errors, increase teacher fatigue and the deterioration of work patterns, and affect learning achievement...”227
Under South Africa’s system of cooperative governance, provinces are responsible for school infrastructural development and ensuring that all learners attend schools that are capable of providing safe and effective learning and teaching environments. Until 2013, the development of school infrastructure has taken place without specific national or provincial minimum norms and standards. The Minister of Basic Education, Angie Motshekga, wrote in 2010 that:
“the absence of clear national policy and norms has led to:
� Constraints on planning as there was little consensus on targets or precise specifi-cations of targets.
� A lack of guidance to provinces and school districts on what is required and what the best approaches would be.
� Difficulty in assessing the current environment as adequate or inadequate against clear benchmarks which had been pre-set.
� Difficulty to find robust evidence for the assessment of technical efficiency and substantive responsiveness of the current environment.”228
Legislation, Regulations and State Policies Governing School Infrastructure � In 2007, Parliament amended SASA to empower the Minister of Education to
prescribe regulations governing minimum uniform norms and standards for school infrastructure229. Section 5A of SASA, which the 2007 amendment inserted into the Act, states that the minimum uniform norms and standards for school infrastructure must at least provide for the availability of classrooms, electricity, water, sanitation, a library, laboratories for science, technology, mathematics and life sciences, sport and recreational facilities, electronic connectivity and perimeter security at schools. Section 58C, which Parliament also inserted into the act under its 2007 amendment, imposes monitoring and oversight mechanisms to ensure that the DBE is able to oversee the extent to which provinces are complying with the norms and standards. Provincial Heads of Departments are required to comply with the norms and standards by (1) identifying resources which will be used to comply with norms and standards; (2) identifying the risk areas of compliance; (3) developing a compliance plan for the
227 DBE. 2010. National Policy for an Equitable Provision of an Enabling School Physical Teaching and Learning Environment. Government Gazette 540 (33283) Pretoria, 11 June 2010. p 5. Available at http://www.education.gov.za/DocumentsLibrary/Policies/tabid/390/Default.aspx.
228 DBE. 2010. National Policy for an Equitable Provision of an Enabling School Physical Teaching and Learning Environment. Government Gazette 540 (33283), 11 June 2010. p 4.
229 The amendment to SASA also empowered the Minister of Education to prescribe minimum uniform norms and standards for the capacity of schools in respect of the number of learners a school can admit and the provision of learning and teaching support materials.
Under South Africa’s system of cooperative governance, provinces
are responsible for school infrastructural
development and ensuring that all
learners attend schools that are capable of providing safe and
effective learning and teaching environments.

68 Realising the Right to a Basic Education in South Africa
province and protocols with schools on how to comply with norms and standards and manage areas of risk, and (4) reporting annually to the provincial MEC on the state of compliance by September 30 of each year. Each Provincial MEC is then required to report annually to the Minister of Basic Education on the extent to which the norms and standards have been complied with or, if they have not been complied with, indicate the measures that will be taken to comply.
� National Policy on an Equitable Provision for an Enabling School Environment (2010)
� This policy lays out the overall policy framework governing the provision of adequate school infrastructure. Among other things, it identifies areas of school infrastructure development that need to be addressed by a range of policy and implementation initiatives needed to define what constitutes an enabling physical teaching and learning environment for all of South Africa’s learners, and how the budgeting and development of improved school infrastructure should take place. The policy identifies and describes eight areas where strategic and operational policies are needed, including the development and implementation of norms and standards for school infrastructure and the process and planning necessary to determine standards; funding for school infrastructure and systems for asset management and maintenance; assuring capacity to deliver school infrastructure; and school infrastructure procurement procedures and management.
� Regulations relating to Minimum Uniform Norms and Standards for School Infra-structure (2013)
� In 2013, the DBE promulgated regulations governing minimum uniform norms and standards for school infrastructure following a legal settlement into which the DBE entered with the non-governmental organisation Equal Education. These regulations (1) provide minimum uniform norms and standards for all public school infrastructure, (2) ensure that provincial authorities comply with the standards when designing and constructing new schools and making improvements to existing schools through planning, reporting, and delivery requirements and (3) provide timeframes within which school infrastructure backlogs must be eradicated. The minimum uniform norms and standards for school infrastructure regulate the provision of safe structures, electricity, water supply, sanitation facilities including the eradication of pit latrines, minimum physical classroom size and maximum learner capacity, libraries, laboratories for science, technology and life sciences, sport and recreation facilities, telephone and internet, perimeter security and school safety, and design considerations. The regulations further set out timeframes detailing when provinces must comply with the norms and standards. Under these timeframes,
� By November 29, 2016, all schools made from mud asbestos, wood and metal must be replaced and all schools must have access to some form of power and water supplies and sanitation facilities.
� By November 29, 2020, all schools must comply with the standards regulating classrooms, electricity, water, sanitation, electronic connectivity and perime-ter security.
� By November 29, 2023, all schools must comply with the standards regulating libraries and science and technology laboratories.
� By November 29, 2030, all schools must comply with all other norms and standards, including those detailing computer laboratories, sports facilities and school nutrition centres. All schools must also accommodate learners with physical disabilities.
Equal Education has raised a number of concerns with the way that the government has drafted the norms and standards for school infrastructure.230 Firstly, the regulation’s exclusion of schools that were being built or improved upon at the time of the enactment of the regulations and schools that had been scheduled to be built or improved upon during medium term
230 Equal Education and the Equal Education Law Centre. 2014. ‘Basic Education Shadow Report: A review of the Department of Basic Education’s performance in the 2013/2014 financial year.’ Khayelitsha: Equal Education. p 3.
Equal Education has raised a number of
concerns with the way that the government
has drafted the norms and standards for
school infrastructure.

69 STATE LEGISLATION, REGULATIONS AND POLICIES PROVIDING FOR THE REALISATION OF THE RIGHT TO A BASIC EDUCATION
expenditure periods from being subject to the norms and standards is troubling. Secondly, Equal Education has objected to the regulations’ statement that the implementation of the norms and standards is subject to the resources and co-operation of other government agencies and entities responsible for infrastructure.231 These shortcomings seek to relinquish the DBE and provincial education departments from being held accountable for providing schools that meet adequate standards. Rather, these education departments should be ultimately responsible for delivering complying schools, including coordinating service delivery amongst other government and private bodies and communicating progress with all stakeholders.
3.16. CASE STUDY – The case for minimum norms and standards for school infrastructure
In 2009, the non-governmental organisation Equal Education began campaigning around the need to improve school infrastructure throughout South Africa. The campaign was built around the fact that massive school infrastructural backlogs from apartheid continued to exist and despite the widespread challenges and inequalities faced by the vast majority of learners, particularly in rural and township areas who attended these grossly inadequate facilities, national and provincial governments had failed to prioritise the development and upgrading of schools. In many schools the situation was dire with reports that schools suffered from unsafe structures, lack of adequate and safe ablution facilities, insufficient access to water and electricity and unavailability of adequate classroom space. The vast majority of schools in South Africa also suffered from a lack facilities such as libraries, science and computer laboratories and school halls. Public schools attended by wealthier learners were able to provide these facilities due to superior schools which their communities and governing bodies had inherited from apartheid’s massively unequal allocation of school resources, as well as through school-fee subsidised upgrades. Schools that suffer from the worst backlogs, on the other hand, are attended by the poorest and most vulnerable learners whose communities are often disempowered and suffering from high rates of illiteracy and unemployment.
A focal point of Equal Education’s campaign quickly turned to the Minister of Basic Education’s failure to enact regulations governing the minimum uniform norms and standards for school infrastructure, which Parliament had empowered the Minister to adopt at a national level in 2007. While the regulations would not necessarily guaranty the immediate upgrade of all schools suffering from inadequate infrastructure, the regulations would make clear to all provinces, schools, teachers, learners, parents and school communities exactly what level of physical facilities must be made available at all schools regardless of the socio-economic conditions of the learners who attend them. These regulations would not only provide clear binding standards and timeframes within which provinces must comply, but they would be used to guide provinces in terms of ensuring effective and efficient planning, budgeting and expenditure for the development of new schools and upgrades made to existing schools. The norms and standards could be used by schools and their communities to enforce upgrades of schools that do not comply with the minimum norms. And they would serve as a mechanism for the national government to monitor and hold provinces accountable for fulfilling their obligation to provide all learners with properly functioning public schools through reporting requirements outlined in Section 58C of SASA.
In 2012, after over two years of campaigning around the issue, the Legal Resources Centre filed an application to commence legal action on behalf of Equal Education and two applicant schools against the Minister of Basic Education, all nine MECs for Education and the Minister of Finance. Part A of the case sought relief for two schools that had been very badly damaged from severe weather storms and fires, rendering the schools unsafe for a period of years and without adequate infrastructure for proper teaching and learning to take place. Part B, on the other hand, addressed and described the impact that the government’s failure to implement adequate infrastructure standards for public schools, a problem that most harshly affects the poorest schools in the country and which continuously results in the types of emergency conditions sustained by the two schools that were parties to the case. Equal Education
231 Ibid.
A focal point of Equal Education’s campaign quickly
turned to the Minister of Basic Education’s
failure to enact regulations governing
the minimum uniform norms and standards for school infrastructure, which
Parliament had empowered the
Minister to adopt at a national level in 2007.

70 Realising the Right to a Basic Education in South Africa
argued that the Minister’s failure to adopt binding regulations perpetuates systemic school infrastructural backlogs and gross educational inequalities in provinces across the country. The result is that many learners and teachers are forced to attend schools in unsafe environments that are not conducive to learning, and which in turn undermine the ability of learners to achieve in the classroom and fully realise their rights to an adequate education, equality and dignity. Moreover, Equal Education argued that the Minister’s failure to adopt minimum norms and standards interfered with the public’s ability to hold national and provincial governments accountable for providing all learners with adequate public school facilities that they are entitled to.
The litigation ultimately settled in 2012 with the DBE agreeing to adopt the binding minimum uniform norms standards for school infrastructure that are outlined above. This case, however, raises several central issues which speak to the core content of the right to a basic education, as well as the legal framework that has been developed to ensure that the education system functions properly at national, provincial and local levels. Firstly, the case raises the issue of quality as being implicit in the right to a basic education. Learners, particularly from poor and impoverished communities, must have access to facilities that are of an adequate quality to ensure that learners are safe while they are at school and that schools are conducive to proper teaching and learning. Secondly, government officials empowered to act in a way that advances the rights of learners must do so, especially in this instance where the implementation of norms and standards advances critical government principals such as accountability, efficiency and effectiveness of education service delivery. Finally, the case speaks to the need for the DBE to implement minimum norms and standards where possible. A central component to the applicants’ argument that the Minister failed her duties and violated the rights of learners by not implementing these regulations was the key role that norms and standards plays within SASA. The preamble to SASA, which states that “it is necessary to set uniform norms and standards for the education of learners at schools”, speaks to the relationship amongst national, provincial and local spheres of government and the need for the national government to set policy frameworks that commit provincial and local authorities to provide certain core educational services to schools and their learners. These regulations, as well as other norms and standards that the Minister has been empowered to implement, such as norms and standards for school capacity and learning and teaching support materials, are necessary to advance the right to a basic education for all learners and to ensure that all role players are fulfilling their mandates in a manner that is both informed and accountable.
� Accelerated Schools Infrastructure Delivery Initiative (ASIDI)
� The Department of Basic Education established ASIDI in 2011 with the aims of replacing schools constructed from inappropriate materials, including mud schools, and providing basic levels of sanitation, electricity and water supplies to schools that lack these fundamental resources. The ASIDI programme was implemented following a legal settlement to litigation brought by the Legal Resources Centre in 2011 on behalf of Centre for Child Law and seven mud schools in the Eastern Cape operating in inappropriate structures built from mud, corrugated iron and crumbling bricks. 232The State pledged to allocate 8.2 billion rand through the School Infrastructure Backlog Grant towards rebuilding 492 schools with unsafe and inadequate infrastructural facilities, providing water and sanitation to 1 861 schools and electricity to 915 schools by 2015.
� The implementation of the ASIDI programme is running far behind schedule as the DBE’s February 2015 ASIDI Brief states that only 91 schools have been completed while 351 have received decent sanitation for the first time and 288 schools have been connected to the internet for the first time. A 2014 report on school infrastructure spending and delivery found significant underspending by the Eastern Cape Provincial Education Department on its share of its allocated budget for school infrastructure.233 The report attributed this underspending
232 See 4 February 2011 Settlement Agreement from Centre for Child Law and Others v. The Government of the Eastern Cape and Others. In the Eastern Cape High Court; Bhisho. Case No. 504/10. Available at http://www.lrc.org.za/images/resources/mud_schools/pdf_dowbloads/founding_affidavit/2011_02_04_Memorandum_of_Agreement_SIGNED_version_State_Attorney.pdf
233 Abdoll, C., Barberton, C. 2014. ‘Mud to bricks: A review of school infrastructure spending and delivery.’ Pretoria: University Law Press. Available at http://www.centreforchildlaw.co.za/publications.
The preamble to SASA, which states that “it is necessary
to set uniform norms and standards for the
education of learners at schools”, speaks to the relationship amongst
national, provincial and local spheres of government and the need for the national
government to set policy frameworks
that commit provincial and local authorities
to provide certain core educational
services to schools and their learners.

71 STATE LEGISLATION, REGULATIONS AND POLICIES PROVIDING FOR THE REALISATION OF THE RIGHT TO A BASIC EDUCATION
primarily to an understaffed infrastructure unit and poor planning. The report further highlighted underspending by the DBE on the School Infrastructure Backlog Grant as a result of poor capacity within the department to manage the infrastructure programme of that size along with poor initial planning, bad weather and certain contractors being declared bankrupt. That report concluded that based on slow progress and underspending a realistic timeframe for the eradication of schools with inappropriate structures is likely 2023/2024.
� Since the 2011 legal settlement, the Legal Resources Centre has returned to court twice over the government’s failure to comply with the terms of the settlement and related court orders. In 2014, the Grahamstown High Court ordered the State to, among other things, publish an updated list of public schools in the Eastern Cape comprised of inappropriate structures along with a comprehensive plan detailing the infrastructural provisions that each school on the list is scheduled to receive and timeframes within which such provisions would be delivered.234 The Legal Resources Centre filed a contempt of court application in the Grahamstown High Court in 2015 when the state failed to comply with those terms.235
RECOMMENDATIONS:1. The National Government should undertake a costing assessment to determine
the budgeting allocations that will be required for provinces to comply with the norms and standards for school infrastructure. The DBE should then regularly monitor provincial improvements towards compliance and expenditure to, among other things, ensure that school infrastructure development is performed efficiently in terms of cost and time taken to deliver new and improved schools.
2. The DBE should monitor and oversee the development of provincial capacity to build new schools and improve existing schools. A component of the costing exercise referenced above should include the cost to improve capacity of provincial departments involved with the planning, budgeting and contracting processes associated with complying with the minimum norms and standards. The DBE should investigate whether training programmes should be developed to assist provincial departments and offices involved with the provision of new and improved school infrastructure and whether certain offices should be created and staffed with administrators and staff that hold specified qualifications and/or credentials.
3. The planning and development of schools that meet minimum norms and standards should be undertaken in an open and transparent manner. Accordingly, delivery schedules should be made easily publicly accessible so progress can be measured and parents of learners in schools, as well as school staff, are able to plan accordingly and hold provinces accountable.
Policies governing the curriculum taught in schoolsSouth African public schools have experienced significant curriculum reform since the end of apartheid. Central to the process of determining the initial curriculum developed in the post-1994 democratic era was how to best respond to grossly inadequate and unequal curriculum offered to black learners during apartheid, as well as the need to develop a curriculum that would advance notions of redressing past injustices and inequalities and ensuring the realisation of human rights guaranteed by the Constitution. Another primary concern at the time of political transition was how to best develop a curriculum that would be capable of integrating education and training, responding to the economic and industrial demands of labour to be skill-based and the need to establish a system capable of integrating various levels
234 See 21 August 2014 Court Order, Makaziwe Maqhelana and Others v. Government of the Republic of South Africa. Case No: 7/2014. Eastern Cape High Court, Grahamstown. Available at: http://www.lrc.org.za/images/pdf_downloads/Court_papers/2015/2014_08_21_Mud_Schools_2_Court_order.pdf
235 Legal Resources Centre. 10 April 2015 Press Release: Further litigation launched after Department of Education Fails to Eradicate Mud Schools. Available at: http://www.lrc.org.za/press-releases/3484-press-release-further-litigation-launched-after-department-of-education-fails-to-eradicate-mud-schools
South African public schools have
experienced significant curriculum reform since
the end of apartheid.

72 Realising the Right to a Basic Education in South Africa
of education and training achievement which had been subject to very different qualification standards under the apartheid regime.
Under apartheid’s government-controlled public education system, black learners were subject to very limited curriculum and subject content taught by poorly trained and often uncertified teachers. Hoadley has written that:
“Curricula for black students especially emphasized teaching based on drill and practice, and little elaboration of concepts and skills, but rather a strict focus on content to be memorized. Teachers were issued with syllabuses that often contained highly prescriptive teacher manuals with detailed work plans. In African schools, teachers were overseen by a highly autocratic and bureaucratic system of inspection that appeared to be used punitively and vindictively against teachers...What predominated in schools under a strong inspection regime, and with teachers who were very poorly trained, was a pedagogy consisting largely of drill and rote routines, with ‘... teachers adopting authoritarian roles and doing most of the talking, with few pupil initiations, and with most of the pupil responses taking the form of group chorusing.”236
Curriculum 2005 (1998) � The first major curriculum shift in democratic South Africa was the implemen-
tation of Outcomes Based Education (OBE). Curriculum 2005 was first rolled out in 1998 to grade 1 classrooms with the goal to have the curriculum expanded to all grades by 2005. It sought to shift the focus of education away from centrally predetermined subject content and towards concepts which learners are expected to understand and be able to perform following graduation237. Through Curriculum 2005, the then Department of Education sought to focus more on a process-driven learning environment wherein teachers were expected to be facilitators of learning rather than content-providers.238 Curriculum 2005 decentralised subject content to teachers, schools and education districts with outcomes defined very broadly, thus empowering teachers to determine the content and teaching activities that they believed best responded to the learners in their classrooms. This curriculum steered away from the teaching of separate subjects, instead relying on the use of projects aimed at teaching students how to learn.
� Curriculum 2005 became heavily criticised shortly after its implementation for being largely ineffective due to the conditions which existed so immediately after the transition from apartheid, including undertrained teachers who were unable to achieve the outcomes envisaged given that their teaching experience largely involved rote-and-call methodology and lack of subject content knowledge. Critics have also pointed to the overly complex language used to convey the curriculum to largely under-educated and undertrained educators as one of the reasons for Curriculum 2005’s ineffectiveness. Criticism also fell on the Department of Education for its failure to adequately prepare and train teachers to select and teach appropriate content necessary for the successful implementation of Curriculum 2005, as well as a lack of access to and proper use of teaching resources such as reading books and textbooks, which the curriculum was heavily reliant upon. The implementation of Curriculum 2005 also suffered from a shortage of levels of personnel and resources necessary to implement the curriculum and support teachers, as well as failed to align the curriculum with a national assessment policy.239 In addition to leading to poor
236 Hoadley, U. 2011. ‘Knowledge, Knowers and Knowing: Curriculum Reform in South Africa. p 144. In L. Yates & M. Grumet (eds.) Curriculum in Today’s World: configuring knowledge, identities, work and politics. Routledge. p 144.
237 Curriculum 2005 defined the outcomes required of learners very broadly, such as “Identify and solve problems and make decisions using critical and creative thinking”, “Work effectively with others as members of a team, group, organisation and community” and “Collect, analyse, organise and critically evaluate information.”
238 Maringe, F. 2014. ‘Twenty Years of Curriculum Development in Gauteng: Successes and Challenges.’ In Maringe, F. and Prew, M. Twenty Years of Education Transformation in Gauteng 1994 to 2014: An independent Review. 2014. Somerset West: African Minds, p 44. Available at http://www.education.gpg.gov.za/Documents/GDE%2020%20years%20final%20print%20proof%20with%20cover.pdf.
239 Chisholm, L., et al. 2000. ‘A South African Curriculum for the Twenty First Century: Report of the Review Committee on Curriculum 2005.’ Pretoria: Department of Education. p vi – vii. Available at http://www.polity.org.za/polity/govdocs/reports/education/curric2005/curric2005.htm.
Under apartheid’s government-controlled
public education system, black learners were subject to very limited curriculum
and subject content taught by poorly trained and often
uncertified teachers.

73 STATE LEGISLATION, REGULATIONS AND POLICIES PROVIDING FOR THE REALISATION OF THE RIGHT TO A BASIC EDUCATION
learning outcomes, studies have shown that Curriculum 2005 left poorly trained and ineffectively prepared educators confused and feeling incompetent.240
Revised National Curriculum Statement (2002) � In 2002, the Department of Education implemented the Revised National
Curriculum Statement (RNCS), which resulted from recommendations of the Report of the Review Committee to Streamline and Strengthen Curriculum 2005. The RNCS was phased-in over a period of several years with the first grade 12 class taking the National Senior Examination in 2008. The RNCS attempted to simplify the outcomes statements, place greater emphasis on basic skills, content knowledge and the progress that was needed to advance from one grade to the next. It has been described as combining “a learner-centered curriculum requiring critical thought and democratic practice with an appreciation of the importance of content and support for educators.”241 The RNCS organised the curriculum into eight learning areas, including Languages, Mathematics, Natural Science, Social Science, Technology, Arts and Culture, Economic and Management Sciences and Life Orientation. Assessment standards were described in greater detail than the prior Curriculum 2005 and were distinguished from learning outcomes as the minimum level, depth and breadth of what was to be learnt as opposed to the outcomes which describe what learners should know and be able to do.
� The RNCS attempted to make the curriculum more accessible to teachers both through simplified language and provided content, as well as through improved teacher training programmes. However, it remained clear that most teachers continued to lack the basic knowledge that the curriculum required them to teach and that the training and support made available to educators failed to address this poor level of content and pedagogical knowledge.242 Moreover, the home language policy that recommended that foundation phase learners be taught in their home languages from grades 1 through 3 was inconsistently implemented due to parental ability to choose language of instruction, the power of School Governing Bodies to determine language policies for schools and in some cases, availability of educators qualified to teach in the home language of the foundation phase learners.243 A 2009 review of the RNCS further found that school principals and teachers were too often faced by a curriculum that was unclear, partly because the national curriculum was re-interpreted at a provincial level and even again at district level, leading to a profusion of sometimes inconsistent curriculum documents as well as a lack of guidance to teachers of multi-grade classes, despite the fact that such classes continue to be a widespread phenomenon.244
Curriculum Assessment Policy Statements (CAPS)(2012) � Following poor learner results, particularly in the 2007 SACMEQ tests, and
continued criticism of Outcomes Based Education, the Department of Education again turned to revising the curriculum in 2009. This time the Department of Education developed the Curriculum Assessment Policy Statements (CAPS), implementing this new curriculum in place of the RNC’s Subject and Learning in 2012. CAPS, which consists of a single comprehensive curriculum and assessment policy for each subject in each grade, represents a significant shift in curriculum for South Africa’s teachers, school administrators and learners. The DBE has stated that:
240 Maringe, F. 2014. ‘Twenty Years of Curriculum Development in Gauteng: Successes and Challenges.’ In Maringe, F. and Prew, M. Twenty Years of Education Transformation in Gauteng 1994 to 2014: An independent Review. 2014. Somerset West: African Minds, p 42.
241 OECD. 2008. Reviews of National Policies for Education: South Africa. OECD, p 81.242 Hoadley, U. 2009. Learning to teach the National Curriculum Statement in schools: A desk review of teacher education in the Foundation
Phase in South Africa. Pretoria: Umalusi.243 Maringe, F. 2014. ‘Twenty Years of Curriculum Development in Gauteng: Successes and Challenges.’ p 44.244 DBE. 2011. Action Plan to 2014 – Towards the Realisation of Schooling 2025. Pretoria: DBE. p 59.

74 Realising the Right to a Basic Education in South Africa
“CAPS embodies the vision for general education to move away from a racist, apartheid, rote model of learning and teaching to a liberating nation-building and learner-centered and outcomes-based initiative. At the centre of its vision are learners who will be inspired by the values of a society based on respect for democracy, equality, human dignity, life and social justice. The curriculum seeks to create a lifelong learner who is confident and independent, literate, numerate, multi-skilled and compassionate, with respect for the environment and the ability to participate in society as a critical and active citizen. Teachers are seen as key contributors to the transformation of education in South Africa”
The DBE has identified that the National Curriculum Statement under CAPS serves the following purposes:
� Equipping learners, irrespective of their socio-economic background, race, gender, physical intellectual ability, with the knowledge, skills and values necessary for self-fulfillment, and meaningful participation in society as citizens of a free country;
� providing access to higher education;
� facilitating the transition of learners from education institutions to the workplace; and
� providing employers with a sufficient profile of a learner’s competences.
While the CAPS curriculum continues to promote the outcomes on which the previous OBE curriculums had been based, the new curriculum provides far greater detail in terms of the content that should be taught to learners in each grade and activities that support learners in comprehending the content. The current curriculum also details time allocations that should be devoted to each subject each week, as well as each topic within each subject. Moreover, the CAPS curriculum prescribes assessment methods, including examination and essay questions in addition to assignments for research projects. Finally, the CAPS curriculum added the requirement that schools teach a First Additional Language, usually English, to all learner in the Foundation Phase. This addition signals an attempt to respond to the need to improve the transition to English as language of instruction which occurs in the Fourth grade.
The CAPS curriculum has also included the provision of workbooks to all learners in grades R through 9, as discussed in additional detail in the below Section on Learning and Teaching Support Materials.
Programmes to address historical backlogs in mathematics and science subjectsThe DBE has focused particular attention on the need for learners, particularly black learners, to achieve greater success in mathematics and science subjects. Black students were frequently not exposed to mathematics and science in schools operating during the apartheid system which restricted the curriculum taught to black students to instruction designed to prepare them for the limited and subordinate forms of employment that the apartheid regime envisaged them fulfilling. The apartheid-era curriculum has therefore left South Africa with a significant shortage of teachers qualified to teach mathematics and science subjects. Moreover, the vast majority of the limited black South Africans that have qualified for further studies in mathematics and sciences at the tertiary level have chosen to pursue careers in fields outside of teaching which has further contributed to the shortage of mathematics and science teachers available to teach in South Africa’s public education system.245
The Department of Basic Education implemented the Dinaledi Intervention Programme in 2001 to improve learning outcomes in mathematics and physical science for learners in grades 10 to 12 attending public secondary schools. The Dinaledi programme has provided support to teachers and learners, through training and supplementary materials, in almost 500 mostly historically disadvantaged schools. While the World Bank has revealed, that despite certain design flaws, Dinaledi has been successful in increasing the mathematics and physical sciences pass rate, the DBE has found that the overall improvements in the Grade 12 mathematics and science results were disappointingly low, particularly with regard to historically disadvantaged learners.246 The DBE announced in 2014 that the Dinaledi and Technical Schools grants will be consolidated into a new Maths, Science and Technology Schools Improvement Grant and will
245 DBE. 2014. Annual Performance Plan 2014 – 2015. Pretoria: Department of Basic Education. p 19.246 DBE. 2011. Action Plan to 2014 – Towards the Realisation of Schooling 2025. Pretoria: DBE. p 65.
While the CAPS curriculum continues to promote the outcomes on which the previous OBE curriculums had been based, the new curriculum provides far greater detail in
terms of the content that should be taught
to learners in each grade and activities
that support learners in comprehending
the content.

75 STATE LEGISLATION, REGULATIONS AND POLICIES PROVIDING FOR THE REALISATION OF THE RIGHT TO A BASIC EDUCATION
be expanded to support grades 8 and 9 mathematics and natural sciences courses in the same selected 500 schools.
Summary of roles and responsibilities of government departments and schools to develop and ensure delivery of the curriculum to learnersThe National Education Evaluation and Development Unit (NEEDU) has described the roles and responsibilities of national and provincial education departments, districts offices and schools with respect to curriculum delivery as follows:
� National
� Responsible for distributing CAPS documents and providing CAPS training to teachers.
� Design, distribution and use of Annual National Assessment examinations to identify areas where targeted support and further training are required.
� Design and distribution of workbooks
� Provincial
� Curriculum planning
� Monitoring curriculum delivery
� Assessment and use of assessment data
� Procurement and distribution of books and other cognitive resources
� Professional development
� District
� Curriculum planning
� Monitoring curriculum delivery
� Assessment and use of assessment database
� Procurement and distribution of books and other cognitive resources
� Professional development
� School
� School culture indicated through history of school and community, demo-graphics and learner population and surrounding community, location, school infrastructure and resources which the school is able to make available to its learners.
� School’s Language of Learning and Teaching – determined by the SGB’s choice of language of instruction and first additional language courses offered and is also impacted by the home language of learners and teachers.
� Quality of instructional leadership at the school level is indicated by the school’s goals, staffing and delegation of functions, time management, extent of curriculum planning, monitoring of teaching and learning by school-level management, assessment of learners, procurement and distribution of textbooks and other resources and the culture and extent of professional develop ment for teachers at the school.
� Quality of teaching and learning is indicated by reading fluency and compre-hension; frequency and quality of writing, particularly in DBE workbooks; and frequency and assistance with homework is indicated by reading fluency and comprehension.
� The quality of district support is indicated by the frequency of visits by district officials and the activities of the district with respect to administrator and teacher monitoring and support.

76 Realising the Right to a Basic Education in South Africa
The Provision of Learning and Teaching Support Materials to Schools and their Learners
The provision of textbooks to learners in schoolsThe Department of Basic Education has developed and implemented policies which stress the vital role that access to high quality learning and teaching support materials (LTSM), including textbooks, reading books, workbooks and laboratory equipment, has on educational outcomes. Both local and international research has shown the textbook to be the most effective tool to ensure the consistency, coverage, appropriate pacing and quality instruction during the course of curriculum implementation.247 Accordingly, the DBE stated in its Action Plan to 2014 that “[p]roviding good quality learning materials, such as textbooks, to learners in sufficient quantities is one of the best ways to achieve the aims of the national education system.” The South African Human Rights Commission, however, emphasised in its report on the Delivery of Primary Learning Materials to Schools following its 2013 country-wide investigative hearing into learners’ access to textbooks, that “historically South African learners have not enjoyed adequate access to learning and teaching materials.”248 While the DBE has been clear in its intention to fulfill its mandate of ensuring that each learner is equipped with his or her own textbook for each subject, there have been well documented cases of either late or non-deliver of adequate supplies of textbooks to schools, as well as a lack of access to other critical materials such as an adequate supply of reading books in many schools throughout South Africa.
Textbook provisioning is allocated to provinces, which are responsible for procuring and delivering textbooks to learners in schools pursuant to the DBE’s policy of one textbook per learner per subject. As a result, the funding models and procurement frameworks for LTSM vary from province to province. While most provinces manage the procurement of textbooks for all schools, some transfer funds directly to Section 21249 schools, which are then responsible for procuring their own textbooks for their learners. The National Treasury allocates funding to provinces for textbooks under general equitable share funding. Each province is then responsible for allocating its budget appropriately to ensure that adequate textbook provisioning takes place. The DBE identified three causes for the lack of access to textbooks in schools in its Action Plan to 2014: (1) Schools order textbooks but funding does not arrive from the Provincial Education Department; (2) Theft or textbooks are not well looked after; and (3) Provincial Education Department fails to deliver materials it was supposed to deliver.
As discussed in the School Infrastructure section outlined above, Parliament in 2007 amended SASA to include Section 5A, empowering the Minister of Basic Education to prescribe Minimum Uniform Norms and Standards for the provision of learning and teaching support material; including stationary and supplies; learning material; teaching material and equipment; science, technology, mathematics, and life sciences apparatus; electronic equipment; and school furniture and other school equipment. Whilst promulgating these Norms and Standards would subject provinces to the same monitoring and oversight mechanisms set forth in Section 58C of SASA, as outlined above, the Minister of Basic Education has not enacted such regulations.
The 2009 Report of the Task Team for the Review of the Implementation of the National Curriculum Statement found that “Proper and comprehensive use of textbooks was discouraged and undermined by C2005, and teachers were encouraged to produce their own materials.” The Task Team Report went on to emphasise that “during the hearings, teachers complained that they were expected to perform tasks, such as developing learning materials, which were best placed in the hands of experts” and that “having to be ‘curriculum developers’ eroded their time for teaching.” Other LTSM related complaints highlighted during the hearings and in the report were that “some provinces had not provided sufficient textbooks for learners for years, and that some provincially developed catalogues contained LTSM of dubious quality. Accordingly, the 2009 Task Team recommended that the quality assurance and catalogue development
247 South Africa. 2009. ‘Report of the Task Team for the Review of the Implementation of the National Curriculum Statement.’ Pretoria. p 9. Available at http://v1.sahistory.org.za/classroom/NCS_final_report.pdf. See also DBE. 2011. Annual Performance Plan 2011 – 2012. Pretoria: Department of Basic Education. emphasising that “With regard to textbooks, the Delivery Agreement emphasises that while the development of teaching materials by teachers themselves can have positive effects, in general the textbook is the most effective tool to ensure consistency, coverage of content, appropriate pacing and better quality instruction. Good textbooks must be become more available to learners and teachers and should be used regularly.”
248 South African Human Rights Commission. 2014. Report: Delivery of Primary Learning Materials to Schools. Johannesburg. p 4. Available at http://www.sahrc.org.za/home/21/files/Delivery%20of%20Learning%20Material%20Report%20Final.pdf. Citing 2007 SACMEQ findings that the average Grade 6 learner attended a school where 45% of the learners had access to reading books and and 36,4% had mathematics textbooks.
249 Section 21 schools refers to schools approved by the provincial HOD, pursuant to Section 21 of SASA, to be allocated funding to fulfil certain functions, including the power to purchase textbooks, educational materials or equipment for the school
Textbook provisioning is allocated to
provinces, which are responsible
for procuring and delivering textbooks to learners in schools pursuant to the DBE’s
policy of one textbook per learner per subject.

77 STATE LEGISLATION, REGULATIONS AND POLICIES PROVIDING FOR THE REALISATION OF THE RIGHT TO A BASIC EDUCATION
for textbooks and other LTSM needed to be centralised at the National Level; that the useful role and benefits of textbooks needs to be communicated at the highest level; and that each learner from Grade 4 to Grade 12 should have a textbook for each learning area or subject.”
The DBE responded to these recommendations by implementing policy guidelines that make provision for one textbook per child per subject. In his 2011 State of the Nation Address, President Zuma announced that “The Administration must ensure that every child has a text book on time.” The DBE’s Annual Performance for 2011 – 2012 similarly stated that “we are aiming at a textbook for each child in each subject, to ensure this we are moving towards the central procurement of quality learning and teaching materials.” The DBE, however, acknowledged in 2013 that “while provinces have not achieved the goal of one textbook per subject per learner250, year by year all provinces are moving ever closer to achieving this goal. It is expected that the goal of one textbook per subject per grade per learner will be achieved by the end of 2014.”251
The DBE has developed a National Catalogue for textbooks in line with the implementation of the new CAPS curriculum to identify and provide textbooks for each subject per grade and to guide provinces in terms of which textbooks should be purchased for each learner.252 In 2014, the DBE circulated its Draft National Policy for the Provision and Management of Learning and Teaching Support Materials for public comment. That draft policy, which affirms the DBE’s one textbook per child per subject policy and provides for a five-year textbook retention plan to ensure that universal access to textbooks may be achieved within budget restrictions, has been heavily criticised by teachers unions253, the publishing industry254 and civil society255 for its position that the National Catalogue for Core LTSM would list and make available only one textbook title for each subject for each grade. This position, which deviates from the current catalogue that enables schools to choose between eight unique textbook titles for each subject and each grade, appears to contradict the emphasis which the DBE’s Action Plan to 2014 placed on the need for different textbooks to be made available and for advice to be provided to teachers and schools on how to select the most appropriate textbook as “different textbooks are appropriate in different contexts.”256 Moreover, the draft policy has also been criticised for mis-identifying the DBE’s constitutional obligation for ensuring adequate access to textbooks as to merely “progressively provide resources to safeguard the right.” This position contradicts the emphasis that the Constitutional Court in Juma placed on the right to a basic education being immediately realisable. It is also inconsistent with the High Court judgment in Section 27 & Others v. Minister of Education & Another, which held the provision of textbooks to be inextricably linked to the fulfilment of the right to a basic education.257
Despite these policies, timely learner and teacher access to textbooks remains a problem in many schools throughout the country. Nationally, 74,0% of grade 10 to 12 learners reported having access to textbooks for all of their subjects at the start of the 2014 school year and 80,0% of learners reported having access to textbooks in all of their classes by the end of the 2014 school year.258 These reports indicate a downgrade from 2013 when 86,1% of grade 10 to 12 learners reported having access to textbooks in all of his or subjects by the fourth quarter of the 2013 school year.259 While these figures demonstrate that access to textbooks have significantly improved since 2007 when SACMEQ found that only 45% of Grade 6 learners had access to reading books and 36,4% of grade 6 learners had access to mathematics textbooks, improved textbook delivery by provinces is still needed.
250 The DBE’s School Monitoring Survey conducted in 2011 assessed, among other things, the level of access that learners had to textbooks throughout the various provinces. The 2011 School Monitoring Survey found that overall, 78% of Grade 6 learners in South Africa had access to a language textbook. The results, however, varied across provinces, with 58% of learners in the Free State to 93% in the Northwest provinces having access to language textbooks. Less than 70% of Grade 6 learners in Mpumalanga, Northern Cape and the Free State had access to a Language book. Overall 83% of Grade 6 learners had access to a Mathematics textbook. The percentage across provinces ranged from a low of 50% in the Free State to 98% in the Western Cape. Less than 70% of Grade 6 learners in Mpumalanga and the Free State had access to a Mathematics book. However, this does not necessarily imply that every learner had his/her own copy as in some cases textbooks were shared between learners.
251 Parliamentary Monitoring Group, Question & Reply: Basic Education; Reply to Question 432 (May 2013).252 Ibid.253 Cape Times Education Writer, ‘Textbook Policy ‘cannot benefit learners’.’ Cape Times. 7 November 2014. Available at http://www.iol.co.za/news/
politics/textbook-policy-cannot-benefit-learners-1.1776962#.VYKP0Vyqqko.254 McCallum, Kate. ‘More damage predicted for educational outcomes: the case against approving only one textbook. PRAESA. 8 November,
2014. available at http://www.praesa.org.za/more-damage-predicted-for-educational-outcomes-the-case-against-approving-only-one-textbook/.
255 Veriava, Faranaaz. ‘Learning to live in a Material World. Mail & Guardian. 24 October, 2014. Available at mg.co.za/article/2014-10-23-learning-to-live-in-a-material-world.
256 DBE. 2011. Action Plan to 2014 – Towards the Realisation of Schooling 2025. Pretoria: DBE. p 127.257 Section 27 and others v. Minister of Education and Another 2012 3 All SA 579 (GNP) 258 StatsSA. 2015. ‘General Household Survey 2014 - Statistical Release P0318.’ Pretoria: Statistics South Africa. p 21.259 Ibid.
Despite these policies, timely learner and teacher access to
textbooks remains a problem in many schools throughout
the country.

78 Realising the Right to a Basic Education in South Africa
3.17. CASE STUDY – Textbook delivery failures in Limpopo
The start of the 2012 school year in Limpopo was marred by significant shortages of textbooks for grades 1, 2, 3 and 10 learners. Following three months of failed attempts to engage with provincial and national education departments to secure textbooks for affected learners, the public interest law organisation Section 27 instituted urgent litigation in the North Gauteng High Court against the Minister of Basic Education and the MEC for Limpopo. In addition to securing textbooks for many of the affected learners and bringing wide-spread attention to textbook shortages and education service delivery failures by government, the Limpopo textbook litigation revealed significant systemic shortcomings in the national and provincial textbook provisioning schemes and management systems.
In December 2011, just before the start to the 2012 school year, the Department of Basic Education placed the Limpopo Department of Education (LDoE) under national administration due to the province’s maladministration and mismanagement of funds.260 As a result of the intervention261, the DBE took over the LDoE’s responsibilities in order to ensure that the provincial basic education system continued to function. Following a series of broken promises made by the DBE that textbooks would be provided to affected schools, Section 27 launched an urgent application on 4 May 2012 on behalf of an affected school and parent of learners denied access to textbooks. The urgent application sought (1) a judicial declaration that the matter is urgent and that the LDoE’s and DBE’s failure to provide textbooks to schools in Limpopo violated the rights of the affected learners; (2) an order directing the LDoE or DBE to provide textbooks to learners in grades 1, 2, 3 and 10 who had not been provided the requisite textbooks on an urgent basis no later than 31 May, 2012; and (3) a directive requiring the LDoE or DBE to develop a catch-up plan for affected learners.
In a resounding judgment providing clear content to the right to a basic education, Judge Kollapen of the North Gauteng High Court found for the affected schools and learners on all counts. Firstly, the court found the matter to be urgent, that textbooks are a component of the right to a basic education, that the failure to provide learners with textbooks constitutes a violation of the learners’ right to a basic education. Judge Kollapen further emphasised that the DBE had acted unreasonably by failing to act swiftly given the urgent needs of learners in the province to have textbooks delivered to their schools.262 In finding that “text books are an essential and vital component in delivering quality learning and teaching”, the court pointed to benchmarks outlined in a number of national and provincial policy statements guaranteeing the provision of textbooks to all learners in South Africa. Namely, President Zuma’s 2011 state of the nation address that “the administration must ensure that every child has a textbook on time”, as well as targets set out in the LDoE’s annual performance plan for 2011-2012 ensuring “that every learner has access to minimum set of workbooks and textbooks according to National Policy.”263 The court also looked to the LDoE’s curriculum strategy, which cited the availability and retention of LTSM as a “vital ingredient in the delivery of quality learning and teaching.”264The court went on to hold that:
“the provision of learner support material in the form of text books, as may be prescribed is an essential component of the right to basic education and its provision is inextricably linked to the fulfillment of the right. In fact, it is difficult to conceive, even with the best intentions, how the right to basic education can be given effect in the absence of text books. On that basis, it must accordingly follow, given the respondents’ own goals and indicators in its annual performance plan and its target setting of 100% in respect of work books and text books for the entire school year, that the failure to provide text books somewhat midway
260 Section 100 of the South African Constitution provides, in part, that: “When a province does not or cannot fulfill an executive obligation in terms of the Constitution or legislation, the National Executive may intervene by taking any appropriate steps to ensure fulfilment of that obligation including the maintaining essential national standards or meeting established minimum standards for the rendering of a service.”
261 The DBE stated in a 19 January 2012 media statement that it had instituted the intervention into the LDoE in order to address overspending of its budget due to the failure to properly manage its supply chain management systems, the failure of the LDoE to timely order LTSM for the 2012 school year, unauthorised expenditure amounting to R2.2 billion, excess teacher posts amounting to 2400 excess teachers, 200 ghost teachers, failure to pay invoices on time amounting to R190 million, projections that the LDoE will overspend its budget by R293 million and the LDoE’s failure to transfer funds to schools in accordance with norms and standards making day-to-day operation of schools difficult.
262 Section 27 and others, at para. 25 – 32.263 Ibid, at para. 23.264 Ibid.
In a resounding judgment providing
clear content to the right to a basic education, Judge
Kollapen of the North Gauteng High Court
found for the affected schools and learners on
all counts.

79 STATE LEGISLATION, REGULATIONS AND POLICIES PROVIDING FOR THE REALISATION OF THE RIGHT TO A BASIC EDUCATION
through the academic year would prima facie constitute a violation of the right to basic education.”
The court further highlighted the DBE’s failure to act swiftly in providing textbooks to affected learners, especially given that the Textbook Publishers Association of South Africa contacted the DBE in December 2011 at least three times alerting them to the fact that Limpopo had not yet placed its textbook orders for the following year.
Having found that the rights of the learners had been violated, Judge Kollapen ordered the Department to deliver all outstanding textbooks by 15 June 2012 and to collaborate with affected schools and submit a catch-up plan detailing how the affected learners would be able to make up for the five-month period during which they lacked access to the textbooks necessary to teach and learn the curriculum.
In June 2012, Professor Mary Metcalfe led an independent verification process to determine the extent to which the state had complied with the court’s order. Professor Metcalfe’s audit found that significant numbers of textbooks continued to be outstanding at the time of the court-imposed deadline and that orders for books had only been placed with publishers the first week of June. That report identified the causes for the failure to provide the necessary textbooks to be (1) insufficient funding allocated to textbook purchasing by the province, (2) inadequate co-ordination and communication between schools and provincial and national education department officials responsible for ordering textbooks,(3) poor record-keeping, (4) non-existent project management and (5) piecemeal ordering and delivery of textbooks, along with (6) a lack of a reliable monitoring system. These findings were echoed in a subsequent October 2012 Report of the Presidential Task Team established to investigate the non-delivery and/or delays in the Delivery of Learner, Teacher Support Material (LTSM) in Limpopo Schools.265
In addition to emphasising the vital role that textbooks play in terms of curriculum delivery and the inextricable link between access to textbooks and the realisation of the right to a basic education, the mismanagement of textbook provisioning in Limpopo reveals how weak systems are capable of buckling in a manner which causes widespread lack of access to critical educational inputs. Dr. Linda Chisholm, HSRC advisor to the Minister of Basic Education, has identified the immediate cause of the non-delivery of textbooks as being attributable to a cash flow crisis in the province precipitated by overpriced contracts and a high teacher salary budget resulting from hiring excess teachers.266 The mismanaged budget allocation which favored excessive teacher posts over other necessary budget items, resulted in only 10% of the province’s education budget being left available for infrastructure backlogs, maintenance and textbooks.267 When the province was placed under national administration in December 2011, vacant and excess teacher posts were frozen, all financial operations were scrutinised and the R565 million contract that the LDoE had with Edusolutions to purchase and deliver textbooks was suspended, resulting in textbook orders not being placed by the start of the 2012 school year.268 By the time that an administrator was able to negotiate prices and organise delivery of some 4 million textbooks, the school year was already well underway.
Dr. Chisholm also noted the context of the provincial systemic failures as further contributing to the unavailability of textbooks. An examination of Limpopo’s finances by treasury found that there was no evidence of internal controls over record keeping and budget management, allowing fraud and abuse of public resources to easily occur. Second, Dr. Chisholm points to political circumstances surrounding former ANC Youth League leader Julius Malema’s removal as provoking opportunistic efforts to block national initiatives to combat corruption in the province. Third, the Section 100(1)(b) intervention provided for provincial officials to remain in place to execute day-to-day operations under national oversight and direction. As highlighted in the Metcalfe report, a lack of clarity over authority and a lack of regulatory framework to direct the terms of operations following the intervention lengthened the period of time it took the DBE to respond to the textbook shortage that national administrators knew would occur269.
265 See South Africa. 2012. Report of the Presidential Task Team established to investigate the non-delivery and/or delays in the Delivery of Learner, Teacher Support Material (LTSM) in Limpopo Schools. Pretoria. Available at http://www.thepresidency.gov.za/pebble.asp?relid=6942.
266 Chisholm, Linda. 2013. ‘Understanding the Limpopo textbook Saga.’ HSRC. Available at http://www.hsrc.ac.za/en/review/hsrc-review-september-2013/understanding-the-limpopo-textbook-saga
267 The Norms and Standards for School funding recommends that provinces spend 80% of their education budgets on personnel costs and 20% on non-personnel costs.
268 Chisholm, Linda. 2013. ‘Understanding the Limpopo textbook Saga.’ HSRC.269 Despite calls for the implementation of legislation governing Section 100(1)(b) interventions by the Metcalf report as well as by the October
2012 subsequent Report of the Presidential Task Team established to investigate the non-delivery and/or delays in the Delivery of Learner, Teacher Support Material (LTSM) in Limpopo Schools, there continues to be no national legislation regulating national interventions in provinces.
The court further highlighted the DBE’s failure to act swiftly in providing textbooks to
affected learners...

80 Realising the Right to a Basic Education in South Africa
Fourth, this lack of clarity over government operations occurred at a time when the new CAPS curriculum was being implemented for four grades, requiring the need for new textbooks to be produced quickly. To further complicate the matter, these events also occurred during a time when new initiatives to reduce the price of textbooks impacted the market’s ability to respond. These changes in market conditions included the DBE’s policy to develop a national catalogue for textbooks, which among other things, excluded some publishers through limiting the number of approved textbooks to eight textbooks per subject and centralising the procurement of textbooks at a reduced price. Finally, Dr. Chisholm attributed much of the attention and response to the textbook saga to educational social movements, such as Equal Education, and the network of legal groups, including Section 27 which was able to highlight the importance of access to and availability of textbooks through this litigation.
Despite this and other subsequent litigation, textbook non-delivery and late delivery continues to plague learners and teachers in Limpopo province. At the start of the 2014 academic year, 800,000 books had yet to be delivered to Limpopo schools due to the province’s stated lack of funds and the failure of principals to follow prescribed procedures to report textbook shortages.270
The provision of workbooks to learners and teachersTo supplement textbooks in the new CAPS curriculum, the DBE has implemented a new policy of supplying two workbooks for each subject to all learners in grades R through 9. The DBE provides workbooks directly to schools through contracted service providers, thus by-passing provincial systems. Workbooks are described as easy-to-follow worksheets that enable learners to practice language and numeracy skills they have been taught in class. The workbooks are also helpful to teachers in a number of ways. They help save teachers time by eliminating the need for teachers to develop their own problems and reduce the need for teachers to write problem sets on blackboards for learners to copy. Workbooks also assist teachers with tracking the progress of learners so learners in need of additional support may be identified. Workbooks further support teachers with time management by assisting them in structuring activities and curriculum content that should be taught each week.271 NEEDU’s investigation into the State of Literacy Teaching and Learning in the Foundation Phase found that despite some critiques by teachers regarding how the workbooks could be improved in the future, “overall, it is abundantly clear that the DBE workbooks are being well received in schools.”272
While the expectation is that workbooks will prove to be useful when properly utlilised by teachers in classrooms, the timely delivery of workbooks to schools has been a concern in schools in some provinces. The Public Protector investigated workbook provisioning in the Eastern Cape in 2013 following reports of extensive workbook shortages in that province midway through the school year. Following its investigation, the Public Protector found that the DBE had failed to provide adequate numbers of workbooks to schools during the 2012 and 2013 school years as 69% of delivered books were in the wrong language, 75% of delivered books were in short supply, 8% of delivered books were over-supplied, the majority of books were delivered late into the school year and deliveries of books prior to the 2013 school year were found to be in the incorrect language and wrongly supplied in short supply to certain schools.273 The report further identified a number systems failures in terms of inadequate monitoring the workbook ordering process by the DBE and ineffective coordination amongst national and provincial education departments and schools. Accordingly, the report emphasised that the national DBE’s failure to set uniform norms and standards in terms of Section 5A of SASA as well as the national policy and regulatory framework for the provision of workbooks constituted maladministration. The Public Protector further admonished the DBE for failing to audit the supplied workbooks even after complaints had been made public as well as the DBE’s failure to act with urgency and diligence to resolve the situation. Finally the Public Protector found that the DBE’s failures in this regard resulted in violations to the affected learners’ rights to education and equality due to their “exposure to an inferior education in relation to their counterparts
270 See DBE’s answering affidavit, Basic Education for All and Others v. Minister of Basic Education and Others, 2014 (4) SA 274 (GP)271 DBE summary of workbook programme, available at http://www.education.gov.za/Curriculum/Workbooks/tabid/574/Default.aspx272 NEEDU. 2013. National Report 2012: The State of Literacy Teaching and Learning in the Foundation Phase. Pretoria: National Education
Evaluation and Development Unit. p 45.273 Public Protector. 2013. ‘Learning Without Books: Report on an Investigation into alleged shortages and incorrect supply of school workbooks
by the National Department of Basic Education and Eastern Cape Schools.’ Report No. 19 of 2013/14. Available at http://www.pprotect.org/library/investigation_report/SKMBT_C36413120515560.pdf.
(Footnotes)
2
3
4
5
6
7
8
9
10
11
Despite this and other subsequent litigation, textbook non-delivery
and late delivery continues to plague
learners and teachers in Limpopo province.

81 STATE LEGISLATION, REGULATIONS AND POLICIES PROVIDING FOR THE REALISATION OF THE RIGHT TO A BASIC EDUCATION
elsewhere and possible adverse consequences on their future prospects in the education system, work and society.”274
The Provision of libraries and library resources to learners in schoolsIn addition to textbooks and workbooks, it is critical that national and provincial education departments and schools ensure that learners have access to reading and library materials at schools. The DBE’s Action Plan to 2014 further emphasised the heightened importance of making books available particularly to learners from poor and impoverished communities where such materials are not readily available at home.275 NEEDU has identified that reading materials are often lacking in schools and that the failure to provide learners with access to books significantly impairs learners’ ability to learn to read and write, a systemic failure which has been consistently identified in South Africa’s poor performance on international testing. NEEDU emphasised this point in its 2012 National Report on the State of Literacy, Teaching and Learning in the Foundation Phase in stating that:
“Many schools are grossly under resourced with respect to reading materials, and much of the responsibility for improving this situation must lie with the provinces, where the budgets for LTSM do not provide for supplying schools at the required level. However, putting up with having only four or five distinct titles available for learners in each class of the FP to read over a full year, speaks to the lack of understanding among school leaders and teachers of both what it means to be literate, and the specifications of the official curriculum. Where principals and teachers understand the LTSM requirements for their subject they make a plan to acquire or create the appropriate reading material. Without wanting to blame the victims or relieve provincial departments of this responsibility, schools could be far more proactive in procuring and deploying reading resources.276
This observation is telling in a number of ways, as it not only exposes the lack of resources that are needed for quality teaching and learning to take place but also highlights the lack of effective pedagogical practices and teacher knowledge that needs to be addressed through improved training of teachers and principals. This NEEDU finding further demonstrates the need for there to be improved coordination amongst national, provincial and district offices and schools in terms of the resources that schools need to acquire and how schools should proceed in terms of identifying and obtaining resources such as reading books.
The DBE has acknowledged the need for improved access to libraries and library resources at schools in its Annual Performance Plan for 2015 – 2016, particularly in Limpopo and the Eastern Cape. Currently the vast majority of South African public schools operate without libraries. According to the most recent 2015 NEIMS data reports, 71,01% of schools in South Africa are without libraries and only 17,00% of public schools operate with stocked libraries. Moreover, only 2,82% of schools in Limpopo and 4,61% of schools in the Eastern Cape have stocked libraries. The DBE emphasised in its Annual Performance Plan that the lack of access to libraries is particularly concerning given the poor literacy outcomes of South African learners. The 2011 Progress in International Reading Literacy Study (PIRLS) concluded that Grade 4 learners, particularly those tested in African languages, achieved well below the benchmarked levels.277
In 2012, the DBE enacted Guidelines for School Library and Information Services. This policy aims to advance the DBE’s vision that all schools have well-resourced and functioning school library and information services capable of providing learners and teachers with access to a wide range of curricular support resources which are able to expose learners to diverse ideas, experiences and opinions. The DBE further envisages these resources contributing towards ensuring that all learners and teachers are information literate and independent lifelong learners and readers.278 The policy primarily provides direction to provincial education departments, district offices and schools with respect to library physical infrastructure, staffing and training roles and responsibilities, as well as school library collection development including per-learner library
274 Ibid, at p 9.275 DBE. 2011. Action Plan to 2014 – Towards the Realisation of Schooling 2024.’ Pretoria: DBE. p 129.276 NEEDU. 2013. National Report 2012: The State of Literacy Teaching and Learning in the Foundation Phase. Pretoria: National Education
Evaluation and Development Unit. p 43.277 DBE, Annual Performance Plan 2015 – 2016, p 36.278 DBE. 2012 National Guidelines for School Library and Information Services. Pretoria: DBE. p. 3. Available at http://www.education.gov.za/
LinkClick.aspx?fileticket=v7iZZGOK49E%3D&tabid=93&mid=2598.
The DBE has acknowledged the need for improved
access to libraries and library resources at
schools in its Annual Performance Plan for 2015 – 2016,
particularly in Limpopo and the Eastern Cape.

82 Realising the Right to a Basic Education in South Africa
material ratios. However, it offers only general guidelines advising what schools should be able to provide their learners and like many other DBE policies, lacks the force of regulations. Accordingly, the library guidelines contain no benchmarks laying out what facilities and library materials must be made available to learners over time and contains no budget directives to provinces, districts and schools advising how much should be spent on library materials and how the procurement process should operate. The policy instead offers vague directions, such as “schools can be provided centrally with processed (shelf-ready) library and information resources by their Provincial or District Library and Information Services, or they may be required to do their own procurement using Norms and Standards Funding for Schools.”279 Given the importance that the DBE places on access to books to support curriculum and reading, the policy would be far better served to operate as binding regulations that sets timeframes for delivery and norms dictating minimum library materials that must be available to learners and teachers. The draft National Policy for the Provision and Management of Learning and Teaching Support Materials partially addresses this lack of direction with respect to the provision of library materials, by mandating provinces to direct 30% of Norms and Standards LTSM funds to the procurement of library resources. While this direction is helpful for provincial and school budgeting purposes, it fails to inform learners, schools and communities what library resources must be available and is vulnerable to dilution due to overspending in other areas that could be viewed as immediately pressing, such as school maintenance, stationary and other needs.
The provision of Textbooks for Learners with DisabilitiesConcern has also been raised with respect to the availability of LTSM for learners with disabilities, particularly for blind and partially-sighted learners. The South African Human Rights Commission stressed in its 2013 report on the Delivery of Primary Learning Materials that significant challenges prevent blind and partially-sighted learners from being able to access primary learning materials, that no coherent plan outlining the process for converting learning materials to braille was in effect and that it was difficult to obtain materials in a format that could be converted to braille.280 The SAHRC attributed these shortcomings to a lack of data reporting the needs of disabled learners along with a lack of sensitisation by educators and national government officials responsible for identifying and responding to needs of disabled learners, especially in rural and impoverished areas, and a lack of co-ordination in government as to how these shortcomings should be addressed. The SAHRC therefore emphasised the need for enhanced guidance by the DBE to PEDs with respect to how textbook provisioning for disabled learners should take place. The NGO Section 27 reported in 2015 that 17 out of 22 special needs schools for visually impaired learners have no textbooks and that out of a total of 600 textbooks that should make up the new CAPS curriculum, only about 150 of these books have been adapted for braille.281 The DBE is therefore urged to promptly develop guidance and establish avenues for textbook procurement for disabled learners.
ConclusionThe workbook and textbook failures illustrate the systemic shortcomings in education service delivery in provinces that suffer from poor provincial, district and school-level management, oversight and coordination. In both of these instances, the DBE failed to fulfil its mandates as the body ultimately responsible for implementing effective policies detailing procurement and delivery practices capable of ensuring that learners are able to access the learning materials necessary for the effective realisation of the right to a basic education. These cases show that the DBE and other national government bodies have failed to develop much needed norms and standards and other requisite legislation (such as the legislation identified as necessary for successful Section 100(1)(b) interventions to take place) necessary to ensure that learners and their schools have access to critical teaching materials. These cases have also illustrated the DBE’s failure to act urgently to resolve these delivery failures even after they have been identified. This failure to act with deliberate speed is particularly harmful in these instances since the learners most affected by these negligent and/or illicit practices come from poor, disadvantaged and disempowered communities. In a system that is already plagued by such
279 Ibid, at p. 27.280 South African Human Rights Commission. 2013. ‘Report: Delivery of Primary Learning Materials to Schools.’ p 46.281 Hodgson, F., Khumalo, S. ‘Blind Schooling in Shocking State.’ Mail & Guardian. 12 June 2015. Available at http://mg.co.za/article/2015-06-11-
blind-schooling-in-shocking-state.
Concern has also been raised with respect to the availability of
LTSM for learners with disabilities ...

83 STATE LEGISLATION, REGULATIONS AND POLICIES PROVIDING FOR THE REALISATION OF THE RIGHT TO A BASIC EDUCATION
vast inequalities in virtually all aspects of education service delivery, household educational background and socio-economic opportunity, these affected learners cannot afford to fall even further behind their more privileged counterparts due to their dependence on government to fulfil its mandate.
RECOMMENDATIONS:1. The Minister of Basic Education should promulgate regulations governing the
procurement and provisioning processes for textbooks as outlined in Section 5A of SASA. Regulations should also be promulgated governing the provision of library materials to schools and their learners.
2. The DBE should oversee and monitor provincial textbook budgeting and procurement policies and practices to ensure that procurement and delivery systems, as well as provincial budgeting allocations and expenditure, will result in textbooks being delivered to schools on time prior the start of each school year. If provinces outsource the procurement processes, data capturing of school textbook needs should remain with the state.
3. The DBE should enact regulations governing communications channels between provinces, district offices and schools to ensure that databases are able to accurately track important school statistics, including each school’s textbook needs and language profiles. Principals and district officials should be held accountable for ensuring that information tracked in these systems are accurate and up-to-date.
4. The DBE and Treasury should consider providing provinces with conditional grants for learning and teaching support materials to ensure that adequate funds are available to procure and deliver textbooks and other reading materials to schools and their learners.
Examination and graduation requirements used to oversee and assess learner achievement and quality in the basic education systemThe Department of Basic Education administers two types of examinations to learners each year. The National Senior Certificate Examination (NSC or Matric exam) is administered by government to Grade 12 learners at the end of each school year. Beginning in 2011, the DBE has also administered Annual National Assessment examinations (ANAs) to learners in grades 1 through 6 and grade 9.
National Senior Certificate Examination (NSC)The NSC has been administered to grade 12 learners since 2008, marking the first year that all learners attending ordinary public schools in South Africa were on the same curriculum. During apartheid, each of the nineteen racially and provincially defined education departments administered their own secondary school graduation examinations. Beginning in 1997, the national Department of Education oversaw the Senior Certificate curriculum. Under the policy in effect at that time, the DoE differentiated each subject into higher, standard and lower grades. That system placed learners on different curriculum tracks and created a large number of tiered subjects that needed to be examined. Beginning in 1996, each of the nine Provincial Education Departments administered and marked their own senior examinations. In 2000, the DoE implemented national examination question papers for five key subjects, an initiative designed to set a common national standard. The 2002 promulgation of the General and Further Education and Training Quality Assurance Act (Act No. 86 of 2001) established and empowered Umalusi to ensure quality in the examination process.
In 2002, a Ministerial Committee was established to investigate the tiered curriculum and examination system. The Committee, among other things, concluded that the tiered Senior Certificate system operated at a provincial level at that time differed widely in quality, inhibited learner mobility and was too cumbersome, complex and unreliable and was further
The NSC has been administered to grade
12 learners since 2008, marking the first
year that all learners attending ordinary
public schools in South Africa were on the same curriculum.

84 Realising the Right to a Basic Education in South Africa
complicated by additional Higher Education entrance requirements. Another significant finding made by the 2002 Ministerial Committee was that English and Afrikaans languages were subjected to different teaching and examination standards than African languages. The Committee found that the focus of African languages as First Language was language maintenance and development whereas English and Afrikaans languages focused primarily on learner cognitive development. These critical shortcomings identified in the Ministerial Committee’s report led to the implementation of the NSC, which was first gazetted in 2005 and then implemented in 2008. The NSC introduced three new features into the Secondary School graduation examination process. Firstly, the NSC called for a greater specification of subjects, requiring all learners to take languages, Mathematics or Mathematics Literacy and Life Orientation. Secondly, the NSC abandoned the distinction between higher, standard and lower graded system, placing all learners on the same track. Finally, the subjects were significantly revised with some being renamed and others being removed.282
In order to attain a National Senior Certificate, a qualifying learner must complete grades 10, 11 and 12 with passes in at least seven subjects. Candidates must pass two official languages, one of which must be home language level, mathematics or mathematics literacy, life orientation and at least three other NSC approved subjects. Qualified learners must also pass the National Senior Certificate examination, which also serves as the gateway to further study at higher education institutions.
� In order to pass the National Senior Certificate examination, candidates must achieve a 40% or greater in at least three subjects, one of which must be an official language at home language level, achieve 30% or greater in three additional subjects and provide full evidence in the School Based Assessment component in the subjects not achieved.
� Higher Certificate qualifications require candidates to achieve a National Senior Certificate with minimum of 30% in the language of learning and teaching of the higher education institution.
� Diploma Degree qualifications require candidates to achieve a National Senior Certificate with minimum of 30% in the language of learning and teaching of the higher education institution and must achieve at least a 40% to 49% in at least four recognised NSC 20-credit subjects.283
� Bachelor Degree level qualifications require candidates to achieve a National Senior Certificate with minimum of 30% in the language of learning and teaching of the higher education institution and must achieve at least a 50% to 59% in at least four recognised NSC 20-credit subjects.
In 2014, the DBE published the Report of the Ministerial Committee to Investigate the Current Promotion Requirements and Other Related Matters that Impact on the Standard of the National Senior Certificate. That report identified a number of public and professional concerns about the standard and quality of the NSC as a qualification and recommended a number changes to system. These recommended changes included (1) raising the overall minimum pass requirements; (2) improving the credibility of the School Based Assessment process; (3) adding a general qualification for a vocational pathway; (4) requiring all schools to offer mathematics as a subject and be adequately resourced to do so; (5) raising the requirements for the selection of NSC markers to ensure that they are selected on merit and provided with on-site training; (6) removing life orientation as an NSC promotion requirement and introducing it at Grade 11 instead; (7) strengthening the development and administration of the examination process; and (8) investigating how to assess learners who take the examination in African language as a Home Language level, as well as how to improve NSC pass results for candidates who take the examination in African Home Language.284
282 Ministerial Committee on the National Senior Certificate. 2014. Report of the Ministerial Committee to Investigate the Current Promotion Requirements and Other Related Matters that Impact on the Standard of the National Senior Certificate. Pretoria. DBE. p 27 – 31. Available at http://www.education.gov.za/LinkClick.aspx?fileticket=VIFw9JGiNNo%3d&tabid=358&mid=1301
283 The designated subjects list includes Accounting, Agricultural Sciences, Business Studies, Consumer Studies, Dramatic Arts, Economics, Engineering, Graphics and Design, Geography, History, Information Technology, Languages, Life Sciences, Mathematics, Mathematics Literacy, Music, Physical Sciences, Religion studies and Visual Arts.
284 Ministerial Committee on the National Senior Certificate. 2014. Report of the Ministerial Committee to Investigate the Current Promotion Requirements and Other Related Matters that Impact on the Standard of the National Senior Certificate. Pretoria: DBE. Available at: http://www.education.gov.za/DocumentsLibrary/Reports/tabid/358/Default.aspx
In order to attain a National Senior
Certificate, a qualifying learner must complete grades 10, 11 and 12 with passes in at least
seven subjects.

85 STATE LEGISLATION, REGULATIONS AND POLICIES PROVIDING FOR THE REALISATION OF THE RIGHT TO A BASIC EDUCATION
Annual National Assessments (ANAs)In 2011, the DBE began implementing Annual National Assessment examinations, a testing programme which requires all schools in the country to conduct the same grade-specific language and mathematics tests to learners in Grades 1 to 6 and for Grade 9. The ANAs were first administered to learners in grades 1 through 6 in 2011 and then expanded to include grade 9 learners in 2013. In 2014, the ANAs were administered to 7,376,334 learners in 24,454 schools. In 2015, the administration of the ANAs are due to be expanded to include learners enrolled in Grades 7 and 8.
The DBE has cited the following purposes behind the ANAs:
� The ANAs expose teachers to best practice assessments, which the DBE sees as particularly beneficial in assisting teachers in developing their own assessments at critical points of the year.
� The ANAs help to identify schools that require targeted interventions, as information from ANA results should be used to direct teachers towards particular teacher development programmes most strongly suited towards their needs and to assist district offices with engaging with school principals on identified problem areas in schools and how they can best be addressed. Data collected from ANAs can also enable provinces, education districts and individual schools to understand how their schools compare to other similarly situated schools.
� The ANAs give schools the opportunity to pride themselves in their own improvement.
� The ANAs provide parents with information concerning their child’s education.
Of further significance is that the ANAs enable the DBE and provinces to monitor the progress that schools are making towards the targets set for the system and hold schools accountable for their learners’ results. Prior to the administration of these examinations, learners were not subjected to annual testing at a national scale until they took the exit examination at the end of grade 12, a shortfall that resulted in primary schools in particular not being sufficiently monitored and held accountable for their ability to teach their learners at a level capable of enabling them to succeed at the secondary level.
While the implementation of the ANAs are an important step in terms of advancing monitoring, oversight and support of primary schools and their principals and teachers, they have been shown to suffer from critical weaknesses. Firstly, the marking process whereby schools are responsible for marking their leaners’ ANA exams themselves has been shown to be flawed and has caused the DBE to question the validity of some of the results submitted to them.285 Secondly, The ANAs have also been criticised for not having been benchmarked in a manner that makes them comparable across grades so learners can be tracked from one year to the next, and overall improvement can be tracked across years so that trends in performance may be monitored over time. The NEEDU report on rural schools advised that “it is important for maintaining credibility that the verification ANA be commissioned to an outside agency in its entirety, and that the most rigorous psychometric principles be applied in ensuring comparability from one year to the next.”’286 In 2014, the DBE implemented a verification process whereby Grade 3, 6 and 9 participants at a sample of schools wrote the examinations while being monitored by independent agents who then directly collected and marked, analysed and reported the results to confirm the reliability of examination results across all schools. Given the political pressure placed on national and provincial governments, as well incentives placed on schools and teachers to show improved results, it is important that the ANAs be implemented and administered in a manner that is trustworthy, reliable and capable of delivering accurate assessments which clearly show areas where progress has and has not been made over time so that effective interventions may be developed and implemented where needed.
Additionally, the ANA system has been criticised for how the examination results have been used in schools. While provinces and districts have implemented policies to develop ANA improvement plans that identify key findings or weaknesses of learners and provide remedial advice to teachers, schools have been slow to adopt these measures287. NEEDU’s 2013 report
285 DBE. 2011. Action Plan 2011 – 2014 – Towards the Realisation of Schooling. p 62.286 NEEDU. 2013. National Report 2013: Teaching and Learning in Rural Primary Schools. Pretoria: The National Education Evaluation and
Development Unit. p 57.287 Ibid, at 32. The NEEDU report describes how all provinces have developed provincial policy frameworks governing improvement strategies
based on ANA assessments.
While the implementation
of the ANAs are an important step in
terms of advancing monitoring, oversight
and support of primary schools and their
principals and teachers, they have been
shown to suffer from critical weaknesses.

86 Realising the Right to a Basic Education in South Africa
on teaching and learning in rural primary schools highlighted the need for schools to develop their capacity to assess their ANA results and use them to improve their teaching practices. The NEEDU report found that “in only 5% of the monograde and 3% of the multigrade schools visited did NEEDU evaluators find evidence that school leaders and teachers were using the scores to guide teaching, disaggregating the scores by item to illuminate progress with specific curriculum topics.”288 That report concluded that “[i]t is obvious that teachers and school leaders need more specific guidance on how to capture and analyse the ANA scores, and how to use the results productively in their classrooms.”289
Other criticism has been levied over whether the ANAs should be administered on an annual basis or every few years. SADTU, which has threatened to block the 2015 administration of the ANAs over what it has declared to be an unfair system that is used to inappropriately label teachers and schools as underperforming, has called for the test to be administered every three years so interventions which are based on the results have time to be designed and implemented prior to the next round of testing. SADTU’s chief complaint is that the testing schedule, which calls for ANAs to be administered in September and results to be published in December, does not give teachers an opportunity to be trained prior to the start of the next school year.290 SADTU contends that this schedule does not provide teachers with the opportunity to be trained in time for any interventions to take effect prior to the next round of examinations which in turn causes teachers and their schools to be labeled as underperforming without their first having the opportunity to implement measures that would improve learner results.
It is vital that the DBE address these shortfalls in the ANA system which severely impacts the effectiveness of the examination both in terms of its ability to deliver effective and accurate oversite of learner and school achievement, as well as assist in identifying areas where support to schools, teachers and learners are needed. Given the high stakes attached to ANA outcomes, such as their being used to identify and label underperforming schools, the examination process inevitably carries the risk that teachers will compromise curriculum delivery in order to teach to the test. These high stakes also run the risk of ANA results being used for inappropriate ends, such as to show immediate improvements in education outcomes in order to satisfy public demands regardless of whether significant advancements have actually been made in terms of learner knowledge and skills. The labour dispute over the administration of the ANAs sheds further light on the complications that the implementation of a diagnostic testing system carries in terms of satisfying the often conflicting needs of monitoring and understanding the status of teaching and learning in schools, tailoring support interventions based on demonstrated needs of teachers and learners and holding underperforming schools accountable in a manner that is acceptable to labour interests.
RECOMMENDATIONS:1. Psychometric principles should be applied when developing Annual National
Assessments to ensure that their results are comparable over time.
2. Education districts and schools should be coached on how to effectively utilise the results of the ANAs to identify areas where improvements are needed so that effective remedial responses may be identified, developed and implemented. The tests should also be designed in a way that effectively assesses learners’ academic skills and knowledge and not just whether they have demonstrated achievement in their current grade levels since most learners in South Africa are performing below their current grade levels.
3. ANA Results should be effectively presented to different stakeholders, including parents, district officials, school principals, teachers and providers of in-service teacher training programmes.
4. The DBE should investigate other means of certifying achievement for youth who exit the education system prior to reaching and passing matric.
288 Ibid.289 Ibid.290 See eg Nicolson, G. ‘Annual National Assessments: A challenging test.’ Daily Maverick. 29 September 2015. Available at: http://www.
dailymaverick.co.za/article/2015-09-23-annual-national-assessments-a-challenging-test/#.VgpPphOqqko
Other criticism has been levied over
whether the ANAs should be administered
on an annual basis or every few years.

87 STATE LEGISLATION, REGULATIONS AND POLICIES PROVIDING FOR THE REALISATION OF THE RIGHT TO A BASIC EDUCATION
3.18. CONCLUSIONThe Constitutional right to a basic education plays a central role in the transformation of South Africa from a country marred by a past of racially-engrained inequality to one that strives to fulfil the Constitutional principles of democracy, human dignity, equality and freedom. Basic education is a fundamental socio-economic right. It provides the essential foundation for a lifetime of learning and economic opportunity and is necessary for children to develop their personalities and talents. Education is also societal good which must be exercised for a democratic, free, equal, just and peaceful society to prosper in South Africa. Widely viewed as an empowerment right, basic education is necessary for the realisation of other socio-economic rights, as well as for the functioning of the democratic system of governance as a whole. The right to education, especially primary education, is recognised and further defined in a number of binding international instruments.
While great emphasis has been placed on the immediately realisable nature of the right to a basic education, as it is one of the few socio-economic rights not subject to progressive realization in the Constitution, the lasting effects of the segregated and unequal education system of apartheid have endured in many of South Africa’s schools attended by millions of learners.
The legislative, regulatory and policy framework developed since 1994 to guide and govern South Africa’s post-apartheid education system has in many ways provided much needed content to the right to a basic education. This policy framework, which from its inception has favored decentralisation and awarded large amounts of autonomy to school management, teachers and local school communities, speaks to many of the core components necessary for learning and teaching to take place. The wide range of legislation, regulations and policies provide for schools to be staffed with qualified teachers, managed by school principals, and governed by school governing bodies comprised primarily of parents from the school’s community and funded at minimum levels. Language policies provide for learners to access instruction in their home languages and then transition to a second language, usually English, at grade 4. Policies provide for the provisioning of textbooks, workbooks and other learning materials to learners. And the recently enacted Minimum Uniform Norms and Standards for School Infrastructure seeks to ensure that all schools meet minimum standards by certain benchmarked years. The expansion of no-fee schools has enabled all learners in quintile 1 to 3 schools to attend schools for free and fee-waiver policies have been designed to ensure that learners from households without adequate means are able to attend schools that do charge school fees for free without being discriminated against due to their socio-economic circumstances. The expansion of Grade R programmes has resulted in greatly improved enrolment for pre-primary school learners, a policy which seeks to address the need for improved early childhood development education amongst concerns that many learners are not prepared for primary school upon entering grade 1. Each school day the National School Nutrition Programme provides over 9 million learners with state-subsidised nutritious meals at school. The implementation of the new CAPS curriculum offers far greater direction to teachers in terms of curriculum content to be taught in classrooms, how to teach it and how to allocate teaching time to ensure adequate curriculum coverage throughout the year. Finally, the implementation of Annual National Assessments for learners in Grades 1 to 6 and Grade 9 mark an important development in terms of advancing the need for transparency, support and accountability in schools, as ANAs are able to help identify areas where intervention is needed in schools and classrooms and keep stakeholders, including national and provincial governments, district offices and school communities informed of both learner and school achievement.
While these policy developments have been largely successful in ensuring and expanding access to schools, South Africa’s public education system continues to suffer from high degrees of inequality and dysfunctionality and low levels of quality. Systemic failures that enable the perpetuation of these impairments must be addressed if all learners are to fully realise their right to a basic education.
In many ways the decentralised education system has failed to address the complex landscape of differing roles, responsibilities, interests, needs and capacity constraints of national and provincial education departments and officials, education district offices, school governing bodies, teachers and school administrators, learner communities and organised labour. The
While these policy developments have
been largely successful in ensuring and
expanding access to schools, South Africa’s
public education system continues to suffer from high
degrees of inequality and dysfunctionality
and low levels of quality.

88 Realising the Right to a Basic Education in South Africa
lack of accountability in the system and appointments to key managerial and promotional posts based on patronage rather than merit have contributed to high levels of dysfunctionality within schools and poor curriculum coverage in classrooms. Teacher training programmes have failed to resolve the teacher competency backlogs that have been carried over from apartheid, as exhibited by poor teacher subject knowledge, teaching skills and curriculum coverage. Furthermore, a lack of regular and adequate monitoring of teachers in classrooms has enabled poor teaching practices to dominate in many classrooms without deficiencies being properly identified and addressed. While district offices are intended to monitor and support school management and teachers, enhanced capacity is needed, both in the form of skilled officials capable of providing the requisite monitoring and support of schools, and physical capital necessary to ensure that regular communication and co-ordination, school visits and tracking and management of school and district-level data occur. Similarly, while textbook, workbook and library policies seek to ensure that learners have access to critical learning materials, systemic failures such as misallocation of financial resources, ineffective communications and co-ordination systems, poor planning and record-keeping practices, suspect tendering practices and lack of reliable monitoring systems impair the ability of learners to timely access these critical resources. School infrastructure backlogs continue to be severe, particularly in rural and township schools where learners are often forced to attend schools in unsafe and overcrowded conditions that are not conducive to teaching and learning and lack critical infrastructural resources such as libraries, sufficient classroom space and science and computer laboratories, as well as adequate ablution facilities, which particularly prejudice menstruating girl learners. There are also concerns that even with the new school infrastructure standards in place, provinces lack the capacity to build new schools and improve existing schools that comply with the regulations, particularly in provinces where infrastructural backlogs are most severe.
The court cases reviewed in this chapter raise a number of challenges and shortcomings that are endemic in the education system. The teacher post-provisioning cases brought by the Legal Resources Centre concerning widespread teacher post vacancies in the Eastern Cape identifies the need to ensure greater efficiency and oversight in the provisioning of teacher posts and provincial budgeting allocations amongst personnel and non-personnel expenditures. Those cases also identify the dangers implicit in prioritising the demands of organised labour over the needs of learners and schools. Section 27’s case concerning the non-delivery of textbooks in Limpopo reveals the extent to which weak systems are capable of buckling when budgets are not allocated and spent effectively and weak communications, management and monitoring systems exist. Finally, Equal Education’s case for norms and standards for school infrastructure identifies the need for greater guidance and oversight in the planning and delivery of physical resources to occur at the national level.
A common theme amongst many of these systemic challenges faced by South Africa’s basic education system has been the failure of the National government to implement norms and standards that clearly guide provinces in terms of the provision of core quality educational resources that must be made available to all learners. Clear norms and standards are also needed to ensure that provincial management systems and staffing allocation and qualification requirements are adequately in place. Finally, binding standards would help ensure effective and efficient provincial government planning, budgeting and expenditure and would serve as a mechanism for national government and other stakeholders to monitor performance and hold provinces accountable for fulfilling their mandates and efficiently using their resources.
A central component of assessing the progress that South Africa has made in education is the extent to which it has enhanced equality in the system. While many of the policies considered in this paper have ensured greater access to schools, the levels of adequacy and quality of those schools continues to remain unequal along socio-economic and to a large degree racial lines. Wealthier learners, through the implementation of school fees, the inheritance of superior resources from apartheid and more effective school management, governance and teaching practices, have continued to be able to access superior public schools that offer high quality levels of education. Poorer learners on the other hand, which comprise the vast majority of South Africa’s learners, continue to attend schools that are heavily impacted by the systemic and capacity constraints described above, which seriously impact on the quality of teaching and learning in the classroom.
The court cases reviewed in this
chapter raise a number of challenges and shortcomings that are endemic in the education system.
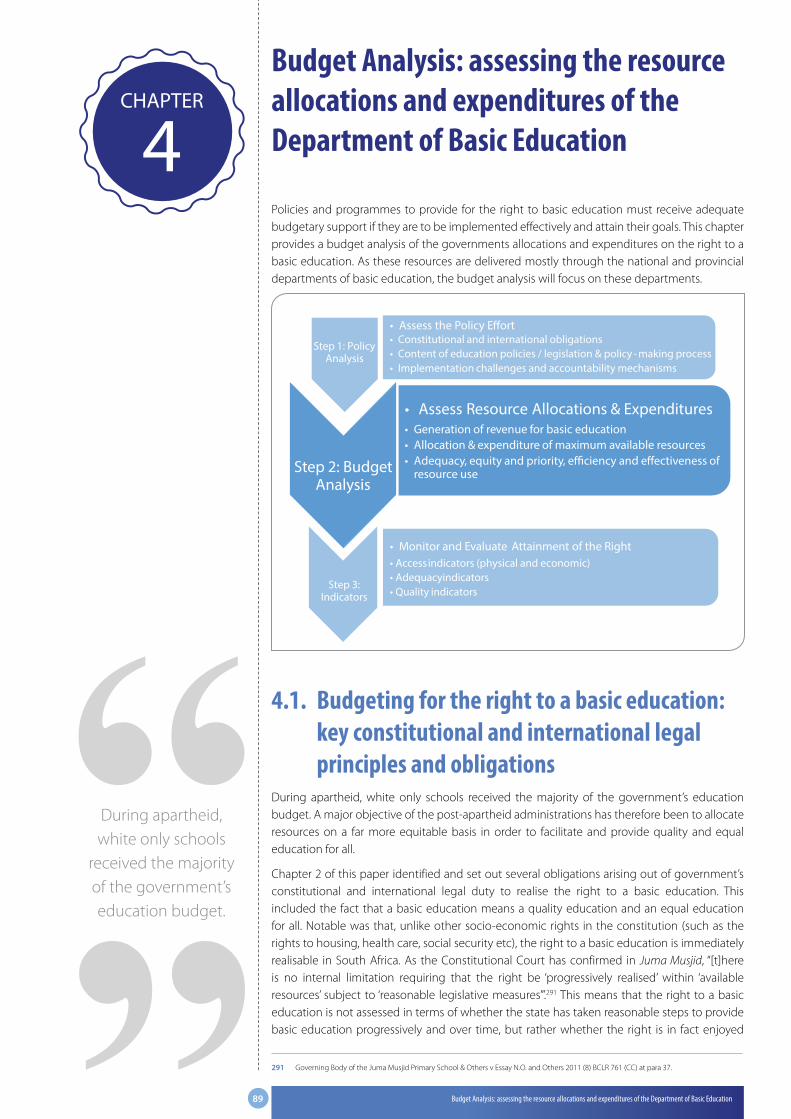
89 Budget Analysis: assessing the resource allocations and expenditures of the Department of Basic Education
Budget Analysis: assessing the resource allocations and expenditures of the Department of Basic Education
Policies and programmes to provide for the right to basic education must receive adequate budgetary support if they are to be implemented effectively and attain their goals. This chapter provides a budget analysis of the governments allocations and expenditures on the right to a basic education. As these resources are delivered mostly through the national and provincial departments of basic education, the budget analysis will focus on these departments.
Step 1: Policy Analysis
• Assess the Policy E�ort• Constitutional and international obligations• Content of education policies / legislation & policy - making process• Implementation challenges and accountability mechanisms
Step 2: Budget Analysis
• Assess Resource Allocations & Expenditures• Generation of revenue for basic education• Allocation & expenditure of maximum available resources• Adequacy, equity and priority, e�ciency and e�ectiveness of
resource use
3:
• Monitor and Evaluate Attainment of the Right• Accessindicators (physical and economic) • Adequacyindicators• Quality indicators
Step 3: Indicators
4.1. Budgeting for the right to a basic education: key constitutional and international legal principles and obligations
During apartheid, white only schools received the majority of the government’s education budget. A major objective of the post-apartheid administrations has therefore been to allocate resources on a far more equitable basis in order to facilitate and provide quality and equal education for all.
Chapter 2 of this paper identified and set out several obligations arising out of government’s constitutional and international legal duty to realise the right to a basic education. This included the fact that a basic education means a quality education and an equal education for all. Notable was that, unlike other socio-economic rights in the constitution (such as the rights to housing, health care, social security etc), the right to a basic education is immediately realisable in South Africa. As the Constitutional Court has confirmed in Juma Musjid, “[t]here is no internal limitation requiring that the right be ‘progressively realised’ within ‘available resources’ subject to ‘reasonable legislative measures’”.291 This means that the right to a basic education is not assessed in terms of whether the state has taken reasonable steps to provide basic education progressively and over time, but rather whether the right is in fact enjoyed
291 Governing Body of the Juma Musjid Primary School & Others v Essay N.O. and Others 2011 (8) BCLR 761 (CC) at para 37.
CHAPTER
4
During apartheid, white only schools
received the majority of the government’s education budget.

90 Realising the Right to a Basic Education in South Africa
by all. This has important implications for, among other things, how government uses its budget to facilitate the realisation of this right. This important point must be considered together with the principles established by international,292 regional,293 and South African law294 and jurisprudence295, which government must adhere to in its financing of access to socio-economic rights, including quality basic education. These principles may be summarised as adequacy, equity and priority, efficiency, and effectiveness:
1. Adequate resources must be raised, allocated and spent to finance the realisation of the right to basic education.
2. Equity and priority: allocations must be non-discriminatory and provided on an equitable basis, while prioritising the education needs of those disadvantaged by past racial discrimination. Basic education must be given priority in government budget allocations.
3. Efficiency: funds allocated must be spent efficiently and according to sound financial practices as provided by law.
4. Effectiveness: expenditure must lead to tangible improvements in access to and enjoyment of the right.
1.1.1. Accounting for inflation: nominal to real conversionsInflation is the term used to describe general increases in the prices of goods and services in the economy. Inflation erodes the value of money because rising prices mean that R10 tomorrow buys you slightly less than R10 today. Departmental Annual Reports and Treasury documents tend to only provide the nominal amounts allocated in the budget each year, unadjusted for the effect of inflation. This makes comparing spending patterns over time difficult as the value of the amounts allocated in previous years (i.e. what they can buy) has changed. Therefore, when conducting an analysis of government budgets over time, it is important to take the effects of inflation into account. Converting nominal amounts to real amounts equalizes the value of money over time, which allows us to compare more accurately the allocations and expenditures for different years.
Crucially, using real amounts tells us whether government budgets have increased in real terms each year, or in other words, if budgets have increased at a rate below, in line with, or above inflation. This is important because, if budgets increase at a slower rate than inflation, they really aren’t increasing at all. For example, if the total cost of building a new school was R100,000 in 2010, and government was spending R1,000,000 on its school building programme, it would be able to build 10 schools. However, if the annualised inflation rate for that year was 10%, by the end of the year, the cost of school would be R110,000. The cost of building 10 schools in 2011 would therefore have risen to R1,100,000. If government failed to increase its programme budget by 10% or more, it would no longer be able to afford to build 10 schools. That would mean less schools built per year, which could be seen as regression rather than progress on improving access to basic education.
In South Africa, the most widely used measurement of general inflation is the Consumer Price Index (CPI), which is tracked by Statistics South Africa (StatsSA) and the National Treasury. Adjusting the nominal amounts provided in DBE and other reports to real amounts requires us to make a calculation using ‘inflators’ which are based on the annual CPI inflation rate provided in National Treasury Budget Review’s. The CPI inflation rate and inflators used in this budget analysis to convert nominal amounts to real amounts are shown in table 4.1 below. 2014/15 was used as the base year, hence all amounts in this chapter have been adjusted to 2014/15 prices.
292 See the International Covenant on Economic, Social and Cultural Rights (ICESCR) Article 2(1) and General Comments 3 and 13 of the Committee on Economic, Social and Cultural Rights, available at: http://tbinternet.ohchr.org/_layouts/treatybodyexternal/TBSearch.aspx?Lang=en&TreatyID=9&DocTypeID=11 For a summary of the budgetary obligations on states’ in relation to the right to education, see International Budget Partnership and IHRIP ‘Reading the books: Governments’ budgets and the right to education’ (2010), available at: www.right-to-education.org/resource/reading-books-governments%E2%80%99-budgets-and-right-education
293 See the African Commission on Human and Peoples’ Rights ‘Principles and Guidelines on the Implementation of Economic, Social and Cultural Rights in the African Charter on Human and People’s Rights’ adopted October 2011. Available at: www.achpr.org/instruments/economic-social-cultural.
294 See the section 195(1)(b) of the Constitution of the Republic of South Africa (1996); and the preamble to the Public Finance Management Act (Act No. 1 of 1999).
295 See, inter alia, Government of the Republic of South Africa and Others v Grootboom and Others (2000) at paras 39-47 and 68.
Inflation is the term used to describe
general increases in the prices of goods
and services in the economy.

91 Budget Analysis: assessing the resource allocations and expenditures of the Department of Basic Education
Table 4.1: CPI inflation annualised percentage change and inflators used to convert nominal amounts to real amounts, 2005/06 – 2016/17
Base year
2005/2006
2006/2007
2007/2008
2008/2009
2009/2010
2010/2011
2011/2012
2012/2013
2013/2014
2014/2015
2015/2016
2016/2017
CPI inflation 4.1% 4.9% 8.1% 9.9% 6.5% 3.8% 5.6% 5.6% 5.8% 5.6% 4.8% 5.9%
Inflator used to convert nominal to real figures
0.591 0.615 0.645 0.698 0.767 0.817 0.848 0.895 0.945 1.000 1.056 1.048
In order to highlight real allocation and expenditure trends, the following colour code has been used in tables and figures:
Bright green numbers indicate an increase in allocations to basic education programmes OR good spending performance (less than 2% under or over expenditure)
Bright red numbers indicate a decrease in allocations to basic education programmes
Dark red numbers indicate under-expenditure of more than 2%
Dark orange numbers indicate over-expenditure of more than 2%
Wherever possible, nominal amounts have been converted to real amounts in this budget analysis. Where this is not the case (for example with international spending comparisons), it is stated that nominal amounts are being used.
1.1.2. Sources usedUnless otherwise stated, the data source for all figures and tables is Department of Education and Department of Basic Education Annual Reports (2005/06 – 2014/15), National and Provincial Estimates of National Expenditure (2005/06 – 2014/15), the Division of Revenue Act and the Budget Review (2006 – 2014) and our own calculations.
4.2. Budgeting FrameworksGovernment’s obligation to fulfil the right of access to basic education requires adequate, efficient, equitable and effective budgeting at a national and provincial level. In South Africa, each year a Division of Revenue Act (DoRA) is passed by Parliament after receiving inputs from all spheres and sectors of government, as well as the public. The DoRA sets out the division of nationally raised revenue for the next twelve months among the three spheres of government. The portion of the budget allocated to basic education is split between the national and provincial Departments of Education (DBE). The national DBE is responsible for setting norms and standards and legislation for basic education and providing oversight of the education system as a whole. The DBE also provides conditional grant transfers to the provinces from its own budget. The provincial DBEs are responsible for the implementation of education, including the financing of schools and monitoring and improving education provision within their geographical area.
This rights-based budget analysis will look at the consolidated (total national and provincial) basic education allocations over a ten year period (2005/06 – 2014/15) as well as the spending performance on basic education budgets at these two levels of government in order to interrogate the reasonableness of government’s budgeting for the right to basic education. This will include breakdowns of overall provincial spending performance as well as a closer look at spending on infrastructure. As this is a ‘living report’, with indicators that will be updated over time (at least annually), future budget analyses will also take a closer look at post-provisioning
Government’s obligation to fulfil the right of access to basic
education requires adequate, efficient,
equitable and effective budgeting at a national
and provincial level.

92 Realising the Right to a Basic Education in South Africa
and personnel v non-personnel expenditure, as well as spending on LTSM, adult basic education, the national school nutrition programme, teacher training, maths and science spending, scholar transport provisions, special needs schools and early childhood development.
1.2.1. Consolidated basic education allocations, basic education as a percentage of total government expenditure and GDP and comparison with other developing countries
Figure 4.1: Consolidated (nominal) basic education allocations and annual % change, 2005/06 – 2016/17296
R69.1R77.4
R86.7
R102.8
R116.7 R131.4
R152.5
R162.0R175.3
R186.8
R200.8R212.8
11.9% 12.0%
18.6%
13.5%12.5%
16.1%
6.2%
8.2%
6.6%
7.4%
6.0%
5%
10%
15%
20%
R0
R20
R40
R60
R80
R100
R120
R140
R160
R180
R200
R220
Annu
al %
cha
nge
Billi
on
Consolidated basic education allocation Basic education allocation, annual % change
Figure 4.1 shows the total consolidated basic education allocations from the government budget between 2005/06 and 2016/17. It shows that total allocations to basic education rose in nominal terms by more than 10% each year between 2005/06 and 2011/12, resulting in a doubling of the basic education budget during these years. However, from 2012/13 onwards, consolidated basic education allocations grow at a slower rate of between 6% to 8.2%.
296 The consolidated basic education allocation is calculated by adding the total national basic education allocation to the total provincial basic education allocation. The national basic education for 2005/06 – 2009/10 is calculated by subtracting the FET and HE allocations from the DoE and provincial budgets.

93 Budget Analysis: assessing the resource allocations and expenditures of the Department of Basic Education
Figure 4.2: Consolidated (nominal) basic education allocations as a percentage of total government expenditure, 2005/06 – 2016/17
Total government expenditure
R417 R470R541
R636
R747R806
R890R965
R1 048
R1 135R1 222
R1 310
R69Consolidated basic education allocation
R77R87
R103R117
R131R152
R162R175
R187R201
R213
16.6%
Basic education as % of total government expenditure
16.5%16.0% 16.2%
15.6%16.3%
17.1% 16.8% 16.7% 16.5% 16.4% 16.2%
0%
2%
4%
6%
8%
10%
12%
14%
16%
18%
R0
R100
R200
R300
R400
R500
R600
R700
R800
R900
R1,000
R1,100
R1,200
R1,300
R1,400
R1,500
R1,600
R1,700
R1,800
Basic
edu
catio
n as
% o
f tot
al g
over
nmen
t exp
endi
ture
Billi
on
Consolidated basic education allocation Total government expenditureBasic education as % of total government expenditure
Figure 4.2 shows that the proportion of the total government budget allocated to basic education has dropped slightly from 16.6% in 2005/06 to a projected 16.2% in 2016/17. The year in which basic education received its lowest share of the budget was 2008/09, at 15.6%, while the year in which basic education received its highest share of the budget was 2011/12, at 17.1%. Since then the portion of the budget allocated to basic education has dropped consistently and is projected to continue to do so over the medium-term.
Figure 4.3: Nominal consolidated basic education allocations and total government ex-penditure, annual % change, and real GDP growth, 2005/06 – 2016/17
11.9%
12.0%
18.6%
13.5%12.5%
16.1%
6.2%
8.2%
6.6%7.4%
6.0%
12.8%
15.2% 17.4% 17.5%
7.9%
10.4%
8.5%
8.5%
8.3%7.7%
7.2%5.6%4.6%
2.5%
-0.8%
3.4% 3.0%2.1% 2.2%
1.4%2.0%
2.6%
-2%
0%
2%
4%
6%
8%
10%
12%
14%
16%
18%
20%
2006/07 2007/08 2008/09 2009/10 2010/11 2011/12 2012/13 2013/14 2014/15 2015/16 2016/17
Consolidated basic educationallocation, annual % changeTotal government expenditure,annual % changeGDP growth, annual % change
Figure 4.3 compares the annual percentage change in total government expenditure with the concurrent annual percentage change in the consolidated basic education allocation. Real GDP growth is also shown as an indicator of the availability of resources for the state to use to finance higher spending on basic education. The graph shows that basic education spending increased at a faster rate than total government expenditure in only three of the twelve years under review. The graph also illustrates the relative decline in government expenditure and basic allocation increases since 2011/12, with total government expenditure, the consolidated basic education allocation and GDP all currently growing at their slowest rates in over a decade.

94 Realising the Right to a Basic Education in South Africa
Figure 4.4: Primary school expenditure per learner as a % of per capita GDP, comparison between South Africa, other middle-income countries and OECD average, 1999 and 2013
29.4%
23.8%
22.6%
21.2%
18.8%
17.4%
17.1%
14.1%
11.7%
9.0%
17.8%
17.3%
10.8%
18.1%
13.8%
15.2%
12.6%
13.9%
9.3%
11.8%
5% 10% 15% 20% 25% 30%
Thailand
Ghana
Brazil
OECD average
South Africa
Colombia
Malaysia
Côte d'Ivoire
Mauritius
India
2013
1999
Source: UNESCO institute for statistics and the World Bank.297
Government expenditure per student is the average general government expenditure (current, capital, and transfers) per student at primary school level education, expressed as a percentage of per capita (per person) GDP. The above graph shows that South Africa, like most countries, increased its primary school per learner spending between 1999 and 2013. In comparison with other middle-income countries for which comparable data is available, South Africa performs better than Colombia, Malaysia, Cote d’Ivoire, Mauritius and India, but worse than Brazil, Ghana and Thailand. OECD (Organisation for Economic Corporation and Development) countries, which are richer than South Africa in terms of GDP, spend slightly more on primary school education per learner.
Figure 4.5: Secondary school expenditure per learner as a % of per capita GDP, comparison between South Africa, other middle-income countries and OECD average, 1999 and 2013
25.7%
25.4%
24.3%
20.9%
19.8%
19.7%
18.5%
17.0%
15.2%
39.7%
22.8%
19.5%
21.9%
18.9%
14.2%
16.1%
24.6%
10% 15% 20% 25% 30% 35% 40%
Ghana
OECD average
Brazil
South Africa
Malaysia
Thailand
Mauritius
Colombia
India
2013
1999
Source: UNESCO institute for statistics and the World Bank.298
At the secondary school level, South Africa outperforms Thailand but remains between three and five percentage points behind Brazil, Ghana and the OECD countries.
297 Available at: http://wdi.worldbank.org/table/2.10.298 Available at: http://wdi.worldbank.org/table/2.10.
Government expenditure per
student is the average general government expenditure (current, capital, and transfers)
per student at primary school level education, expressed as a percentage of per
capita (per person) GDP.

95 Budget Analysis: assessing the resource allocations and expenditures of the Department of Basic Education
1.2.2. Review of National and Provincial Budgeting and Expenditures on Basic Education
1.2.2.1. National allocations and expenditures on the right to basic education
Figure 4.6: DoE (excluding FET and HE) 2005/06 – 2009/10 and DBE 2010/11 – 2014/15 real appropriations, annual % change and under-expenditure, and DBE 2015/16 – 2016/17 estimates299
R2.6 R2.6R2.9
R4.4
R5.3
R7.6
R16.6
R18.1
R18.6R19.7 R20.5 R21.3
R0.05 R0.07 R0.12
R0.04R0.63
R0.81
R1.04R2.29
R0.64
R0.16
-0.3%
9.3%
53.5%
20.7%
50.7%
119.8%
8.7%3.2%
5.6% 4.2% 3.6%
-1%
10%
20%
30%
40%
50%
60%
70%
80%
90%
100%
110%
120%
R0
R2
R4
R6
R8
R10
R12
R14
R16
R18
R20
R22
Annu
al %
cha
nge
Billi
on
Final (real) Appropriation Under-expenditure Appropriation annual % change
The National Department of Basic Education’s (DBE) statutory role is to formulate laws, policies and regulations that give effect to the right to basic education and to monitor and evaluate policy implementation and impact. Figure 4.6 shows that allocations to the national department of education/basic education have grown considerably in real terms over the past 10 years, from R2.7bn in 2005/06 to R19.7bn in 2014/15. These rises include increases in the value of conditional grants allocated to provinces by the DBE, especially the Education Infrastructure Grant (EIG), which was allocated R6.3bn in 2011/12, its first year of operation. The introduction of the EIG led to a 119.8% increase in national DBE funding in 2011/12, since when total allocations to the department have risen more slowly in real terms.
1.3. Budgeting to Fulfil the Right to a Basic Education: the policy framework
South Africa’s public education system is financed through a mixture of public and private funding. While Section 34(1) of the South African Schools Act mandates that “the State must fund public schools from public revenue on an equitable basis in order to ensure the proper exercise of the rights of learners to education and the redress of past inequalities in educational provision”, the Department of Education has acknowledged that school funding policies allowing for the collection of school fees by many schools has perpetuated many of
299 To ensure comparability with the Department of Basic Education, the figures for the Department of Education between 2005/06 and 2009/10 have been calculated based on the full DoE allocation, minus expenditures on Further Education and Training and Higher Education.
The National Department of Basic
Education’s (DBE) statutory role is to
formulate laws, policies and regulations that
give effect to the right to basic education
and to monitor and evaluate policy
implementation and impact.

96 Realising the Right to a Basic Education in South Africa
the inequalities in public schools that had been carried over into post-apartheid South Africa.300 In response to persistent inequalities within the system, the Department of Basic Education has implemented a number of policies that have improved funding to schools serving South Africa’s poor.
School funding in South Africa essentially falls into three categories: Personnel Funding, Non-Personnel Funding and Conditional Grants. Personnel Funding, which comprises between 81% and 93%301 of provincial education budgets, is used to pay educators and staff under a policy that sets a target to limit provincial personnel expenditure to 80% of the provinces spending on education.302 The remainder of the provincial non-conditional grant budget is then distributed pursuant to National Norms and Standards for School Funding (NNSSF), which allocates government funding to schools based upon each school’s quintile poverty ranking. The NNSSF mandates that all provincial education departments rank their schools from “poorest” to “least poor” according to the household income of the surrounding school communities, which is usually, but not always, the school’s catchment area. Non-personnel expenditure is then used to pay for expenses including learning and teaching support materials, such as textbooks, library books and laboratory equipment; stationary; school maintenance and repairs and essential services such as telephone, security and electricity303. Finally, the National Treasury distributes conditional grants to provinces, which are earmarked for specific purposes, such as school infrastructure and school nutrition grants and programme grants such as HIV and Aids education and Dinaledi Schools grants.
1.3.1. Teachers / personnel fundingPersonnel spending is perhaps the least redistributive aspect of education funding since provinces use that funding to pay teachers and staff who are allocated to schools through formulas that weight learners according to their grade level and expected size of the class for the subject being taught304. While the Employment of Educators Act mandates that provincial education departments fill teacher posts on the basis of equality, equity and other democratic and values and principles laid out in the constitution305, other funding mechanisms effectively interfere with the state’s policy towards equity in the system of teacher allocation. Since teachers all belong to a single national civil service, their salaries are set nationally and in accordance to their qualifications and experience. Accordingly, wealthier schools that attract better qualified and more experienced educators, particularly in subject areas such as mathematics and sciences, take up a larger share of the provincial education department’s personnel budget than a poor school that employs less qualified and experienced educators. Moreover, these wealthier public ordinary schools are able to ensure that they attract higher qualified and more experienced educators through topping up teacher salaries and adding additional SGB-funded educator posts through the collection of school fees, resulting in lower learner : teacher ratios. The regulations governing educator post distribution allow provincial education departments to set aside up to 5% of their posts for poverty redress purposes to be allocated per the Norms and Standards For School Funding distribution formula described above. Redress therefore accounts for a very minor amount of personnel expenditure which makes up the vast majority of each province’s education budget.
Despite the Norms and Standards for School Funding requiring provinces to ensure that at least 20% of their budget is allocated to non-personnel expenditure, expenditure on teachers
300 The Amended National Norms and Standards for School Funding acknowledge that: “Ironically, given the emphasis on redress and equity, the funding provisions of the Act appear to have worked thus far to the advantage of public schools patronised by middle-class and wealthy parents. The apartheid regime favoured such communities with high-quality facilities, equipment and resources. Vigorous fund-raising by parent bodies, including commercial sponsorships and fee income, have enabled many such schools to add to their facilities, equipment and learning resources, and expand their range of cultural and sporting activities. Since 1995, when such schools have been required to down-size their staff establishments, many have been able to recruit additional staff on governing body contracts, paid from the school fund. Poor people, on the other hand, especially in former homeland areas, have contributed a disproportionate share of their incomes over many decades to the building, upkeep and improvement of schools, through school funds and other contributions, including physical labour. All too many schools in poor rural and urban working-class communities still suffer the legacy of large classes, deplorable physical conditions, and absence of learning resources, despite a major RDP National School Building Programme, and many other projects paid directly from provincial budgets. Yet the educators and learners in poor schools are expected to achieve the same levels of learning and teaching as their compatriots.” Amended Norms and Standards for School Funding (2006) at para. 46 – 47.
301 Deloitte, UNICEF & Department of Basic Education (2013). National Implementation of Post Provisioning: National Report. Pretoria: Department of Basic Education at p. 36.
302 Amended National Norms and Standards for School Funding at para 21.303 National Norms and Standards for School Funding, 2006 at para. 96.304 Department of Education, Post Distribution Model for the Allocation of Educator Posts to Schools, Regulation 1451 of 2002.305 The Employment of Educators Act (EEA) says: “In the making of any appointment or the filling of any post on any educator establishment
under this Act due regard shall be had to equality, equity and the other democratic values and principles which are contemplated in section 195 (1) of the Constitution... (Section 7(1)).”
School funding in South Africa
essentially falls into three categories:
Personnel Funding, Non-Personnel Funding and
Conditional Grants.

97 Budget Analysis: assessing the resource allocations and expenditures of the Department of Basic Education
salaries has continued to rise faster than non-personnel items, resulting in few provinces managing to meet the 80:20 target.
Table 4.2: Personnel – non-personnel expenditure ratios (excluding conditional grants), by province, 2010/11 – 2012/13
2010/11 2011/12 2012/13
Personnel – non-personnel expenditure ratio
Eastern Cape 84:16 89:11 90:10
Free State 85:15 86:14 89:11
Gauteng 79:21 80:20 81:09
KwaZulu-Natal 89:11 83:17 84:16
Limpopo 86:14 91:09 93:07
Mpumalanga 85:15 87:13 87:13
Northern Cape 82:18 83:17 87:13
North West 84:16 86:14 86:14
Western Cape 83:17 83:17 83:17
National average 83:17 85:15 86:14
Source: Deloitte, UNICEF & Department of Basic Education (2013). National Implementation of Post Provisioning:
National Report. Pretoria: Department of Basic Education at p. 36.
The above table is based on information provided by the Minister of Basic Education in response to a parliamentary question. It shows that eight out of nine provinces were spending proportionately more of their budgets on staff compensation in 2012/13 compared to 2010/11. This trend is all the more worrying when one considers that not a single province met their 80:20 target in that year. The only province demonstrating a positive trend is KwaZulu-Natal, while the Western Cape has maintained an 83:17 ratio throughout this period. Ratios are worst in Limpopo, Eastern Cape and Free State, where only seven to eleven percent of those provinces budgets remain after expenditure on personnel funding. The Directorate’s of Provincial Budget Monitoring must strengthen their oversight of expenditures in all provinces that are displaying an increasing trend towards over-spending on staff compensation relative to non-personnel expenditures.306
1.3.2. Non-personnel funding of schools under the Norms and Standards for School Funding
In 2005, the South African Schools Act was amended to provide for a process to establish norms and standards for school funding by means of a quintile system that seeks to categorise schools according to poverty rankings. Under this system, Norms and Standards Funding provides for greater levels of non-personnel funding to schools serving poor communities to compensate them for revenue they do not collect through school fees. This funding is used to pay for non-personnel expenditures such as school maintenance, books and stationary. Quintiles are established on a national basis to account for the income and wealth of the surrounding school communities, with schools located in the poorest communities classified as Quintile 1 and schools serving the wealthiest communities classified as Quintile 5.307 Under the original NNSSF funding policy, each province ranked their schools into poverty quintiles and then allocated the funds progressively so that schools falling into the poorest quintile 1 category received 35% of the available funds while quintile 2 schools received 25%, quintile 3 schools received
306 Zukiswa Kota ‘Education Budget Analysis’ Public Service Accountability Monitor (May 2013). Available at: www.psam.org.za. 307 The DBE amends the National Norms and Standards for School Funding Limpopo has the highest number of Quintile 1 schools where 28.2%
of schools located in the Province have been classified as Quintile 1 Schools. 27.3% of
In 2005, the South African Schools Act
was amended to provide for a process
to establish norms and standards for school funding by means of a quintile system that
seeks to categorise schools according to
poverty rankings.

98 Realising the Right to a Basic Education in South Africa
20%, quintile 4 schools received 15% and the wealthiest, quintile 5 schools, received 5% of the available funds. The Department of Education later amended the quintile system in 2003 to rank schools nationally rather than provincially under the recognition that certain provinces experience greater levels of poverty than others.308 In 2006, the Department of Education declared all Quintile 1 and 2 schools to be no-fee schools, meaning that they were prohibited from charging school fees to supplement the school’s finances and are instead compensated through increased government per-learner allocation. Parents are, however, allowed to make voluntary contributions to no-fee schools. In 2007, the Department of Education amended the quintile allocation formula from 35-25-20-15-5 to 30-27.5-22.5-10-5 and set school funding targets to coincide with inflation. Current targets for the year 2015 have since set quintile 1, 2 and 3 schools with the same target allocation due to their classification as no-fee schools entitling these schools to receive a minimum per-learner amount referred to as the “no fee threshold.” The DBE expanded no-fee schools to all schools classified as Quintiles 1, 2 and 3 in 2009 and in 2014, more than 60% of learners attending public schools in South Africa did not pay school fees, as indicator 7 in Chapter 5 of this paper illustrates.
The quintile system and norms and standards funding mechanisms have come under intense criticism over a number of issues. Firstly, it is often difficult to accurately classify schools into poverty quintiles, especially when poverty is as widespread as it is in South Africa. Moreover and as discussed above, the use of socio-economic conditions of the surrounding community is not always going to provide an accurate assessment of the school’s ability to collect sufficient school fees to cover its costs as many learners in South Africa travel outside of their communities to attend schools or attend schools that are miscategorised due to their being adjacent to wealthier communities.
Secondly, there is also a great deal of concern over whether the funding provided under the NNFFS funding mechanisms is sufficient to cover the costs associated with providing adequate school facilities and resources. The issue over the adequacy of school funding will be further explored in the next section of this chapter.
Finally, of significant importance is whether the provincial education departments are upholding their obligations by funding all schools at the targeted per-learner amounts allocated under the NNSSF. The DBE’s 2011 School Monitoring Survey revealed troubling information showing that nationally, 53% of learners attended schools that were not funded at the minimum level of per-learner funding or higher.309 This is actually an increase in underfunding from UNICEF’s 2009 finding quoted in the DBE’s Action Plan to 2014 that “although the school allocation had grown considerably over the years, and that this was appreciated by schools, a third of schools were still paid less than the targets applicable to them in the national policy” and that “[u]nder-funding of schools was found to be particularly common in North West and Mpumalanga.”310 These funding shortfalls are most significant when they are assessed in terms of the quintile rankings for the schools that underfunded learners attend as exhibited by table 4.3.
Table 4.3: Number and percentage of learners in schools that receive the minimum prescribed level of funding, 2011, by Quintile
Quintile No. of learners in schools funded at the minimum level Total no. of learners % of learners in schools funded at the
minimum level
1 955 760 2 614 036 37%
2 953 559 2 249 986 42%
3 1 140 410 2 908 148 39%
4 938 435 1 642 323 57%
5 1 140 307 1 496 510 76%
TOTAL 5 128 472 10 911 003 47%
Source: DBE, School Monitoring Survey, 2013 at p. 270.
308 OECD, Reviews of National Policies for Education – South Africa, 16 February 2009, p. 102.309 DBE, School Monitoring Survey, 2013 at p. 169.310 DBE, Action Plan 2014, at p. 146.

99 Budget Analysis: assessing the resource allocations and expenditures of the Department of Basic Education
Table 4.3 shows that in 2011 less than half of all learners were in schools that received the minimum prescribed funding under the NSSF. Most striking is that learners in the poorest areas of the country were the least likely to be in schools that received the minimum funding levels, with just over a third of learners in quintile one schools that received minimum funding, compared to three-quarters of learners in quintile 5 schools. The DBE’s report concluded, “Considering that the Quintile 1, 2 and 3 schools are non-fee schools and completely dependent on government funding, these figures are a serious concern and require further investigation to ascertain the source of the problem and determine a viable solution.”311
Moreover, according to the School Monitoring Survey’s findings, 81% of principals indicated that restrictions placed on the use of school allocations, late or non-payment of school funds, or unclear information about their allocations impacted negatively on their ability to manage their schools.312
Table 4.4: Number and percentage of learners in schools that receive the minimum pre-scribed level of funding, 2011, by Province
Province No. of learners in schools funded at the minimum level Total no. of learners % of learners in schools funded
at the minimum level
Eastern Cape 268 737 1 764 567 15%
Free State 588 145 619 539 95%
Gauteng 1 405 419 1 679 931 84%
KwaZulu-Natal 610 562 2 606 140 23%
Limpopo 790 391 1 559 159 51%
Mpumalanga 90 134 904 855 10%
Northern Cape 152 976 251 373 61%
North West 477 199 685 089 80%
Western Cape 744 908 840 350 89%
TOTAL 5 128 472 10 911 003 47%
The percentage of learners funded at the minimum level was extremely low in Mpumalanga, the Eastern Cape and KwaZulu-Natal where only 10%, 15% and 23% of learners, respectively, were in schools funded at the minimum level. In Limpopo, only half of the learners (51%) were funded at the minimum level. The Free State was the most compliant with minimum school funding, with 95% of learners in schools funded at the minimum level, followed by the Western Cape (89%) and Gauteng (84%), the North West (70%) and the Northern Cape (61%).
311 DBE, School Monitoring Survey, 2013, at p. 271.312 DBE, School Monitoring Survey, 2013, at p. 169.

100 Realising the Right to a Basic Education in South Africa
Table 4.5: Mean annual funding allocation per learner, 2011, by Province
ProvinceMean funding
per leaner (2011 Rands)
Minimum funding amount for Quintile
1 schoolsDifference
Eastern Cape R808
R905
-R97
Free State R749 -R156
Gauteng R670 -R235
KwaZulu-Natal R962 +R57
Limpopo R740 -R165
Mpumalanga R536 -r369
Northern Cape R744 -R161
North West R807 -R98
Western Cape R566 -R339
Total R758 -R147
The DBE in is the process of conducting another School Monitoring Survey at the time of writing, the above figures will be updated when the updated survey is published.
Around 50% of the National DBE budget is transferred to provinces in the form of conditional grants for, among other things,
� Infrastructure
� HIV/AIDS and life skills training
� School nutrition
� Improving maths and science
The next section will look at school infrastructure conditional grant spending, which makes up the bulk of conditional grants allocated to provinces by the DBE.
1.3.3. School Infrastructure Spending
1.3.3.1. Education Infrastructure Grant (EIG)
The provision and maintenance of adequate education infrastructure is an essential component of the right to basic education. Indicator 14 in the next chapter of this paper shows that as of 2015,
� 913 schools lack electricity while a further 2 854 have unreliable electricity.
� 452 schools have no water supply while 4 773 have an unreliable water supply.
� 128 schools have no toilet facilities while 10 419 schools have only pit or bucket latrines
The education Infrastructure Grant was established in 2011 to help accelerate the construction, maintenance and upgrading of existing and new education infrastructure. It has received between R5billion and R9billion in allocations since 2011/12, which are disbursed to all nine provinces. Provincial Education Departments (PEDs) are required to spend the funds in a way that maximizes education infrastructure improvements in their province.
The following section reviews each provinces real allocations and spending performance on the Education Infrastructure Grant, as well as the portion of the total EIG allocated to each province.
The education Infrastructure Grant was established in
2011 to help accelerate the construction, maintenance and
upgrading of existing and new education
infrastructure.

101 Budget Analysis: assessing the resource allocations and expenditures of the Department of Basic Education
As a reminder, the following key is used for highlighting over and under-expenditure by provinces:
Dark red numbers indicate under-expenditure Dark orange numbers indicate over-expenditure
Figure 4.7: Eastern Cape EIG allocations, annual % change and under/over-expenditure, and Eastern Cape EIG allocation as a % of the total EIG to provinces, 2011/12 – 2016/17
R856.9R987.0 R1 069.5
R1 177.9
R1 613.5 R1 461.8
R83.6
R60.0 R127.1R181.3
13.7%
15.2% 15.2% 16.1%
17.9% 16.8%15.2% 8.4% 10.1%
37.0%
-9.4%
-50%
-40%
-30%
-20%
-10%
0%
10%
20%
30%
40%
50%
R0
R200
R400
R600
R800
R1,000
R1,200
R1,400
R1,600
R1,800
R2,000
2011/12 2012/13 2013/14 2014/15 2015/16 2016/17
Mill
ion
EIG allocation recieved by Eastern Cape PED Under/over-expenditure
Eastern Cape allocation as a % of total EIG EIG allocation to Eastern Cape, annual % change
The Eastern Cape has some of the highest education infrastructure backlogs in the country and has received a steadily increasing share of the EIG since 2011/12 to change this. Worryingly, though Eastern Cape EIG allocations are expected to increase by 37% in the 2015/16 financial year, they are then expected to drop by 9.4% in 2016/17. Under expenditure on the EIG has been an issue in the Eastern Cape, particularly in 2013/14 and 2014/15, when a combined R300 million allocated to infrastructure went unspent by the province.
Figure 4.8: Free State EIG allocations, annual % change and under/over-expenditure, and EIG allocation as a % of the total EIG to provinces, 2011/12 – 2016/17
R501.7R580.6
R496.1R554.3
R722.1 R675.1
R1.3 R7.8R49.9 R82.0
8.0% 9.0% 7.1% 7.6% 8.0% 7.8%
15.7%
-14.5%
11.7%
30.3%
-6.5%
-50%
-40%
-30%
-20%
-10%
0%
10%
20%
30%
40%
50%
R0
R200
R400
R600
R800
R1,000
R1,200
R1,400
R1,600
R1,800
R2,000
2011/12 2012/13 2013/14 2014/15 2015/16 2016/17
Mill
ion
EIG allocation recieved by Free State PED Under/over-expenditure
Free State allocation as a % of total EIG EIG allocation to Free State, annual % change
The Free state has received around 8% of the total EIG since 2011/12 and has generally spent well on the grant, although under-expenditure has increased to R82 million in 2014/15. The Free State is also due to receive a reduction in its EIG allocation in 2016/17 after a steep increase of over 30% in 2015/16.

102 Realising the Right to a Basic Education in South Africa
Figure 4.9: Gauteng EIG allocations, annual % change and under/over-expenditure, and EIG allocation as a % of the total EIG to provinces, 2011/12 – 2016/17
R543.9 R573.0 R569.1 R623.6R643.0 R682.2
R178.9
R19.2 R0.0 R5.8
8.7% 8.8% 8.1% 8.5% 7.1% 7.9%
5.3% -0.7%
9.6%3.1%
6.1%
-50%
-40%
-30%
-20%
-10%
0%
10%
20%
30%
40%
50%
R0
R200
R400
R600
R800
R1,000
R1,200
R1,400
R1,600
R1,800
R2,000
2011/12 2012/13 2013/14 2014/15 2015/16 2016/17
Mill
ion
EIG allocation recieved by Gauteng PED Under/over-expenditure
Gauteng allocation as a % of total EIG EIG allocation to Gauteng, annual % change
After significant under-expenditure of R178 million in 2011/12, Gauteng PED has spent almost all of its EIG allocation in subsequent years.
Figure 4.10: KwaZulu-Natal EIG allocations, annual % change and under/over-expenditure, and EIG allocation as a % of the total EIG to provinces, 2011/12 – 2016/17
R1 387.4
R1 578.7
R1,382.2 R1,385.8
R1,873.8R1,772.6
R46.7
R41.7
R0.0 R0.0
22.1% 24.4%19.7% 18.9% 20.8% 20.4%
13.8%
-12.4%
0.3%
35.2%
-5.4%
-50%
-40%
-30%
-20%
-10%
0%
10%
20%
30%
40%
50%
R0
R200
R400
R600
R800
R1,000
R1,200
R1,400
R1,600
R1,800
R2,000
2011/12 2012/13 2013/14 2014/15 2015/16 2016/17
Mill
ion
Under/over-expenditure EIG allocation recieved by KwaZulu-Natal PED
KwaZulu-Natal allocation as a % of total EIG EIG allocation to KwaZulu-Natal, annual % change
KwaZulu-Natal receives the highest share of the total EIG, though this has dropped from 22.1% in 2011/12 to a projected 20.4% in 2016/17. The province received a share reduction in its EIG allocation in 2013/14 but like other provinces, has seen its 2015/16 allocation rise by more than 30% in 2015/16, with reduction of -5.4% planned in 2016/17.
KwaZulu-Natal receives the highest share of the total EIG, though
this has dropped from 22.1% in 2011/12 to a projected 20.4% in
2016/17.

103 Budget Analysis: assessing the resource allocations and expenditures of the Department of Basic Education
Figure 4.11: Limpopo EIG allocations, annual % change and under/over-expenditure, and EIG allocation as a % of the total EIG to provinces, 2011/12 – 2016/17
R1 059.4
R789.4
R1 040.8 R1 108.6
R762.4 R806.7
R4.6
R158.2
R172.7 R12.3
16.9%12.2% 14.8% 15.1%
8.5% 9.3%
-25.5%
31.8%
6.5%
-31.2%
5.8%
-50%
-40%
-30%
-20%
-10%
0%
10%
20%
30%
40%
50%
R0
R200
R400
R600
R800
R1,000
R1,200
R1,400
R1,600
R1,800
R2,000
2011/12 2012/13 2013/14 2014/15 2015/16 2016/17M
illio
n
EIG allocation recieved by Limpopo PED Under/over-expenditure
Limpopo allocation as a % of total EIG EIG allocation to Limpopo, annual % change
Limpopo and the Eastern Cape have historically received a high share of the EIG relative to their population sizes because of the infrastructure backlogs that exist in these provinces. However, Limpopo is the only province that received a reduction in its EIG allocation in 2015/16, a reduction of more than 30%. Limpopo’s EIG allocation is only expected to grow by 5.8% the following year, which means that the province will have less to spend in the medium-term on education infrastructure than at any time since 2011/12. During the period under review, Limpopo’s share of the total EIG will have dropped from 16.9% in 2011/12 to 9.3% in 2016/17. Spending on this grant has been uneven in Limpopo, with R158 million of the grant under-spent in 2012/13 and R172 million over-spent in 2013/14.
Figure 4.12: Mpumalanga EIG allocations, annual % change and under/over-expenditure, and EIG allocation as a % of the total EIG to provinces, 2011/12 – 2016/17
R562.2
R592.9R567.5
R623.6R811.8
R765.5R134.1
R3.4 R0.0R0.2
9.0% 9.1% 8.1% 8.5% 9.0% 8.8%
5.5%-4.3%
9.9%
30.2%
-5.7%
-50%
-40%
-30%
-20%
-10%
0%
10%
20%
30%
40%
50%
R0
R200
R400
R600
R800
R1,000
R1,200
R1,400
R1,600
R1,800
R2,000
2011/12 2012/13 2013/14 2014/15 2015/16 2016/17
Mill
ion
EIG allocation recieved by Mpumalanga PED Under/over-expenditure
Mpumalanga allocation as a % of total EIG EIG allocation to Mpumalanga, annual % change
After significant over-expenditure in 2011/12 of R134 million, Mpumalanga has spent well on its EIG allocation. Like most other provinces, it received a 30% increase in its EIG allocation in 2015/16, with this expected to be reduced the following year.
Limpopo and the Eastern Cape have
historically received a high share of
the EIG relative to their population sizes because of
the infrastructure backlogs that exist in
these provinces.

104 Realising the Right to a Basic Education in South Africa
Figure 4.13: Northern Cape EIG allocations, annual % change and under/over-expenditure, and EIG allocation as a % of the total EIG to provinces, 2011/12 – 2016/17
R341.2 R332.5R335.3
R346.4 R423.3R343.1R3.2 R54.4
R50.8R0.0
5.4% 5.1% 4.8% 4.7% 4.7% 3.9%
-2.5%0.8% 3.3%
22.2%
-19.0%
-50%
-40%
-30%
-20%
-10%
0%
10%
20%
30%
40%
50%
R0
R200
R400
R600
R800
R1,000
R1,200
R1,400
R1,600
R1,800
R2,000
2011/12 2012/13 2013/14 2014/15 2015/16 2016/17
Mill
ion
Under/over-expenditure EIG allocation recieved by Northern Cape PED
Northern Cape allocation as a % of total EIG EIG allocation to Northern Cape, annual % change
With the fewest schools and learners, the Northern Cape receives the smallest (and declining) portion of the EIG. Its EIG budget is due to increase by a fifth in 2015/16, only to be reduced by 19% the following year. The province under-spent on this grant by R54 million in 2012/13 and then over-spent by a similar amount the following year.
Figure 4.14: North West EIG allocations, annual % change and under/over-expenditure, and EIG allocation as a % of the total EIG to provinces, 2011/12 – 2016/17
R559.1R566.7
R551.9R623.6
R942.3R814.6
R56.7R73.6
R147.4R53.7
8.9% 8.7% 7.9% 8.5% 10.5% 9.4%
1.3% -2.6%13.0%
51.1%
-13.6%
-50%
-40%
-30%
-20%
-10%
0%
10%
20%
30%
40%
50%
R0
R200
R400
R600
R800
R1,000
R1,200
R1,400
R1,600
R1,800
R2,000
2011/12 2012/13 2013/14 2014/15 2015/16 2016/17
Mill
ion
EIG allocation recieved by North West PED Under/over-expenditure
North West allocation as a % of total EIG EIG allocation to North West, annual % change
North West has the most uneven spending record on the EIG out of the nine provinces, with significant under and over-expenditure occurring in all of the first four years of the grant. Despite this, North West received the largest increase in its EIG grant in 2015/16, of over 50%. Its EIG allocation is also due to be reduced, however, by 13/6% in 2016/17.
North West has the most uneven spending record on the EIG out of the nine provinces, with significant under and over-expenditure
occurring in all of the first four years of
the grant.

105 Budget Analysis: assessing the resource allocations and expenditures of the Department of Basic Education
Figure 4.15: Western Cape EIG allocations, annual % change and under/over-expenditure, and EIG allocation as a % of the total EIG to provinces, 2011/12 – 2016/17
R454.3 R482.0
R1 016.2
R882.7
R977.5 R834.2
R97.5R0.0
R146.7
R125.9
7.2% 7.4%14.5%
12.0% 10.8% 9.6%6.1%
110.8%
-13.1%
10.7%
-14.7%
-50%-40%-30%-20%-10%0%10%20%30%40%50%60%70%80%90%100%110%
R0
R200
R400
R600
R800
R1,000
R1,200
R1,400
R1,600
R1,800
R2,000
2011/12 2012/13 2013/14 2014/15 2015/16 2016/17M
illio
n
Under/over-expenditure EIG allocation recieved by Western Cape PED
Western Cape allocation as a % of total EIG EIG allocation to Western Cape, annual % change
The Western Cape has under or over-spent significantly on its EIG allocation in three of the four years since its inception. A massive increase of 110.8% in 2013/14 was tempered by a decrease of -13.1% the following year. Western Cape’s share of the total EIG allocation has moved from 7.2% in 2011/12, to 14.5% in 2013/14, down to an expected 9.6% by 2016/17.
1.3.3.2. Accelerated School Infrastructure Delivery Initiative (ASIDI) funded by the School Infrastructure Backlogs grant to national DBE
The ASIDI is an indirect grant programme run by the DBE to implement further and accelerated improvements in school infrastructure. The programme, which is funded by the school infrastructure backlogs grant, implements projects in provinces to replace inappropriate infrastructure and provide water, sanitation and electricity to schools. It was also launched in 2011/12.
Figure 4.16: Nominal ASIDI allocations, annual % change and under-expenditure, 2011/12 – 2016/17
R0.700
R2.065
R2.489 R2.540R2.433
R2.611
R0.624
R1.205
R1.097
195.0%
20.5%2.0%
-4.2% 7.3%
-10%
10%
30%
50%
70%
90%
110%
130%
150%
170%
190%
R0.0
R0.5
R1.0
R1.5
R2.0
R2.5
R3.0
2011/12 2012/13 2013/14 2014/15 2015/16 2016/17
Annu
al %
cha
nge
Billi
on
Final (real) Appropriation Under-expenditure Appropriation annual % change
Spending on the first three years of the ASIDI grant has been extremely poor by provinces, which on average failed to spend more half of the grant allocated to them between 2011/12 and 2013/14. As a result, expected allocations to the ASIDI, as well as provincial targets for school improvements, have had to be significantly reduced since the grant entered into operation. The Auditor General of South Africa it his 2013 sector audit found “deficiencies in all four phases of the infrastructure delivery process. Some provinces did not produce planning documentation for school infrastructure needs assessments, there were irregularities in the appointment of contractors, projects were not always well managed and some projects are still not being used.”313
313 Auditor-General of South Africa ‘Education Sector Report 2013-14’ July, 2015 at p25.

106 Realising the Right to a Basic Education in South Africa
1.4. Provincial allocations and expenditures on the right to basic education
Figure 4.17: Total (nominal) provincial equitable share and basic education allocation by provinces, annual % change and basic education as a % of total provincial spend-ing, 2005/06 – 2016/17
R134.7R150.8
R171.3
R199.4
R231.1R261.0
R288.5R309.1
R337.6
R362.5R382.7
R405.3
R67.6R75.7
R84.8R99.7
R112.6R125.2
R138.4R145.8
R157.7R167.1
R179.6R190.3
50.1%
Basic education as a % of total provincial spending
50.2% 49.5% 50.0%48.7% 48.0% 48.0% 47.2% 46.7% 46.1% 46.9% 47.0%
11.9%
15.9%
13.0%
10.5% 9.2%
5.6% 5.9%
12.1%
17%
11.2%
5.3%8.1%
7.5%
5.9% 5%
15%
25%
35%
45%
R0
R50
R100
R150
R200
R250
R300
R350
R400
R450
R500
Billi
on
Total basic education allocation by provincesTotal equitable share allocated to provincesProvincial equitable share, annual % changeBasic education allocation by provinces, annual % change
Since 2005/06, provinces – which receive around 90% of the total consolidated basic education budget for South Africa – have spent around 50% of their equitable share on providing for the right to basic education. However, this percentage has declined steadily over the period under review, from 50.1% in 2005/06 to an expected 47% in 2016/17. This is surprising given the importance that continues to be attached to improving basic education as a government priority. The next graph shows each provinces relative reduction in basic education spending as a proportion of their total equitable share. The reduction in the proportion of provincial spending on basic education is illustrated by the fact that increases in the basic education budget have not kept pace with increases in the total equitable share allocated to provinces. After double-digit increases in the nominal basic education budget between 2006/07 and 2011/12, annual increases have been limited to between 5% and 9% from 2012/13 onwards.
Since 2005/06, provinces – which
receive around 90% of the total consolidated
basic education budget for South Africa – have spent around 50% of
their equitable share on providing for the right
to basic education.

107 Budget Analysis: assessing the resource allocations and expenditures of the Department of Basic Education
Figure 4.18: % of provincial equitable share allocated to basic education, all provinces, 2005/06 – 2016/17
42%
43%
44%
45%
46%
47%
48%
49%
50%
51%
52%
53%
54%
2005/062006/072007/082008/092009/102010/112011/122012/132013/142014/152015/162016/17Poly. (Eastern Cape) Poly. (Free State) Poly. (Gauteng)
Poly. (KwaZulu-Natal) Poly. (Limpopo) Poly. (Mpumalanga)
Poly. (Northern Cape) Poly. (North West) Poly. (Western Cape)
Figure 4.18 shows that each province has reduced the proportion of their total expenditure on basic education since 2005/06. Limpopo has made the smallest reduction, of 0.2%, while the Western Cape has made the largest, from 50.6% in 2005/06 to 42.2% expected in 2016/17. Each provinces total (nominal) allocation and spending performance on basic education will now be reviewed.
Figure 4.19: Eastern Cape, total (nominal) allocations and under/over expenditure, annual % change in total equitable share compared to concurrent annual % change in allocation to PED, and PED allocation as a % of total provincial spending, 2005/06 – 2016/17
R11.0R12.7
R14.3R17.1
R18.7R20.5 R22.1
R22.3R24.6 R24.9 R25.6 R27.7
R0.2R0.1 R0.2
R0.4R1.1
R1.0 R0.3R0.9
R0.1 R0.3
49.6%
PED allocation as a % of total provincial spending
51.5%52.8%
54.6%52.0% 51.1% 50.0%
47.6%49.1%
47.7% 47.1% 48.3%
0%
5%
10%
15%
20%
25%
30%
35%
40%
45%
50%
55%
R0
R5
R10
R15
R20
R25
R30
R35
R40
Billi
on
Allocation to Provincial Education Department Under/over-expenditure
Provincial equitable share, annual % change Basic education allocation, annual % change
The Eastern Cape increased its basic education spending as a proportion of its total equitable share between 2005/06 and 2008/09, but has since reduced this to 48.3% in 2016/17. The province has over or under-spent on its basic education allocation by more than R100 million

108 Realising the Right to a Basic Education in South Africa
every year since 2005/06, including over-expenditures of R1 billion or more in both 2009/10 and 2010/11, and of R900 million in 2012/13. In total, the province’s education department has over spent by R3.8 billion since 2005/06.
Figure 4.20: Free State, total (nominal) allocations and under/over expenditure, annual % change in total equitable share compared to concurrent annual % change in allocation to PED, and PED allocation as a % of total provincial spending, 2005/06 – 2016/17
R4.5 R4.9 R5.2 R5.9R6.9
R7.6 R8.3 R9.1 R9.3 R9.7 R10.2 R10.6
R0.2 R0.0 R0.1R0.4
R0.4 R0.2R0.0 R0.1 R0.0 R0.2
52.2%
PED allocation as a % of total provincial spending
50.8%48.5% 47.3% 48.4% 47.9% 47.4%
49.2%46.4% 46.5% 46.7% 46.7%
0%
5%
10%
15%
20%
25%
30%
35%
40%
45%
50%
55%
R0
R5
R10
R15
R20
R25
R30
R35
R40
Billi
on
Under/over-expenditure Allocation to Provincial Education Department
Provincial equitable share, annual % change Basic education allocation, annual % change
The Free State has dramatically reduced its basic education spending as a percentage of its total spending from 52.2% in 2005/06 to an expected 46.7% by 2016/17. The province has tended to over rather than under-spend on its basic education budget, particularly in 2008/09 and 2010/11, when a total of R800 million was overspent.
Figure 4.21: Gauteng, total (nominal) allocations and under/over expenditure, annual % change in total equitable share compared to concurrent annual % change in allocation to PED, and PED allocation as a % of total provincial spending, 2005/06 – 2016/17
R10.1 R11.9
R14.1 R16.1
R18.5 R20.8
R23.9 R24.9
R27.4 …
R34.3 R35.7
R0.4R0.2
R0.1
R1.0R0.5
R0.1 R0.8R1.0
R0.3
48.6%
PED allocation as a % of total provincial spending
50.9% 50.0%48.6% 47.4%
46.1%47.4%
45.7% 44.6% 44.0%46.7% 45.7%
0%
5%
10%
15%
20%
25%
30%
35%
40%
45%
50%
55%
R0
R5
R10
R15
R20
R25
R30
R35
R40
Billi
on
Under/over-expenditure Allocation to Provincial Education Department
Provincial equitable share, annual % change Basic education allocation, annual % change
Gauteng has also tended to over spend on its basic education budget, including R800 – R1000 million of over-expenditure in each of the 2009/10, 2012/13 and 2013/14 financial
The Free State has dramatically reduced
its basic education spending as a
percentage of its total spending from 52.2% in 2005/06 to an expected
46.7% by 2016/17.

109 Budget Analysis: assessing the resource allocations and expenditures of the Department of Basic Education
years. Basic education allocations have tended to increase at a slower rate than total provincial expenditure, resulting in the share of the provincial equitable share going to basic education dropping from 48.6% in 2005/06 to 45.7% in 2016/17.
Figure 4.22: KwaZulu-Natal, total (nominal) allocations and under/over expenditure, annual % change in total equitable share compared to concurrent annual % change in allocation to PED, and PED allocation as a % of total provincial spending, 2005/06 – 2016/17
R14.0R15.5
R17.7
R20.2
R23.3
R26.4
R29.5R31.4
R33.9
R36.1R38.7 R40.9
R0.2R0.1
R0.2
R0.5
R1.4R0.5
R0.2R0.4
R0.1
R0.049.2%
PED allocation as a % of total provincial spending
48.4% 47.8% 46.7% 46.5% 46.6% 46.9% 46.3% 46.1% 46.2% 47.1% 47.1%
0%
5%
10%
15%
20%
25%
30%
35%
40%
45%
50%
55%
R0
R5
R10
R15
R20
R25
R30
R35
R40
Billi
on
Under/over-expenditure
Provincial equitable share, annual % change Basic education allocation, annual % change
KwaZulu-Natal has pegged its basic education allocation increases more closely to increases in total provincial expenditure. Despite this, the portion of the provinces equitable share allocated to basic education has still dropped, from 49.2% in 2005/06 to 47.1% expected in 2016/17. Combined over expenditure of R2.4 billion between 2008/09 and 2010/11 has been curtailed in later years, though over expenditure on its basic education budget continues to be an issue for the province.
Figure 4.23: Limpopo, total (nominal) allocations and under/over expenditure, annual % change in total equitable share compared to concurrent annual % change in allocation to PED, and PED allocation as a % of total provincial spending, 2005/06 – 2016/17
R9.4 R10.5 R11.3
R14.2R15.4
R17.0 R18.6R19.6
R21.0
R21.7 R23.0 R24.4
R1.3 R0.3 R0.0
R0.5 R0.9R1.5
R0.2R0.4 R0.2
R0.4
51.0%
PED allocation as a % of total provincial spending
50.9% 50.6%54.8%
51.4% 51.1% 51.1% 50.7% 50.9% 50.1% 50.7% 50.8%
0%
5%
10%
15%
20%
25%
30%
35%
40%
45%
50%
55%
R0
R5
R10
R15
R20
R25
R30
R35
R40
Billi
on
Under/over-expenditure Allocation to Provincial Education Department
Provincial equitable share, annual % change Basic education allocation, annual % change
KwaZulu-Natal has pegged its basic
education allocation increases more closely
to increases in total provincial expenditure.

110 Realising the Right to a Basic Education in South Africa
Limpopo has made the smallest reduction in the proportion of its equitable share allocated to basic education, from 51% in 2005/06 to 50.8% expected in 2016/17. The province has significantly over-spent by over R1 billion in 2005/06 and 2010/11, with a combined over-expenditure of R5 billion during the period under review, more than any other province.
Figure 4.24: Mpumalanga, total (nominal) allocations and under/over expenditure, annual % change in total equitable share compared to concurrent annual % change in allocation to PED, and PED allocation as a % of total provincial spending, 2005/06 – 2016/17
R5.4 R5.9R7.5
R8.5
R9.5R10.4 R11.3 R12.2 R13.3 R14.1 R15.2 R16.4
R0.1 R0.0R0.0
R0.3
R0.9 R0.2 R0.2 R0.2 R0.1R0.1
54.3%
PED allocation as a % of total provincial spending
52.5% 53.1%51.6%
49.9% 48.7% 48.3% 49.0% 48.7% 48.2% 48.9% 49.7%
0%
5%
10%
15%
20%
25%
30%
35%
40%
45%
50%
55%
R0
R5
R10
R15
R20
R25
R30
R35
R40
Billi
on
Under/over-expenditure Allocation to Provincial Education Department
Provincial equitable share, annual % change Basic education allocation, annual % change
Mpumalanga has cut the portion of its budget dedicated to basic education from 54.3% in 2005/06 to 49.7% expected in 2016/17. After a steep increase in the total budget and basic education allocation in 2007/08, both have increased at a slowing rate in subsequent years.
Figure 4.25: Northern Cape, total (nominal) allocations and under/over expenditure, annual % change in total equitable share compared to concurrent annual % change in allocation to PED, and PED allocation as a % of total provincial spending, 2005/06 – 2016/17
R1.5 R1.6 R2.2 R2.5 R2.8 R3.2R3.5
R3.7R3.9 R4.2 R4.5 R4.7
R0.0 R0.0 R0.0 R0.2 R0.1 R0.0R0.1
R0.1R0.0
R0.1
46.5%
PED allocation as a % of total provincial …
45.6%47.3% 46.4% 45.7% 45.1% 45.0% 44.5% 43.7% 43.1% 44.0% 43.8%
0%
5%
10%
15%
20%
25%
30%
35%
40%
45%
50%
55%
R0
R5
R10
R15
R20
R25
R30
R35
R40
Billi
on
Under/over-expenditure Allocation to Provincial Education Department
Provincial equitable share, annual % change Basic education allocation, annual % change
Northern Cape also saw a large increase in its total and basic education budgets in 2007/08, as well as in 2008/09, since when increases have been lower. The province has kept under and
Mpumalanga has cut the portion of its budget dedicated to basic education from 54.3% in 2005/06 to 49.7% expected in
2016/17.

111 Budget Analysis: assessing the resource allocations and expenditures of the Department of Basic Education
over-expenditure to a minimum throughout the period under review. Northern Cape now has one of the lowest proportions of its equitable share allocated to basic education, at 43.1% in 2014/15, though this has been increased to 44% in 2015/16 and 43.8% in 2016/17.
Figure 4.26: North West, total (nominal) allocations and under/over expenditure, annual % change in total equitable share compared to concurrent annual % change in allocation to PED, and PED allocation as a % of total provincial spending, 2005/06 – 2016/17
R5.6 R6.1 R5.1 R6.7 R7.7 R8.3 R9.2 R9.7 R10.3R11.1 R11.9
R12.7
R0.1 R0.1R0.9 R0.2 R0.3 R0.1 R0.2 R0.0 R0.3
R0.3
50.6%
PED allocation as a % of total provincial spending
49.7%
42.7%
48.2% 48.0% 47.9% 47.7% 47.1%45.3% 45.0% 45.6% 45.9%
-18%
-13%
-8%
-3%
2%
7%
12%
17%
22%
27%
32%
37%
42%
47%
52%
R0
R5
R10
R15
R20
R25
R30
R35
R40
Billi
on
Under/over-expenditure Allocation to Provincial Education Department
Provincial equitable share, annual % change Basic education allocation, annual % change
North West has seen its provincial equitable share as well as its allocation to basic education swing more dramatically than other provinces during the period under review. However, the province has managed to dampen the impact of changing equitable share allocations on basic education by reducing or increasing that budget at a slower rate than its total budget. During this period, the provincial education department has consistently over-spent while the portion of the equitable share allocated to basic education has reduced from a high of 50.6% in 2005/06 to an expected 45.9% in 2016/17.
Figure 4.27: Western Cape, total (nominal) allocations and under/over expenditure, annual % change in total equitable share compared to concurrent annual % change in allo cation to PED, and PED allocation as a % of total provincial spending, 2005/06 – 2016/17
R6.1
R6.7 R7.4
R8.6 R9.9R10.9 R12.1 R12.8 R13.9 R15.0 R16.3
R17.1
R0.2
R0.1 R0.0
R0.1 R0.3R0.1 R0.0 R0.0
R0.0 R0.1
50.6%
PED allocation as a % of total provincial spending
49.8% 48.9% 48.5% 47.7%45.5% 45.1% 44.6%
43.3% 42.2% 42.6% 42.2%
0%
5%
10%
15%
20%
25%
30%
35%
40%
45%
50%
55%
R0
R5
R10
R15
R20
R25
R30
R35
R40
Billi
on
Under/over-expenditure Allocation to Provincial Education Department
Provincial equitable share, annual % change Basic education allocation, annual % change
North West has seen its provincial equitable
share as well as its allocation to basic
education swing more dramatically than other
provinces during the period under review.

112 Realising the Right to a Basic Education in South Africa
The Western Cape has reduced basic education spending as a proportion of its total equitable share by more than any other province, from 50.6% in 2005/06 to only 42.2% in 2016/17. This is highlighted by the fact that basic education spending has failed to keep pace with increases in the provinces equitable share allocation in eleven out of the twelve years under review.
1.5. Key FindingsThis budget analysis has tracked total (consolidated) basic education expenditure in South Africa since 2005/06, compared South Africa’s education spending with other countries, taken a closer look at infrastructure spending, and reviewed each provinces equitable share spending performance for basic education.
In general, growth in basic education spending has been declining since 2011/12. Until then, expenditure on basic education increased at over 10% each year. From 2012/13 onwards, however, and reflecting the austerity that has been imposed on much of the government budget, basic education spending has increased at between 6% and 8.2% in nominal terms. Moreover, since reaching a high proportion of total government expenditure of 17.1% in 2011/12, consolidated basic education spending has decreased overall as a proportion of total government expenditure during the period under review, from 16.6% in 2005/06 to a projected 16.2% in 2016/17. Basic education remains, however, a priority for government in its overarching policy statements and development plans. If the indicators reviewed in the next chapter are to improve, and South Africa is to attain its goals for basic education, we suggest that basic education once again receives an increasing share of the government budget, rather than the reverse.
South Africa has increased its education spending per learner in real terms since 1999 at both the primary and secondary school levels. However, South Africa still lags behind some other middle-income countries as well as the OECD countries in terms of it’s per learner spending as a percentage or per capita GDP. Brazil, Ghana and Thailand all spend more than South Africa in this regard.
At the provincial level, where around 90% of basic education spending takes place, provinces demonstrate a mixed record in terms of personnel v non-personnel expenditure as well as in their general spending performance and the amount of the provincial equitable share that is allocated to basic education. Limpopo and the Eastern Cape both spend over 90% of their basic education budget on staff compensation, leaving little for essential goods and services such as textbooks and improving school infrastructure. Gauteng and the Western Cape have the best personnel v non-personnel expenditure ratios at 81:09 and 83:17 respectively in 2012/13, but these too miss the governments target of an 80:20 ratio.
The DBE’s 2011 School Monitoring Survey also revealed troubling information showing that nationally, 53% of learners attended schools that were not funded at the minimum level of per-learner funding or higher, with this problem far greater in poorer (quintile 1-3) schools than in wealthier schools. Eastern Cape, KwaZulu-Natal and Mpumalanga were the least likely to be funding learners at the minimum level.
In terms of infrastructure, two major grants have been established since 2011/12 designed to rapidly construct and renew school infrastructure in the country. Spending on the indirect Accelerated School Infrastructure Development Initiative (ASIDI) – which received an allocation of R2.4 billion in 2015/16 – has been extremely poor, with less than half of its budget spent in 2011/12, 2012/13 and 2013/14 respectively. Spending on the Education Infrastructure Grant (EIG) has been better, with R520 million underspent and R350 million overspent on this grant in total by provinces since its introduction in 2011/12. The Eastern Cape, North West and Western Cape have had the poorest expenditure records on this grant. Notably, all provinces except Gauteng and Limpopo received large (10% - 50%) increases in their EIG budget in 2015/16. Limpopo’s EIG budget was actually decreased this year by 31.2% in real terms. However, all provinces except Gauteng and Limpopo are due to receive a reduction in their EIG allocation in 2016/17.
All provinces without exception have reduced the proportion of their equitable share allocated to basic education since 2005/06. In total, provinces were spending 50.1% of their equitable share allocation on basic education in 2005/06, but by 2016/17 this is due to reduce to 47%.
In general, growth in basic education spending has been
declining since 2011/12. Until then,
expenditure on basic education increased at
over 10% each year.

113 Budget Analysis: assessing the resource allocations and expenditures of the Department of Basic Education
This reduction has been most steep in the Western Cape, which is projected to spend only 42.2% of its equitable share on basic education in 2016/17. Limpopo has reduced the share of its budget going to basic education the least, by only 0.2%. Provinces are recommended to reverse this decline by increasing their basic education allocations in real terms over the medium-term period.
Further research will be conducted when this budget analysis is updated in 2016 on post-provisioning and personnel v non-personnel expenditure, as well as spending on LTSM, adult basic education, the national school nutrition programme, teacher training, maths and science spending, scholar transport provisions, special needs schools and early childhood development.
The next chapter of this paper looks at indicators which track and assess the impact of government policies and budgeting on access to and enjoyment of the right to basic education in South Africa over time.
All provinces without exception have
reduced the proportion of their equitable share allocated to
basic education since 2005/06.

114 Realising the Right to a Basic Education in South Africa
The Status of the Right to a Basic Education in South Africa: What indicators tell us
The first two steps of the analysis have taken a close look at the policies and legislation guiding the realisation of the right to a basic education and the allocation and expenditure of resources dedicated to their implementation.
This chapter is based on Step 3: The development of statistical indicators which allow us to assess and track the realisation of the right to a basic education over time. While the previous two steps focus largely on the state’s obligations of conduct (formulating and implementing constitutionally-aligned laws and policies and allocating adequate resources), step 3 measures the state’s obligations of result and more specifically, the extent to which the state’s efforts have resulted in the realisation of the right. It aims to provide an indicative measure of the actual realisation of the right to a basic education and therefore of the impact and outcomes of government policies and programmes.
Right to Basic Education Indicators
Dimensions of SERs: Access, Adequacy, Quality SPII has adapted international best practice in socio-economic rights monitoring to the South Africa context – evaluating attainment of socio-economic rights using measurements of Access, Adequacy and Quality. In the context of the right to a basic education, the following apply:
Access IndicatorsAccess indicators refer to measurements that show the extent to which children and school-aged youth are able to attend schools that are physically and economically accessible to them and that they are able to attend such schools free from discrimination on prohibited grounds. These indicators further look at the extent to which learners are able to access teaching and learning in a supportive environment that is capable of responding to learners’ socio-economic challenges, including nutrition and transportation needs, as well as safety concerns.
Adequacy IndicatorsAdequacy indicators measure the inputs that national and provincial governments provide to learners at school, including qualified, trained and capable teachers; learning and teaching support materials; school infrastructure and the provision of adequate classroom space.
Quality IndicatorsThe quality indicators measure educational outcomes and the extent to which South Africa’s education system has been able to produce and graduate learners from the system who are literate and numerate life-long learners prepared to succeed in higher education and in the workforce, as well as capable of advancing the constitutional principals of social transformation, equality and freedom.
CHAPTER
5
The first two steps of the analysis have taken a close look at the policies and
legislation guiding the realisation of the right to a basic education and the allocation and expenditure of
resources dedicated to their implementation.

115 The Status of the Right to a Basic Education in South Africa: What indicators tell us
5.1. Access Indicators
School AttendanceIndicator 1.1: The proportion of 5 year-old children attending an educational institution
Description: This indicator measures the proportion of 5 year-old children enrolled in educational institutions. This indicator is calculated by dividing the total number of 5 year-old children enrolled in educational institutions by the number of 5 year-olds in each province using General Household Survey data. 5 year-old enrolment figures are noteworthy because they demonstrate the extent to which children residing in various provinces are accessing Grade R prior to entering Grade 1.
Data Source: Stats SA, GHS 2002, 2013
Figure 5.1: Percentage of 5 year-old children attending educational institutions, by province49
.60%
33.3
0% 45.9
0%
33.4
0% 43.1
0%
28.9
0%
36.6
0%
21.5
0%
41.2
0%
39.3
0%
93.9
0%
87.6
0%
83.3
0%
81.9
0%
96.3
0%
82.7
0%
84.0
0%
85.4
0%
75.4
0% 85.3
0%
0.00%
20.00%
40.00%
60.00%
80.00%
100.00%
EC FS GT KZN LP MP NW NC WC National2002 2013
Indicator 1.2: The proportion of 5 year-old children attending educational institutions by gender
Description: This indicator measures the percentage of 5 year-old children attending an educational institution by dividing the number of 5 year-old learners cited as enrolled in an educational institution by the total number of 5 year-olds in the population using GHS data. This indicator is important because it shows the extent to which 5 year-olds are accessing educational institutions prior to attending grade 1.
Data Source: Stats SA, General Household Survey, 2002 - 2013
Figure 5.2: Percentage of 5 year-old children attending educational institutions, by gender
2002 2003 2004 2005 2006 2007 2008 2009 2010 2011 2012 2013Male 39.8 48.5 49.8 58.9 62.6 62.2 60.6 76.5 82.8 84.8 85.5 85.6Female 38.8 47.7 54 59.6 60.5 58.3 65.7 80.5 84.1 84.8 83.7 85
0102030405060708090
100
Male Female
Indicator 1.3: The number of learners enrolled in Grade R in Public and Independent Schools
Description: This indicator measures the enrolment numbers of Grade R learners in public and independent schools using DBE administrative enrolment data taken from SNAP Surveys. The graph below compares the enrolment of grade R against the number of learners enrolled in grade 2.

116 Realising the Right to a Basic Education in South Africa
Data Source: DoE and DBE SNAP Survey Data published in Education Statistics in South Africa at a Glance, 2002 – 2009 and School Realities 2010 - 2014
Figure 5.3: Number of learners enrolled in Grade R and Grade 2
2002 2003 2004 2005 2006 2007 2008 2009 2010 2011 2012 2013 2014Grade R 278726 315387 356487 405197 441587 487222 543799 620813 707203 734654 767865 779370 813044
Grade 2 1012892 1111858 1109201 1118690 1081652 1050103 1031821 1004311 994410 1003353 1074788 1116427 1149894
0
200000
400000
600000
800000
1000000
1200000
1400000
Indicator 1.4: The number of 3 to 5 year-old children attending an ECD facility
Description: This indicator measures the number and proportion of children aged three to five years-old attending educational institutions using GHS data. This indicator is noteworthy given the emphasis that the National Planning Commission has placed on developing ECD programmes that enable all children to access at least two years of schooling prior to attending Grade 1.
Source: DBE Focus on Schooling 2013 using GHS data 2009 – 2013
Figure 5.4: Number of 3 to 5 year-old children attending and not attending educational institutions
1829047 2008123 2041989 2086239 2211213
1219781 1130732 1051363 1009627 891128
0
500000
1000000
1500000
2000000
2500000
3000000
3500000
2009 2010 2011 2012 2013
Attending Not attending
DBE administrative data in Figure 5.3 show that enrolment in Grade R has increased dramatically between 2002 and 2014, from 278,726 to 813,044. GHS data exhibited in Figures 5.1 and 5.2 similarly show an increase in 5 year-old attendance at educational institutions from 39.3% in 2002 to 85.3% in 2014. Moreover, enrolment rates are virtually identical for girls and boys. Interestingly, the data show that poorer provinces, such as the Eastern Cape and Limpopo have higher rates of 5 year-old children attending educational institutions than wealthier provinces such as the Western Cape and Gauteng. Rates of 3 to 5 year-olds who attend educational institutions have increased between 2009 and 2013 from an estimated 60% of 3 to 5 year-olds attending educational institutions in 2009 to approximately 71% attending educational institutions in 2013.
Indicator 2: The proportion of 7 to 15 year-old children attending educational institutions by gender
Description: This indicator measures the proportion of 7 to 15 year-old children enrolled in schools using GHS data. The indicator is calculated by dividing the number of children in that age cohort who indicated that they were enrolled in school by the total number of children of that age cohort. The significance of this indicator is that it tracks the extent to which learners are attending educational institutions during the compulsory schooling phase.
Source: Stats SA, GHS, 2002 – 2013; DBE calculations published in Focus on Schooling 2013, at p. 15.

117 The Status of the Right to a Basic Education in South Africa: What indicators tell us
Figure 5.5: Percentage of 7 to 15 year-old children attending education institutions, by gender
9494.5
9595.5
9696.5
9797.5
9898.5
9999.5
2002 2003 2004 2005 2006 2007 2008 2009 2010 2011 2012 2013
Male Female Total
Figure 5.5 shows that attendance at educational institutions for children of compulsory school-going age is nearly universal, with approximately 99% of 7 to 15 year-olds attending educational institutions. These high rates are also very similar for male and female learners, though female enrolment is slightly higher for girls than for boys.
Indicator 3: The proportion of 16 to 18 year-olds attending educational institutions
Description: This indicator measures the proportion of 16 to 18 year-olds attending edu-cational institutions by dividing the number of persons of that age group enrolled in school by the total number of 16 to 18 year-olds in the population using GHS data. This indicator measures the rate at which learners by gender and race continue to attend school after the compulsory school-going age.
Source: Stats SA, General Household Survey, 2002 – 2013 published by the DBE 2014 Education for All Report
Figure 5. 6: Percentage of 16 to 18 year-olds attending educational institutions, by race
2002 2003 2004 2005 2006 2007 2008 2009 2010 2011 2012 2013Black 83.1 84 83.7 82.6 84.1 86.3 85.2 84.6 83.9 86.4 86.8 87.5Coloured 67.5 64.9 66.2 66.5 63.3 70.7 69.4 68 69.3 69.2 77.2 74.3Indian/Asian 80.3 79.3 80.5 88 69.1 82.1 80.7 79.7 77.4 81.1 83.2 76.3White 91.9 90 89.1 92.1 88.4 89.7 83.8 86.6 89.3 85.7 86.3 88.2Total 82.9 79.3 83.3 82.4 82.5 85 83.9 82.9 82.9 84.9 85.9 86.1
50556065707580859095
100
Figure 5.7: Percentage of 16 to 18 year-old youth enrolled in educational institutions, by gender
2002 2003 2004 2005 2006 2007 2008 2009 2010 2011 2012 2013Male 85.7 85.4 85.8 85.2 84.3 86.6 84.5 84.1 84.8 85.7 87.2 87.4Female 79.1 80.2 79.3 79 80.5 83.7 83.1 82.5 81 84 84.6 84.9Total 82.9 79.3 83.3 82.4 82.5 85 83.9 82.9 82.9 84.9 85.9 86.1
70
75
80
85
90
95
100
Source: DBE, Focus on Schooling 2013, using StatsSA data from General Household Survey, 2002 – 2013.

118 Realising the Right to a Basic Education in South Africa
Indicator 4: The number of 5 to 18 year-olds not attending schools/educational institutions
Description: This indicator measures the number of 16 to 18 year-old youth who are not attending educational institutions using General Household Survey data.
Source: StatsSA, General Household Survey, 2002 - 2013
Figure 5. 8: Number of 16 to 18 year-olds not attending schools or education institutions
2002 2003 2004 2005 2006 2007 2008 2009 2010 2011 2012 20137 to 15 345501 265328 216678 209309 227324 200291 194901 142843 123807 111041 108690 11295216 to 18 514534 522914 520016 539177 551628 476825 525200 519576 546380 479444 446086 430588Total 860035 788242 736694 748486 778952 677116 720101 662419 670187 590485 554776 543540
0100000200000300000400000500000600000700000800000900000
1000000
Figure 5.7 shows that the numbers of learners aged 7 to 15 not attending school dropped by over 2/3 between 2002 and 2013 from 345,501 to 112,952. The decrease in the number of 16 to 18 year-old learners not attending educational institutions during that time period, however, was less impressive, with 430,588 16 to 18 year-olds not attending educational institutions in 2013, showing that incidences of learner drop-out continue to increase once learners reach non-compulsory school-going ages. The rates of school attendance for male and female learners aged 16 to 18 were similar by 2013, with 87.4% of males of that age attending educational institutions compared to 84.9% of female 16 to 18 year-olds. While enrolment levels of female learners between the ages of 16 and 18 increased by 5.8% between 2002 and 2013, male enrolment only increased by less than 2% during that same period. Despite the progress made to retention rates of female learners between the ages of 16 to 18, female learners of this age cohort remain less likely to be enrolled in school or other educational institutions than their male piers.
Indicator 4.1: Reasons for not attending educational institutions amongst 7 to 18 year-olds not attending educational institutions
Description: This indicator describes the reasons given by 7 to 18 year-olds not attending educational institutions for their non-attendance using General Household Survey data.
Source: StatsSA, General Household Survey, 2002 – 2014.
Figure 5. 9: Percentage of youth aged 7 to 18 not attending educational institutions by their reasons for non-attendance
2002 2003 2004 2005 2006 2007 2008 2009 2010 2011 2012 2013No money for fees 38.8 39.5 35.1 34.4 35.2 32.2 26 27.9 31.2 26.8 25.1 25.3
Education is useless or uninteresting 12.8 9.4 11.8 12.8 14.2 15.1 12.2 14.8 9.3 13.1 11.3 12.1
Illness 8.2 8.3 12.1 9.2 9.3 10 12.3 5.4 4.4 4.8 5.3 4.5
Pregnancy 5.2 5.1 8.3 6.2 6.6 5.9 6.4 6.1 4.5 5 4.2 4.2
Family commitment 5.2 4.9 4.8 7.7 5.7 7.1 4.8 4.9 6.1 7.1 9 7.8
He/she is working (at home or job) 5 4.4 4.6 6.2 6.6 7.5 8 5.8 7.4 6.3 7.6 5.1
School/education institution is too far away 3.4 4 2 1.8 1.7 1.8 2 0.2 0.3 0.4 0.2 0.4
Failed exams 2.2 4.1 5.9 6.8 5.8 4.4 7.2 4.1 3.2 3.9 4.7 5.5
0
5
10
15
20
25
30
35
40

119 The Status of the Right to a Basic Education in South Africa: What indicators tell us
Figure 5.10: Reasons given by 7 to 18 year-old youth for not attending educational institutions, by gender in 2014
No money forfees
Pooracademic
performance
Familycommitments
Education isuseless
Illness anddisability
Completededucation
Working athome
Getting toschool Other
Male 22.9 21.4 1 11.6 13.2 8.3 9.1 0.6 12
Female 24 14.3 21.8 7.3 7.8 7.4 4.5 0.3 12.6
RSA 23.5 17.7 11.6 9.4 10.4 7.8 6.7 0.5 12.3
0
5
10
15
20
25
30
Male Female RSA
Indicator 4.1 shows that while money for school fees as a reason for not attending an educational institution has decreased between 2002 and 2013 from 38.8% to 25.3%, out-of-school children and youth continue to cite school fees as the primary reason for non-attendance. These substantial rates are despite the DBE’s school fee policy that was implemented during that time that declared all quintile 1 through 3 schools to be no fee schools. Feelings that education is useless or uninteresting, family commitments and failed exams have also continued to feature prominently as reasons for non-attendance at school with 12.1%, 7.8% and 5.5% of 7 to 18 year-olds out of school respectively for those reasons in 2013. Following school fees, being out of school due to illness dropped the most between 2002 and 2013, with 8.2% of youth citing illness as the reason for being out of school in 2002 prior to peaking at 12.3% in 2008 and then dropping to 4.5% in 2013. Failing exams and family commitments increased the most in terms of their proportion of reasons cited for not attending educational institutions, with 5.5% of out-of-school 7 to 18 year-olds citing failed exams as the reason for non-attendance in 2013, up from 2.2% in 2002, though down from its 2008 peak of 7.2%. Family commitment fluctuated over this time from 5.2% in 2002 to 7.8% in 2013.
This indicator further identifies that reasons for non-attendance amongst 7 to 18 year-olds differs between male and female youth with males far more likely to not attend school due to poor academic performance, a feeling that education is useless and the need to work while females are far more likely to discontinue their education due to family commitments.
Indicator 5: Enrolment in select grades
Description: This indicator tracks enrolment using DoE and DBE administrative statistics taken from SNAP Survey data from 2002 to 2014.
Data Source: DoE and DBE, Education Statistics in South Africa at a Glance and School Realities 2002 - 2013
Figure 5.11: Enrolment in selected grades
2002 2003 2004 2005 2006 2007 2008 2009 2010 2011 2012 2013 2014Grade 2 1012892 1111858 1109201 1118690 1081652 1050103 1031821 1004311 994410 1003353 1074788 1116427 1149894
Grade 7 958932 987876 1050554 972542 872051 896138 964345 970902 980747 941291 912528 902099 875311
Grade 10 876175 1096214 1057935 1069494 1093297 1115961 1076527 1017341 1039762 1094189 1103495 1146285 1139872
Grade 12 486786 475069 505392 538909 568664 625809 595216 602661 579384 534498 551837 597196 571819
0200000400000600000800000
100000012000001400000
Indicator 5 details the failure of the education system to keep learners enrolled through Grade 12. These enrolment figures show an increase in Grade 10 learners between 2002 and 2014,

120 Realising the Right to a Basic Education in South Africa
which is mostly attributable to increases in grade repetition for Grade 10 learners. Grade 12 enrolment, however, has maintained a largely steady rate with slightly over half of the numbers of learners in Grade 10 progressing on to Grade 12. Grade 7 enrolment figures are also less than the number of Grade 2 enrolments five-years prior, indicating that many learners are repeating grades between Grade 2 and the final year of primary school or exiting the schooling system prior to completing primary school.
Special Needs Education
5 to 18 year-old learners with disabilities attending educational institutionsIndicator 6.1: Proportion of 5 year-old children with disabilities enrolled in educational
institutions by province
Description: This indicator measures the percentage of 5 year-olds with disabilities attend-ing educational institutions by dividing the number of 5 year-olds who have indicated that they are disabled and attending educational institutions by the total number of disabled 5 year-olds counted in the General Household Survey data.
Source: Stats SA, General Household Survey Data, calculated and published by the DBE in its Report on the Implementation of Education White Paper 6 on Inclusive Education, May 2014
Figure 5.12: Percentage of 5 year-old children with disabilities attending educational institutions
77.8 81.9 77.6 79.8
93.3
79.6
57.7
73.780.9 80.5
95.5
76.6
95.8
75.7
93.6
80.885.7 81.8
67.9
85.2
0
20
40
60
80
100
EC FS GP KZN LP MP NW NC WC RSA
2009 2013
Indicator 6.2: Proportion of 7 to 15 year-old children with disabilities attending educational institutions, by province
Description: This indicator measures the percentage of 7 to 15 year-olds with disabilities attending educational institutions by dividing the number of 7 to 15 year-olds who have indicated that they are disabled and attending educational institutions by the total number of disabled 7 to15 year-olds counted in General Household Survey data.
Source: Stats SA, General Household Survey Data, calculated and published by the DBE in its Report on the Implementation of Education White Paper 6 on Inclusive Education, May 2014
Figure 5.13: Percentage of 7 to 15 year-old children with disabilities attending educational institutions, by province
91.7 92.687.8
91.687.9
93.3
84.7
73.3
97.7
90.290.1 91.1
96.891.6
86.7
92.1
97.7
90.795.6
92.5
50556065707580859095
100
EC FS GP KZN LP MP NW NC WC RSA
2009 2013

121 The Status of the Right to a Basic Education in South Africa: What indicators tell us
Indicator 6.3: Proportion of 16 to 18 year-old youth with disabilities attending educational institutions, by province
Description: This indicator measures the percentage of 16 to 18 year-olds with disabilities attending educational institutions by dividing the number of 16 to 18 year-olds who have indicated that they are disabled and attending an educational institution by the total number of disabled 16 to 18 year-olds counted in General Household Survey data.
Source: Stats SA, General Household Survey Data, calculated and published by the DBE in its Report on the Implementation of Education White Paper 6 on Inclusive Education, May 2014
Figure 5.14: Percentage of 16 to 18 year-old youth with disabilities attending educational institutions, by province
42.8
70.174.2
40.9
67.8
100
15
0
72.4
53.3
34.5
88.8 92.1
74.2
43.9
58.5
78
49.2
87.6
70.3
0
10
20
30
40
50
60
70
80
90
100
EC FS GP KZN LP MP NW NC WC RSA
2009 2013
Indicator 6.4: Enrolment in Special Needs and Ordinary Schools by Special Needs Learners
Description: This indicator measures the number of special needs schools and special needs learners enrolled in ordinary and special needs schools.
Source: DoE and DBE, Education Statistics in South Africa, 2003 and 2013
Table 5.1: Enrolment in special needs and ordinary schools by learners with special needs
Prov
ince
Special Needs
Schools 2003
Special needs
schools 2013
Learners in Special
Needs Schools
2003
Learners in Special
Needs Schools
2013
Special Needs Learners in
Ordinary Schools 2003
Special Needs Learners in
Ordinary Schools in 2013
Special Needs Learners as % of total school
population in 2003
Special Needs Learners as % of total school
population in 2013
EC 43 42 8023 9165 809 28288 0.42% 1.98%
FS 21 21 4781 6036 15236 21330 2.86% 4.08%
GP 100 133 30631 42958 3901 4988 2.04% 2.21%
KZN 62 73 10578 17169 12578 9229 0.83% 0.92%
LP 23 34 5901 8598 436 2608 0.35% 0.65%
MP 18 20 2926 3818 432 2433 0.37% 0.59%
NW 40 32 3957 1691 0 2326 0.44% 0.51%
NC 9 10 1457 6764 1002 2209 1.21% 3.16%
WC 86 83 13776 20689 871 7291 1.51% 2.61%
RSA 402 444 82030 116888 25265 80702 0.89% 1.58%
This indicator seeks to measure the extent to which learners with special needs are attending educational institutions. Though figure 5.12 shows that rates of attendance are similar for 5 year-olds with and without special needs, 7 to 18 year-olds with special needs are less likely to

122 Realising the Right to a Basic Education in South Africa
be enrolled in educational institutions than non-special needs learners of that age bracket. In 2013, 92.5% of special needs learners aged 7 to 15 attended educational institutions compared to 98.8% of non-special needs learners of that age cohort. Only 70.3% of special needs learners between the ages of 16 ad 18 attended educational institutions compared to 86.1% of non-special needs learners of that age. These figures mean that at least 25,944 7 to 15 year-olds identified as disabled do not attend educational institutions.314 Moreover, the DBE’s enrolment statistics that show that learners with special needs accounted for 1.58% of the total school population in 2013 is troubling given that the 2011 census data estimates that approximately 5.8% of children between the ages of 5 and 18 have disabilities. The DBE estimates that this means that as many as 597,953 disabled learners either do not attend schools or are attending ordinary schools that may not have the ability to identify and address learner disabilities.315
Also of concern is the extent to which enrolment of special needs learners in special needs schools varies between provinces. Table 5.1 shows that in 2013 the Eastern Cape, Limpopo and Mpumalanga together enrolled roughly the same number of learners with special needs into special schools as the Western Cape, even though those three provinces together have learner populations of nearly four and a half times that of the Western Cape. That learners with certain disabilities are not able to access needed special schools in certain provinces is further demonstrated in the DBE’s Report on the Implementation of Education White Paper 6 on Inclusive Education. That report demonstrates that, among other things, the Eastern Cape enrols fewer blind and deaf learners in Special Needs schools, less than a third of learners suffering from mild to moderate intellectual disability and half as many learners suffering from severe to profound intellectual disability compared to the Western Cape, even though the Eastern Cape services almost double the learner population than the Western Cape.316
School FeesIndicator 7: The proportion of learners attending schools who do not pay school fees
Description: This indicator measures the progress that South Africa has made in terms of providing free access to education for South African learners attending schools by dividing the number of learners who indicated they attend schools and do not pay school fees by the total number of learners attending schools.
Source: Stats SA, General Household Survey, 2002 – 2014
Indicator 7.1: The proportion of 7 to 18 year-olds not attending school who list school fees as the reason for non-attendance
Description: This indicator compares the extent to which the DBE’s school-fee policies have impacted learners who indicate that they do not attend schools due to an inability to pay school fees.
Source: Stats SA, General Household Survey, 2002 – 2014
Figure 5.15: Percentage of 7 to 18 year-old learners who attend school and do not pay school fees
0102030405060708090
100
2002 2003 2004 2005 2006 2007 2008 2009 2010 2011 2012 2013 2014
Proportion of learners aged 5 years and older who attend schools and do not pay school fees
7 to 18 year-olds not in school who list school fees as reason for non-attendance
314 DBE. 2015. Report on the Implementation of Education White Paper 6 on Inclusive Education: An Overview of the Period: 2013 – 2015. Pretoria: Department of Basic Education. p 20.
315 Ibid., at p. 21.316 Ibid., at p. 12.

123 The Status of the Right to a Basic Education in South Africa: What indicators tell us
The DBE’s policy to expand no-fee schools to all quintile 1 through 3 schools has dramatically expanded access to no-fee primary and secondary schools and shows progress towards providing free and compulsory basic education to all. The expansion of no-fee schools correlates with higher enrolment rates amongst learners aged 16 to 18 years of age that occurred in 2007 and presumably affects the ability and likelihood that learners above the compulsory school-going age continue to reenrol schools. Figure 5.15, however, show that of the 7 to 18 year-olds who do not attend school, 23.5% continue to cite inability to afford school fees as the reason for non-attendance. Further investigation should therefore be undertaken to understand which learners are unable to attend school due to fees or other financial costs, such as school uniforms, transportation and school stationary costs and how policies may be advanced to better address the needs of youth who are out of school due to financial reasons.
TransportationIndicator 8: Rate of learners who walk for more than 60 minutes to their educational
institutions
Description: This indicator measures the extent to which provincial transportation policies ensure that learners who commute 5 kms or more to school have access to transportation. In 2003 and 2013 StatsSA measured the percentage of learners walking all the way, for more than 60 minutes, to their education institution by geographic location.
Source: StatsSA, Travel Survey, 2013
Figure 5.16: Percentage of learners who walk more than 60 minutes to their educational institutions
1.8 1.9
7
4.8
2.7 3
8.1
5.5
0
2
4
6
8
10
Metro Urban Rural RSA
2003 2013
Indicator 8.1: Percentage of learners who walk all the way to school whose travel time exceeds 60 minutes, by province.
Description: This indicator measures the percentage of learners who walk to school each day and whose travel time exceeds sixty minutes. According to Stats SA data, 63.4% of learners nationally walk to school as their main mode of transportation.
Source: Stats SA, Travel Survey, 2013
Figure 5.17: Percentage of learners who walk more than 60 minutes to an educational institution in 2013, by province
1.7
6.5
2.63.4
9.9
3.7 3.6 3.75 5.5
0
2
4
6
8
10
12
WC EC NC FS KZN NW GP MP LP RSA
Figures 5.16 and 5.17 show that many children, particularly in rural provinces such as the Eastern Cape, KZN and Limpopo, walk distances to school that likely exceed the 5kms that should qualify them for access to subsidised school transportation under the DBE’s general policy on school transportation. Learners in KwaZulu-Natal are by far the most likely to walk more than 60 minutes to school, with 9.9% of learners who walk to school walking more than 60 minutes

124 Realising the Right to a Basic Education in South Africa
in 2013. Nationally 5.5% of the 63.4% of learners who walked all the way to school in 2013 walked for more than 60 minutes. The DBE has emphasised that walking to school for long times has implications such as tiredness and safety along the route school and that although all provinces operate scholar transport programmes, a notable percentage of learners are still walking to school for long times.317 These figures do not include the large numbers of learners who walk more than 30 minutes to school. Nationally, approximately 10% of 5 to 6 year-olds, 13.5% of 7 to 15 year-olds and 21% of 16 to 18 year-olds walked more than 30 minutes to their educational institutions in 2013.318
Social Support Programmes for learners attending schoolsIndicator 9: The proportion of learners attending public schools who benefit from the
National School Nutrition Programme (NSNP), by province
Description: This indicator measures the percentage of learners who have indicated that they attend public schools that benefit from school nutrition programmes as a percentage of all public school learners.
Source: Stats SA, General Household Survey, 2010 – 2014
Figure 5. 18: Percentage of learners attending public schools who benefited from the School Nutrition Programme, by province
0.00%10.00%20.00%30.00%40.00%50.00%60.00%70.00%80.00%90.00%
100.00%
WC EC NC FS KZN NW GP MP LP RSA
2010 2011 2012 2013 2014
Indicator 9.1: The percentage of schools with a National School Nutrition Programme that serve a protein and fruit or vegetable every school day
Description: This indicator measures the extent to which schools that provide meals to learners through the National School Nutrition Programme comply with the programme’s mandate that all learners attending schools that benefit from the programme provide one meal each school day that includes a protein and a fruit or vegetable.
Source: DBE 2011 School Monitoring Survey
Figure 5. 19: Percentage of schools with an NSNP programme that serve a protein and fruit or vegetable every day of the week in 2011, by province
63
54
90
6976
97
69
79 787271
24
64
43 40
81
40
5954 54
48
70
89
8086
79 7681 83
73
0
10
20
30
40
50
60
70
80
90
100
EC FS GP KZN LP MP NC NW WC TOTAL
Serve Protein every day Serve fruit or vegetable ever day No missed feeding days
317 DBE. 2014. ‘General Household Survey (GHS) 2013 Report: Focus on Schooling.’ Pretoria: Department of Basic Education. Pretoria. p 43. Available at http://www.education.gov.za/DocumentsLibrary/Reports/tabid/358/Default.aspx
318 Ibid.

125 The Status of the Right to a Basic Education in South Africa: What indicators tell us
According to the DBE, the NSNP reached an average of 8 827 419 learners in 19 877 quintile 1, 2 and 3 schools during the 2013/2014 financial year. The National School Nutrition Programme (NSNP) provides free meals to learners attending quintile 1 through 3 schools. Under the programme, provinces are required to provide learners with nutritious meals consisting of protein and fruits or vegetables five times per week. While this indicator shows that the School Nutrition Programme has steadily improved to now benefit approximately 75% of learners in public schools, many schools are not complying with all of the programme’s mandate. According to the 2011 School Monitoring Survey, 23% of schools missed feeding days, 46% did not serve a fruit or vegetable every day and 28% did not serve a protein every day as required by the programme.
Indicator 9.2: The percentage of individuals aged 5 years and older who attend school and receive child support grants
Description: This indicator measures the percentage of individuals aged 5 years and older who attend school and receive child support grants using General Household Survey data. The data show an increase in access to social support grants for learners in school since 2003 that is largely attributable to the expansion of the qualifying ages for the child support grant programme. Access to social support is important within the context of education because it provides a critical contribution to ensuring that learners are financially supported while they are attending schools. This support increases the likelihood that learners will be able to access school uniforms and transportation, as well as has been shown to increase the likelihood that learners will begin to access educational institutions at a younger age and stay in school longer.
Source: Stats SA, General Household Survey, 2003 – 2013
Figure 5.20: Percentage of individuals aged 5 years and older who attend school and receive child support grants
2003 2004 2005 2006 2007 2008 2009 2010 2011 2012 2013RSA 4 12.2 20.5 25.7 30.1 32 39.8 44.9 47.8 52.1 54.8
0
10
20
30
40
50
60
Figure 5.20 shows that access to child support grants for children aged 5 years and older who attend schools has steadily increased between 2003 and 2013. 54.8% of children aged 5 years and older who attend schools received a child support grant in 2013, up from just 4% in 2003.
Corporal PunishmentIndicator 10: Percentage of learners who experienced corporal punishment at school
Description: This indicator measures the percentage of learners who experience corporal punishment while at school by dividing the number of learners, using GHS data, who have experienced corporal punishment at school by the total number of learners attending schools.
Source: Stats SA, General Household Survey Data, 2009 - 2013

126 Realising the Right to a Basic Education in South Africa
Figure 5.21: Percentage of learners who experienced corporal punishment at school, by province
KZN EC FS LP NC NW GP MP WC RSA2011 22.5 29.9 21.1 19.2 15.9 17.1 5.9 6.7 3.5 16.72012 21.4 30.3 18.4 14.9 11.2 15.5 4.6 11.5 4.5 15.82013 22.2 24.1 16.6 10.9 10 11.5 3.4 10.3 1.4 13.52014 22.1 21 11.6 12 11.9 10.5 3.3 5.8 2.8 12.4
05
101520253035
South African law prohibits teachers from using corporal punishment against learners. This indicator shows that such unlawful conduct continues in many schools, particularly in the more rural provinces. Figure 5.21, however, shows that incidents of corporal punishment have declined since 2011 by nearly 25% nationally. The Free State shows the greatest reduction in terms of learners who have reported incidents of corporal punishment with 11.6% of learners reporting having experienced corporal punishment at school, down from 19.2% in 2011. Kwazulu-Natal and the Eastern Cape show the highest rates of corporal punishment while the Western Cape and Gauteng show the lowest rates with 2.8% and 3.3% of learners reporting having experienced corporal punishment at school, respectively.
5.2. Adequacy Indicators
TeachersIndicator 11.1: Learner-to-educator ratios by province
Description: This indicator measures the learner-to-educator ratios in each province by dividing the total number of learners enrolled in schools in each province by the total number of educators employed in each province. The indicator uses DoE and DBE administrative data for leaner enrolment and educator employment numbers.
Source: DoE South African Education Stats at a Glance, 2002 and DBE School Reali-ties 2014
Figure 5.22: Learner-to-educator ratios in public ordinary schools, by province
31.8
31.6 33
.2
37.4
32.9
36.3
30.1
30.6
36.3
33.8
30.8
27.8
32 31.3
30.4
30.8 32
.1
31.4
31.8
31
32.9
29.6
35.5
32.9
31.1 32
.1 34.4
33.4
37.7
33.2
0
5
10
15
20
25
30
35
40
EC FS GP KZN LP MP NW NC WC RSA
2002 2014 2014 state-paid learners per educator
Indicator 11.1.1: Number of schools that have learner-to-educator ratios of greater than 40:1
Description: This indicator measures the number of schools that are staffed with learner to educator ratios that are greater than 40:1. The DBE has set out in various policy documents, as well as the Norms and Standards for School Infrastructure that maximum class size should be no larger than 40 learners.

127 The Status of the Right to a Basic Education in South Africa: What indicators tell us
This indicator measures the extent to which schools have not been allocated sufficient numbers of teaching posts or have been unable to fill vacant posts resulting in learner : educator ratios that are insufficient to ensure compliance with maximum classroom size norms.
Source: DBE, School Realities, 2011 – 2014
Figure 5.23: Number of schools with learn-to-teacher ratios greater than 40 : 1
1878 18502315 2632
0
500
1000
1500
2000
2500
3000
2011 2012 2013 2014
Figures 5.23 and 5.24 show that even though all provinces have learner : educator ratios which do not exceed 32 : 1, teacher post provisioning inefficiencies appear to be getting worse with 2,632 schools having learner : teacher ratios of greater than 40 : 1. Another concern with respect to learner : teacher ratios is the adequate supply of classrooms at schools. Accordingly, even if schools are supplied with learner : teacher ratios that are less than 40 :1, classroom sizes could exceed forty learners per class if there is insufficient classroom space to enable all teachers to teach at the same time.
Indicator 11.2: Proportion of educator posts that are vacant
Description: This indicator measures the percentage of educator posts that are vacant in each province using data obtained from the School Monitoring Survey conducted in 2011. The standard is that 100% of state-paid teaching posts should be filled at each school. The School Monitoring Survey defined a vacancy as a permanent position that is not filled. Posts that are filled by temporarily employed educators are still considered vacant posts.
Source: DBE, School Monitoring Survey, 2011
Indicator 11.2.1: The proportion of maths teacher posts that are vacant by province and school phase
Description: The School Monitoring Survey found that most vacancies at the subject level were for Maths and Physical Science teachers. This indicator measures the percentage of mathematics educator posts that are vacant as a percentage of total mathematics posts in each province and school phase.
Source: DBE, School Monitoring Survey, 2011
Figure 5. 24: Percentage of total educator posts and mathematics teaching posts vacant in 2011, by province and school phase
0
5
10
15
20
25
30
35
40
EC FS GP KZN LP MP NC NW WC Total
Total Vacant Posts Foundation Phase Maths Vacanies Intermediate Phase Maths Vacancies
Senior Phase Maths Vacancies FET Phase Maths Vacancies

128 Realising the Right to a Basic Education in South Africa
Figure 5.24 shows that all provinces suffer from vacant teacher posts. The Eastern Cape, Gauteng and Northwest provinces have the highest percentage of vacant total teacher posts. Senior Phase mathematics classes have the highest vacancy rates with the Northern Cape, Western Cape and Free State suffering from vacancy rates exceeding 30%. Nationally, approximately 15% of all mathematics teacher posts are vacant, indicating that a critical need exists for qualified mathematics teachers. As discussed in the teacher training section above, high rates of mathematics vacancies make it more likely that schools will hire teachers to teach maths who are not appropriately trained to teach the subject.
Surveys of principals undertaken during the administration of TIMSS examinations asked principals whether mathematics teacher vacancies were “somewhat” or very difficult to fill. The figure below shows that Gauteng, Limpopo, Mpumalanga and Northwest Provinces had the most difficulties filling mathematics teaching posts. In 2011, 56% of learners in schools in Gauteng, 57% of learners in Limpopo, 51% of learners in Mpumalanga and 58% of learners in Northwest Provinces attended schools that found it somewhat or very difficult to fill mathematics teaching posts.
Figure 5.25: Percentage of learners in schools where mathematics vacancies were “somewhat” or “very” difficult to fill in 2011
34% 32% 30%42%
32%23%
32%22% 28%
6% 9% 10%
14%17%
17%
25%29%
30%
0%
10%
20%
30%
40%
50%
60%
70%
NC KZN WC GP EC FS LP MP NW
Somewhat difficult to fill Very difficult to fill
Source: TIMSS 2011. Data calculated by DBE in DBE. 2013. Macro Indicator Report. Department of Basic Education.
Pretoria. October 2013., at p. 66.
Indicator 11.3: Percentage of teachers who fulfil minimum qualifications
Description: This indicator measures the percentage of educators employed by public ordinary schools who satisfy minimum qualification standards. The Criteria for the Recognition and Evaluation of Qualifications for Employment in Education, based on the Norms and Standards for Educators, specifies that an educator is considered to be appropriately qualified if he/she obtained a Senior Certificate at the end of Grade 12 and thereafter a minimum of three years of appropriate training. New teachers entering the teaching force are now required to complete a four year Bachelor of Education Degree or complete an appropriate first degree plus a one-year Advanced Diploma in Education.
Source: DBE, Trends in Education Macro Indicators Report, at p. 65, Institute of Race Relations, 2014/15 South Africa Survey at p. 42.
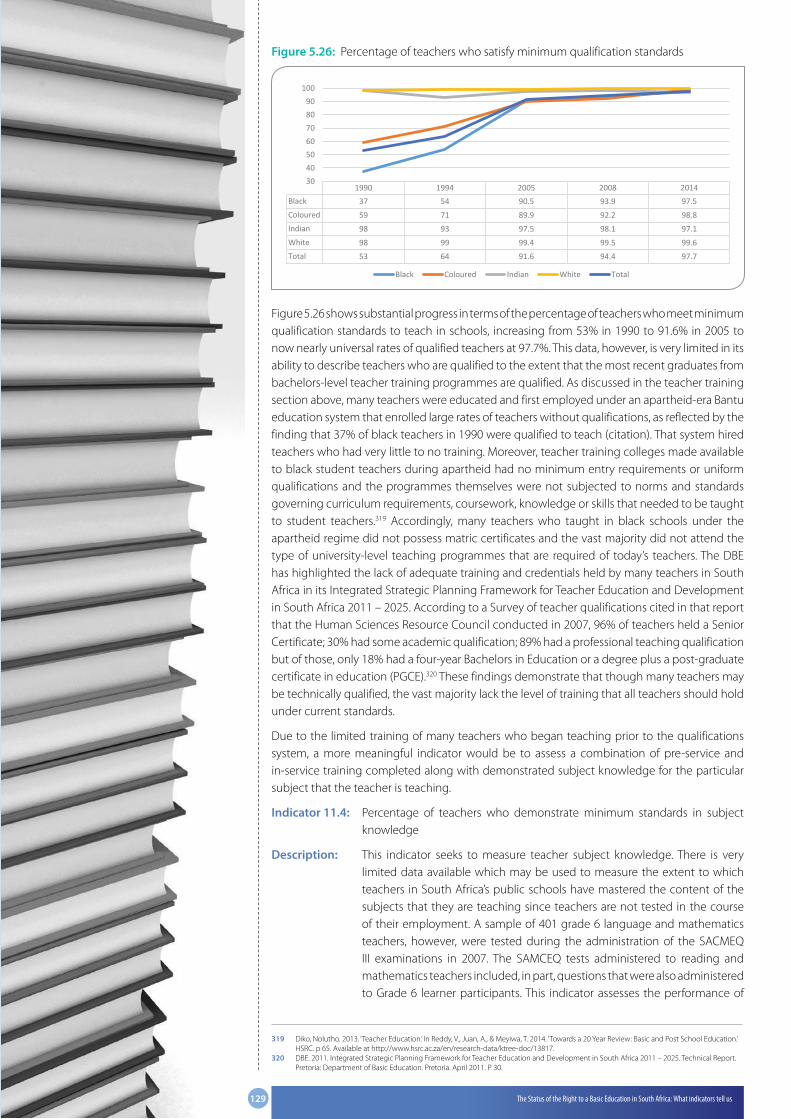
129 The Status of the Right to a Basic Education in South Africa: What indicators tell us
Figure 5.26: Percentage of teachers who satisfy minimum qualification standards
1990 1994 2005 2008 2014Black 37 54 90.5 93.9 97.5Coloured 59 71 89.9 92.2 98.8Indian 98 93 97.5 98.1 97.1White 98 99 99.4 99.5 99.6Total 53 64 91.6 94.4 97.7
30405060708090
100
Black Coloured Indian White Total
Figure 5.26 shows substantial progress in terms of the percentage of teachers who meet minimum qualification standards to teach in schools, increasing from 53% in 1990 to 91.6% in 2005 to now nearly universal rates of qualified teachers at 97.7%. This data, however, is very limited in its ability to describe teachers who are qualified to the extent that the most recent graduates from bachelors-level teacher training programmes are qualified. As discussed in the teacher training section above, many teachers were educated and first employed under an apartheid-era Bantu education system that enrolled large rates of teachers without qualifications, as reflected by the finding that 37% of black teachers in 1990 were qualified to teach (citation). That system hired teachers who had very little to no training. Moreover, teacher training colleges made available to black student teachers during apartheid had no minimum entry requirements or uniform qualifications and the programmes themselves were not subjected to norms and standards governing curriculum requirements, coursework, knowledge or skills that needed to be taught to student teachers.319 Accordingly, many teachers who taught in black schools under the apartheid regime did not possess matric certificates and the vast majority did not attend the type of university-level teaching programmes that are required of today’s teachers. The DBE has highlighted the lack of adequate training and credentials held by many teachers in South Africa in its Integrated Strategic Planning Framework for Teacher Education and Development in South Africa 2011 – 2025. According to a Survey of teacher qualifications cited in that report that the Human Sciences Resource Council conducted in 2007, 96% of teachers held a Senior Certificate; 30% had some academic qualification; 89% had a professional teaching qualification but of those, only 18% had a four-year Bachelors in Education or a degree plus a post-graduate certificate in education (PGCE).320 These findings demonstrate that though many teachers may be technically qualified, the vast majority lack the level of training that all teachers should hold under current standards.
Due to the limited training of many teachers who began teaching prior to the qualifications system, a more meaningful indicator would be to assess a combination of pre-service and in-service training completed along with demonstrated subject knowledge for the particular subject that the teacher is teaching.
Indicator 11.4: Percentage of teachers who demonstrate minimum standards in subject knowledge
Description: This indicator seeks to measure teacher subject knowledge. There is very limited data available which may be used to measure the extent to which teachers in South Africa’s public schools have mastered the content of the subjects that they are teaching since teachers are not tested in the course of their employment. A sample of 401 grade 6 language and mathematics teachers, however, were tested during the administration of the SACMEQ III examinations in 2007. The SAMCEQ tests administered to reading and mathematics teachers included, in part, questions that were also administered to Grade 6 learner participants. This indicator assesses the performance of
319 Diko, Nolutho. 2013. ‘Teacher Education.’ In Reddy, V., Juan, A., & Meyiwa, T. 2014. ‘Towards a 20 Year Review: Basic and Post School Education.’ HSRC. p 65. Available at http://www.hsrc.ac.za/en/research-data/ktree-doc/13817.
320 DBE. 2011. Integrated Strategic Planning Framework for Teacher Education and Development in South Africa 2011 – 2025. Technical Report. Pretoria: Department of Basic Education. Pretoria. April 2011. P 30.

130 Realising the Right to a Basic Education in South Africa
reading and mathematics levels by wealth quartile and province against subject knowledge results of teachers from other SACMEQ countries.
Source: Spaull, N. 2012. SACMEQ at a glance series. Research on Socio-economic Policy (RESEP). Available: http://resep.sun.ac.za/index.php/projects/
Figure 5.27: Teacher performance on SAMCEQ III Mathematics and Reading Subject Tests
726828
764 814730
804 758 748
400
600
800
1000
SA poorest 25% SA wealthiest 25% SA Average SACMEQ Average
Mathematics teacher content knowledge Reading teacher content knowledge
Figure 5.28: SACMEQ III reading teacher scores
673 71
8
720
721
722
727
739
758
758
768
769
792
795
831
748
500600700800900
Figure 5.29: SACMEQ III mathematics teacher scores
685 73
9
740
745
762
764
771
780
811
824
826
833
852
906
814
500600700800900
1000
While Indicator 11.3 shows that South Africa has made great strides in terms of having a formally qualified teaching force, teacher subject knowledge suffers from substantial backlogs. The DBE stressed in its Action Plan to 2019 report that teacher subject knowledge is an indicator of great strategic importance, but that it is also the indicator for which there is the least data. That report, relying mainly on teacher scores from the SACMEQ III mathematics teacher test, estimated that 41% of teachers tested demonstrated minimum subject knowledge.321 There, the DBE used an analysis of the correlation between learner results, the percentage of learners achieving acceptable standards and teacher test results to arrive at a ‘pass mark’ for teachers of 793, which 41% of mathematics teachers attained on the 2007 SACMEQ III teacher evaluation. The below figure shows that provincial scores varied greatly in terms of the ability of participating Grade 6 math teachers to reach the DBE’s pass mark with teachers in Mpumalanga and Limpopo scoring particularly low.
1526
38 40 42 46 50 5371
41
0
50
100
MP LP EC FS KZN NW NC GP WC RSA
Percentage of teachers who demonstrated minimum subject knowledge on the SACMEQ III teacher numeracy examination, by province
Source: SACMEQ III Data. Calculated by DBE in Action Plan to 2019, at p. 68.
321 DBE. 2015. ‘Action Plan to 2019 Towards the Realisation of Schooling 2030.’ Pretoria: Department of Basic Education. p 64. Available at http://www.education.gov.za/LinkClick.aspx?fileticket=HHmKnb78Z7Q%3D&tabid=54&mid=1167

131 The Status of the Right to a Basic Education in South Africa: What indicators tell us
Figures 5.28 and 5.29 show that South Africa scored low on the 2007 SACMEQ teacher evaluations when compared to other SACMEQ countries with mathematics teachers ranking 9th out of the 14 SACMEQ countries and language teachers ranking 7th out of 14. These low rankings are particularly concerning given that South Africa has the highest proportion of teachers with a degree and the second highest average years of teacher training among its teacher force when compared to other SACMEQ countries, leading the DBE to question the quality of pre-service and in-service teacher training.322
SACMEQ III results show that teachers teaching the poorest 25% of learners fell well below the DBE’s 793 ‘pass mark’, averaging 726 and 730 on mathematics and reading while teachers teaching the wealthiest quartile of learners averaged 828 and 804 in those subjects. Spaull has further emphasised these distinguishing results amongst teachers who teach poor learners and those who teach the wealthiest learners, finding that accounting for the median scores of teachers in each wealth quintile, mathematics teachers who taught the poorest quintile learners answered nearly half as many questions (37%) correctly on the SACMEQ III teacher mathematics examination as teachers who taught the wealthiest quintile of learners (71%).323 The DBE has further highlighted that math teachers in Mpumalanga, the Eastern Cape and Limpopo performed at exceptionally poor levels, with only 4.5%, 11.5% and 16.2% of math teachers tested in those provinces reaching the highest competency level compared to 59% of teachers in the Western Cape. These findings highlight the need for high quality professional development to be made available for teachers in those provinces.324
Indicator 11.5: Average number of hours spent by educators on professional development activities, by province and quintile
Description: Under their performance contracts, teachers are required to spend a minimum of 80 hours per school year on professional development. According to the Education Labour Council Resolution no. 7 of 1998 on the Workload of Educators, educators are required by law to attend programmes for ongoing professional development outside of the formal school day or during school vacation. This indicator measures the extent to which teachers comply with their professional development obligations through data collected in the 2011 School Monitoring Survey. The School monitoring survey was conducted between October and November 2011, after three-quarters of the year had passed, so the standard assessed during the survey was whether teachers had completed 60 hours of professional development activities.
Source: DBE, 2011 School Monitoring Survey
Figure 5.30: Average number of reported hours spent by educators on professional development activities from January to September 2011, by province
31
43.835.9
41.830.2
36.744.4 43.2
60
38.1
0
20
40
60
80
EC FS GP KZN LP MP NC NW WC Total
322 DBE. 2013. Macro Indicator Report. Pretoria: Department of Basic Education. p 63.323 Spaull, N. 2013. South Africa’s Education Crisis: The quality of education in South Africa 1994-2011. Centre for Development and Enterprise.
Johannesburg. October 2013. p 26. Available at324 DBE. 2015. Action Plan to 2019: Towards the Realisation of Schooling 2030. Pre 29 – 30.

132 Realising the Right to a Basic Education in South Africa
Figure 5.31: Hours spent by educators on professional development activities from January - September 2011, by province
178 11 9
22 197 12 6 13
3231
35 36
4030
2430
22
33
912
8 10
6
9
10
10
14
92
3 3 4
26
3
24
37
10 8 108
11
8
1014
9
34 36 35 3223 27
4836 40 32
0102030405060708090
100
EC FS GP KZN LP MP NC NW WC RSA
0 hours 1-29 hours 30-59 hours 60-79 hours 80+ hours Unspecified/Missing
Figure 5.32: Average number of reported hours spent by educators on professional development activities from January to September 2011, by quintile
35 35.1 36.8 40.9 45.838.1
01020304050607080
Quinitle 1 Quintile 2 Quintile 3 Quintile 4 Quintile 5 Total
Figure 5.33: Hours spent by educators on professional development activities from January - September 2011, by school quintile
14 15 14 11 9 13
36 33 32 31 33 33
8 8 8 9 14 93 4 3 3
4 38 8 8 10
12 9
32 33 34 36 27 32
0
20
40
60
80
100
Quinitle 1 Quintile 2 Quintile 3 Quintile 4 Quintile 5 RSA
0 hours 1-29 hours 30-59 hours 60-79 hours 80+ hours Unspecified/Missing
Figure 5.30 shows that only teachers in the Western Cape, on average, fulfilled their in-service training obligations from January to September 2011. Teachers in Limpopo and the Eastern Cape completed the fewest average number of in-service training hours, with teachers in those provinces only completing, on average, half of the sixty hours of training expected of them by September of the school year. Shortcomings in the completion of in-service training correlates strongly with school poverty quintiles, with teachers in quintile 1 schools completing on average 35 hours of in-service training and teachers at quintile 5 schools completed on average 45.8 hours of in-service teacher training between January and September of the 2011 school year. Figure 5.33, however, shows that amongst all quintiles many teachers completed fewer than half of the expected 60 hours of training with 58% of responding quintile 5 teachers having completed 29 or fewer hours and 72% of responding quintile 1 teachers having completed zero or fewer than 29 hours of training. The DBE has additionally highlighted that this data further shows that half of the educators responding to the survey completed 12 hours or fewer.325
Figure 5.31 shows that nationally, 13% of teachers reported having completed zero hours of professional development training with 22% of teachers in Limpopo, 19% of teachers in
325 DBE. 2015. Action Plan to 2019 Towards the Realistion of Schooling 2030. Pretoria: Department of Basic Education. p 42.

133 The Status of the Right to a Basic Education in South Africa: What indicators tell us
Mpumalanga and 17% of teachers in the Eastern Cape reporting having completed zero hours of training in 2011. These findings are concerning since these were also the provinces that the DBE noted as performing exceptionally poorly on the SACMEQ III teacher assessments. The Western Cape, Northern Cape and the Free State performed the best in this regard with 6%, 7% and 8% of teachers respectively reporting having spent zero hours that year on professional development. Of additional concern, however, is the large number of teachers in the survey who failed to specify the number of professional development hours completed. The inability of the survey to capture complete responses on this indicator highlights the need for the DBE, provinces and SACE to improve their professional development reporting and monitoring systems to accurately track the extent to which teachers are fulfilling their in-service training mandates.
Of the teachers that did undertake professional development training, an average of 42% of teachers nationally reported that their training had no or little impact on their teaching practices while only 7% of the teachers surveyed reported feeling that their professional development activities had a moderate to large impact on their practices.326 50% of teachers surveyed, however, during the 2011 School Monitoring Survey did not specify the impact that their in-service training programmes had on their teaching practices.
South Africa’s Auditor-General recently emphasised findings of widespread shortcomings in teacher curriculum and professional development training in its 2013-2014 Education Sector Report. That report found that in 2013, according to reports submitted by provincial education departments, only 178,676 out of 425,023 teachers, school managers and subject advisers received curriculum and professional development training and that teachers in the Eastern Cape and KwaZulu-Natal recorded high percentages of underachievement in teacher training. The Auditor-General concluded that the implication of these findings is that very large numbers of teachers are not meeting the condition of their service that requires all teachers to complete 80 hours of development training each year. The report further emphasised that there was also no evidence that even the teachers who had attended training programmes met the required 80 hours of training.327
Indicator 11.6: Educators absent from school or not at school on an average school day, by province and quintile
Description: This indicator measures the extent to which teachers are absent from school or not at school on an average day using findings from the DBE’s 2011 School Monitoring Survey. Teachers were considered absent if they had not signed the Educator Attendance Register and were not on maternity leave, a school excursion or away from school on official work. “Not at school” refers to teachers who are absent or not present due to pre-arranged school excursions, learner extra-curricular activities and official school work. The School Monitoring Survey did not consider whether substitute educators were in place for learners whose educators were absent from school. Nor did it assess whether educators “not at school” had prior permission or whether their official business was legitimate. Data for this indicator was collected by fieldworkers during the course of the 2011 School Monitoring Survey from reviewing the educator attendance register and interviewing the school principal about the educators who were absent that day and reason for absence.
Source: DBE, 2011 School Monitoring Survey
326 DBE. 2013. School Monitoring Survey (DBE013, Conducted in 2011) Technical Report. Pretoria: Department of Basic Education. p 41.327 Auditor-General South Africa. 2013-2013 Education Sector Report. July 2015. p 34. Available at https://www.agsa.co.za/Documents/
Valueaddingauditreports/Specialauditreports.aspx

134 Realising the Right to a Basic Education in South Africa
Figure 5.34: Educators absent from school or “not at school” on an average day, by province
EC FS GP KZN LP MP NC NW WC Total% Absent on average day 6.5 4.9 5.7 8.2 5.2 5.7 4.5 6 3.4 6.1% not at school on an average day 8.78 5.43 6.04 9.75 6.93 6.42 5.14 6.86 3.71 7.34% of Schools with 10% or more educators
absent on an average day 26 14 22 37 20 19 17 26 8 25
0
5
10
15
20
25
30
35
40
Figure 5.35: Percentage of educators absent from school or “not at school” on an average school day, by school quintile
1 2 3 4 5 Total% Absent on an average day 6.8 6.2 6.5 6.2 4.1 6.1% not at school on an average day 9.13 7.94 8.04 6.77 4.93 7.65
% of Schools with 10% or moreeducators absent on an average day 27 25 27 23 15 25
0
5
10
15
20
25
30
Figures 5.34 and 5.35 show that approximately 7.34% of teachers are not in school on a given day and that of those, 6.1% of teachers are absent each day for reasons other than maternity leave, a school excursion or away from school on official work. KwaZulu-Natal and the Eastern Cape report the highest rates of teachers not being in attendance on a given day with 9.75% and 8.78% of teachers estimated as not being at school on a given day for reasons other than maternity leave, 8.2% and 6.5% of which were absent for reasons other than maternity leave, a school excursion or official business. The Western Cape, Northern Cape and Free State had the lowest rates of teachers not at school. KwaZulu-Natal also suffered from the highest rate of schools that have more than 10% of teachers absent on an average day with an estimated 37% of schools exceeding this threshold that was specifically pointed out as needing to be addressed by the Human Sciences Research Council in its 2010 report on its investigation into educator leave discussed in the policy section above. Nationally, 25% of schools in South Africa have 10% or more of their teachers absent on an average school day.
These results also show differences in teacher absenteeism rates amongst schools in different wealth quintiles with quintile 1 schools having nearly twice as many teachers not at school on an average day as quintile 5 schools. 9.13% of teachers in quintile 1 schools were not at school on a given day, 6.8% of whom were considered absent, versus 4.93% of teachers in quintile 5 schools were not at school on a given day, 4.1% of whom were considered to be absent. Moreover, 27% of quintile 1 schools had more than 10% of their teachers absent on a given day whereas 15% of quintile 5 schools had more than 10% of their teachers absent.
These data show that provinces and quintiles with higher rates of teachers who were absent, meaning they were absent for reasons other than maternity leave, also had higher rates of teachers out of school due to pre-arranged school excursions, learner extra-curricular activities and official school work. The Western Cape, for instance, which had the lowest rate of teachers absent, only had .31% of teachers out of school for school or work-related business while KwaZulu-Natal and the Eastern Cape, which had the two highest rates of teachers who were absent, also had the highest rates of teachers out of school for school or work-related reasons. Quintile 1 schools had 2.33% of teachers not in school due to work-related reasons while .57%

135 The Status of the Right to a Basic Education in South Africa: What indicators tell us
of quintile 4 and .83% of teachers in quintile 5 schools were not in school due to work-related reasons. The correlation of teachers not in school for work-related reasons amongst provinces and quintiles with higher or lower rates of absenteeism raises concern over the legitimacy and necessity of the leave.
The most commonly reported reason for teachers being absent from school was sick or incapacity leave, with 2.8% of teachers nationally reporting absent on a given day for that reason. The only province that exceeded this rate was Kwazulu-Natal, which had 3.9% of teachers reporting being absent on a given day due to sick or incapacity leave. The second most commonly reported reason for teacher absenteeism was study leave, with 1.6% of teachers having reported absent on a given day for that reason.
Curriculum CoverageIndicator 12.1: Written language and mathematics exercises completed per week in grades
6 and 9 by province and quintile
Description: This indicator measures the extent to which learners are progressing through the curriculum using findings taken from the DBE’s 2011 School Monitoring Survey that assessed whether learners in Grades 6 and 9 had completed a minimum of four written language and maths exercises a week. The School Monitoring Survey measured curriculum coverage by reviewing written exercises completed in learner exercise books.
Source: DBE 2011 School Monitoring Survey Technical Report, at p. 86 – 88
Figure 5.36: Average number of written language and mathematics exercises completed per week in grades 6 and 9 in 2011, by province
0
0.5
1
1.5
2
2.5
3
3.5
4
EC FS GP KZN LP MP NC NW WC Total
Gr 6 Language Grade 6 Maths Grade 9 Language Grade 9 Maths
Figure 5.37: Percentage of Grade 6 and 9 learners who complete a minimum of 4 language and mathematics exercises a week, by quintile
3 4 6 82126 29 32
38 35
0 0 0 1 35 3 7 616
0
20
40
60
80
100
Quintile 1 Quintile 2 Quintile 3 Quintile 4 Quintile 5
Gr 6 Language Grade 6 Maths Grade 9 Language Grade 9 Maths
Findings from the 2011 School Monitoring Survey demonstrate that curriculum coverage is below the expected threshold of four language and mathematics exercises completed each week amongst all provinces and quintiles. The DBE’s School Monitoring Survey Technical Report points out that these findings support other research which found that slow pacing is common in South Africa’s classrooms and is consistent with research that found a predominance of oral rather than written exercises in classrooms. Among provinces, schools in the Western Cape

136 Realising the Right to a Basic Education in South Africa
completed the most mathematics and language exercises, having completed on average 2.3 Grade 6 mathematics, 3.2 Grade 6 Maths, 1 Grade 9 Language and 2.2 Grade 9 Maths exercises per week. Schools in the Eastern Cape completed the fewest number of exercises.
The School Monitoring Survey further found that nationally, only 7% of Grade 6 learners completed a minimum of 4 language exercises a week while 31% completed a minimum of 4 mathematics exercises a week. Amongst Grade 9 learners, fewer than 1% demonstrated that they had completed 4 mathematics exercises a week while 6% completed a minimum of 4 mathematics exercises per week. These findings show that the pace of curriculum coverage appears to slow dramatically between Grades 6 and 9, a tendency that further disadvantages learners in lower quintile schools who fall further behind their wealthier counterparts.
The DBE has acknowledged that this data is extremely limited in terms of the extent to which it is capable of monitoring curriculum progression since simply counting the number of exercises completed does not account for the complexity and length of the exercises or the quality of work that went into teaching and completing the exercises. Due to the very low rates of exercise completion found in the School Monitoring Survey even in better performing provinces, the DBE further analysed the data to account for learners that it found to be putting in at least a basic minimum level of effort, which it defined as the typical number of exercises completed in historically better performing formerly ‘white’ and ‘Indian’ schools. The number of exercises completed, which the DBE has acknowledged are arguably low328, include, for instance, minimum benchmarks for Grade 6 language of just six language exercises per month and seven mathematics exercises per month for Grade 9 learners. They do, however, indicate levels of inequality in curriculum coverage between the provinces.
Figure 5.38: Percentage of learners reaching the minimum benchmark for exercises completed per month in 2011
0
10
20
30
40
50
60
70
80
90
100
EC FS GP KZN LP MP NC NW WC SA
Gr 6 Language Gr 6 Math Gr 9 Language Gr 9 Math Average
Source: DBE 2011 School Monitoring Survey data calculated by DBE. 2013. Detailed Indicator Report for the Basic
Education Sector. Available at http://www.education.gov.za/researchreports/tabid/708/Default.aspx, at p. 37
Figure 5.38 shows that nationally, 53% of learners completed the minimum benchmark grade 6 and 9 language and mathematics exercises per month. The rates of learners meeting or exceeding the minimum benchmark varied to a large degree between provinces with only 24% of learners in the North West and 27% of learners in the Eastern Cape meeting the minimum benchmark as defined above. Gauteng and the Western Cape had the highest rates of learners meeting the minimum benchmark with 85% of learners in Gauteng and 76% of learners in the Western Cape meeting or exceeding the benchmark based on the median number of exercises completed in historically better performing schools.
Learning and teaching support materialsIndicator 13.1: The proportion of learners with his or her own textbook for each subject for
the entire school year
Indicator 13.2: The proportion of learners with access to required workbooks
328 DBE. (2015). Action Plan to 2019: Towards the realization of school 2030. Pretoria. At p. 44.

137 The Status of the Right to a Basic Education in South Africa: What indicators tell us
Description: This indicator seeks to measure the extent to which learners have been able to access required textbooks and workbooks for the whole school year. South Africa’s policies governing Learning and Teaching Support Materials mandate that all learners should have his or her own textbook for each subject and that two workbooks should be provided to all learners attending grades R through 9 for each subject. This indicator is consistent with the DBE’s Goal 19 stated in its Action Plan 2014 and Action Plan 2019 which is to ensure that every learner has access to the minimum set of textbooks and workbooks required according to national policy. Grade 6 access to textbooks was assessed during the SACMEQ II and SACMEQ III examinations conducted in 2000 and 2007. The DBE also collected data during its 2011 School Monitoring Survey indicating the percentage of Grade 6 learners who had access to their required textbooks, as well as the percentage of Grade 6 learners who were able to produce their own mathematics and language textbooks. Finally, StatsSA collected survey data around the percentage of learners grade R – 9 learners who had access to workbooks and Grade 10 – 12 learners who had access to textbooks in 2013.
Source: SACMEQ II and SACMEQ III; DBE, 2011 School Monitoring Survey; Stats SA, General Household Survey 2013 – 2014.
Figure 5.39: Percentage of Grade 6 learners with access to their own textbooks from SACMEQ II and SACMEQ III Assessments
0
20
40
60
80
100
EC FS GP KZN LP MP NC NW WC SA
Own Reading Textbook 2000 Own Mathematics Textbook 2000
Own Reading Tesxtbook 2007 Own Mathematics Textbook 2007
Source: SACMEQ
The SACMEQ assessments undertaken in 2000 showed that nationally 45.5% of learners sampled had access to their own reading books in 2000 and that 41% had access to their own mathematics textbook. In 2007, no progress had been made as 45% of learners had access to their own reading books and 36.4% of learners sampled had access to their own mathematics textbooks. Provincially, the Western Cape scored the highest with 67.8% of learners in 2007 having their own reading textbooks and 46.4% having their own mathematics textbooks. KZN scored the lowest in 2007, with only 32% of learners sampled having their own reading textbooks and just under 25% having their own mathematics textbooks.
Figure 5.40: Percentage of Grade 6 learners in 2011 with access to language and mathematics textbooks
0
20
40
60
80
100
EC FS GP KZN LP MP NC NW WC Total
Access to language textbook Access to Maths textbook
Able to produce own language textbook Able to produce own maths textbook
Source: DBE. 2011 School Monitoring Survey.

138 Realising the Right to a Basic Education in South Africa
The 2011 School monitoring survey looked at learners who have access to the books they need in the classroom, including their own book and a book shared with other learners. The DBE has emphasised that the improvement of this indicator relies on a number of factors, including delivery of books to schools, re-use of books from one year to the next, the teachers’ insistence that learners not leave their books at home and learner self-discipline around the use of the books. Figure 5.39 shows that nationally, 78% of learners sampled in 2011 had access to a language textbook and 83% had access to a mathematics textbook. However, when asked to produce their own textbook, only approximately 21% of learners were able to produce their own maths textbooks and 23% were able to produce their own language textbooks.
The School Monitoring Survey also surveyed Grade 9 learners about their access to and ability to produce their own mathematics and language textbooks. The results of Grade 9 surveyed learners indicated similar results with 16.31% of Grade 9 learners able to produce their own Language textbooks and 21.27% of surveyed Grade 9 learners able to produce their own Mathematics textbook.
Figure 5.41: Percentage of schools with Grade 9 learners where 100% of Grade 9 learners had access to textbooks, by quintile
2922
2823
38 35 3233
2230
20
35 33 3027 2330
17
33 32 292919
2520
32 28 25
64 60 61 6171
66 68
0102030405060708090
100
Home Language Home LanguageFiction
First AdditionalLanguage
First AdditionalLanguage Fiction
Maths Natural Sciences Social Sciences
Quintile 1 Quintile 2 Quintile 3 Quintile 4 Quintile 5
Source: DBE, 2011 School Monitoring Survey Technical Report, at p. 151
Figure 5.41 shows that quintile 5 schools had far greater access to textbooks in 2011 than schools categorized in lower quintiles. Between 61% and 71% of quintile 5 schools were able to provide access to textbooks in the above core subjects for 100% of their grade 9 learners whereas between 17% and 38% of quintile 1 through 4 schools were able to ensure access to textbooks in these core subjects for all of their grade 9 learners.
Figure 5.42: Percentage of persons aged 5 years and older attending Grades 1 through 9 in a public school by their access to workbooks by quarter, 2013
Quarter 1 Quarter 2 Quarter 3 Quarter 4Do not know 0.3 0.1 0.2 0
None of his/her subjects 3 1.6 0.8 0.8
some of his/her subjects 6.4 3.9 2.7 2.4
Most of his/her subjects 13.6 11.4 10.7 8
All of his/her subjects 76.8 83.1 85.7 88.8
76.8 83.1 85.7 88.8
0102030405060708090
100
Source: Stats SA, General Household Survey 2013, Statistical Release at p. 20.
GHS findings exhibited in Figure 5.42 show that while the vast majority of learners do receive workbooks for all of his or her subjects, some learners do not receive all of the workbooks that they are mandated to receive. These statistics further demonstrate that delivery of certain workbooks occur late into the school year with the percentage of learners receiving workbooks

139 The Status of the Right to a Basic Education in South Africa: What indicators tell us
for all of his or her subjects improving from 76.8% at the start of the school year to 88.8% by the fourth quarter. This data highlights the need for schools to ensure better communication and coordination with the DBE so adequate numbers of workbooks are ordered and that the workbooks that do arrive are in the correct languages.
Figure 5.43: Percentage of public school learners attending grades 10 - 12 by their access to textbooks by quarter
2013 2014 2013 2014 2013 2014 2013 2014Quarter 1 Quarter 1 Quarter 2 Quarter 2 Quarter 3 Quarter 3 Quarter 4 Quarter 4
Do not know 0.1 0.5 0.3 0.4 0.1 0.2 0.1 0
None of his or her subjects 3 2.9 0.8 1.2 1 1.6 1 0.3
Some of his or her subjects 8.3 5.5 5 4.7 5.2 4.7 3.6 3.3
Most of his or her subjects 12.9 17.1 14 15.7 11.8 16.3 9.3 16.1
all of his or her subjects 75.7 74 80 78 81.9 77.3 86.1 80.4
75.7 74 80 78 81.9 77.3 86.1 80.4
0102030405060708090
100
Source: Stats SA. General Household Survey 2014, Statistical Release, at p. 21.
Figure 5.43 shows that universal timely and complete delivery of textbooks to learners continues to be a problem. These data show that textbook delivery actually regressed in 2014, with just 74% of learners in grades 10 to 12 having access to textbooks in all of his or her subjects in the first quarter of the 2014 school year. While that figure improved to just over 80% of learners having access to textbooks by the fourth quarter of the 2014 school year, that figure is nearly 6% below the percentage of learners who had access to textbooks in all of his or her subjects by the fourth quarter of the 2013 school year. One area where textbook delivery did improve in 2014 was that a higher percentage of learners had access to textbooks in all or most of his or her subjects with approximately 91% of learners in grades 10 to 12 having access to textbooks in all or most subjects in the first quarter of 2014 and approximately 96.5% having access to all or most textbooks by the end of the school year.
These statistics, however, show that textbook delivery continues to pose a challenge and that despite the policy that calls for all learners to have his or her own textbook for all of his or her subjects, textbooks are still not universally available in a manner that is consistent with the scope of that policy. Additional concern lies with the fact that textbooks and workbooks continue to be delivered late into the school year for some learners, a problem that the DBE has acknowledged impacts learners at poorer schools the most, causing already disadvantaged learners to fall even further behind. The low rates of learners who are able to produce their own textbooks, as the findings from the 2011 School Monitoring Survey made clear, is also a cause for concern since the DBE’s policy mandates that all learners have their own textbooks. It is therefore not enough that learners have access to shared textbooks in classrooms. The cause of this shortfall should be investigated to determine whether sufficient quantities of textbooks have been delivered to schools with low rates of learners who are able to produce their own textbooks or whether the problem lies with school management practices and learners demonstrating the discipline to maintain their textbooks throughout the school year, especially since textbooks must be returned at the end of the year so they may be passed onto the next years’ learners
School InfrastructureIndicator 14.1: Number of schools that lack or have inadequate access to critical school
infrastructural facilities.
Description: This indicator measures the number of school that either lack or have un-reliable access to critical school infrastructural facilities using the DBE’s NEIMS databases, including electricity, water supply, ablution facilities, fencing,

140 Realising the Right to a Basic Education in South Africa
computer centres, sports facilities, communications systems, stocked libraries and science laboratories.
Source: National Educational Infrastructure Management System (NEIMS). Available at http://www.education.gov.za/DocumentsLibrary/Reports/tabid/358/Default.aspx.
Figure 5.44: Number of schools without access to critical infrastructural facilities or with unreliable or unacceptable facilities
20312
20717
18150
19239
17678
21298
14881
15909
9966
4081
15984
18746
1547
2759
128
1318
452
2444
913
3603
4773
2563
2854
800
10419
8569
2175
3384
23589
24460
0 5000 10000 15000 20000 25000
Total Schools 2015
Total Schools 2009
Laboratories 2015
Laboratories 2009
Libraries 2015
Libraries 2009
Communications - Internet 2015
Communications - Internet 2009
Communications - Fax 2015
Communications - Fax 2009
Sports Facilities 2015
Sports Facilities 2009
Computer Centres 2015
Computer Centres 2009
Fencing 2010
Fencing 2009
Ablution Facilities 2015
Ablution Facilities 2009
Water Supply 2015
Water Supply 2009
Electricity 2015
Electricity 2009
None Unreliable Access Unacceptable form Unstocked
Figure 5.44 shows that many schools in South Africa suffer from a lack of adequate access to critical services and facilities. As of 2015,
� 913 schools lack electricity while a further 2854 have unreliable electricity. This statistic shows that while improvements to the availability of electricity at schools have been made since 2009, the number of schools that suffer from unreliable electricity has increased by just over 2,000 since that time.
� 452 schools have no water supply while an additional 4773 schools have an unreliable water supply.
� 128 schools have no toilet facilities while 10,419 schools provided pit or bucket latrines prohibited by Minimum Norms and Standards for School Infrastructure. The NEIMS statistics do not provide data reflecting the number of learners per functioning toilet at each school. To better understand the extent to which adequate sanitation facilities are made available to learners and school staff, the non-governmental organisation Equal Education undertook a social audit survey of 200 schools in Gauteng. The findings published in 2015 revealed that approximately 30% of the schools surveyed suffered from toilet shortages so severe that over 100 learners shared a single working

141 The Status of the Right to a Basic Education in South Africa: What indicators tell us
toilet, a ratio that is nearly three times greater than the National Minimum Norms and Standards for School Infrastructure’s prescribed ratio of one toilet for every 35 learners.329
� 1547 schools have no fencing, though NEIMS does not assess the number of schools that have inadequate fencing.
� 9966 schools do not have sports facilities, double the amount listed in the 2009 NEIMS report, suggesting that many schools without sports facilities were not being properly assessed for sports facilities when the earlier report was conducted.
� 14881 schools have no fax machine while 17678 schools have no internet access for communications purposes. While it is possible for some schools without fax machines to have internet or that some schools with internet do not have fax machines, these statistics are very concerning since the lack of critical communications mediums significantly limit the ability of schools to communicate with district offices and provincial education departments. This limitation in turn limits the ability for district offices to effectively monitor and support schools under their care. The lack of communications facilities is most severe in the Eastern Cape, KwaZulu-Natal and Limpopo where 81%, 69% and 85% of schools respectively do not have access to faxing facilities and 85%, 83% and 94% of schools respectively do not have access to internet for administrative purposes.
� 18,150 schools do not have libraries and additional 2175 schools do not have stocked libraries, meaning that over 86% of schools in South Africa are not equipped to offer stocked libraries to their learners. While the majority of schools in all provinces do not have stocked libraries, the Eastern Cape, Mpumalanga and Limpopo fared the worst with 95%, 93% and 97% of schools lacking libraries or stocked libraries.
� 20312 schools continue to lack science laboratories.
While the NEIMS data does not track schools that are made of inappropriate structures, including mud schools, plankie schools, corrugated sheeting structures and prefab schools which are no-longer fit for purpose, the progress of the ASIDI programme provides further indication of the extent to which the DBE and provincial education departments have addressed school infrastructure backlogs.
Figure 5.45: ASIDI progress as of 2015
510
1120
741
914
92
342 351 288
0
200
400
600
800
1000
1200
Inappropriate Structures Schools without water Schools without Sanitation Schools without Electricity
Schools Targeted Schools Completed
Source: Parliamentary Monitoring Group, DBE presentation to Parliament on Progress and Status of Accelerated School
Infrastructure Development Initiative (ASIDI) dated 24 February 2015.
Figure 5.45 shows that progress has been slow in terms of addressing the school infrastructure backlogs for schools targeted by the ASIDI programme. Only 92 schools out of the current 510 schools targeted as having inappropriate structures have been delivered while only 342 schools out of 1120 targeted as being without water have been addressed through the programme. 351 out of 741 schools identified as being without adequate sanitation facilities have been completed and 288 out of 914 schools identified as being without electricity have been equipped with electricity.
329 Equal Education. 2014. Gauteng Schools Social Audit Report. Equal Education. available at http://www.equaleducation.org.za/content/2015/05/19/Equal-Education_Gauteng-Schools-Social-Audit-Report_Full-Version.pdf (last accessed 16/09/2015).

142 Realising the Right to a Basic Education in South Africa
Indicator 14.2: Percentage of schools with classroom sizes greater than 40 learners per class, by province
Description: This indicator measures the extent to which South African schools are complying with classroom size norms and providing adequately sized classrooms that do not suffer from overcrowded conditions. While the NMUNSPSI mandates that class sizes be no larger than 40 learners per class in primary and secondary schools and no more than 30 learners per class for Grade R, a significant number of South Africa’s schools have classrooms that exceed these maximum classroom size figures.
Source: DBE, 2011 School Monitoring Survey
Figure 5.46: Percentage of schools with classroom sizes in 2011 with greater than 40 learners per class, by province
24
12
30 3022
28
14
26
14
24
5
0
15
3
8
0
3
0
42
1
0
1
1
2
1
1
0
1
0
5
10
15
20
25
30
35
40
45
50
EC FS GP KZN LP MP NC NW WC TOTAL
Percentage 41 to 60 Percentage 61 to 80 Percentage over 80
Figure 5.47: Percentage of schools by varying classroom size in 2011, by quintile
1 2 3 4 5 TotalUnspecified/Missing 2 3 2 0 3 2Over 80 2 0 2 1 0 161 to 80 4 5 4 2 1 441 to 60 23 25 27 31 11 2421 to 40 48 45 50 51 66 501 to 20 21 22 16 14 18 19
0102030405060708090
100
Source: DBE, 2011 School Monitoring Survey Technical Report, at p. 329.
Figures 5.46 and 5.47 show that overcrowded classrooms continue to be common in South Africa’s schools with over 30% of schools in the Eastern Cape, Gauteng, Kwazulu-Natal and Mpumalanga exhibiting classroom sizes in excess of 40 learners per class. Larger classroom sizes are more common in lower quintile schools with around 30% of quintile 1 through 4 schools exhibiting overcrowded classrooms compared to 12% of quintile 5 schools. SACMEQ II and SACMEQ III surveys conducted in 2000 and 2007 found that 52% and 55.1% of learners attended classrooms with more than 40 learners.330 Unfortunately, the School Monitoring Survey only reviewed the percentage of schools that suffered from overcrowded classrooms and not the percentage of learners that attended schools with overcrowded classrooms so the SACMEQ results cannot be compared to the findings from the 2011 School Monitoring Survey.
330 Moloi, M., Chetty, M. 2010. ‘The SACMEQ III Project in South Africa: A Study of the Conditions of Schooling and the Quality of Education.’ Pretoria: Department of Basic Education. p 36 – 37. Available at http://www.education.gov.za/LinkClick.aspx?fileticket=yvljE7UHpDQ%3D&tabid=358&mid=2596

143 The Status of the Right to a Basic Education in South Africa: What indicators tell us
The DBE, however, assessed the percentage of learners who attend school in classrooms with more 45 learners in its Action Plan to 2019 report. That data, obtained from the DBE’s 2013 Ordinary Survey of Schools, found that nationally, 35% of learners in 2013 attended school in classrooms with more than 45 learners. These statistics show that very large numbers of learners continue to attend school in overcrowded classroom conditions, particularly in the rural provinces such as Limpopo, Mpumalanga, the Eastern Cape and KwaZulu-Natal that enrol South Africa’s poorest who already come from the most educationally disadvantaged communities and households.
49 4638 38 34
26 23 2314
35
0
20
40
60
LP MP EC KZN NW GP FS NC WC RSA
Percentage of learners in classrooms with more than 45 learners in 2013
Source: DBE 2013 Annual Survey of Schools. Published in DBE. (2015). Action Plan to 2019: Towards the Realisation of
Schooling 2030. Pretoria. At p. 63.
Special Needs EducationIndicator 15.1: The percentage of schools that have a support team to support learners with
special education needs, by province.
Description: This indicator measures the extent to which schools are able to identify and support learners with special needs. This indicator is especially important since the majority of special needs learners attend ordinary public schools under the inclusive education policy and the DBE has acknowledged that learners with special needs often do not receive the specialised attention they require due to inadequate resources and skills.
Source: DBE, 2011 School Monitoring Survey, at p. 372 – 373.
Indicator 15.2: The percentage of schools that have been able to screen learners, identify learners or support learners with special education needs.
Description: This indicator measures the extent to which schools are equipped to identify and respond to learners with special education needs.
Source: DBE, 2011 School Monitoring Survey, at p. 374 – 375.
Figure 5.48: Percentage of schools that have a support team to support learners with special needs, by province and quintile
44
58
95
54
13
70
50 46
82
41 4356
72 76
51
0
20
40
60
80
100
EC FS GP KZN LP MP NC NW WC Q 1 Q 2 Q 3 Q 4 Q 5 Total

144 Realising the Right to a Basic Education in South Africa
Figure 5.49: Percentage of schools that have been able to screen, identify or support learners with special education needs
43
53
73
45
15
4134
29
57
41
5461
78
60
28
62
36
63 6054
48
58
79
54
24
59
41
59 5851
0
10
20
30
40
50
60
70
80
90
EC FS GP KZN LP MP NC NW WC Total
Screening Identifying Supporting
Indicators 15.1 and 15.2 can be classified as both access and adequacy indicators since they are assessing the extent to which learners with special needs have access to the support services that are necessary for them to effectively access educational services. Figures 5.48 and 5.49 show that there is a wide disparity amongst ordinary schools across provinces and quintiles that are capable of screening, identifying and supporting learners with special needs. This is a significant shortfall because of the high rates of special needs learners who are likely attending ordinary schools given that nationally, only 116,888 attend special schools. If census estimates are correct and 5.8% of children between the ages of 5 and 18 are disabled, amounting to nearly 600,000 disabled children between those ages, it is very likely that many learners with special needs are attending ordinary schools, and far more than the 80,702 special needs learners reported by the provincial education departments to be attending ordinary schools. The lack of ability of many schools to screen, identify or support learners with special needs, particularly in Limpopo, the Eastern Cape, KwaZulu-Natal and the Northern Cape, likely indicates that very large numbers of special needs learners are attending ordinary schools without having been effectively identified as requiring special needs or having their disabilities addressed through proper support mechanisms. Data obtained through the School Monitoring Survey identify that learners attending lower quintile ordinary schools are far less likely to receive support than learners attending schools categorised in quintiles 4 and 5. Only 41% of quintile 1 and 43% of quintile 2 schools have a been identified as having a team to support learners with special needs compared to 72% of quintile 4 schools and 76% of quintile 5 schools.
5.3. Quality Indicators
Grade Progression and Educational AttainmentIndicator 16.1: Percentage distribution of highest level of educational attainment for
persons aged 20 years of age and older.
Description: This indicator measures the extent to which persons aged 20 years and older have completed various levels of educational attainment. The figures are calculated by dividing the number of persons aged 20 years and older who have completed each of the listed levels of education as his or her highest level of education attained by the entire population of persons aged 20 years of age and older.
Source: Stats SA, General Household Survey 2014, Statistical Release P0318, at p. 24

145 The Status of the Right to a Basic Education in South Africa: What indicators tell us
Figure 5.50: Percentage distribution of highest level of educational attainment for persons 20 years of age and older
2002 2003 2004 2005 2006 2007 2008 2009 2010 2011 2012 2013 2014 2014None 10.6 9.9 9.6 9.4 9.5 8.6 8.7 6.8 6.8 6.4 5.8 5.6 5.3 5.3Some Primary 17 15.8 15.5 15 14.3 14.3 13.9 12.1 12.1 11.5 10.9 10.7 10.6 10.6Completed Primary 7 6.5 6.6 6.4 6.3 6.4 6 5.7 5.7 5.5 5.3 5.2 4.8 4.8Some Secondary 34.1 35.8 34.5 36.1 36 36.6 35.6 37.2 37.3 37.1 38 37.5 36.7 36.7NSC/Grade 12 21.6 22.3 23.8 23 24.4 23.9 24.5 26.2 26.5 27.6 27.2 27.7 28.7 28.7Post-school 9.3 9.5 9.8 9.9 9.3 10 11.1 11.2 11.4 11.8 12.5 12.8 13.5 13.5Other 0.2 0.3 0.1 0.1 0.1 0.2 0.2 0.2 0.1 0.3 0.3 0.5 0.4 0.4
0102030405060708090
100
Educational attainment has risen substantially with approximately 42.2% of South Africans over the age of 20 having attained a secondary or post-secondary degree in 2014, up from 30.9% in 2002. 16% of South Africans over the age of 20 have attained less than primary school completion, down from 27% in 2002. These figures also show that large numbers of South Africans continue to drop-out of school or not complete secondary schooling prior to turning 20. In 2014, 36.7% of South Africans aged 20 years and older had only completed some secondary school, a slight increase from 34.1% in 2002 – indicating that advances made in terms of primary school completion is not necessarily resulting in secondary school completion. While large numbers of learners remain in secondary school into their twenties,331 these figures continue to reflect high rates of unfinished primary and secondary schooling at age twenty and older with 57.8% of South Africans aged twenty and older not having completed secondary school in 2014, a decline though of 12% from 2002 when 69% of South Africans aged twenty and older had not completed secondary school or above.
Amongst the categories of educational attainment, the largest impact has been the 50% decline in the rate of adults who have attained no formal schooling, from 10.6% nationally in 2002 to 5.3% in 2014. The Eastern Cape exhibited the largest decline in that category during that time from 12.5% to 5.5%. Despite these gains, high rates of adults having attained no formal education continue to be exhibited in 2014 in Limpopo (10.1%), Mpumalanga (9.3%) and Kwazulu-Natal 7.1%), even though rates are down from 20.1%, 17.1% and 11.8%, respectively, in 2002. These figures are primarily attributable to older generations having been brought up during the apartheid era when extremely high numbers of Black African and Coloured children did not attend schools, but these figures do continue to speak to the lack of attendance of adults in adult basic education programmes.
These rates of educational attainment show that younger generations have made significant strides in primary school (grade 7) completion, the benchmark for functional literacy. While just under 16% of South Africans above the age of 20 had not completed primary school in 2014 (down from 27.3% in 2002), 92.5% of males aged 20-39 and 95% of females of that age range had completed primary school in 2014. Of South Africans over the age of 60, however, just under 60% of males and 52% of females had completed primary school or higher in 2014. Just over 80% and 78% of males and females respectively aged 40-59 had attained at least primary school completion in 2014, up from 65% and 60% in 2002. Not only do these figures show that younger generations are far more likely to have attained at least the completion of primary schooling, they also indicate that educational attainment has improved most dramatically amongst females, where younger female adults are now more likely to have completed primary schooling than their male counterparts.
331 GHS data further shows that in 2014, 25.3% of 20 year-olds, 13.3% of 21 year-olds, 6.6% of 22 year-olds and 3.4% 23 year-olds attended secondary schools. See Stats SA, General Household Survey 2014 Statistical Release, at p. 19.

146 Realising the Right to a Basic Education in South Africa
Figure 5.51: Percentage of adults aged 20 and older who completed Grade 9 or higher, by population group
Black African Coloured Indian White Total2002 48.1% 50.4% 73.4% 93.8% 54.5%2014 67.9% 69.4% 84.3% 94.2% 68.3%
0.0%
20.0%
40.0%
60.0%
80.0%
100.0%
Source: StatsSA General Household Survey data, 2002 – 2014.
Figure 5.52: Percentage of adults aged 20 and older who have completed Grade 12 or higher, by population group
Black African Coloured Indian White Total2002 22.60% 22.90% 46.70% 70.40% 28.91%2014 35.80% 38.10% 63.60% 78.50% 41.30%
0.00%10.00%20.00%30.00%40.00%50.00%60.00%70.00%80.00%90.00%
100.00%
2002 2014
Source: StatsSA General Household Survey data, 2002 – 2014.
Figures 5.51 and 5.52 show that educational attainment continues to vary significantly between population groups. While Grade 9 attainment levels have been high for White South Africans, remaining steady at approximately 94% in both 2002 and 2014, very large numbers of Black South Africans have not attained Grade 9 or higher as of 2014. However, the rates of Grade 9 attainment have improved for Black South Africans from 48.7% in 2002 to 67.9% in 2014 with the rates of Grade 9 completion being similar amongst Coloured South Africans during that time. Black and Coloured South Africans also continue to show low rates of Grade 12 completion with just over 35% and 38% of adults of those respective populations having completed Grade 12. These figures continue to lag substantially behind White South Africans, who are more than twice as likely to have completed Grade 12 than Black or Coloured South Africans in 2014. The gap in Grade 12 attainment has dropped the most between Indian and White South Africans, where Indian adults went from being 23% less likely to complete Grade 12 than White adults in 2002 to being approximately 13% less likely in 2014. Gaps between White and Black South Africans in terms of completing Grade 12 have been much slower to close with differences in Grade 12 attainment improving only marginally between 2002 and 2014 from 48% to just below 43%
Indicator 16.2: Percentage of learners repeating their current grades
Description: This indicator measures the extent to which learners in schools are progressing through the education system. This indicator has multiple implications. Firstly, it seeks to assess the extent to which learners have demonstrated sufficient subject knowledge and comprehension to pass to the next grade. Secondly, it assesses the efficiency of South Africa’s schools to prepare learners so they may graduate to the next level. Finally, it assesses the extent to which schools are able to keep learners on track to graduate from secondary school since learner repetition acts as a strong indicator of learner drop-out.332
332 A 2008 investigation conducted by the Ministerial Committee on Learner Retention in the South African Schooling System identified grade repetition as the single most powerful predictor of dropping out. This is in addition to other studies conducted internationally that show that learners who had repeated a grade in their schooling were most likely to drop out of school prior to completing their secondary schooling. See DBE. 2014. ‘General Household Survey (GHS) 2013 Report: Focus on Schooling.’ Pretoria: Department of Basic Education. p 36.

147 The Status of the Right to a Basic Education in South Africa: What indicators tell us
Source: Stats SA, General Household Survey 2009 – 2013, DBE calculations from “The Internal Efficiency of the School System: A report on selected aspects of access to education, grade repetition and learner performance, at p. 22 and DBE calculations from 2013 Focus on Schooling, at p. 37.
Figure 5.53: Percentage of learners repeating current their grades, 2009 - 2013
Gr 1 Gr 2 Gr 3 Gr 4 Gr 5 Gr 6 Gr 7 Gr 8 Gr 9 Gr 10 Gr 11 Gr 12 Total2009 6.9 7.2 7.2 7.1 6.8 6.5 5 8.2 10.4 16.7 15.7 8.1 8.72010 5.7 8.4 9.2 6.4 7 6.8 5.4 6.7 11.5 19.6 18.1 10.5 92011 7 8.5 8 8.5 5.9 7.2 6.1 7.7 13.5 21.2 18.2 10.8 10.32012 9 9.7 9.5 10.7 8.2 7.2 6.5 10.3 15 22.1 19.9 8.9 11.52013 10.5 9.1 9.5 9.1 9.4 7.6 7.7 8.6 16.3 24.2 21 8.9 12.1
0
5
10
15
20
25
30
Figure 5.53 shows the rates of grade repetition increasing between the years of 2009 and 2013. Between those years, the proportion of learners repeating their current grades increased from 8.7% of learners in 2009 to 12.1% of learners in 2013. Moreover, these increases occurred almost entirely between Grades 9 and 11 where the number of learners repeating Grade 9 increased from 10.4% of Grade 9 learners to 16.3%. The number of Grade 10 learners repeating Grade 10 is even more dramatic at 24.2% in 2013, up from 16.75% in 2009. Repetition rates for Grade 11 learners were high in 2013 as well with 21% of Grade 11 learners repeating their current grade from 2009’s rate of 15.7%. Increases in rates of repetition also occurred in primary schools during this time, though repetition rates were less severe than the rates of repetition between Grades 9 and 11. These figures demonstrate that while learners are staying in school longer, their skills backlogs stemming from poor primary schooling negatively impacts the ability of learners to progress through secondary school and attain National Senior Certificates.
Indicator 16.3: Percentage of 15 year-olds who have completed primary school.
Description: This indicator measures the extent to which learners are graduating from Grade 7 by age 15, the final year of compulsory school-going age. While the DBE’s enrolment policies dictate that learners should graduate Grade 9 by age 15, this indicator is significant because it measures the extent to which South Africans learners complete at least primary schooling, the international benchmark for functional literacy, by the end of the period for compulsory attendance.
Source: Stats SA, General Household Survey, 2002 - 2013
Figure 5.54: Percentage of 15 year-olds who have completed primary school
2002 2003 2004 2005 2006 2007 2008 2009 2010 2011 2012 2013Male 62.6 62.6 63.9 67.4 73.4 74.1 77.1 74.6 74.8 77.2 79.1 79.4Female 77.5 76.8 80.8 83.1 82.6 84.3 82.2 84.8 87 87.1 90.5 92Total 70.2 69.5 72.1 75.2 78.2 79.5 79.5 79.5 80.9 82.1 84.8 85.4
0102030405060708090
100
Figure 5.54 shows an improvement amongst 15 year-olds who have completed primary school (Grade 7) with a rate of completion in 2013 of 85.4% compared to a 70.2% rate of completion in 2002. Female 15 year-olds continue to be more likely than male 15 year-olds to have completed

148 Realising the Right to a Basic Education in South Africa
primary school by age 15 with the gap closing only very marginally from a 15% differential in 2002 to a nearly 13% differential in 2013. While these rates show that the percentage of 15 year-olds who did not complete primary school has dropped in half, from approximately 30% of 15 year-olds in 2002 to just under 15% of 15 year-olds in 2013, there continues to be high numbers, particularly of male youth, who do not complete primary schooling by the end of their compulsory enrolment periods. Due to slow rates of progression through school, 13.5% of 15 year-olds, 5.5% of 16 year-olds and 3% of 17 year-olds were enrolled in primary school in 2013, which means that additional youth do complete primary school education but do so when they are older than 15. Accordingly, 94% of South African youth between the ages of 15 and 24 in 2013 had completed primary school, including 91.9% of males and 96.1% of females within that age range.333
Indicator 16.4: Age-appropriate enrolment for 9 and 12 year-olds
Description: Under the DBE’s enrolment policy, learners should complete primary school (Grade 7) at age 13. The DBE has therefore measured the percentage of 12 year-olds enrolled in Grade 7 or above as one of its Action Plan indicators. Figure 5.55 shows that nationally, approximately 70.7% of 12 year-olds were enrolled in Grade 7 in 2013, up from approximately 63.7% in 2009. While this increase in age-appropriate enrolment is substantial for just a four-year period, it does show that age-appropriate enrolment declines as learners progress through the system. The rates of age-appropriate enrolment vary amongst provinces with just 57.5% of 12 year-old learners in the Eastern Cape enrolled in grade 7 or higher (up from 42.5% in 2009) compared to 81.4% of 12 year-old learners in Gauteng enrolled in Grade 7 or higher (up from 77% in 2009).
Source: StatsSA General Household Survey Data
Figure 5.55: Age-appropriate grade enrolment for 9 and 12 year-olds
80 79.2 80.2 82.8 84.7
63.7 65.871.9 70.1 70.7
50
60
70
80
90
100
2009 2010 2011 2012 2013
% of 9 year-olds enrolled in Grade 9 and higher % of 12 year-olds enrolled in Grade 7 and higher
Source: DBE. 2014. ‘General Household Survey (GHS) 2013 Report: Focus on Schooling.’ Pretoria: Department of
Basic Education. p 48 – 50.
Secondary School Completion Rates and National Senior Certificate ResultsIndicator 17.1: The percentage of 22 to 25 year-olds who have completed grade 12 (Matric)
and above by gender
Description: This indicator measures the percentage of 22 to 25 year-olds who completed grade 12 and above by gender. This age range was chosen because some learners in South Africa attend secondary schools until age 25.334 Accordingly, this age range was used to ensure that the indicator measures the extent to which youth are completing secondary education.
Source: StatsSA, GHS, 2002 – 2013, calculated by DBE. (2014). General Household Survey (GHS) 2013 Report: Focus on schooling. Pretoria: Department of Basic Education. p 54.
333 Ibid, at p 51.334 See DBE (2013) Annual Schools Surveys: Report for Ordinary Schools 2010 and 2011, at p. 26 which details that 4.3% and .4% of learners
enroled in grade 12 are 22 and 25 years of age respectively.

149 The Status of the Right to a Basic Education in South Africa: What indicators tell us
Figure 5.56: Percentage of 22 to 25 year-old youth who completed grade 12 and higher, by gender
2002 2003 2004 2005 2006 2007 2008 2009 2010 2011 2012 2013Male 39 42.3 41.3 39.3 41.8 39.3 42.1 40.7 42.8 42.4 44.5 44.9Female 40.2 37.8 40.6 40.2 40.6 42.7 44.3 48.3 47.4 50.8 50.3 51Total 39.6 39.9 41 39.8 41.2 41.1 43.2 44.5 45.1 46.7 47.4 47.9
2025303540455055606570
Figure 5.56 show that nationally, 47.9% of South African youth between the ages of 22 and 25 in 2013 had completed secondary school education, an increase from 39.6% in 2002. Female youth achieved a higher school completion rate than male youth with 51% of females aged 22-25 having completed secondary school, up from 40.2% rate from 2002. The secondary school completion rate for males of that age improved to just 44.9% in 2013 from 39% in 2002. These figures therefore show that the rate of female Matric/NSC attainment improved at twice the rate of their male counterparts. The DBE has warned, however, that while the General Household Survey provides the best data to ascertain the rate at which youth are exiting the public education system with a Senior Certificate, the rates are likely upwardly biased by a few percentage points due to certain respondents likely claiming to have completed Grade 12 even though they may have attended Grade 12 but failed to attain a Matric/National Senior Certificate.335
Indicator 17.2: Percentage of NSC (Matric) passes and bachelors level passes as a proportion of Grade 10 enrolments from two years earlier, by province
Description: This indicator measures the percentage of learners who passed the National Senior Certificate (formerly Matric) as a percentage of the number of learners enrolled in Grade 10 two years earlier. Grade 10 enrolment was used in this indicator because many learners drop-out of school between Grade 10 and enrolling in the NSC examination. The indicator is assessed at a provincial level to determine the extent to which certain provinces are succeeding in graduating learners enrolled in secondary schools. The indicator also assesses the extent to which learners are achieving bachelor level passes compared to Grade 10 enrolment 2 years earlier.
Source: DoE, Education Statistics in South Africa at a Glance and DBE Education Statistics in South Africa 2002 – 2013; DBE National Senior Certificate Examination 2014 Technical Report. Own Calculations.
Figure 5.57: NSC (Matric) graduates and bachelor passes as a percentage of Grade 10 enrolment from 2 years prior, by province
EC FS GP KZN LP MP NC NW WC SA2004 Matric Pass 26.19% 33.22% 42.51% 40.62% 42.84% 32.71% 38.66% 32.90% 46.29% 37.75%
2004 Bachelors Pass 4.30% 9.35% 12.24% 10.40% 12.70% 6.62% 8.68% 6.31% 14.73% 9.71%
2009 NSC Pass 22.71% 28.44% 38.70% 33.85% 22.25% 26.59% 25.96% 28.19% 37.65% 29.99%
2009 Bachelors Pass 6.21% 8.29% 15.68% 11.02% 5.57% 6.74% 7.11% 8.66% 15.85% 9.83%
2014 NSC Pass 29.23% 36.53% 43.62% 36.69% 30.17% 38.29% 30.89% 32.26% 51.33% 36.60%
2014 Bachelors pass 8.97% 13.32% 19.08% 14.25% 9.26% 12.07% 10.01% 12.44% 24.23% 13.66%
0.00%
10.00%
20.00%
30.00%
40.00%
50.00%
60.00%
70.00%
335 DBE. 2013. Macro Indicator Report 2013. Pretoria: Department of Basic Education. p 40.

150 Realising the Right to a Basic Education in South Africa
Figure 5.58: Number of NSC (Matric) and Bachelor level passes compared to Grade 12 enrol-ment and Grade 10 enrolment from two years prior
2004 2005 2006 2007 2008 2009 2010 2011 2012 2013 2014Grade 10 two years prior 876175 1096214 1057935 1069494 1093297 1115961 1076527 1017341 1039762 1094189 1103495
Grade 12 505392 538909 568664 625809 595216 602661 579384 534498 551837 597196 571819
NSC passes 330717 347184 351503 368217 344794 334716 364513 348117 377847 439764 403874
Bachelors Passes 85117 86531 85830 85454 106047 109697 126371 141584 136047 171755 150752
0
200000
400000
600000
800000
1000000
1200000
Figures 5.57 and 5.58 show that nationally in 2014, 403,874 students passed South Africa’s National Senior Certificate examination and that 150,752 of those students achieved bachelors level passes qualifying them to study at a university. While these figures demonstrate an improvement in the absolute number of matric passes and qualifying passes from 2004, these figures show that NSC passes each year continue to represent a small fraction of learners enrolled in Grade 10 two years earlier, indicating that the system is failing to retain and pass Grade 10 learners through to Grade 12 and to equip them with the skills and knowledge necessary to pass the NSC examination.
NSC pass rates and bachelors-level passes vary substantially amongst provinces with the Western Cape achieving the highest rates of NSC passes as a proportion of Grade 10 enrolments from two years prior at 51.33% in 2014 (up from 36.65% in 2009). Bachelors-level passes in the Western Cape represented 24.23% of Grade 10 enrolment two-years prior in 2014. Gauteng had the second highest rate of NSC passes compared to Grade 10 enrolment from two years prior with 43.26% in 2014 (up from 38.7% in 2009) and a 2014 bachelor pass rate of just over 19% of the number of learners enrolled in Grade 10 two years earlier. The Eastern Cape and Limpopo had the lowest achievement rates in this regard with their 2014 NSC passes representing just 29.23% and 30.17%, respectively, of their Grade 10 enrolment in 2012. Bachelor pass rates as a proportion of Grade 10 enrolment for these provinces were just under 9% in the Eastern Cape and 9.26% in Limpopo.
Indicator 17.3: Number of NSC candidates passing mathematics and physical sciences
Description: This indicator measures the extent to which the education system is graduating learners who have demonstrated levels of competencies in mathematics and physical science.
Source: DBE National Senior Certificate Examination Technical Report, 2012 and 2014.
Figure 5.59: Number of NSC candidates who wrote and passed mathematics and physical science
2008 2009 2010 2011 2012 2013 2014Number Wrote NSC 533561 552073 537543 496090 511152 562860 532860
Number Wrote Mathematics 298821 290407 263034 224635 225874 241509 225458
Mathematics passes 136503 133505 124749 104033 121970 142666 120523
Number Wrote Physical Science 218156 220882 205364 180585 179194 184383 167997
Physical science passes 119823 81356 98260 96441 109918 124206 103348
0
100000
200000
300000
400000
500000
600000
Figure 5.59 shows that the number of NSC candidates who wrote mathematics has dropped from 298,821 in 2008 to 225,458 in 2014. The number of candidates writing physical science as an NSC subject also dropped, from 218,156 candidates in 2008 to 167,997 in 2014. In addition

151 The Status of the Right to a Basic Education in South Africa: What indicators tell us
to the decline in candidates taking these more difficult but critically needed subjects, the DBE has expressed concern over the low levels of quality passes. In mathematics, for instance, the number of grade 12 learners achieving at least a 70% mark, often considered a minimum for entry into university studies in a mathematics-based field such as engineering, was only 18,000.336 The Ministerial Committee appointed in 2013 to investigate the standard of the National Senior Certificate has underscored that this reduction in NSC candidates sitting for and passing mathematics has coincided with an increase in the number of secondary school that do not offer mathematics as an NSC subject. While 150 secondary schools did not offer mathematics as an NSC subject in 2008, this figure increased to 286 secondary schools by 2012.337
Figure 5.60: NSC Pass Rate
2009 2010 2011 2012 2013 2014NSC pass rate 60.6 67.8 70.2 73.9 78.2 75.8% qualifiying for bachelors 19.9 23.5 24.3 26.6 30.3 28.3NSC passes as % of grade 10 29.99 33.86 34.2 36.3 40.19 36.6% taking mathematics 52.6 48.93 45.28 44.19 42.91 42.31% taking phsycial sciences 40.01 38.2 36.4 35.06 32.76 31.53% of underperforming schools 52.43 38.66 34.14 27.77 24.99 20.76
0102030405060708090
Source: DBE Reports on the National Senior Certificate Results 2009 – 2014. Available at http://www.education.gov.za/
DocumentsLibrary/Reports/tabid/358/Default.aspx
Figure 5.60 shows that the NSC pass rates increased from 60.6% of candidates passing the examination in 2009 to 75.8% passing the examination in 2014 following a peak pass rate of 78.2% in 2013. Bachelors passes also increased during that time from just below 20% in 2009 to 28.3% in 2014. Figure 5.60 exhibits the extent to which NSC pass rates have improved in comparison to NSC passes as a percentage of Grade 10 enrolment from two years earlier. It also compares the NSC pass rate to the percentage of candidates taking the more difficult mathematics and physical sciences that have been identified by government as fields that suffer from skill shortages. While the matric pass rate has increased since 2009, matric passes in comparison to Grade 10 enrolment from two years earlier have increased at less than half the pace, improving from NSC passes representing 30% of Grade 10 enrolments from two years prior to 36.6% of 2012 Grade 10 enrolments in 2014. The far smaller proportion of NSC passes compared to grade 10 enrolments is attributable to increasingly high rates of grade repetition in Grades 10 and 11, as exhibited in indicator 15.1, and high rates of learners who drop-out of school prior to taking the NSC examination in Grade 12.
Figure 5.60 also shows the impact that increases in NSC pass rates have had on the percentage of secondary schools that qualify as underperforming. Underperforming schools were calculated using NSC Examination Technical Reports from 2009 through 2014. As described in the policy section above, schools are identified as underperforming if their NSC pass rates are less than 60%. This categorisation is intended to trigger enhanced levels of school oversight and support by provincial education departments. Figure 5.60 shows that the percentage of schools identified as underperforming under the DBE’s definition has decreased from 52.43% of South Africa’s Secondary Schools in 2009 to 20.76% of Secondary Schools in 2014. While the increase in the NSC pass rate has caused 32% of secondary schools in South Africa to no longer qualify as underperforming under the DBE’s definition, the low number of NSC passes as compared to Grade 10 enrolments raises a number of concerns over the appropriateness of the methodology used to determine whether secondary schools are underperforming. This is especially the case when one considers the large increases in the rates of learners repeating
336 DBE. 2015. Action Plan to 2019: Towards the realization of schooling 2030. Pretoria: Department of Basic Education. p 28.337 Ministerial Committee on the National Senior Certificate (NSC). 2014. ‘Report of the Ministerial Committee to Investigate the Current
Promotion Requirements and Other Related Matters that Impact on the Standard of the National Senior Certificate.’ Pretoria: Department of Basic Education. p 59. Available at http://www.education.gov.za/LinkClick.aspx?fileticket=VIFw9JGiNNo%3D&tabid=358&mid=1301

152 Realising the Right to a Basic Education in South Africa
grades 9, 10 and 11 during that period. Moreover, the fact that the percentage of secondary schools qualifying as underperforming dropped by 4% from 2013 to 2014 is potentially suspect since the matric pass rate during those years actually decreased from 78.2% to 75.8%. These outcomes make it evident that measures used to identify underperforming schools should go beyond simply assessing the NSC pass rates but should also factor in learner repetition and drop-out rates.
Grade 3, 6 and 9 performances on Annual National Assessments (ANAs)Indicator 18.1: Percentage of learners who score 50% or higher on grade 3, 6 and 9 ANAs
Description: This indicator measures the percentage of learners who achieve the baseline mark of 50% or higher in home language and mathematics in grades 3, 6 and 9 and First Additional Language in Grades 6 and 9.
Source: DBE, Annual National Assessment Technical Reports, 2012 - 2014
Figure 5.61: Percentage of Grade 3, 6 and 9 learners having achieved 50% or greater on Home Language (HL), Math and First Additional Language (FAL) on 2014 ANAs, by province
0102030405060708090
100
EC FS GP KZN LP MP NC NW WC TOTAL
Grade 3 Maths Grade 3 HL Grade 6 Maths Grade 6 HL
Grade 6 FAL Grade 9 Maths Grade 9 HL Grade 9 FAL
2012 2013 2014 2014 VerificationGr 3 Maths 36.3 59.1 64.5 55.6
Gr 3 HL 56.6 57 65.7 56.5
Gr 6 Maths 10.6 26.5 35.4 32.4
Gr 6 HL 38.7 67.6 77 74.6
Gr 6 FAL 24.4 41.2 42.3 36.1
Gr 9 Maths 2.3 2.3 2.9 2.9
Gr 9 HL 38.9 37 48 47.8
Gr 9 FAL 20.8 17.1 18.3 15
0102030405060708090
100
Percentage of Grade 3, 6 and 9 learners having achieved 50% or higher in Mathematics, Home Language and First Additional Language ANAs

153 The Status of the Right to a Basic Education in South Africa: What indicators tell us
Figure 5.62: Percentage of Grade 3, 6 and 9 learners attaining various levels of achievement in 2014 ANA subjects
0102030405060708090
100
Grade 3Maths
Grade 3 HL Grade 6Maths
Grade 6 HL Grade 6 FAL Grade 9Maths
Grade 9 HL Grade 9 FAL
Not achieved Elementary achievement Moderate achievement Adequate achievement
Substantial achievement Meritorious achievement Outstanding achievement
Table 5.2: Average ANA scores by Quintile
2012 2013 2014 2012 2013 2014 2012 2013 2014
Grade 3 HL Grade 3 Math
Q1 49.2 48.5 54 37.8 49.6 52.5
Q2 49.6 49.2 54.3 38 50.3 60.2
Q3 50.8 50.0 55.2 39.5 51.2 60.4
Q4 53.1 51.6 56.8 43.3 55.6 63.4
Q5 61.7 59.8 67.3 53.7 66.6 71.4
Grade 6 HL Grade 6 Math Grade 6 FAL
Q1 23.7 46.6 50.8 23.7 34.6 38.1 33 43.3 43
Q2 23.8 48.4 52.8 23.8 35.6 39.6 33.9 45.0 44.7
Q3 24.5 50.9 54.6 24.5 36.6 40.4 36.3 46.9 46.6
Q4 27.4 58.4 60.3 27.4 41.5 46.1 39.8 51.3 50.6
Q5 39.6 70.5 70.9 39.6 54.3 60.3 50.2 59.2 60
Grade 9 HL Grade 9 Math Grade 9 FAL
Q1 10.8 32.0 31.8 10.8 11.7 10.1 31.3 30.4 32.4
Q2 10.4 34.0 33.9 10.4 11.1 8.7 32.5 31.7 33.6
Q3 10.6 36.5 38.1 10.6 11.3 8.2 35.6 33.4 34.7
Q4 11.9 40.9 42.6 11.9 12.6 9.2 38.8 37.2 37
Q5 23.7 54.6 53.9 23.7 26.7 21.6 46.5 47.5 42.9
While the ANAs are the only measure used to assess annual performance of all Primary School and Grade 9 learners at a national level, they suffer from a number of shortcomings that limit their ability to assess progress in educational outcomes. The 2013 ANA report specifically points out that ‘no technically defensible comparisons can be made on the results of ANA 2013 to those of previous years although the results of each year are valuable for the year under review’338 The DBE has also highlighted in its Action Plan to 2019 that several of the increases and decreases seen in the provincial ANA results are larger than what one is likely to find in any schooling system.339 These results are therefore very limited in terms of how they may be used to indicate the effectiveness of South Africa’s education system, schooling outcomes, where support is needed and how effective or ineffective previous school and teacher-level support has been.
Despite these potential limitations, the results do highlight several troubling trends. Firstly, the vast majority of learners in South African schools are not reaching adequate levels of achievement. In 2014, Only 35.4% of Grade 6 learners reached the adequacy achievement level of a score of 50% for mathematics in 2014 while 77% (up from 38% in 2012) and 42.3% of Grade 6 learners reached the adequacy threshold of 50% or higher on home language and first additional language examinations. Only 2.9% of Grade 9 learners achieved the 50% adequacy threshold in mathematics while 90% scored in the lowest non-achievement level. 48% of Grade
338 DBE. 2014. Report on the Annual National Assessment of 2013. Pretoria: Department of Basic Education. p 7. Available at http://www.education.gov.za/DocumentsLibrary/Reports/tabid/358/Default.aspx
339 See DBE. 2015. Action Plan to 2019 Towards the Realisation of Schooling 2030. Pretoria: DBE. p 29.
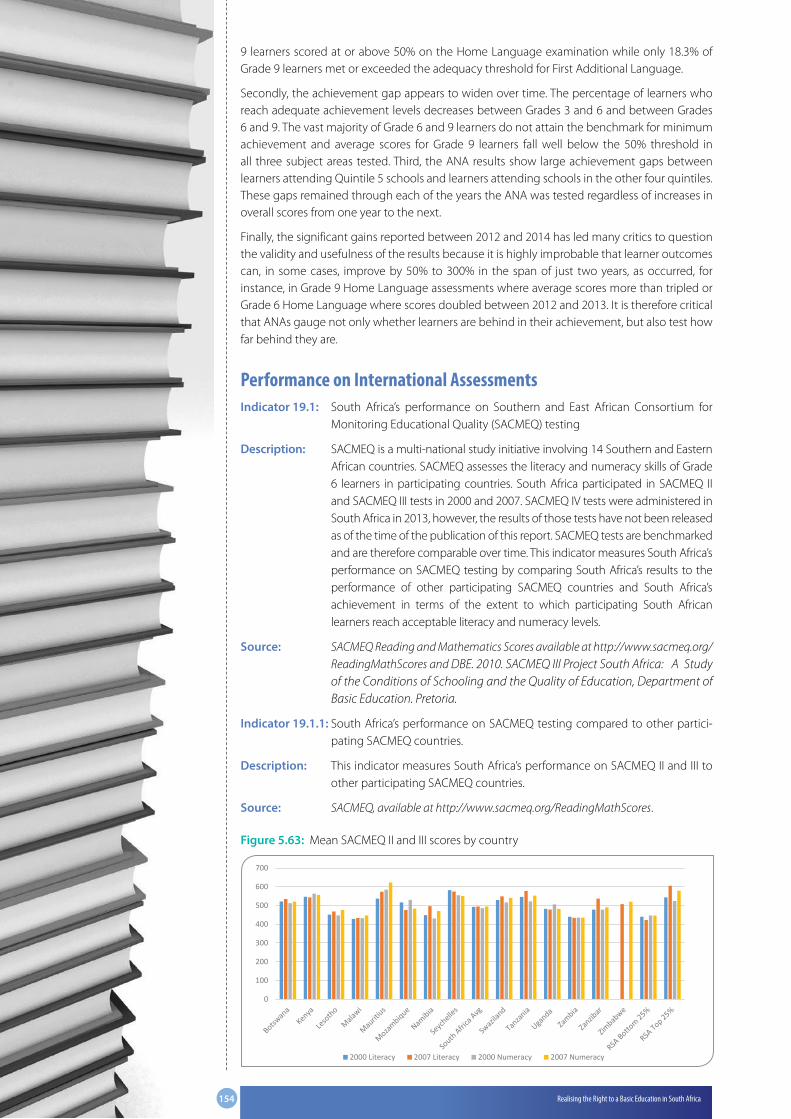
154 Realising the Right to a Basic Education in South Africa
9 learners scored at or above 50% on the Home Language examination while only 18.3% of Grade 9 learners met or exceeded the adequacy threshold for First Additional Language.
Secondly, the achievement gap appears to widen over time. The percentage of learners who reach adequate achievement levels decreases between Grades 3 and 6 and between Grades 6 and 9. The vast majority of Grade 6 and 9 learners do not attain the benchmark for minimum achievement and average scores for Grade 9 learners fall well below the 50% threshold in all three subject areas tested. Third, the ANA results show large achievement gaps between learners attending Quintile 5 schools and learners attending schools in the other four quintiles. These gaps remained through each of the years the ANA was tested regardless of increases in overall scores from one year to the next.
Finally, the significant gains reported between 2012 and 2014 has led many critics to question the validity and usefulness of the results because it is highly improbable that learner outcomes can, in some cases, improve by 50% to 300% in the span of just two years, as occurred, for instance, in Grade 9 Home Language assessments where average scores more than tripled or Grade 6 Home Language where scores doubled between 2012 and 2013. It is therefore critical that ANAs gauge not only whether learners are behind in their achievement, but also test how far behind they are.
Performance on International AssessmentsIndicator 19.1: South Africa’s performance on Southern and East African Consortium for
Monitoring Educational Quality (SACMEQ) testing
Description: SACMEQ is a multi-national study initiative involving 14 Southern and Eastern African countries. SACMEQ assesses the literacy and numeracy skills of Grade 6 learners in participating countries. South Africa participated in SACMEQ II and SACMEQ III tests in 2000 and 2007. SACMEQ IV tests were administered in South Africa in 2013, however, the results of those tests have not been released as of the time of the publication of this report. SACMEQ tests are benchmarked and are therefore comparable over time. This indicator measures South Africa’s performance on SACMEQ testing by comparing South Africa’s results to the performance of other participating SACMEQ countries and South Africa’s achievement in terms of the extent to which participating South African learners reach acceptable literacy and numeracy levels.
Source: SACMEQ Reading and Mathematics Scores available at http://www.sacmeq.org/ReadingMathScores and DBE. 2010. SACMEQ III Project South Africa: A Study of the Conditions of Schooling and the Quality of Education, Department of Basic Education. Pretoria.
Indicator 19.1.1: South Africa’s performance on SACMEQ testing compared to other partici-pating SACMEQ countries.
Description: This indicator measures South Africa’s performance on SACMEQ II and III to other participating SACMEQ countries.
Source: SACMEQ, available at http://www.sacmeq.org/ReadingMathScores.
Figure 5.63: Mean SACMEQ II and III scores by country
0
100
200
300
400
500
600
700
2000 Literacy 2007 Literacy 2000 Numeracy 2007 Numeracy

155 The Status of the Right to a Basic Education in South Africa: What indicators tell us
South Africa’s performance on SACMEQ examinations did not improve between 2000, when the test was first administered, and 2007. Figure 5.63 shows that South Africa’s mean scores in both language and mathematics in 2000 and 2007 fell below the Rasch-scaled mean score of 500 with South Africa scoring 492.6 and 486.2 on the 2000 language and mathematics tests and 495 and 494.8 on the language and mathematics examinations in 2007. Out of the 15 countries participating in the 2007 examinations, South Africa scored tenth for reading and eighth for mathematics behind poorer countries including Tanzania, Swaziland and Kenya. Among the participating countries, South Africa had the largest distinction amongst scores of participants in the wealthiest 25% and poorest 25% with the poorest 25% scoring just 423 on the 2007 reading test, down from 440.2 in 2000, and 446 on the 2007 mathematics test, just down from 446.8 in 2000. Learners in the wealthiest 25%, on the other hand showed improved scores between 2000 and 2007, achieving 606 in language in 2007, an increase from the 2000 score of 543.6 and 579 on the 2007 mathematics test, an increase from 524.3 in 2000.
Indicator 19.1.2: Percentage of South African learners reaching acceptable literacy and nu-meracy levels on SACMEQ assessments
Description: This indicator measures the percentage of learners who demonstrate acceptable performance on the SACMEQ II and III examinations administered in 2000 and 2007. The DBE has categorised reading competency and mathematics scores into eight levels. Reading levels from the lowest level to the highest level included: (1) Pre Reading; (2) Emergent Reading; (3) Basic Reading; (4) Reading for Meaning; (5) Interpretive Reading; (6) Inferential Reading; (7) Analytical Reading; and (8) Critical Reading. Numeracy levels from lowest to the highest included: (1) Pre Numeracy; (2) Emergent Numeracy; (3) Basic Numeracy; (4) Beginning Numeracy; (5) Competent Numeracy; (6) Mathematically Skilled; (7) Concrete Problem Solving; and (8) Abstract Problem Solving. According to the DBE, learners reached acceptable reading and numeracy levels if their scores placed them in level four or above.
Source: Moloi, M., Chetty, M. 2010. 2010. ‘SACMEQ III Project South Africa: A Study of the Conditions of Schooling and the Quality of Education. Pretoria: Depart-ment of Basic Education. p 44 - 48.
Figure 5.64: Percentage of South African SACMEQ II and III participants reaching acceptable performance levels on reading and numeracy examinations, by province
EC FS GP KZN LP MP NC NW WC SA% acceptable readers 2000 35.10% 38.90% 82.20% 58.00% 16.20% 25.90% 48.50% 29.90% 91.70% 49.90%% acceptable readers 2007 35.60% 56.00% 77.90% 45.50% 25.60% 47.50% 59.20% 58.70% 86.80% 51.70%% acceptable math 2000 10.80% 4.10% 49.90% 33.90% 8.40% 4.40% 11.50% 2.50% 60.70% 24.00%% acceptable math 2007 19.40% 27.20% 54.90% 26.40% 11.20% 21.30% 31.20% 31.70% 61.60% 30.80%
0.00%
10.00%
20.00%
30.00%
40.00%
50.00%
60.00%
70.00%
80.00%
90.00%
100.00%
Figure 5.64 shows that provincial scores varied in terms of the percentage of South African participants reaching acceptable levels of achievement in the 2000 and 2007 reading and mathematics assessments. Nationally, only 51.70% of participants reached an acceptable level of achievement in the 2007 reading examination and just 30.8% achieved the acceptable benchmark in mathematics. Participants in Limpopo and the Eastern Cape scored the lowest with just 25.6% of participants in Limpopo reaching the acceptable level of achievement standard for reading in 2007 and 11.2% reaching the benchmark for achievement in math.

156 Realising the Right to a Basic Education in South Africa
35.6% and 19.4% of participants from the Eastern Cape met those benchmarks on the 2007 reading and mathematics tests. The Western Cape and Gauteng were the only provinces where more than 50% of learners scored at or above the acceptable level on the 2007 reading and mathematics examinations with 86.8% and 61.6% of participants from the Western Cape meeting or exceeding the acceptable benchmark on reading and mathematics and 77.9% and 54.9% respectively meeting those benchmarks in Gauteng.
The SACMEQ examinations reveal high rates of non-numerate or non-reading learners. The DBE characterises non-readers as learners who demonstrate that they are unable to interpret meaning in a short and simple text and non-numerate Grade 6 learners as learners who have not moved beyond the mechanical skills related to basic calculation and simple shape recognition.340 Figure 5.65 shows that high rates of learners from the bottom four wealth quintiles demonstrated that they are non-numerate and non-readers on the 2007 SACMEQ examination. This classification means that these participants’ SACMEQ reading and numeracy scores placed them in level 2 or below. Nationally, 27.7% of Grade 6 South African SACMEQ III participants were non-readers and 40.2% of Grade 6 participants were non-numerate. Grade 6 participants in the poorest wealth quintile scored the lowest in terms of demonstrating non-numeracy and non-literacy with 58.7% of quintile 1 students demonstrating that they are non-numerate and 44.7% demonstrating that they are non-readers.
Figure 5.65: Percentage of learners classified as non-numerate and non-readers in 2007 SACMEQ III examination, by quintile
44.7%
34.4%30.4%
20.1%
1.4%
27.2%
58.7%
48.9% 47.4%
35.4%
4.6%
40.2%
0.0%
10.0%
20.0%
30.0%
40.0%
50.0%
60.0%
70.0%
Quintile 1 Quintile 2 Quintile 3 Quintile 4 Quintile 5 South Africa
% non-readers % non-numerate
Indicator 19.1.3: Percentage of Grade 6 learners effectively enrolled in school
Description: Spaull and Taylor propose a measure to assess access to quality education called “effective enrolment” which combines age-specific enrolment rates obtained from GHS data with test score data. The “effective enrolment rate” is the proportion of children in an age-specific population, including both those attending and not attending school, who reach a basic level of literacy and numeracy. Spaull and Taylor have used SACMEQ III data from 2007 to show the extent to which South African children associated with the grade 6 age-cohort have achieved basic levels of literacy and numeracy compared to children in other SACMEQ countries.
Source: Spaull, N. 2012. SACMEQ at a glance series. Research on Socio-economic Policy (RESEP). Available at: http://resep.sun.ac.za/wp-content/uploads/2012/07/Spaull-2012-SACMEQ-at-a-Glance-10-countries.pdf.
340 Source: Moli, M., Chetty, M. 2010. ‘SACMEQ III Project South Africa: A Study of the Conditions of Schooling and the Quality of Education.’ Pretoria: Department of Basic Education. At p. 57.

157 The Status of the Right to a Basic Education in South Africa: What indicators tell us
Figure 5. 66: Percentage of learners who were “effectively enrolled” in school in 2007 using SACMEQ III literacy and numeracy results
92%
85%
86%
89%
89%
88%
93%
89%
95%
98%
75% 82
%
55%
70%
71%
49%
80% 88
%
87%
71%
68% 74
%
36%
52% 55%
29%
49%
82%
84%
59%
0%10%20%30%40%50%60%70%80%90%
100%
Zimbabwe Tanzania Malawi Lesotho Uganda Zambia Namibia Swaziland Kenya SouthAfrica
Simple Enrolment Effective Enrolment Literacy Effective Enrolment Mathematics
Figure 5.66 shows that while South Africa has the highest enrolment rates of all of the SACMEQ countries, the country has relatively lower rates of effective enrolment than other participating countries. Using 2007 SACMEQ III results and 2007 GHS enrolment data, 71% of South African children of the Grade 6 age cohort had demonstrated at least basic levels of literacy and 59% of those children had reached basic levels in numeracy. Zimbabwe, Swaziland, Namibia, Kenya and Tanzania demonstrated higher rates of “effective enrolment” in literacy and Kenya, Swaziland, Tanzania and Zimbabwe reached higher rates of “effective enrolment” in numeracy. These rates are very concerning given that when including unenrolled children who are presumably non-numerate and illiterate, they indicate that 29% of the Grade 6 age cohort in 2007 were non-readers and 41% of children in the Grade 6 age cohort in 2007 were non-numerate. These rates are much higher than the poorer countries listed above that invest far less resources into public education.
Indicator 19.2: South Africa’s Performance on Trends in International Mathematics and Science Study (TIMSS) Assessment
Description: TIMSS is a multi-national assessment which tests Grade 4 and 8 learners on mathematics and science skills. TIMSS was administered to Grade 8 learners in South Africa in 1995 and 1999. Following poor results of South African Grade 8 learners which indicated that significant numbers of test participants were performing at guessing level, South Africa administered TIMSS to Grade 8 and 9 learners in 2002 and Grade 9 learners in 2011. The results of TIMSS are scaled so that they may be compared over time and across participating countries and are benchmarked where the score of 400 marks the minimum set of mathematics skills for Grade 8 students.
Source: HSRC. 2015. Beyond Benchmarks: What twenty years of TIMSS data tell us about South African Education. Pretoria: Human Sciences Research Council (HSRC). Available at http://www.timss-sa.org.za/?wpfb_dl=17
Figure 5. 67: South Africa TIMSS Performance, 1995 - 2011
276 275 264285
352
260 243 244268
332
0
50
100
150
200
250
300
350
400
Gr 8 1995 Gr 8 1999 Gr 8 2002 Gr 9 2002 Gr 9 2011
Math Science
South Africa has made substantial improvement between 2002 and 2011 on the TIMSS examination. South Africa’s scores on the Math and Science assessments for Grade 9 learners,

158 Realising the Right to a Basic Education in South Africa
however, continues to be significantly below the minimum international benchmark for Grade 8 Math and Science students of 400.
Figure 5.68: Grade 9 TIMSS Performance, by province
EC FS GP KZN LP MP NC NW WC RSA2002 Math 250 291 303 278 244 287 280 340 413 2852011 Math 316 359 389 337 322 344 350 366 404 3522002 Science 222 280 301 253 216 266 260 357 421 2682011 Science 282 341 387 308 284 326 334 368 409 332
0
50
100
150
200
250
300
350
400
450
Source: HSRC. (2015). Beyond Benchmarks: What twenty years of TIMSS data tell us about South African Education.
Pretoria: Human Sciences Research Council (HSRC).
Figure 5.68 shows that TIMSS results vary substantially amongst the provinces with the Western Cape being the only province where the average math and science scores for Grade 9 participants exceeded the Grade 8 minimum international benchmark of 400, though scores in the Western Cape regressed slightly between 2002 and 2011. Gauteng demonstrated the highest improvements of all provinces between 2002 and 2011, increasing its average math and science scores to 389 and 387 from 303 and 301. The Eastern Cape, Limpopo and Kwazulu-Natal were the lowest scoring provinces on both the 2002 and 2011 examinations. Grade 9 learners in those provinces continue to fall well below the international benchmark for Grade 8 math and science students. To gauge the extent of the varying performances amongst the provinces, Spaull has emphasised that Kwazulu-Natal’s 2011 science scores demonstrate that learners in that province are on average 2.5 years behind Grade 9 science learners in the Western Cape.341
Figure 5.69: 2011 TIMSS Performance, by School Quintile
316 318 336 360
438
352397
338279 285
314348
445
332
404369
0
100
200
300
400
500
SA Quintile 1 SA Quintile 2 SA Quintile 3 SA Quintile 4 SA Quintile 5 RSA Botswana Honduras
Mathematics Science
Source: HSRC. (2015). Beyond Benchmarks: What twenty years of TIMSS data tell us about South African Education.
Pretoria: Human Sciences Research Council (HSRC).
Figure 5.69 shows that Grade 9 students in quintile 5 schools achieved well above the international minimum benchmark while students in the lower four wealth quintiles exhibited mean scores that fell well below the benchmark of 400. This figure also compares South Africa’s performance to Botswana and to Honduras because they are the only other countries that used TIMSS to test Grade 9 performance.
Indicator 19.2.1: The percentage of Grade 9 TIMSS participants scoring above the minimum international math and science benchmarks.
341 Spaull, N. (2013). South Africa’s Education Crisis: The quality of education in South Africa 1994 – 2011. Centre for Development and Enterprise. Johannesburg, at p. 6.

159 The Status of the Right to a Basic Education in South Africa: What indicators tell us
Description: This indicator measures the percentage of South African TIMSS participants scoring above the minimum math and science benchmarks.
Source: HSRC. 2015. ‘Beyond Benchmarks: What twenty years of TIMSS data tell us about South African Education.’ Pretoria: Human Sciences Research Council (HSRC).
Figure 5.70: Percentage of Grade 9 TIMSS participants scoring above the minimum inter-national benchmarks in math and science
11%24%
13%25%
0%20%40%60%80%
100%
TIMSS Math 2002 TIMSS Math 2011 TIMSS Science 2002 TIMSS Science 2011
Figure 5.70 shows that approximately three-quarters of Grade 9 South African learners scored below the international benchmark used to determine basic science and math knowledge expected of Grade 8 students. Moreover, in 2011, the majority of those participants who did succeed in reaching or exceeding the minimum international benchmark fell into the low achievement category. Of the 24% of participants who achieved the minimum benchmark, only 9% of Grade 9 participants in 2011 demonstrated that they had acquired more than the minimum set of mathematics skills and of the 25% of Grade 9 participants who met or exceeded the minimum benchmark in science, 11% demonstrated that they possessed more than the minimum set of science skills.342
Indicator 19.3: Performance on the Progress in International Reading Literacy Study (PIRLS)
Description: This indicator measures South Africa’s performance on the PIRLS assessments. PIRLS is an international assessment that tests reading literacy of Grade Four and Grade Eight learners in 45 countries. South Africa participated in the Grade 4 assessment in 2006 and 2011. The Grade 4 assessment was administered to South African learners in both Grade 4 and Grade 5 so progress amongst the two years could be assessed and to address concerns around the transition from instruction in home language to English or Afrikaans first language that occurs at Grade 4. In 2006, only 13% of Grade Four South African learners and 22% of participating Grade Five South African learners achieved the Low International Benchmark of 400, indicating that 87% of Grade Four learners and 78% of Grade Five learners had not mastered basic reading skills and were therefore at risk of not learning how to read.343
Due to the poor outcomes in the 2006 PIRLS assessments, 15,744 Grade 4 South African learners participated in prePIRLS in 2011, which was a less difficult assessment intended to measure the reading comprehension skills of learners who were still in the process of learning how to read. Only those South African Grade 5 learners whose language of learning and teaching was English or Afrikaans participated in PIRLS 2011. The switch to prePIRLS for Grade 4 learners and the limitation of Grade 5 participants to English and Afrikaans language learners make the testing outcomes incomparable across those years. The 2011 test does, however, provide insight into the level of equality that exists in terms of reading outcomes across languages of learning and teaching, provinces and wealth quintiles.
Source: PIRLS Data, Calculated by Howie, S., et al. 2012. ‘PIRLS 2011 Progress in Inter-national Reading Literacy Study 2011: South African Children’s Reading Literacy Achievement Summary Report.’ Pretoria: Centre for Evaluation and Assessment, University of Pretoria.
342 HSRC. 2015. ‘Beyond Benchmarks: What twenty years of TIMSS data tell us about South African Education.’ Pretoria: Human Sciences Research Council (HSRC). at p. 5.
343 Spaull, N. 2013. South Africa’s Education Crisis: The quality of education in South Africa 1994 – 2011. Johannesburg: Centre for Development and Enterprise. p 19.

160 Realising the Right to a Basic Education in South Africa
Figure 5.71: Grade 4 performance on 2011 prePIRLS examination, by LOLT
530 525451 442 435 428 428 425 406 395 388
461
0
100
200
300
400
500
600
Figure 5.72: Percentage of Grade 4 prePIRLS participants who reached the low international benchmark, by language of learning and teaching
10 12 24 29 31 38 34 36 47 53 5729
90 88 76 71 69 62 66 64 53 47 4371
0
20
40
60
80
100
Did not reach Low International benchmark or above
The 2011 prePIRLS examination was administered in all eleven South African languages. The above figures show that Grade 4 English and Afrikaans home language learners achieved far higher scores than learners who studied in an African home language as their language of learning and teaching. Moreover, significant percentages of African home language learners failed to reach the low international benchmark demonstrating of 400, which as stressed by the DBE, indicates an inability to locate and retrieve an explicitly stated detail in a text.344 Moreover, of the 71% of Grade 4 learners who did reach the minimum international benchmark on prePIRLS, 30% did not achieve beyond the low international benchmark, indicating that though they did demonstrate basic reading skills, they were unable to elicit meaning, make straightforward inferences or interpret obvious reasons or causes from a text.
Figure 5.73: Percentage of 2011 Grade 5 PIRLS participants who reached various levels of achievement
45 39 43
5
21 28 23
15
19 22 20
36
10 9 10
36
5 2 4 8
0%
10%
20%
30%
40%
50%
60%
70%
80%
90%
100%
English Afrikaans South Africa International MedianDid not reach Low International banchmark Intermediate International Benchmark
High International Benchmark Advanced International Benchmark
Figure 5.73 shows that Grade 5 English and Afrikaans learners also performed poorly on the PIRLS test, with 45% of learners taking the test in English and 39% of learners taking the test in Afrikaans failing to reach the low international benchmark. While 5% of English speaking Grade
344 DBE. (2013). Macro Indicator Report 2013. Pretoria: Department of Basic Education. At p. 52.

161 The Status of the Right to a Basic Education in South Africa: What indicators tell us
5 participants reached the advanced international benchmark, which is comparable to the 8% median in other participating countries that scored far higher than South Africa, the rate of South African learners who failed to reach the low international benchmark was nine times higher than the international median scores, indicating that the system is failing to teach basic reading skills to nearly half of its population. Moreover, these scores only included learners who attended schools that had offered English and/or Afrikaans up to Grade 5. This limited participation means that learners who attended schools that offered LOLT in African languages were not included in the Grade 5 sample.
Adult Basic EducationIndicator 20.1: The number of South Africans attending Adult Basic Education and Training
or literacy programmes
Description: This indicator measures the extent to which adults report that they are enrolled in Adult Basic Education and Training Learning Centres or literacy programmes using General Household Survey Data.
Source: Stats SA, General Household Survey, 2002 - 2014
Figure 5.74: Number of South Africans attending Adult Basic Education and Training learning centres or literary classes, by gender
0
20000
40000
60000
80000
100000
120000
140000
160000
2002 2003 2004 2005 2006 2007 2008 2009 2010 2011 2012 2013 2014
Male Female Total
Figure 5.74 shows that 2014 approximately 108,000 South Africans attended adult basic edu-cation and training learning centres, 11,000 of which attended literacy classes. While these statistics show improvement from 2002 when 58,000 adults attended adult basic education and training and literacy classes, they also show that there is a need to improve access and participation in adult basic education programmes. As Figure 5.51 shows, over 30% of South Africans over the age of 20 have not completed Grade 9 or higher and 16% have not attained Grade 7 completion, the benchmark for functional literacy. GHS data further show that over 6.6% of South Africans over the age of 20 are illiterate in that they are unable to read newspapers, magazines or books in at least one language or write a letter in at least one language. These rates amount to over 9 million adults over the age of 20 who have not completed Grade 9, over 5 million adults who have not completed Primary School and over 2 million adults who report that they are unable to undertake the literacy activities surveyed in the GHS.
The GHS reflects far fewer numbers of adults who attend Adult Basic Education and Training centres and literacy classes than DBE statistics. The DBE reported in 2015 that the Kha Ri Gude Mass Literacy Campaign enrolled over 3.8 million illiterate and semi-literate South Africans since it was first implemented in 2008 to reduce the number of illiterate South Africans in half from the 9.6 million identified in the 2001 census to 4.7 million.345 The DBE has described the Kha Ri Gude programming as enrolling an average of 550,000 learners per year between 2008 and 2014. The GHS, however, does not appear to reflect these enrolment figures.
Indicator 20.2: Number of adults who enrolled in Adult Education and Training Centres and registered, wrote and completed GETC-AET Level 4 (Grade 9) qualification
Description: This indicator measures the extent to which students are enrolling in Adult Education and Training Centres and achieving GETC-AET Level 4
345 Mweli, HM, Ramarumo, M. (2015). 28 July 2015 Progress Report on Kha Ri Gude Literacy Campaign to the Basic Education Portfolio Committee. Available at https://pmg.org.za/committee-meeting/21198/.

162 Realising the Right to a Basic Education in South Africa
qualification, which is the equivalent of completing grade 9. Students who pass the examination are awarded General Education and Training Certificates (GETC) which enable them to progress on to Further Education and Training programmes.
Source: DHE. Statistics on Post-School Education and Training in South Africa: 2010 – 2013.
Table 5.3: Adults who enrolled in, wrote and passed GETC-AET Level 4 qualification
Year Enrolled Wrote Passed % Passed
2010 143530 75832 17888 23.6%
2011 96452 62044 17001 27.4%
2012 90384 49856 18663 37.4%
2013 109518 52501 19945 38.0%
Table 5.3 shows that adult learners enrolled in Adult Basic Education and Training Programmes have low completion rates for the GETC-AET Level 4 qualification. Less than half of those learners who enrolled and registered for the examination actually wrote the exam in 2013. Pass rates were also low, as less than 40% of adult learners who took the examination in 2013 passed. While this figure shows progress from 2010 and 2011 when 23.6% and 27.4% of candidates, respectively, passed the examination for Grade 9 achievement, the number of adult students who wrote the examination dropped considerably from 75,832 in 2010 to just 49,856 in 2012 and 52,501 in 2013. These figures show that only .5% of the more than 9 million adults over the age of 20 who did not complete grade 9 took the equivalency exam through an Adult Education and Training Centre Programme with just over .2% of that population passing.
Post-schooling employment and enrolment in higher education institutionsIndicator 21.1: Percentage of individuals aged 18 to 29 enrolled in higher education
institutions
Description: This indicator measures the percentage of individuals aged 18 to 29 en-rolled in higher educational institutions (universities and universities of technology) by dividing the number of individuals attending higher educational institutions by the total number of individuals in that age cohort using General Household Survey data.
Source: Stats SA, General Household Survey, 2002 – 2014
Figure 5.75: Percentage of youth aged 18 to 29 enrolled in higher education institutions (universities and universities of technology), by population group
2.8 3.4
12.715.6
43.4 3
13.1
23.3
4.8
0
5
10
15
20
25
Black African Coloured Indian/Asian White South Africa
2002 2014
Figure 5.75 shows that approximately 4.8% of youth between the ages of 18 and 29 were enrolled in higher education institutions in South Africa, marking an increase from 4% enrolment in 2002. Enrolment rates vary greatly amongst population groups, with an estimated 23.3% of Whites, 13.1% of Indian/Asian, 3% of Coloured and 3.4% of Black Africans between the

163 The Status of the Right to a Basic Education in South Africa: What indicators tell us
ages of 18 and 29 enrolled in higher education institutions. While rates of white 18 to 29 year-olds attending higher education institutions increased substantially by nearly 7% from 2002 to 2014, rates of Black African, Coloured and Indian/Asian attending educational institutions all increased by less than 1% over that twelve-year period.
Indicator 21.2: Number and percentage of 15 to 24 year-old youth not employed and not in education or training (NEETs).
Description: This indicator measures the extent to which the education system is preparing youth for employment and/or higher education or training. While this indicator is confounded by other factors that impact post-school employment and educational opportunity such as policies which advance access to higher education institutions and economic conditions that impact the supply of jobs, this indicator does assess the extent to which the education system has been successful in terms of keeping youth enrolled in educational programmes until they are prepared to obtain employment or advance to higher education. The figures used to measure NEETs are derived from dividing the number of youth who are unemployed or in education or training by the total number of 15 to 24 year-olds using Census data from 1996, 2001 and 2011. Persons not employed, for purposes of this indicator, refers to persons who were not employed in the reference week of the census survey, were actively seeking work in the four weeks prior to the survey interview, and were available to begin work that week or had not actively looked for work in the past four weeks but had a job or business to start at a definite date in the future and were available.
Source: Stats SA, Census data calculated by the DHET. 2013. FACT SHEET on “NEETs”: An analysis of the 2011 South African Census, available at http://www.dhet.gov.za/Research%20Coordination%20Monitoring%20and%20Evaluation/FACT%20SHEET%20ON%20NEETS%20(Persons%20who%20are%20not%20in%20employment,%20education%20or%20training).pdf; Stats SA. (2015). Labour market dynamics in South Africa, 2014. Statistics South Africa. Pretoria.
Figure 5.76: Number of 15 to 24 year-old youth who are not employed and not in education or training (NEETs), by highest level of educational attainment
0
2000
4000
6000
8000
10000
1996 2001 2011
NEETs with No Schooling Primary or less
NEETs with Secondary education less than Grade 12 NEETs with Grade 12 (Matric)
NEETs with Grade 12 plus Certificate/Diploma NEETs with Degree
Other and unspecified Employed or attending education or training
Table 5.4: Number and rate of 15 to 24 year-old NEETs by census year (thousands)
1996 2001 2011
Total number of persons aged 15 – 24 years of age (in thousands)
8166 9271 10378
Number of 15 – 24 year-olds who are NEET (in thousands) 2049 3155 3199
Rate of NEETs 25.1% 34.0% 30.8%

164 Realising the Right to a Basic Education in South Africa
Table 5.5: NEETs by highest level of education attained
1996 2001 2011
Num
ber (
thou
sand
s)
% o
f NEE
Ts
% o
f 15-
24 y
ear-
olds
Num
ber (
thou
sand
s)
% o
f NEE
Ts
% o
f 15-
24 y
ear-
olds
Num
ber (
thou
sand
s)
% o
f NEE
Ts
% o
f 15-
24 y
ear-
olds
No Schooling 290 14.2% 3.6% 380 12.0% 4.1% 110 3.4% 1.1%
Primary or less 563 27.5% 6.9% 661 20.9% 7.1% 414 13.0% 4.0%
Secondary education less than Grade 12 390 19.0% 4.8% 562 17.8% 6.1% 1482 46.3% 14.3%
Grade 12 (Matric) 339 16.5% 4.2% 660 20.9% 6.5% 1102 34.4% 10.6%
Grade 12 with Certificate/Diploma 415 20.3% 5.1% 853 27.0% 9.2% 74 2.3% .71%
Degree 2 .1% .02% 9 .3% .1% 11 .34% .1%
Other and unspecified 50 2.4% .61% 0 0 6 .18% .06%
Figure 5.76 shows that in 2011, of the 10,378 youth between the ages of 15 – 24, over seven million were employed or attending educational institutions while over three million were NEETs, meaning they were unemployed and not attending educational institutions. According to the census, the rate of NEETs in 2011 decreased to 30.8% of this youth population, down from 34% in 2001 and up from 25.1% in 1996. Between 2001 and 2011, youth between the ages of 15 and 24 who were not in employment and not in education with no schooling or no secondary schooling dropped from 4.1% and 7.1% of 15 to 24 year-olds to 1.1% and 4.0% of 15 to 24 year-olds. In 2011, an estimated 1.1% of 15 to 24 year-olds were NEETS who had no education and 4% were NEETS whose highest level of education did not advance beyond primary schooling.
These data show that the rates of unemployed and out-of-school 15 to 24 year-olds with no education or no secondary education dropped between 2001 and 2011. However, rates of 15 to 24 year-olds whose highest level of educational attainment was either some secondary education or the completion of Grade 12 were unemployed and not attending educational institutions were higher in 2011 than in previous census years. In 2011, 14.3% of 15 to 24 year-olds were NEETs whose highest level of educational attainment was some secondary schooling, up from 6.1% in 2001 and 4.2% in 1996. Moreover, an estimated 10.6% of 15 to 24 year-olds were NEETs who had achieved a National Senior Certificate/Matric as their highest level of education, an increase over the estimated 6.5% and 4.2% of 15 to 24 year-olds falling within that category in the 2001 and 1996 census years, respectively. These statistics show that in 2011 more than 1.1 million 15 to 24 year-olds who achieved matric/NSC in 2011 were not employed and not attending an educational institution.
Recent data published by StatsSA in 2014 show that high rates of 15 to 24 year-olds continue to not be in employment, education or training. Numbers of youth in this age range who are NEETs are similar to those figures cited in the 2011 census data. In 2014, approximately 3.1 million youth between the ages of 15 and 24 were NEETs out of a total of approximately 10.26 million youth within that age population.

165 The Status of the Right to a Basic Education in South Africa: What indicators tell us
Figure 5.77: Percentage of youth aged 15 to 24 not in employment, education or training (NEET) by age, 2014
15 16 17 18 19 20 21 22 23 24% NEET 4.1 6.1 9.9 18 30.6 41.2 45.8 52.2 53.6 53.7
0204060
Source: StatsSA. 2015. Labour market dynamics in South Africa, 2014. Pretoria: Statistics South Africa. p 6-9.
Figure 5.77 shows that more than half of 22, 23 and 24 year-olds and just over 31% of all 15 to 24 year-olds were not in employment, education and training in 2014. Female youth between these ages are more likely to be NEETs than male youth. Figure 5.78 shows that Black African and Coloured youth are far more likely to be NEETs than White and, to a lesser extent, Indian youth.
Figure 5. 78: Percentage of youth aged 15 to 24 not in employment, education or training in 2014, by population group and gender
32.335.2
25
14
28.8
33.931.3
0
5
10
15
20
25
30
35
40
Black African Coloured Indian/Asian White Male Female Total
Source: Stats SA. (2015). ‘Labour market dynamics in South Africa, 2014.’ Pretoria: Statistics South Africa. 2015., at
p. 6-10.
Figure 5.79: Percentage of youth aged 15 - 24 not in employment, education or training by educational attainment in 2014
26.9
43.1
35.840.3
31.3
0
10
20
30
40
50
Less than Matric Matric Tertiary Other Total
Source: StatsSA. 2015. ‘Labour market dynamics in South Africa, 2014.’ Statistics South Africa. Pretoria. p 6-10.
Finally, Figure 5.79 shows that high rates of youth between the ages of 15 and 24 years of age are not in employment, education and training regardless of educational attainment. Approximately 43.1% of youth within that age population who have attained a matric certificate are NEETs. Over 3 in 10 youth between the ages of 15 and 24 who hold a tertiary qualification were not in employment, education or training in 2014. Stats SA has emphasised that these findings demonstrate that even youth in South Africa who attain higher educational qualifications are vulnerable in the current labour market.

166 Realising the Right to a Basic Education in South Africa
CONCLUSION
This report has assessed the constitutional and other legal obligations that the state has in terms of making basic education of an adequate quality universally available to all South Africans. Chapter 3 provided an overview and assessment of the legislative, regulatory and policy frameworks that the State has developed and implemented in order to give rise to the realisation of the right while Chapter 4 investigated the state’s resource allocation and budget expenditure towards basic education. Through the development of indicators, Chapter 5 evaluated the progress that the state has made in terms of making basic education accessible and providing adequate inputs such as qualified, competent and motivated teachers, learning and teaching materials, school infrastructure and classrooms. Finally, the indicators assessed the quality of South Africa’s basic education system by considering outcomes such as educational attainment, achievement on national and international assessments and youth participation in post-school employment and education.
The indicators show that learner enrolment rates have improved, especially amongst learners attending Grade R programming and during the compulsory schooling phase where enrolment rates are nearly universal amongst 7 to 15 year-olds. Gender parity has also improved substantially from prior generations and female learners are now more likely than their male counterparts to progress through primary and secondary school.
Outcomes, however, continue to be poor with less than half of South Africans between the ages of 22 and 25 completing Grade 12 and attaining their Senior Certificates. In 2014, bachelor degree passes qualifying learners to study for a bachelor programme at a university accounted for less than 15% of the number of learners enrolled in Grade 10 in 2012. South Africa’s poor performance on international assessments that have focused on learners in Primary School and Grade 9 overwhelmingly show that the majority of learners are faced with large learning deficits from earlier grades that secondary schools are ill-equipped to address. While the 2011 TIMSS assessment showed substantial improvement since the test had last been administered in 2002, the results were still alarmingly low, as approximately three-quarters of Grade 9 South African learners tested in 2011 failed to meet the minimum benchmarks for Grade 8 mathematics and science. The prePIRLS and PIRLS assessments administered to Grade 4 and 5 learners also painted a picture of primary school learners who face substantial reading deficits in early grades. Those tests showed that 29% of Grade 4 learners failed to demonstrate basic reading skills and approximately 60% could not elicit meaning, make straightforward inferences or interpret obvious reasons or causes from a text. Grade 4 learners who learned in African languages demonstrated particularly poor reading skills with rates of learners lacking basic reading skills at approximately two to five times higher than the rates of English and Afrikaans speaking Grade 4 learners. However, by Grade 5, 43% of English and Afrikaans home language participants failed to meet international minimum benchmarks for reading competency. These results are consistent with SACMEQ III results from 2007 that showed that 27% of South African participants were non-readers, 40% were non-numerate, approximately half failed to meet acceptable reading levels and 70% failed to demonstrate acceptable numeracy skills.
These poor outcomes at early stages in educational development prevent learners from progressing through the system, as exhibited by high rates of grade repetition that have increased as learners have stayed in school longer. The DBE has highlighted that the end result of these learning deficits is that learners eventually reach a stage in secondary school where they are so far behind in terms of building the skills necessary to pass the NSC examination that they accordingly exit the education system without attaining any sort of degree.
There are a number of causes for these poor results. Insufficient inputs such as poor teacher subject knowledge and pedagogical skills, low levels of curriculum coverage, high rates of teacher absenteeism, poor school management, lack of libraries and access to reading materials, poor school infrastructure and overcrowded classrooms are examples of some of the input shortcomings that impact South Africa’s poorest and most vulnerable learners the most. Structural inadequacies such as insufficient monitoring, support and accountability practices in many instances cause or perpetuate the inadequate state of curriculum delivery that occur in far too many schools and their classrooms. While teachers show poor degrees of subject
CHAPTER
6
Outcomes, however, continue to be poor with less than half of
South Africans between the ages of 22 and 25 completing Grade 12
and attaining their Senior Certificates.

167 CONCLUSION
content knowledge, teachers in the provinces where teacher knowledge and training backlogs are the most severe also had the highest rates of teachers who report having completed zero hours of in-service professional development training nine months into the school year.
The degree of progress that the state has made towards ensuring the universal realisation of the right to quality basic education must be understood within South Africa’s historical and socio-economic context. Learners in South Africa enter the schooling system with vastly different socio-economic backgrounds which invariably impact their ability to succeed from Grade 1 onwards. The wealthiest learners have access to quality ECD programmes and Grade R schooling. They come from households and communities that have historically benefited from high quality education. Once they enter the public education system, they are able to attend public schools with more highly trained and specialised teachers in smaller classroom environments and with greater access to learning and teacher support materials and other educational resources paid for through school fees. The vast majority of South Africa’s poorest learners, on the other hand, come from largely uneducated households and communities due to a historically unjust and unequal apartheid education system. These learners are therefore unable to receive comparable educational support at home when compared to wealthier learners. They attend schools in largely overcrowded classrooms with teachers who suffer from poor subject knowledge and pedagogical skills as a result of their own limited access to quality pre-service education and training, inadequate support and a lack of participation in quality in-service training.
Obstructive behaviour by interest groups that prioritise the interests of labour over the best interest of learners also contributes to the current state of South Africa’s basic education system. Appointments to key management positions based on patronage rather than merit, insufficient monitoring and oversight of the quality of teaching that occurs in classrooms and inefficient teacher post-provisioning continue to serve as examples of the negative consequences of this obstructive behaviour.
This report has provided a number of recommendations to address some of the identified key systemic shortcomings which exist in South Africa’s Basic Education system. While these recommendations speak to a wide range of issues, they generally follow two themes. Firstly, there is a strong need to improve capacity within the education sector. This includes the need to upgrade the capacity and practices of teachers; principals and other key school-level managers; district offices and their officials responsible for monitoring and supporting schools; and provincial education departments responsible for coordinating the delivery of critical school resources such as school infrastructure and learning and teaching support materials. Secondly, there needs to be improved governance over the relationships between critical actors involved in the provision of public education services and resources. These actors include national and provincial departments of basic education, District Offices, School Governing Bodies, teachers, principals, organised labour and private parties involved in the delivery of educational resources and related services. Recommendations that fall within this category largely concern the need to implement improved monitoring and accountability systems that ensure that these critical role players are clearly aware of, able to comply with and are actually fulfilling their roles and responsibilities. As has been stressed throughout this report, improvements to the education system rely on a number of actors fulfilling their mandates. It is therefore critical that the Minister of Basic Education exercise her power to implement uniform norms and standards that clearly define these mandates, set targets and delivery deadlines, implement monitoring systems, hold actors accountable for their performance and make provision for how to respond to delivery failures that if not quickly resolved, limit the ability of learners to realise their right to a quality basic education.
This report has provided a number of recommendations to address some of the
identified key systemic shortcomings which exist in South Africa’s
Basic Education system.

168 Realising the Right to a Basic Education in South Africa
BIBLIOGRAPHYN.B. all internet sources checked and accessed 23 October 2015
South African CasesBasic Education for All and Others v. Minister of Basic Education and Others, 2014 (4) SA 274 (GP).
Centre for Applied Legal Studies and Others v Hunt Road Secondary School and Others, Case
No. 1 0091/2006. High Court of South Africa, Durban and Coast Local Division (DCLD)
[Unreported]
Ex parte Gauteng Provincial Legislature: In re Dispute Concerning the Constitutionality of Certain Provisions of the Gauteng School Education Bill of 1996 1996 (3) SA 165 (CC) at para 9.
Executive Council, Western Cape v Minister of Provincial Affairs and Constitutional Development and Another; Executive Council, KwaZulu-Natal v President of the Republic of South Africa and Others (CCT15/99,CCT18/99) [1999] ZACC 13; 2000 (1) SA 661; 1999 (12) BCLR 1360 (15 October 1999), at para 44
FEDSAS v the Member of the Executive Council, Department of Basic Education, Gauteng Province and others, High Court of South Africa, Gauteng Local Division, Johannesburg, Case No. 2015/18246, 26 May 2015.
Governing Body of the Juma Musjid Primary School & Others v Essay N.O. and Others 2011 (8) BCLR 761 (CC) at para 37.
Government of the Republic of South Africa and Others v Grootboom and Others (1) SA 46 (CC). 2000 (I I) BCLR 1169 (CC).
Linkside and Others v Minister of Basic Education and Others (3844/2013) [2015] ZAECGHC 36 (26 January 2015).
MEC for Education in Gauteng Province and Others v Governing Body of Rivonia Primary School and Others [2013] CCT 135/12.
MEC for Education, Gauteng Province & others v Governing Body, Rivonia Primary School & others 2013 (6) SA 582 (CC).
Minister of Health & Others v. Treatment Action Campaign & Others (No 2). 2002 (5) SA 721 (CC) Para 39.
Mpumalanga Department of Education and Another v Hoerskool Ermelo and Another 2009 (2) SA 415 (CC); 2010 (3) BCLR 177 (CC) at para 2.
Soobramoney v Minister of Health, KwaZulu-Natal 1998 1 SA 765 (CC)
South African Police Service v Public Servants Association 2006 (3) SA 521 (CC) at para 19
Western Cape Forum for Intellectual Disability v Government of the Republic of South Africa and Another 2011 (5) SA 87 (WCC).
International Human Rights InstrumentsInternational Covenant on Economic, Social and Cultural Rights (ICESCR) ILM 360 (1967); 993 UNTS 3 adopted on 16 December 1966, ratified by the South African Government on 12 January 2015 and entered into force on 12 April 2015
Secretary General of the Organisation of the African Union (1990) African Charter on the Rights and Welfare of the Child, OAU resolution 21/8/49. Addis Adaba: OAU.
The United Nations Convention on the Rights of the Child. j28 ILM 1456 (1989), 1577 UNTS 3 adopted on 20 November 1989, entered into force on 2 September 1990
UN Committee on Economic, Social and Cultural Rights, General Comment 13
Universal Declaration of Human Rights, GA Res 217A (III), UN Doc A/810 at 71 (1948)

169 CONCLUSION
South African Government Reports, Policy Documents, Presentations and StatementsAuditor-General of South Africa. 2015. 2013-2013 Education Sector Report. p 34. Pretoria Available at https://www.agsa.co.za/Documents/Valueaddingauditreports/Specialauditreports.aspx
Council on Higher Education. 2010. Report on the national review of academic and professional programmes in education. HE Monitor No. 11. Pretoria. Available at http://www.che.ac.za/media_and_publications/higher-education-monitor/higher-education-monitor-11-report-national-review
DBE, 9 Feb 2012 Press Release, National Education Evaluation and Development Unit (NEEDU) Bill: Call for Comments, available at http://www.gov.za/national-education-evaluation-and-development-unit-needu-bill-call-comments
DBE. 2010. ‘Education for All 2010 Country Report.’ Pretoria: Department of Basic Education. p 48. Available at http://www.education.gov.za/researchreports/tabid/708/Default.aspx
DBE. 2010. National Policy for an Equitable Provision of an Enabling School Physical Teaching and Learning Environment. Government Gazette Volume 540, No. 33283., Pretoria, 11 June 2010. p 5. Available at http://www.education.gov.za/DocumentsLibrary/Policies/tabid/390/Default.aspx
DBE. 2010. Report on the National Senior Certificate Results 2009. Pretoria. Department of Basic Education. Available at http://www.education.gov.za/DocumentsLibrary/Reports/tabid/358/Default.aspx
DBE. 2010. The Status of the Language of Learning and Teaching (LOLT) in South African Public Schools: A Quantitative Overview. Pretoria: Department of Basic Education. Available at http://www.education.gov.za/DocumentsLibrary/Reports/tabid/358/Default.aspx.
DBE. 2011. Action Plan to 2014 – Towards the Realisation of Schooling 2025. Pretoria: Department of Basic Education. p 146. Available at http://www.education.gov.za/Curriculum/ActionPlanto2014/tabid/418/Default.aspx
DBE. 2011. Annual Performance Plan 2011 – 2012. Pretoria: Department of Basic Education.
DBE. 2011. Integrated Strategic Planning Framework for Teacher Education and Development in South Africa 2011 – 2025. Technical Report. Department of Basic Education. April 2011. Pretoria, p 12. Available at http://www.dhet.gov.za/Teacher%20Education/Technical%20Report%20-%20Intergrated%20Strategic%20Planning%20Framework%20for%20Teacher%20Education%20and%20Development%20In%20SA,%2012%20Apr%202011.pdf
DBE. 2011. Integrated Strategic Planning Framework for Teacher Education and Development in South Africa 2011 – 2025. Technical Report. Pretoria: Department of Basic Education. Pretoria. April 2011. P 30. Available at http://www.education.gov.za/LinkClick.aspx?fileticket=oMIDJZBwSIc%3D&tabid=358&mid=2316
DBE. 2011. Report on the National Senior Certificate Results 2010. Pretoria. Department of Basic Education. Available at http://www.education.gov.za/DocumentsLibrary/Reports/tabid/358/Default.aspx
DBE. 2012. Report on the Annual National Assessment of 2012. Pretoria: Department of Basic Education. Pretoria: Department of Basic Education. http://www.education.gov.za/DocumentsLibrary/Reports/tabid/358/Default.aspx
DBE. 2012. Report on the National Senior Certificate Examination 2011 Technical Report. Pretoria: Department of Basic Education. http://www.education.gov.za/DocumentsLibrary/Reports/tabid/358/Default.aspx
DBE. 2013. ‘Detailed Indicator Report for the Basic Education Sector.’ Department of Basic Education. p 37. Available at http://www.education.gov.za/researchreports/tabid/708/Default.aspx
DBE. 2013. 2012 National Senior Certificate Examination Technical Report. Pretoria: Department of Basic Education. Available at http://www.education.gov.za/DocumentsLibrary/Reports/tabid/358/Default.aspx

170 Realising the Right to a Basic Education in South Africa
DBE. 2013. Annual Surveys: Report for Ordinary Schools 2010 – 2011. Pretoria: Department of Basic Education Available at http://www.education.gov.za/DocumentsLibrary/Reports/tabid/358/Default.aspx
DBE. 2013. IQMS Annual Report 2012 – 2013. Pretoria: Department of Basic Education.
DBE. 2013. Macro Indicator Report. Pretoria: Pretoria: Department of Basic Education. Available at http://www.education.gov.za/DocumentsLibrary/Reports/tabid/358/Default.aspx
DBE. 2013. Policy on the Organisation, Roles and Responsibilities of Education Districts. Notice 300 of 2013. Government Gazette, 3 April 2013. p 4. Available at http://www.gov.za/documents/national-education-policy-act-policy-organisation-roles-and-responsibilities-education
DBE. 2013. Report on the Annual National Assessment of 2013. Pretoria: Department of Basic Education. Pretoria: Department of Basic Education. http://www.education.gov.za/DocumentsLibrary/Reports/tabid/358/Default.aspx
DBE. 2013. Report on the National School Monitoring Survey 2011 (DBE013, Conducted in 2011). Pretoria: Department of Basic Education. p 205. Available at http://www.education.gov.za/LinkClick.aspx?fileticket=nbaa%2Bhb1H%2Bw%3D&tabid=741&mid=3176
DBE. 2013. School Monitoring Survey (DBE013, Conducted in 2011) Technical Report. Pretoria: Department of Basic Education. Available at http://www.education.gov.za/tabid/741/Default.aspx
DBE. 2014. ‘General Household Survey (GHS) 2013 Report: Focus on Schooling.’ Pretoria: Department of Basic Education. Pretoria. p 43. Available at http://www.education.gov.za/DocumentsLibrary/Reports/tabid/358/Default.aspx
DBE. 2014. 2013 National Senior Certificate Examination Technical Report. Pretoria: Department of Basic Education. http://www.education.gov.za/DocumentsLibrary/Reports/tabid/358/Default.aspx
DBE. 2014. Annual Performance Plan 2014 – 2015. Pretoria: Department of Basic Education. p 41 – 46. Available at http://www.education.gov.za/DocumentsLibrary/Reports/tabid/358/Default.aspx
DBE. 2014. DBE Annual Report, 2013/2014. Pretoria: Department of Basic Education. p 151. Available at http://www.education.gov.za/DocumentsLibrary/Reports/tabid/358/Default.aspx
DBE. 2014. Education for All (EFA) 2014 Country Progress Report. Department of Basic Education. Pretoria, at p 11. Available at http://www.education.gov.za/researchreports/tabid/708/Default.aspx
DBE. 2014. Report on the Annual National Assessment of 2014. Pretoria: Department of Basic Education. http://www.education.gov.za/DocumentsLibrary/Reports/tabid/358/Default.aspx
DBE. 2015. ‘Action Plan to 2019 Towards the Realisation of Schooling 2030.’ Pretoria: Department of Basic Education. p 64. Available at http://www.education.gov.za/LinkClick.aspx?fileticket=HHmKnb78Z7Q%3D&tabid=54&mid=1167
DBE. 2015. 2014 National Senior Certificate Examination Technical Report. Pretoria: Department of Basic Education. http://www.education.gov.za/DocumentsLibrary/Reports/tabid/358/Default.aspx
DBE. 2015. Education Statistics in South Africa 2013. Pretoria: Department of Basic Education. p 37 – 38. Available at http://www.education.gov.za/EMIS/StatisticalPublications/tabid/462/Default.aspx
DBE. 2015. Report on the Implementation of Education White Paper 6 on Inclusive Education: An Overview of the Period: 2013 – 2015. Pretoria: Department of Basic Education. p 6 – 7. Available at http://www.thutong.doe.gov.za/ResourceDownload.aspx?id=49049
DBE. 22 September 2015 Presentation to Portfolio Committee on Basic Education on the Status of Functionality of Teacher Centres in the Education Sector. Available at https://pmg.org.za/committee-meeting/21516/

171 CONCLUSION
DBE. 24 February 2015 presentation to Parliament on Progress and Status of Accelerated School Infrastructure Development Initiative (ASIDI). Available at https://pmg.org.za/committee-meeting/20039/
DBE. 3 March 2015 Learner Transport Presentation to the Portfolio Committee on Basic Education, at slide 11. Available at https://pmg.org.za/files/150303Learner.ppt
DBE. 4 August 2015 Media Statement: “Basic Education on improving qualifications for Grade R teachers.” Available at http://www.gov.za/speeches/department-basic-education-working-hard-improve-qualifications-grade-r-teachers-4-aug-2015
Department of Education. 1996). Education White Paper 2: The Organisation, Governance and Funding of Schools, at 42. Available at http://www.education.gov.za/DocumentsLibrary/Legislation/WhitePapers/tabid/191/Default.aspx
Department of Education. 1996. White Paper 2: The Organisation, Governance and Funding of Schools. Available at http://www.gov.za/documents/organisation-governance-and-funding-schools-education-white-paper-2-0
Department of Education. 2001. The National Policy on Whole-School Evaluation. Government Gazette Vol. 433, No. 22512. Pretoria. Available at http://www.education.gov.za/TheDBE/DBEStructure/GET/WholeSchoolEvaluation/tabid/102/Default.aspx
Department of Transport. Draft Learner Transport Policy. 13 November 2014, Notice 1004 of 2014. p 15 – 16. Available at http://www.gov.za/sites/www.gov.za/files/38207_gen1004.pdf
DHET 2014. Statistics on Post-School Education and Training in South Africa: 2012. Pretoria: Department of Higher Education and Training. Available at http://www.dhet.gov.za/DHET%20Statistics%20Publication/Statistics%20on%20Post-School%20Education%20and%20Training%20in%20South%20Africa%202012.pdf
DHET. 2012. Green Paper for Post-School Education and Training. p 31. Available at http://www.che.ac.za/sites/default/files/publications/DHET_green_paper_post_school_education_training.pdf
DHET. 2013. ‘FACT SHEET on “NEETs”: An analysis of the 2011 South African Census.’ available at http://www.dhet.gov.za/Research%20Coordination%20Monitoring%20and%20Evaluation/FACT%20SHEET%20ON%20NEETS%20(Persons%20who%20are%20not%20in%20employment,%20education%20or%20training).pdf
DHET. 2013. Statistics on Post-School Education and Training in South Africa: 2010. Pretoria: Department of Higher Education and Training. Available at http://www.dhet.gov.za/Publications/Statistics%20on%20Post-School%20Education%20and%20Training%20in%20South%20Africa%20%202010.pdf
DHET. 2015. Statistics on Post-School Education and Training in South Africa: 2013. Pretoria: Department of Higher Education and Training. Available at http://www.dhet.gov.za/DHET%20Statistics%20Publication/Statistics%20on%20Post-School%20Education%20and%20Training%20in%20South%20Africa%202013.pdf
http://www.education.gov.za/LinkClick.aspx?fileticket=uUsJLgUHiKM%3D&tabid=358&mid=2597
Ministerial Committee on the National Senior Certificate (NSC). 2014. ‘Report of the Ministerial Committee to Investigate the Current Promotion Requirements and Other Related Matters that Impact on the Standard of the National Senior Certificate.’ Pretoria: Department of Basic Education. p 59. Available at http://www.education.gov.za/LinkClick.aspx?fileticket=VIFw9JGiNNo%3D&tabid=358&mid=1301
Ministerial Committee on the National Senior Certificate. 2014. ‘Report of the Ministerial Committee to Investigate the Current Promotion Requirements and Other Related Matters that Impact on the Standard of the National Senior Certificate.’ Pretoria: DBE. Available at http://www.education.gov.za/LinkClick.aspx?fileticket=VIFw9JGiNNo%3d&tabid=358&mid=1301
Moloi, M., Chetty, M. 2010. ‘The SACMEQ III Project in South Africa: A Study of the Conditions of Schooling and the Quality of Education.’ Pretoria: Department of Basic Education. p 36 – 37. Available at http://www.education.gov.za/LinkClick.aspx?fileticket=yvljE7UHpDQ%3D&tabid=358&mid=2596

172 Realising the Right to a Basic Education in South Africa
Motshekga. A., Basic Education Budget Vote 2015/16 (6 May 2015), available at http://www.gov.za/speeches/minister-angie-motshekga-basic-education-dept-budget-vote-201516-6-may-2015-0000
National Planning Commission. 2013. National Development Plan 2030: Our future – make it work. Department of the Presidency. available at http://www.gov.za/issues/national-development-plan-2030
NEEDU. 2013. National Report 2012: The State of Literacy Teaching and Learning in the Foundation Phase. Pretoria: National Education Evaluation and Development Unit. Available at http://www.education.gov.za/NEEDU/tabid/687/Default.aspx.
NEEDU. 2013. National Report 2013: Teaching and Learning in Rural Primary Schools. The National Education Evaluation and Development Unit. Pretoria: National Education Evaluation and Development Unit. Available at www.education.gov.za/LinkClick.aspx?fileticket=N%2bblTtd9Ofw%3d&tabid=687&mid=2604
Public Protector. 2013. ‘Learning Without Books: Report on an Investigation into alleged shortages and incorrect supply of school workbooks by the National Department of Basic Education and Eastern Cape Schools.’ Report No. 19 of 2013/14. Available at http://www.pprotect.org/library/investigation_report/SKMBT_C36413120515560.pdf
South Africa. 2009. ‘Report of the Task Team for the Review of the Implementation of the National Curriculum Statement.’ Pretoria. Available at http://v1.sahistory.org.za/classroom/NCS_final_report.pdf
South Africa. 2012. Report of the Presidential Task Team established to investigate the non-delivery and/or delays in the Delivery of Learner, Teacher Support Material (LTSM) in Limpopo Schools. Pretoria. Available at http://www.thepresidency.gov.za/pebble.asp?relid=6942
South African Human Rights Commission. 2014. Report: Delivery of Primary Learning Materials to Schools. Johannesburg. p 4. Available at http://www.sahrc.org.za/home/21/files/Delivery%20of%20Learning%20Material%20Report%20Final.pdf
StatsSA. 2013. National Household Travel Survey 2013 - Statistical Release P0320. Pretoria: Statistics South Africa. http://www.statssa.gov.za/publications/P0320/P03202013.pdf
StatsSA. 2014. ‘General Household Survey, 2013 – Statistical Release P0318.’ Pretoria: Statistics South Africa. Available at www.statssa.gov.za/publications/P0318/P03182013.pdf
StatsSA. 2015. ‘General Household Survey 2014 - Statistical Release P0318.’ Pretoria: Statistics South Africa. Available at http://www.statssa.gov.za/publications/P0318/P03182014.pdf
StatsSA. 2015. ‘Labour market dynamics in South Africa, 2014.’ Statistics South Africa. Pretoria. Available at https://www.datafirst.uct.ac.za/dataportal/index.php/catalog/536
StatsSA. 2015. Education Series I: Focus on Schooling in Limpopo. Pretoria: Statistics South Africa. http://beta2.statssa.gov.za/publications/Report-92-01-01/Report-92-01-012013.pdf
StatsSA. 2015. General Household Survey 2014, Statistical Release P0318. Pretoria: Statistics South Africa. p 20. Available at http://www.datafirst.uct.ac.za/
StatsSA. General Household Survey Statistical Releases 2002 – 2014. Pretoria: Statistics South Africa. Available at https://www.datafirst.uct.ac.za/dataportal/index.php/catalog/#_r=1445507149644&collection=&country=&dtype=&from=1960&page=1&ps=&sk=general+ household+survey&sort_by=nation&sort_order=&to=2015&topic=&view=s&vk=
Task team appointed to conduct an investigation into the implementation of Maths, Science and Technology Strategy. 2013. ‘Investigation into the Implementation of Maths, Science and Technology.’ Pretoria: Department of Basic Education. p 22. Available at http://www.education.gov.za/LinkClick.aspx?fileticket=rMWDa1cHh3I%3d&tabid=358&mid=1301
BooksFleisch, B. 2015. ‘Some Thoughts on Teachers.’ In Equal Education. Taking Equal Education into the Classroom: The challenges to teaching and learning and possible campaigns to address the crisis of quality and equality in the pedagogic encounter. Equal Education. p 84. Available at https://www.equaleducation.org.za/file/2015-06-29-taking-ee-into-the-classroom

173 CONCLUSION
Hoadley, U. 2011. ‘Knowledge, Knowers and Knowing: Curriculum Reform in South Africa. p 144. In L. Yates & M. Grumet (eds.) Curriculum in Today’s World: configuring knowledge, identities, work and politics. Routledge. Available at http://www.education.uct.ac.za/sites/default/files/image_tool/images/104/hoadley2011.pdf
Maringe, F. 2014. ‘Twenty Years of Curriculum Development in Gauteng: Successes and Challenges.’ In Maringe, F. and Prew, M. Twenty Years of Education Transformation in Gauteng 1994 to 2014: An independent Review. 2014. Somerset West: African Minds, p 44. Available at http://www.education.gpg.gov.za/Documents/GDE%2020%20years%20final%20print%20proof%20with%20cover.pdf
Woolman, S. and Fleisch, B., Constitution in the Classroom: Law and education in South Africa 1994 – 2008, Pretoria University Law Press (2009) at 109.
Reports, Working Papers, Policy briefs, Conference papersAbdoll, C., Barberton, C. 2014. ‘Mud to bricks: A review of school infrastructure spending and delivery.’ Pretoria: University Law Press. Available at http://www.centreforchildlaw.co.za/publications
Burger, R., van der Berg, S., von Fintel, D. 2012. ‘The unintended consequences of education policies on South African.’ Stellenbosch University, Department of Economics, Working Papers 11/2012. Available at www.ekon.sun.ac.za/wpapers/2012/wp112012/wp-11-2012.pdf.
Carnoy, M., Chilisia, B. Chisholm, L. 2012. ‘The Low Achievement Trap: Comparing Schooling in Botswana and South Africa.’ HSRC Press. Cape Town, p xviii. Available at http://www.hsrcpress.ac.za/product.php?cat=1&browse=l&freedownload=1&productid=2293
Dawson, Hannah & McLaren, Daniel. 2015. ‘A Framework for Monitoring and Evaluating the Progressive Realisation of Socio-Economic Rights in South Africa’. Studies in Poverty and Inequality Institute. Available at: http://spii.org.za/wp-content/uploads/2015/03/SPII-A-Framework-for-Monitoring-the-Progressive-Realisation-of-SERs-....pdf
Dawson, Hannah. 2014. ‘Public participation and citizen-based monitoring in realising socio-economic rights’. Studies in Poverty and Inequality Institute, Policy Brief 7. Available at: http://spii.org.za/wp-content/uploads/2014/10/Policy-brief-7-Community-Monitoring-Report.pdf
Deacon, R. 2015. ‘Initial Teacher Education Research Project. Report on the 2013 Survey of final year initial teacher education students.’ Jet Education Services. Johannesburg, p 28. Available at http://jet.org.za/publications/initial-teacher-education-research-project/deacon-report-on-the-student-survey.pdf
Deloitte. 2013. National Implementation of Post Provisioning: National Report. p 36. Available at http://www.education.gov.za/LinkClick.aspx?fileticket=Ub4vJ%2BeV9ds%3D&
Diko, Nolutho. 2013. ‘Teacher Education.’ In Reddy, V., Juan, A., & Meyiwa, T. 2014. ‘Towards a 20 Year Review: Basic and Post School Education.’ HSRC. p 65. Available at http://www.hsrc.ac.za/en/research-data/ktree-doc/13817
Equal Education & the Equal Education Law Centre. 2014. Basic Education Shadow Report: A Review of the Department of Basic Education’s Performance in the 2013/14 Financial Year. Equal Education. Cape Town, p 14. Available at http://www.equaleducation.org.za/attachment/download/2015-02-03-EqualEducation_ShadowReport_20132014_WebRes_Final.pdf
Equal Education. 2014. Gauteng Schools Social Audit Report. Equal Education. available at http://www.equaleducation.org.za/content/2015/05/19/Equal-Education_Gauteng-Schools-Social-Audit-Report_Full-Version.pdf
Eyal, K., Woolard, I. 2013. School Enrolment and the Child Support Grant: Evidence from South Africa. South African Labour and Development Research Unit. NIDS Discussion Paper 23/7. p 9 – 10. Available at http://www.nids.uct.ac.za/publications/discussion-papers/wave-3-papers/186-social-assistance-grants/file
Hoadley, U. 2009. ‘Learning to teach the National Curriculum Statement in schools: A desk review of teacher education in the Foundation Phase in South Africa.’ Pretoria: Umalusi. Available at www.umalusi.org.za/docs/research/2009/dr_uhoadley.pdf

174 Realising the Right to a Basic Education in South Africa
Hoadley, U. 2013. ‘Building Strong Foundations: Improving the quality of early education.’ South Africa Child Gauge 2013. University of Cape Town. p 73 – 74. Available at http://www.ci.org.za/depts/ci/pubs/pdf/general/gauge2013/SouthAfricanChildGauge2013.pdf
Howie, S., et al. 2012. ‘PIRLS 2011 Progress in International Reading Literacy Study 2011: South African Children’s Reading Literacy Achievement Summary Report.’ Pretoria: Centre for Evaluation and Assessment, University of Pretoria. Available at http://www.up.ac.za/media/shared/Legacy/sitefiles/file/publications/2013/pirls_2011_report_12_dec.pdf
HSRC. 2015. ‘Beyond Benchmarks: What twenty years of TIMSS data tell us about South African Education. Pretoria: Human Sciences Research Council (HSRC).’ Available at http://www.timss-sa.org.za/?wpfb_dl=17
http://wesscholar.wesleyan.edu/cgi/viewcontent.cgi?article=1912&context=etd_hon_theses
Human Rights Watch. 2015. “Complicit Exclusion”: South Africa’s Failure to Guarantee an Inclusive Education for Children with Disabilities, p 2 – 3. Available at https://www.hrw.org/sites/default/files/report_pdf/southafrica0815_4up_0.pdf
Louw, W., Bayat, A., Eigelaar-Meets, I. 2011. A Report on Underperforming Secondary Schools in the Western Cape: Report 3: Exploring Repetition at Underperforming Schools. University of the Western Cape. p 14. Available at: http://policyresearch.limpopo.gov.za/bitstream/handle/123456789/761/Exploring%20Grade%20Repetition%20at%20Under-performing%20Schools%20in%20the%20Western%20cape.pdf?sequence=1
McLaren, D., Moyo, B. and Jeffery, J. 2015. ‘The right to food in South Africa: An analysis of the content, policy effort, resource allocation and enjoyment of the constitutional right to food.’ Johannesburg: Studies in Poverty and Inequality Institute, Working Paper 11. Available at http://www.spii.org.za/wp-content/uploads/2015/07/SPII-Working-Paper-11-The-Right-to-Food-in-South-Africa-2015.pdf
Organisation for Economic Cooperation and Development (OECD). 2008. Reviews of National Policies for Education: South Africa. OECD p 294. Available at http://www.oecd.org/southafrica/reviewsofnationalpoliciesforeducation-southafrica.htm
Pattillo, Kathlyn. 2012.’ Quiet Corruption: Teachers Unions and Leadership in South African
Reddy, V., et al. 2010. ‘An Investigation into Educator Leave in the South African Ordinary Public Schooling System.’ HSRC. July 2010. Available at: http://www.education.gov.za/LinkClick.aspx?fileticket=bst5D5eBID0%3D&tabid=358&mid=1300
Rehlaga, M. GDE to Appeal FEDSAS School Language Ruling. Eyewitness News. 27 May 2015. available at http://ewn.co.za/2015/05/27/Education-MEC-prepared-to-appeal-SGB-language-ruling
Simkins, C. 2015. ‘Technical Report: Teacher Supply and Demand in South Africa 2013 – 2025.’ Centre for Development and Enterprise. p 34. Available at http://www.cde.org.za/wp-content/uploads/2015/03/CDE-TSD-Technical-report-March-2015-final-version.pdf
Spaull N. 2013. ‘Poverty and privilege: Primary school inequality in South Africa.’ (2013). International Journal of Educational Development, 33(5), September 2013: 436-447.
Spaull, N. 2012. ‘SACMEQ at a glance series. Research on Socio-economic Policy (RESEP).’Available: http://resep.sun.ac.za/index.php/projects/
Spaull, N. 2013. ‘South Africa’s Education Crisis: The quality of education in South Africa 1994 – 2011.’ Johannesburg: Centre for Development and Enterprise, p 29. Available at http://www.section27.org.za/wp-content/uploads/2013/10/Spaull-2013-CDE-report-South-Africas-Education-Crisis.pdf
Taylor, N. 2011. ‘Priorities for Addressing South Africa’s Education and Training Crisis: A Review Commissioned by the National Planning Commission.’ JET Services, 20 June 2011, p 54. Available at http://jet.org.za/publications/research
Taylor, N. 2014. ‘Initial Teacher Education Research Project: An examination of aspects of initial teacher education curricula at five higher education institutions. Summary Report.’ JET Education Services. Johannesburg, p 18. Available at http://jet.org.za/publications/initial-teacher-education-research-project/initial-teacher-education-research-project-reports

175 CONCLUSION
Taylor, S. & Coetzee, M. 2013. ‘Estimating the impact of language of instruction in South African Primary Schools: A fixed effects approach.’ Stellenbosch University. Stellenbosch Working Papers: 21/13. Available at http://www.ekon.sun.ac.za/wpapers/2013/wp212013
Taylor, S. 2011. ‘Uncovering indicators of effective school management in South Africa using the National School Effectiveness Study.’ Stellenbosch University. Stellenbosch Economic Working Papers 11/12, p 43. Available at http://www.ekon.sun.ac.za/wpapers/2012/wp112012/wp-11-2012.pdf
Tomaskevski, Katarina. (2006). State of the Right to Education Worldwide: Free or Fee: 2006 Global Report, Katarina Copenhagen at 58 – 61. Available at www.katarinatomasevski.com/images/Global_Report.pdf
Township Schools.’ Bachelors Thesis. Wesleyan University. p. 50 – 56. Available at
UNESCO. 2013. General Education System Quality Assessment: Country Report South Africa. p 31. Available at www.education.gov.za/LinkClick.aspx?fileticket=jG5BCzd2IMk%3D&tabid= 708&mid=2785.
Van Broekhuizen, H. 2015. ‘Teacher Supply in South Africa: A Focus on Initial Education Graduate Production.’ Stellenbosch University. Stellenbosch Economics Working Papers: WP07/15, p 24. Available at http://www.ekon.sun.ac.za/wpapers/2015/wp072015
Van Der Berg, S., et al. 2013. The Impact of the Introduction of Grade R on Learning Outcomes: Policy Summary, Executive Summary & Evaluation Report. University of Stellenbosch. Available at http://evaluations.dpme.gov.za/sites/EvaluationsHome/Evaluations/The%20Impact%20of%20the%20Introduction%20of%20Grade%20R%20on%20Learning%20Outcomes/Final%20Report%20(long)/Impact%20of%20introduction%20of%20Grade%20R%20on%20subsequent%20learning%20outcomes.pdf
Van Der Byl, Chantelle. 2014. Twenty Year Review South Africa 1994 – 2014: Background Paper: Disability. The Presidency, p 28. Available http://accesstech.co.za/wp-content/uploads/2014/06/12%20Disability_20YR.pdf
JournalsChisholm, Linda. 2013. ‘Understanding the Limpopo textbook Saga.’ HSRC. Available at http://www.hsrc.ac.za/en/review/hsrc-review-september-2013/understanding-the-limpopo-textbook-saga
McConnachie, C. and McConacchie, C. 2012. ‘Concretising the Right to a Basic Education’ 2012). 129: 3 South African Law Journal. 554 at 563.
Van Wyk, N. 2007. ‘The rights and roles of parents on school governing bodies in South Africa.’ 2007. 1:0 International Journal about Parents in Education, 132. Available at http://www.ernape.net/ejournal/index.php/IJPE/article/viewFile/34/24
Newspapers, Websites and other online sourcesCape Times Education Writer, ‘Textbook Policy ‘cannot benefit learners’.’ Cape Times. 7 November 2014. Available at http://www.iol.co.za/news/politics/textbook-policy-cannot-benefit-learners-1.1776962#.VYKP0Vyqqko
Chisholm, L., et al. 2000. ‘A South African Curriculum for the Twenty First Century: Report of the Review Committee on Curriculum 2005.’ Pretoria: Department of Education. p vi – vii. Available at http://www.polity.org.za/polity/govdocs/reports/education/curric2005/curric2005.htm
Hodgson, F., Khumalo, S. ‘Blind Schooling in Shocking State.’ Mail & Guardian. 12 June 2015. Available at http://mg.co.za/article/2015-06-11-blind-schooling-in-shocking-state
http://www.dailymaverick.co.za/article/2015-09-23-annual-national-assessments-a-challenging-
Legal Resources Centre. 10 April 2015 Press Release: Further litigation launched after Department of Education Fails to Eradicate Mud Schools. Available at: http://www.lrc.org.za/press-releases/3484-press-release-further-litigation-launched-after-department-of-education-fails-to-eradicate-mud-schools

176 Realising the Right to a Basic Education in South Africa
Louw, Poppy. ‘Teacher must take pupils’ tests.’ Times Live. 17 March 2015. Available at http://www.timeslive.co.za/thetimes/2015/03/17/teachers-must-take-pupils-tests
Mtshali, N. ‘No-fee school forcing parents to pay.’ iol News. 25 July 2013. Available at: http://beta.iol.co.za/news/crime-courts/no-fee-school-forcing-parents-to-pay-1552430
Nicolson, G. ‘Annual National Assessments: A challenging test.’ Daily Maverick. 29 September 2015. Available at:
Nkosi, B. ‘Teachers Give Minister Motshekga the Finger.’ Mail & Guardian. 1 March 2013. Available at http://mg.co.za/article/2013-03-01-teachers-give-minister-the-finger
Phakathi, B. ‘Electronic clocking-in plan to combat teacher absenteeism.’ Business Day. 25 March 2014, available at http://www.bdlive.co.za/national/education/2014/03/25/electronic-clocking-in-plan-to-combat-teacher-absenteeism
Section 27 and others. 2015. ‘Education declaration mars ICESCR ratification’, available at http://section27.org.za/2015/01/education-declaration-mars-icescr-ratification/
South African Press Association. ‘Ramaphosa demands competency tests for teachers.’ Mail & Guardian. 07 November 2013. Available at http://mg.co.za/article/2013-11-07-ramaphosa-wants-tests-for-teachers
test/#.VgpPphOqqko
Veriava, F. ‘Every Class should have a teacher.’ Mail & Guardian. 12 Sep 2014. Available at http://mg.co.za/article/2014-09-12-every-class-should-have-a-teacher-1
Veriava, F. ‘Learning to live in a Material World. Mail & Guardian. 24 October, 2014. Available at mg.co.za/article/2014-10-23-learning-to-live-in-a-material-world


Studies in Poverty and Inequality Institute (SPII)
31 Quinn Street, NewtownJohannesburgSouth Africa2000
Phone: + 27 11 833 0161Fax: + 27 11 832 3085www.spii.org.za
For a complete list of SPII’s partners, please visit www.spii.org.za
Design & layout: SUN MeDIA Bloemfontein | [email protected]