Real-World Data, Machine Learning and Causal Inference · Real-World Data, Machine Learning and...
43
Real-World Data, Machine Learning and Causal Inference Yaru Shi, PhD, and Jie Chen, PhD Biostatistics and Research Decision Sciences (BARDS) Merck & Co., Inc., Kenilworth, NJ The ASA Biop Regulatory-Industry Statistics Workshop Washington Marriott Wardman Park In memory of late Joseph F. Heyse who was a mentor, a role model and a good friend of mine and many others. September 23–25, 2019
Transcript of Real-World Data, Machine Learning and Causal Inference · Real-World Data, Machine Learning and...

Real-World Data, Machine Learning andCausal Inference
Yaru Shi, PhD, and Jie Chen, PhDBiostatistics and Research Decision Sciences (BARDS)
Merck & Co., Inc., Kenilworth, NJ
The ASA Biop Regulatory-Industry Statistics WorkshopWashington Marriott Wardman Park
In memory of late Joseph F. Heyse who was a mentor, a role modeland a good friend of mine and many others.
September 23–25, 2019

Acknowledgements
• Keaven Anderson, BARDS, Merck & Co., Inc., Kenilworth, NJ
• Ray Bain, BARDS, Merck & Co., Inc., Kenilworth, NJ
• Zhen Li, Department of Statistics, North Carolina State University
• Richard Baumgartner, Merck & Co., Inc., Kenilworth, NJ
• Jinghua He, Merck & Co., Inc., Kenilworth, NJ
• Shahrul Mt-Isa, Merck Sharp & Dohme, London
2/38

ObjectivesWhat will and will not be covered in this talk
• Topics to be covered
– An overview of real-world data (RWD)
– An overview of machine learning (ML) methodologies
– An outline of ML in causal inference using RWD
– A case study in optimal treatment rules
• Topics not to be covered
– Detail description of RWD
– Technical details of ML methodologies
– Detail description of causal inference methodologies
– More complex applications of ML methods in causal inference (e.g., DTR)
– ML and causal inference in the development of precision medicine
3/38

Outline
1. Real World Data and Evidence1.1. Introduction1.2. What Are Real World Data1.3. Real World Data and Evidence and Artificial Intelligence1.4. Big and High-Dimensional Data1.5. Causal Inference Using Real-World Data
2. Machine Learning and Causal Inference2.1. Machine Learning Methodologies2.2. Machine Learning and Causal Inference2.3. Learning Causal Relationship – Causal Discovery2.4. Learning Causal Effects
3. A Case Study – Optimal Treatment Rules4. Summary5. References
4/38
1. Real World Data and Evidence

IntroductionThe 21st Century Cures Act
Real-world data and evidence have been increasingly used in regulatoryand healthcare decision-making since the passage of the 21st CenturyCures Act on December 9, 2016.
• The United States Food and Drug Administration (FDA) hasdeveloped a framework for evaluating real-world data and guidance toindustry on real-world evidence
– to support approval of new drugs or new indications for previouslyapproved drugs, or medical devices, and
– to support post-approval studies for monitoring safety and effectiveness.
• Biopharmaceutical companies use real-world data and evidence
– to guide clinical trial design and
– to provide supplementary information for regulatory approval of newproduct or indication
1. RWD 5/38

IntroductionThe 21st Century Cures Act
Real-world data and evidence have been increasingly used in regulatoryand healthcare decision-making since the passage of the 21st CenturyCures Act on December 9, 2016.
• The healthcare community uses real-world data and evidence to
– to develop guidelines for decision-making to support medical practice and
– to assess treatment patterns, costs and outcomes of interventions.
• High-performance computing and machine learning algorithms areavailable and have been conveniently applied to the analysis ofreal-world data
• There are still substantial challenges in deriving real-world evidencefrom real-world data and in using the evidence for regulatory andhealthcare decision-making
1. RWD 6/38

What Are Real-World DataThe foundation of RWE generation, but it is not just a singleentity
Real-World Data (RWD) are data relating to patient health statusand/or the delivery of health care routinely collected from a variety ofsources (FDA, 2018).
• There are various types of RWD that can provide a valuablefoundation to research alone or as part of a broader evidence platform.
• Understanding different types of RWD and their attributes is critical inselecting appropriate RWD for decision-making purposes.
– Electronic medical records may be more appropriate for studying diseasenatural history
– Health insurance claims data may be appropriate for cost-effectivenessstudies
– Pharmacy dispensing data may be appropriate for studying patient’smedication adherence
• Understanding the merits and limitations of each is important to selectfit-for-purpose RWD.
1. RWD 7/38

What Are Real World Data (1/5)Commonly used RWD types
Examples of common RWD sources (Makady et al., 2017)
1. Electronic medical/health records (EMR/EHR): Digital patient recordscomprising structured and unstructured data fields including patient’sdemographics, clinical narratives, diagnosis, procedures andmedications
2. Health insurance claims data: Data with structured fields on healthcareutilization, prescription, medical claims, and health plan information.
3. Pragmatic clinical trials (PCTs): PCTs are designed to show thereal-world effectiveness of an intervention in broad patient groups andtherefore to inform a clinical or policy decision by providing evidencefor adoption of the intervention into real-world clinical practice (Fordand Norrie, 2016).
1. RWD 8/38

What Are Real World Data (2/5)Commonly used RWD types
4. Disease registries: Data on patient with a particular disease (usuallychronic disease), such as breast cancer registry, SEER (Surveillance,epidemiology, and endpoint results) registry (Seehttps://www.nih.gov/health-information/
nih-clinical-research-trials-you/list-registries for acomplete list of NIH maintained registries).
5. Product registries: Databases that contain information on productusage, concomitant medications, safety, QoL, and product satisfactionand that provide manufacturers and regulatory agencies withinformation on product performance and safety outside of the RCT.
6. Pharmacy dispensing databases: Data containing prescriptiondispensing and refill, costs and payment information.
1. RWD 9/38
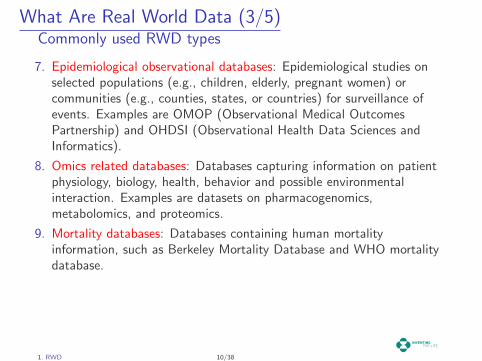
What Are Real World Data (3/5)Commonly used RWD types
7. Epidemiological observational databases: Epidemiological studies onselected populations (e.g., children, elderly, pregnant women) orcommunities (e.g., counties, states, or countries) for surveillance ofevents. Examples are OMOP (Observational Medical OutcomesPartnership) and OHDSI (Observational Health Data Sciences andInformatics).
8. Omics related databases: Databases capturing information on patientphysiology, biology, health, behavior and possible environmentalinteraction. Examples are datasets on pharmacogenomics,metabolomics, and proteomics.
9. Mortality databases: Databases containing human mortalityinformation, such as Berkeley Mortality Database and WHO mortalitydatabase.
1. RWD 10/38

What Are Real World Data (4/5)Commonly used RWD types
10. Community-based databases: Databases recording longitudinal healthstatus, medical practice, social-health behaviors of the population in aselected community, such as Framingham Study and Clinical PracticeResearch Datalink (CPRD)
11. Public health databases: Databases containing public health relatedinformation, such as PubMed, PLOS, and Cochrane Open Access.
12. Data generated from mobile devices and wearables: Databases withinformation on subject’s daily activities, physiological indicators, ECG,and brain activities. Examples are data generated from smart phones,smart watches and biosensors (Bagot et al., 2018).
13. Social media: Patient’s social media posts that contain product usage,self-reported outcomes, and other healthcare related information.Examples of social media data are Twitter and Live Tweet.
1. RWD 11/38

What Are Real World Data (5/5)Commonly used RWD types
14. Other special data sources: Databases created for special purposessuch as National Sentinel Program, FAERS (FDA Adverse EventReporting System), VAERS (Vaccine Adverse Event ReportingSystem), VSD (Vaccine Safety Datalink), and National ImmunizationPrograms.
1. RWD 12/38

Real World Data and Evidence and AIIncreasing use of artificial intelligence
Fueled by the available computational tools in both hardware andsoftware and the accelerating use of big data (including human genomesand real-world data), artificial intelligence (AI) plays an increasinglyimportant role in biopharmaceutical and healthcare industry.• Davenport and Ronanki (2018) break down AI techniques into three
types of applications:1. Process automation - automation of digital and physical tasks2. Cognitive insight - algorithms to detect patterns in vast volumes of data
and interpret their meaning3. Cognitive engagement - natural language process and intelligent agents
customer service
• The use of AI in pharmaceutical industry is primarily in the first twocategories – compound screening and profiling, patient featureselection, and dynamic treatment adaptation for developing precisionmedicines, disease diagnosis, health technology assessment, outcomeprediction, public health surveillance, and real-world trials for deliveringprecision healthcare to the needed patients.
1. RWD 13/38

Real World Data and Evidence and AI (1/3)AI and machine learning in biomedical field
A few examples of successful applications of AI and machine learningmethodologies in biopharmaceutical and healthcare industry include:
• Research scientists deploying AI to discover lead drug compounds(Fleming, 2018; Hessler and Baringhaus, 2018; Vogt et al., 2018).
• Cardiologists applying AI techniques in cardiovascular medicine toexplore novel genotypes and phenotypes to improve the quality ofpatient care, enable cost-effectiveness, and reduce readmission andmortality rates (Krittanawong et al., 2017).
• Oncologists using AI for tumour segmentation, histopathologicaldiagnosis, tracking tumour development, and prognosis prediction(Londhe and Bhasin, 2018).
1. RWD 14/38

Real World Data and Evidence and AI (2/3)AI and machine learning in biomedical field
• Ophthalmologists applying machine learning (ML) and particularlydeep learning (DL) methods to identify, localize and quantifypathological features in almost every macular and retinal disease(Schmidt-Erfurth et al., 2018).
• Radiologists use AI and machine learning methodologies to analyzemagnetic resonance imaging and computed tomography for diagnosisof diseases and their progression (Shen et al., 2017; Pesapane et al.,2018).
• Data scientists and clinicians apply predictive modeling with electronichealth record (EHR) data to drive personalized medicine and improvehealthcare quality (Obermeyer and Emanuel, 2016; Rajkomar et al.,2018).
• There are numerous examples showing vast opportunities andpossibilities of AI and machines learning applications in medicine andhealthcare
1. RWD 15/38

Real World Data and Evidence and AI (3/3)AI and machine learning in biomedical field
– cutting-edge AI and machine learning methodologies and theirapplications to precision medicine and healthcare in particular
1. RWD 16/38

Big and High-Dimensional Data (1/2)Big and high-dimensional data poses numerous challenges
• Big data, often high-dimensional, are collected in structural ornonstructural manner with a variety of purposes that may not beresearch oriented
• The more the better? In general, no. The more the high-quality datathe better.
• Understand the data (Shiffrina, 2016)
– Why are the data collected, for what purposes, from which population?
– Are there potentially interesting patterns of association in the data? Howto find and interpret them? How to deal to a large number of mostlyuncontrolled confounders and covariates (some may be unmeasured))withcorrelations among them, and between them and the identified variables
– How to define causality and the degree of causality in the big data?
– Can the patterns of association, if exist, be interpreted as causality? Whyor why not?
1. RWD 17/38

Big and High-Dimensional Data (2/2)Big and high-dimensional data poses numerous challenges
• Big and high-dimensional data can help in causal inference (Monroeet al., 2015)
– Better design future experiments
– Leverage diversity or heterogeneity with precise subpopulation
– Reveal patterns that previously were difficult to observe
• How to analyze the massive data? (Grimmer, 2015)
– “...combining machine learning to make causal inferences is one of thefastest growing and most open fields”
• Traditional causal inference relies on DAGs that may not be availablefor big data
• Data-driven learning: Regression, prediction and classification
• Causal structural learning methodologies: Classical greedy search overDAGs, reinforcement learning
1. RWD 18/38

Causal Inference Using Real-World DataCausal roadmap
Balzer et al. (2016) outline a seven-step general framework for causalinference
1. Define the scientific question,
2. Articulate the causal knowledge and the limits of that knowledge withrespect to the question,
3. Specify the structural causal models (SCM) including causal diagramsand structural equation models,
4. Identify suitable observed data and their connection with the SCM,
5. Assess identifiability of causal parameters as some function of theobserved data,
6. Estimate the corresponding causal parameter using appropriatemethods,
7. Interpret the causal results.
1. RWD 19/38

2. Machine Learning and Causal Inference

Machine Learning MethodologiesTree-based methods and super-learning (Chen et al., 2018;Kreif and DiazOrdaz, 2019)
• Classification and regression trees (CART): Construction of predictionmodels through recursive partitioning of training datasets in order toobtain subsets that are as homogeneous as possible in a given targetclass
• Random forest: Using bootstrapped samples of the data to grow a treewith a random subset of covariates to create the splits (and thus theleaves)
• Bayesian additive regression trees (BART): Using a likelihood for dataand a set of priors for the structure and leaf parameters, in which thepriors provide regularisation that prevents any single regression treefrom dominating the total fit
• Boosting: An ensemble method for improving the model predictions ofany given learning algorithm (e.g., xgBoosting)
• Super learning ensemble: Combining results from several base modelsto create one that outperforms single models
2. ML & CI 20/38
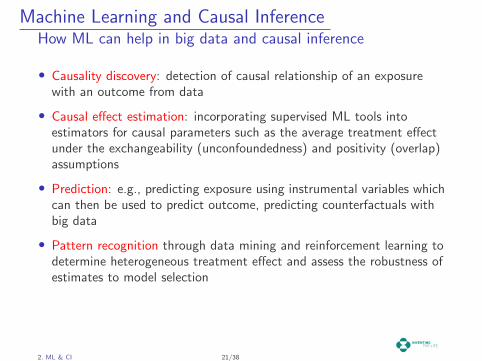
Machine Learning and Causal InferenceHow ML can help in big data and causal inference
• Causality discovery: detection of causal relationship of an exposurewith an outcome from data
• Causal effect estimation: incorporating supervised ML tools intoestimators for causal parameters such as the average treatment effectunder the exchangeability (unconfoundedness) and positivity (overlap)assumptions
• Prediction: e.g., predicting exposure using instrumental variables whichcan then be used to predict outcome, predicting counterfactuals withbig data
• Pattern recognition through data mining and reinforcement learning todetermine heterogeneous treatment effect and assess the robustness ofestimates to model selection
2. ML & CI 21/38
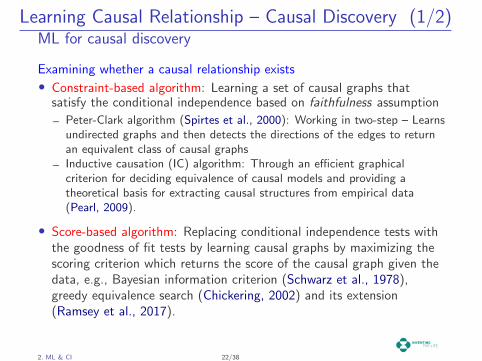
Learning Causal Relationship – Causal Discovery (1/2)ML for causal discovery
Examining whether a causal relationship exists
• Constraint-based algorithm: Learning a set of causal graphs thatsatisfy the conditional independence based on faithfulness assumption
– Peter-Clark algorithm (Spirtes et al., 2000): Working in two-step – Learnsundirected graphs and then detects the directions of the edges to returnan equivalent class of causal graphs
– Inductive causation (IC) algorithm: Through an efficient graphicalcriterion for deciding equivalence of causal models and providing atheoretical basis for extracting causal structures from empirical data(Pearl, 2009).
• Score-based algorithm: Replacing conditional independence tests withthe goodness of fit tests by learning causal graphs by maximizing thescoring criterion which returns the score of the causal graph given thedata, e.g., Bayesian information criterion (Schwarz et al., 1978),greedy equivalence search (Chickering, 2002) and its extension(Ramsey et al., 2017).
2. ML & CI 22/38

Learning Causal Relationship – Causal Discovery (2/2)ML for causal discovery
• Functional causal models: Expressing a covariate as a function of itsdirected causes, which enables to differentiate between different DAGsfrom the same equivalent class, e.g., the linear non-Gaussian acyclicmodel (Shimizu et al., 2006, 2011)
2. ML & CI 23/38

Learning Causal Effects (1/2)ML for learning causal effects
• Without unmeasured confounding – All confounders are measured(Guo et al., 2019)
– Multiple regression
– Propensity score matching, stratification and subclassification, IPTW
– Doubly robust method (DRM) (Funk et al., 2011): Combining multipleregression of outcome and PS method for modeling covariates
– TMLE (Target maximum likelihood estimation): One of DRMs aiming atminimizing the bias and variance of targeted causal parameters bysacrificing the biases and variances of nuisance parameters (van der Laanand Rose, 2018)
– Approximate residual balancing (Athey et al., 2018): Bias reduction inlearning average treatment effect by combining balance weights with aregularized regression adjustment in high-dimensional data
• With unmeasured confounding
2. ML & CI 24/38

Learning Causal Effects (2/2)ML for learning causal effects
– Instrumental variable (IV): A valid IV causally influences the outcomeonly through affecting the treatment, e.g., linear structural causal modelsfor IV estimator, an IV estimator under counterfactual framework
– Front-door criterion (Pearl et al., 2016): A set of variables Z is said tosatisfy the front-door criterion relative to an ordered pair of variables(X,Y ) if (1). Z intercepts all directed paths from X to Y . (2). There isno unblocked path from X to Z. (3). All back-door paths from Z to Yare blocked by X.
◦ If Z satisfies the front-door criterion relative to (X,Y ) and if P (x, z) > 0,then the causal effect of X on Y is identifiable and is given by
P (y|do(x)) =∑z
P (z|x)∑x
P (y|x′, z)P (x′) (1)
– Regression discontinuity: Using treatment assignment based on some“running variables” which may partially be observable
2. ML & CI 25/38

Machine Learning and Causal InferenceVariable selection (Kreif and DiazOrdaz, 2019)
• A challenging issue in causal inference is the control for confounding,which requires the selection of adjustment set of covariates to makeconditional exchangeability hold
• In principle, domain knowledge should be used to select the minimallysufficient set of covariates (Rubin, 2007; Pearl, 2009).
• Back-door criteria to identify adjustment set of covariates (possibleconfounders) (Pearl et al., 2016).
• In practice, prior knowledge may not be available or may be incompleteregarding confounding variables.
• Data-adaptive approaches to selection of confounding covariates –Belloni et al. (2014) propose a variable selection method that takesinto account both covariate-treatment assignment andcovariate-outcome association (hence referred to as “doubleselection”).
2. ML & CI 26/38

Machine Learning and Causal Inference (1/3)Reinforcement learning
Learning for sequential decision-making, which involves action A, state Zand reward Y . For Markov decision process, the current state zt andaction at together determine the next state zt+1, and the reward at thenext state yt+1 depends on (zt+1, at).
• Q-learning (“quality” learning) is based on regression models ofoutcome on patient covariates at each decision point and isimplemented via backward recursive fitting algorithm for deducingoptimal dynamic decisions (Nahum-Shani et al., 2012; Schulte et al.,2014).
• A-learning (“advantage” learning) uses the same recursive strategy foroutcome regression models that contrast among treatments and forthe probability of observed treatment assignment given patientcovariates at each decision point (Murphy, 2003; Robins et al., 2004).
2. ML & CI 27/38

Machine Learning and Causal Inference (2/3)Reinforcement learning
• C-learning (“classification” learning) involves optimization tosequentially minimize a weighted expected misclassification error(Zhang and Zhang, 2018)
• SARSA (State-Action-Reward-State-Action) is an on-policytemporal-difference control method that chooses the action for eachstate during learning by following a certain policy in order to estimateQπ(s, a) for the current policy Π and all state-action (s− a) pairs(Sutton and Barto, 2018)
• Deep Q network combines Q-Learning and Deep Learning to yieldDeep Q Networks, which is suitable for a large number of states andactions (or decision points) (Wang et al., 2015)
• Deep Deterministic Policy Gradient (DDPG) is an algorithm usesoff-policy data and the Bellman equation to learn the Q-function, anduses the Q-function to learn the policy (Silver et al., 2014).
2. ML & CI 28/38

Machine Learning and Causal Inference (3/3)Reinforcement learning
• Blip function (van der Laan and Luedtke, 2015): Based on structuralnested mean models of Murphy (2003) and Robins (2004) that assumea parametric model for the “blip function” defined as the additiveeffect of a blip in current treatment on a counterfactual outcome,conditional on the observed past, in the counterfactual world in whichfuture treatment is assigned optimally.
• Inverse probability of censoring weighted (IPCW): Given a weight to asubject that is inversely proportional to an estimate of the conditionalprobability of having remained uncensored until time t (Robins andFinkelstein, 2000).
• Inverse probability of treatment weighting (IPTW): A standardizedtechnique that reweights each observation in the sample by taking thereciprocal (hence inverse) of the probability of receiving treatment inthe target population (Robins et al., 2000).
2. ML & CI 29/38

3. A Case Study – Optimal Treatment Rules
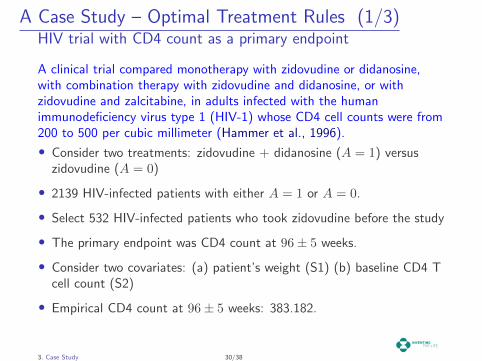
A Case Study – Optimal Treatment Rules (1/3)HIV trial with CD4 count as a primary endpoint
A clinical trial compared monotherapy with zidovudine or didanosine,with combination therapy with zidovudine and didanosine, or withzidovudine and zalcitabine, in adults infected with the humanimmunodeficiency virus type 1 (HIV-1) whose CD4 cell counts were from200 to 500 per cubic millimeter (Hammer et al., 1996).
• Consider two treatments: zidovudine + didanosine (A = 1) versuszidovudine (A = 0)
• 2139 HIV-infected patients with either A = 1 or A = 0.
• Select 532 HIV-infected patients who took zidovudine before the study
• The primary endpoint was CD4 count at 96 ± 5 weeks.
• Consider two covariates: (a) patient’s weight (S1) (b) baseline CD4 Tcell count (S2)
• Empirical CD4 count at 96 ± 5 weeks: 383.182.
3. Case Study 30/38

A Case Study – Optimal Treatment Rules (2/3)HIV trial with CD4 count as a primary endpoint
• Reinforcement learning methods are applied to (a) obtain optimaltreatment options (dopt) and (b) estimate CD4 count at optimaltreatment dopt (Table 1)
Table 1: Optimal treatment dopt and estimated CD4 count under dopt
Method dopt EdoptYQMR I(13.60 + 1.19S1 − 0.26S2 > 0) 397.162QRF * 395.090A-Learning I(13.60 + 1.19S1 − 0.26S2 > 0) 397.162C-Learning (TMLE) I(−41.66 + 0.96S1 − 0.10S2 > 0) 400.764C-Learning (IPTW) I(−41.66 + 0.96S1 − 0.10S2 > 0) 399.540Blip (TMLE) * 396.615Blip (IPTW) * 392.619DR–IPCW (TMLE) * 395.847DR–IPCW (IPTW) * 391.824
* denotes optimal treatment rule without explicit form.
3. Case Study 31/38

A Case Study – Optimal Treatment Rules (3/3)HIV trial with CD4 count as a primary endpoint
Figure 1: Original (left) and optimal (right) treatment assignment usingQRF for 532 HIV-infected patients
3. Case Study 32/38

4. Summary

SummaryReal-world data + machine learning + causal inference
• RWD and RWE provide complementary information for medicalproduct development and regulatory decision making
• There are substantial challenges in deriving robust RWE from RWDdue to confounding, either time-independent or time-dependent
• Real-world data (often big with three Vs), machine learning and causalinference methodologies play an increasingly important role in RWEdevelopment
– Three “V” for big data: Volume, variety and velocity
– Combining data from clinical trials and real-world studies
– The seven-step journey of causal inference from RWD to RWE
• Back-door criteria to identify the set of covariates for confoundingadjustment and front-door criteria to estimate causal effects
• From precision medicine to precision health to precision prevention
Summary 33/38

5. References

References (1/5)
1. Athey, S., G. W. Imbens, and S. Wager (2018). Approximate residual balancing: debiasedinference of average treatment effects in high dimensions. Journal of the Royal StatisticalSociety: Series B (Statistical Methodology) 80(4), 597–623.
2. Bagot, K., S. A. Matthews, M. Mason, L. M. Squeglia, J. Fowler, K. Gray, M. Herting, A. May,I. Colrain, J. Godino, et al. (2018). Current, future and potential use of mobile and wearabletechnologies and social media data in the abcd study to increase understanding of contributorsto child health. Developmental Cognitive Neuroscience 32, 121–129.
3. Balzer, L., M. Petersen, and M. J. van der Laan (2016). Tutorial for causal inference. InP. Bhlmann, P. Drineas, M. Kane, and M. van der Laan (Eds.), Handbook of Big Data, pp.361–386. Chapman & Hall/CRC Press.
4. Belloni, A., V. Chernozhukov, and C. Hansen (2014). Inference on treatment effects after selectionamong high-dimensional controls. The Review of Economic Studies 81(2), 608–650.
5. Chen, J., J. Heyse, and T. L. Lai (2018). Medical Product Safety Evaluation: Biological Modelsand Statistical Methods. Chapman & Hall/CRC Press.
6. Chickering, D. M. (2002). Optimal structure identification with greedy search. Journal of MachineLearning Research 3(Nov), 507–554.
7. Davenport, T. H. and R. Ronanki (2018). Artificial intelligence for the real world. HarvardBusiness Review 96(1), 108–116.
8. FDA (2018). Framework for FDAs real-world evidence program. US Food and DrugAdministration, Silver Spring, MD (https://www.fda.gov/media/120060/download).
9. Fleming, N. (2018). Computer-calculated compounds. Nature 557(7707), S55–S57.
10. Ford, I. and J. Norrie (2016). Pragmatic trials. New England Journal of Medicine 375(5), 454–463.
References (1/5) 34/38
References (2/5)
11. Funk, M. J., D. Westreich, C. Wiesen, T. Sturmer, M. A. Brookhart, and M. Davidian (2011).Doubly robust estimation of causal effects. American Journal of Epidemiology 173(7), 761–767.
12. Grimmer, J. (2015). We are all social scientists now: How big data, machine learning, and causalinference work together. Political Science, 71–74. doi:10.1017/S1049096514001760.
13. Guo, R., L. Cheng, J. Li, P. R. Hahn, and H. Liu (2019). A survey of learning causality with data:Problems and methods. arXiv preprint arXiv:1809.09337 .
14. Hammer, S. M., D. A. Katzenstein, M. D. Hughes, H. Gundacker, R. T. Schooley, R. H. Haubrich,W. K. Henry, M. M. Lederman, J. P. Phair, M. Niu, et al. (1996). A trial comparing nucleosidemonotherapy with combination therapy in hiv-infected adults with cd4 cell counts from 200 to500 per cubic millimeter. New England Journal of Medicine 335(15), 1081–1090.
15. Hessler, G. and K.-H. Baringhaus (2018). Artificial intelligence in drug design. Molecules 23(10),2520.
16. Kreif, N. and K. DiazOrdaz (2019). Machine learning in policy evaluation: new tools for causalinference. arXiv preprint arXiv:1903.00402 .
17. Krittanawong, C., H. Zhang, Z. Wang, M. Aydar, and T. Kitai (2017). Artificial intelligence inprecision cardiovascular medicine. Journal of the American College of Cardiology 69(21),2657–2664.
18. Londhe, V. Y. and B. Bhasin (2018). Artificial intelligence and its potential in oncology. DrugDiscovery Today .
19. Makady, A., A. de Boer, H. Hillege, O. Klungel, W. Goettsch, et al. (2017). What is real-worlddata? a review of definitions based on literature and stakeholder interviews. Value inHealth 20(7), 858–865.
References (2/5) 35/38

References (3/5)
20. Monroe, B. L., J. Pan, M. E. Roberts, M. Sen, and B. Sinclair (2015). No! formal theory, causalinference, and big data are not contradictory trends in political science. Political Science,71–74. doi:10.1017/S1049096514001760.
21. Murphy, S. A. (2003). Optimal dynamic treatment regimes. Journal of the Royal StatisticalSociety: Series B (Statistical Methodology) 65(2), 331–355.
22. Nahum-Shani, I., M. Qian, D. Almirall, W. E. Pelham, B. Gnagy, G. A. Fabiano, J. G. Waxmonsky,J. Yu, and S. A. Murphy (2012). Q-learning: A data analysis method for constructing adaptiveinterventions. Psychological Methods 17(4), 478–494.
23. Obermeyer, Z. and E. J. Emanuel (2016). Predicting the futurebig data, machine learning, andclinical medicine. The New England Journal of Medicine 375(13), 1216.
24. Pearl, J. (2009). Causality: Models, Reasoning, and Inference (2nd ed.). Cambridge UniversityPress, New York. (Original edition, 2000).
25. Pearl, J., M. Glymour, and N. Jewell (2016). Causal Inference in Statistics. A Primer. John Wiley& Sons.
26. Pesapane, F., M. Codari, and F. Sardanelli (2018). Artificial intelligence in medical imaging:threat or opportunity? radiologists again at the forefront of innovation in medicine. EuropeanRadiology Experimental 2(1), 2–10.
27. Rajkomar, A., E. Oren, K. Chen, A. M. Dai, N. Hajaj, M. Hardt, P. J. Liu, X. Liu, J. Marcus,M. Sun, et al. (2018). Scalable and accurate deep learning with electronic health records. npjDigital Medicine 1(1), 18.
References (3/5) 36/38

References (4/5)
28. Ramsey, J., M. Glymour, R. Sanchez-Romero, and C. Glymour (2017). A million variables andmore: the fast greedy equivalence search algorithm for learning high-dimensional graphicalcausal models, with an application to functional magnetic resonance images. InternationalJournal of Data Science and Analytics 3(2), 121–129.
29. Robins, J. M. (2004). Optimal structural nested models for optimal sequential decisions. InProceedings of the Second Seattle Symposium in Biostatistics, pp. 189–326. Springer.
30. Robins, J. M. and D. M. Finkelstein (2000). Correcting for noncompliance and dependentcensoring in an aids clinical trial with inverse probability of censoring weighted (ipcw) log-ranktests. Biometrics 56(3), 779–788.
31. Robins, J. M., M. A. Hernan, and B. Brumback (2000). Marginal structural models and causalinference in epidemiology. Epidemiology 11(5), 550–560.
32. Robins, J. M., M. A. Hernan, and U. Sirbert (2004). Effects of multiple interventions. InComparative Quantification of Health risks: Global and Regional Burden of Disease Attributableto Selected Major Risk Factors, Volume 1, pp. 2191–2230. Geneva: World Health Organization.
33. Rubin, D. B. (2007). The design versus the analysis of observational studies for causal effects:parallels with the design of randomized trials. Statistics in medicine 26(1), 20–36.
34. Schmidt-Erfurth, U., A. Sadeghipour, B. S. Gerendas, S. M. Waldstein, and H. Bogunovic (2018).Artificial intelligence in retina. Progress in Retinal and Eye Research.
35. Schulte, P. J., A. A. Tsiatis, E. B. Laber, and M. Davidian (2014). Q-and A-learning methods forestimating optimal dynamic treatment regimes. Statistical Science 29(4), 640–661.
36. Schwarz, G. et al. (1978). Estimating the dimension of a model. The Annals of Statistics 6(2),461–464.
References (4/5) 37/38

References (5/5)
37. Shen, D., G. Wu, and H.-I. Suk (2017). Deep learning in medical image analysis. Annual Reviewof Biomedical Engineering 19, 221–248.
38. Shiffrina, R. M. (2016). Drawing causal inference from big data. PNAS 113(27), 7308–7309.
39. Shimizu, S., P. O. Hoyer, A. Hyvarinen, and A. Kerminen (2006). A linear non-gaussian acyclicmodel for causal discovery. Journal of Machine Learning Research 7(Oct), 2003–2030.
40. Shimizu, S., T. Inazumi, Y. Sogawa, A. Hyvarinen, Y. Kawahara, T. Washio, P. O. Hoyer, andK. Bollen (2011). Directlingam: A direct method for learning a linear non-gaussian structuralequation model. Journal of Machine Learning Research 12(Apr), 1225–1248.
41. Silver, D., G. Lever, N. Heess, T. Degris, D. Wierstra, and M. Riedmiller (2014). Deterministicpolicy gradient algorithms. In Proceedings of the 31st International Conference on MachineLearning.
42. Spirtes, P., C. N. Glymour, R. Scheines, D. Heckerman, C. Meek, G. Cooper, and T. Richardson(2000). Causation, prediction, and search. MIT press.
43. Sutton, R. S. and A. G. Barto (2018). Reinforcement learning: An introduction. MIT press.
44. van der Laan, M. J. and A. R. Luedtke (2015). Targeted learning of the mean outcome under anoptimal dynamic treatment rule. Journal of Causal Inference 3(1), 61–95.
45. van der Laan, M. J. and S. Rose (2018). Targeted learning in data science: Causal inference forcomplex longitudinal studies. Springer.
46. Vogt, M., S. Jasial, and J. Bajorath (2018). Extracting compound profiling matrices fromscreening data. ACS Omega 3(4), 4706–4712.
47. Wang, Z., T. Schaul, M. Hessel, H. Van Hasselt, M. Lanctot, and N. De Freitas (2015). Duelingnetwork architectures for deep reinforcement learning. arXiv preprint arXiv:1511.06581 .
48. Zhang, B. and M. Zhang (2018). C-learning: A new classification framework to estimate optimaldynamic treatment regimes. Biometrics 74(3), 891–899.
References (5/5) 38/38


![Bayesian Causal Inference - uni-muenchen.de...from causal inference have been attracting much interest recently. [HHH18] propose that causal [HHH18] propose that causal inference stands](https://static.fdocuments.in/doc/165x107/5ec457b21b32702dbe2c9d4c/bayesian-causal-inference-uni-from-causal-inference-have-been-attracting.jpg)