![UK Protective Marking: UK HPR1000 · EPP Containment Leak Rate Testing and Monitoring System [CLRTMS] EUF Containment Filtration and Exhaust System [CFES] EUH Containment Combustible](https://static.fdocuments.in/doc/165x107/5e0ccb42487f3f10697ce6bd/uk-protective-marking-uk-epp-containment-leak-rate-testing-and-monitoring-system.jpg)
Real-time Traffic monitoring and containment
74
Real-time Traffic monitoring and containment A. L. Narasimha Reddy Dept. of Electrical Engineering Texas A & M University [email protected] http://ee.tamu.edu/~reddy/
-
Upload
gisela-fields -
Category
Documents
-
view
29 -
download
3
description
Real-time Traffic monitoring and containment. A. L. Narasimha Reddy Dept. of Electrical Engineering Texas A & M University [email protected] http://ee.tamu.edu/~reddy/. Outline. Motivation DOS attacks Partial state routers DDOS attacks, worms Aggregate Packet header data as signals - PowerPoint PPT Presentation
Transcript of Real-time Traffic monitoring and containment

Real-time Traffic monitoring and containment
A. L. Narasimha Reddy
Dept. of Electrical Engineering
Texas A & M University
http://ee.tamu.edu/~reddy/
Narasimha Reddy
Texas A & M University
2
Outline
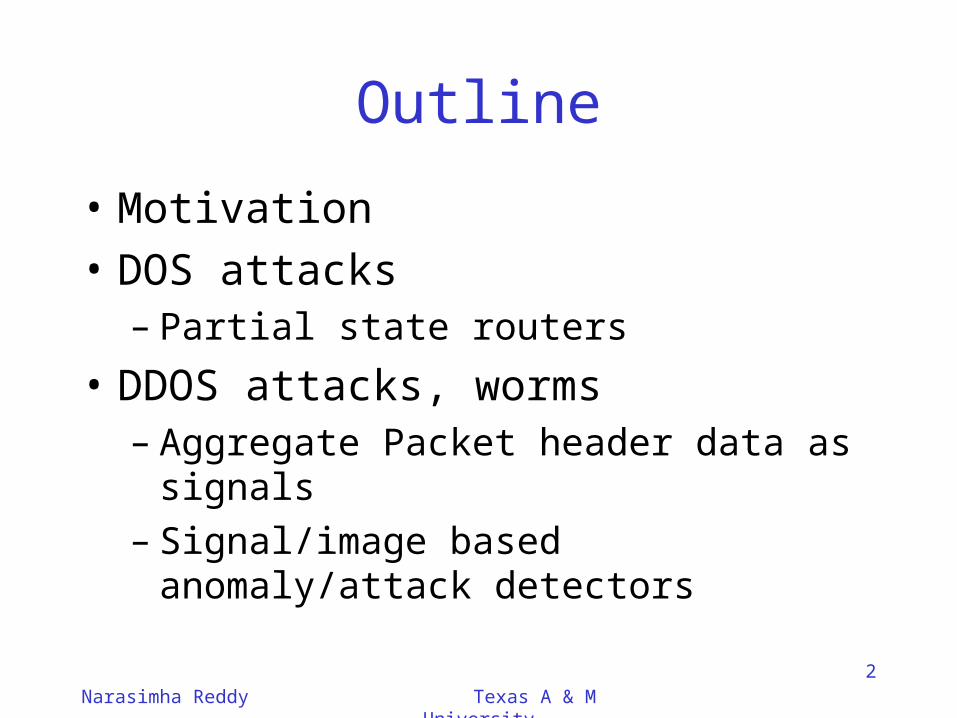
• Motivation
• DOS attacks– Partial state routers
• DDOS attacks, worms– Aggregate Packet header data as signals– Signal/image based anomaly/attack detectors

Narasimha Reddy
Texas A & M University
3
Real-time traffic monitoring
• Attacks motivate us to monitor network traffic– Potential anomaly/attack detectors– Potentially contain/throttle them as they happen
• Line speeds are increasing– Need simple, effective mechanisms
• Attacks constantly changing– CodeRed yesterday, MyDoom today, what next

Narasimha Reddy
Texas A & M University
4
Motivation
• Most current monitoring/policing tools are tailored to known attacks– Look for packets with port number 1434
(CodeRed)– Contain Kaaza traffic to 20% of the link
• Become ineffective when traffic patterns or attacks change– New threats are constantly emerging

Narasimha Reddy
Texas A & M University
5
Motivation
• Can we design generic (and generalized) mechanisms for attack detection and containment?
• Can we make them simple enough to implement them at line speeds?

Narasimha Reddy
Texas A & M University
6
Introduction
• Why look for Kaaza packets– They consume resources– Consumes resources more than we want
• Not much different from DOS flood– Consumes resources to stage attacks
• Why not monitor resource usage?– Do not want to rely on attack specific info
Narasimha Reddy
Texas A & M University
7
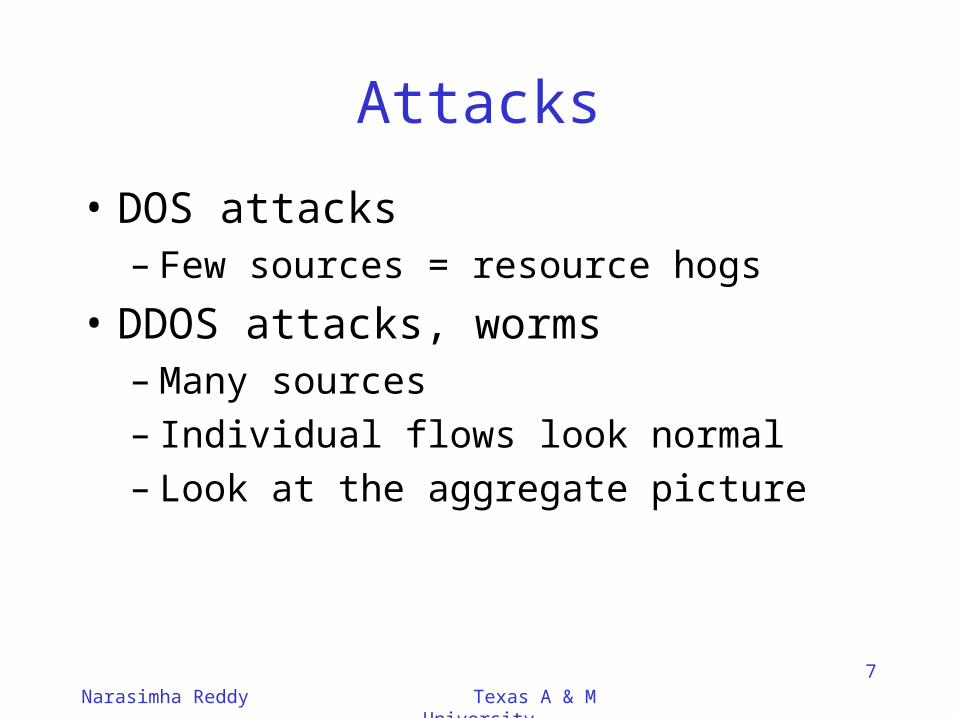
Attacks
• DOS attacks– Few sources = resource hogs
• DDOS attacks, worms– Many sources – Individual flows look normal– Look at the aggregate picture

Narasimha Reddy
Texas A & M University
8
DOS attacks & Network Flows
• Too many flows to monitor each flow• Maintain a fixed amount of state/memory
– State not enough to monitor all flows (Partial state)– Manage the state to monitor high-bandwidth flows – How?
• Sample packets– High-BW flows more likely to be selected
• Use a cache and employ LRU type policy– Traffic driven– Cache retains frequently arriving flows

Narasimha Reddy
Texas A & M University
9
Partial State Approach
• Similar to how caches are employed in computer memory systems– Exploit locality
• Employ an engineering solution in an architecture-transparent fashion

Narasimha Reddy
Texas A & M University
10
Identifying resource hogs
• Lots of web flows– Tend to corrupt the cache quickly
• Apply probabilistic admission into cache– Flow has to arrive often to be included in cache– Most web flows not admitted
• Works well in identifying high-BW flows
• Can apply resource management techniques to contain cached/identified flows

Narasimha Reddy
Texas A & M University
11
LRU with probabilistic admission
• Employ a modified LRU
• On a miss, flow admitted with probability p– When p is small, keeps smaller flows out – High-BW flows more likely admitted– Allows high-BW flows to be retained in cache
• Nonresponsive flows more likely to stay in cache
Narasimha Reddy
Texas A & M University
12
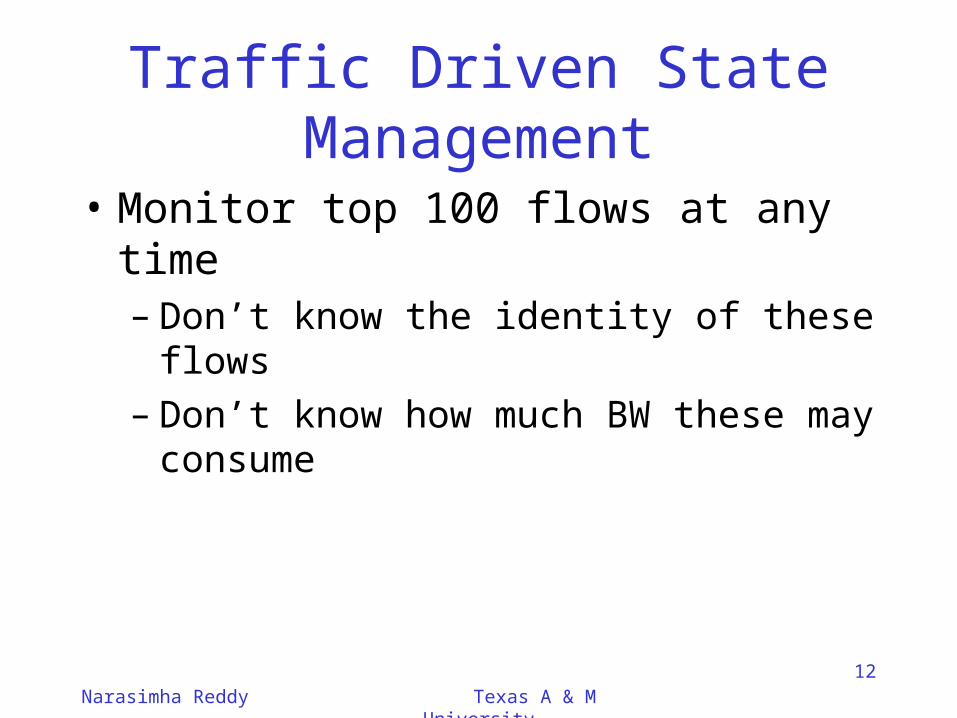
Traffic Driven State Management
• Monitor top 100 flows at any time– Don’t know the identity of these flows– Don’t know how much BW these may consume

Narasimha Reddy
Texas A & M University
13
Policy Driven State Management
• An ISP could decide to monitor flows above 1Mbps– Will need state >= link capacity/1 Mbps
• Could monitor flows consuming more than 1% of link capacity– For security reasons– At most 100 flows with 1% BW consumption

Narasimha Reddy
Texas A & M University
14
Partial State –Trace-driven evaluation

Narasimha Reddy
Texas A & M University
15
Partial State –Trace-driven Evaluation

Narasimha Reddy
Texas A & M University
16
UDP Cache Occupancy
0100200300400500600
0.1
0.4
0.6 1
1.25 2.
12.
7 33.
5 4
Rate in Mb
Tim
e in
se
co
nd
s

Narasimha Reddy
Texas A & M University
17
TCP Cache Occupancy
0.70.720.740.760.78
0.80.820.840.86
1 3 5 7 9 11 13 15 17 19
Flow Number
Tim
e in
se
co
nd
s

Narasimha Reddy
Texas A & M University
18
Resource Management

Narasimha Reddy
Texas A & M University
19
Preferential Dropping
drop prob
Queue lengthdrop prob for high bandwidth flows
minth maxth
maxp
1
drop prob for other flows

Narasimha Reddy
Texas A & M University
20
Multiple possibilities
• SACRED: Monitor flows above certain rate (policy driven), differential RED, (iwqos99)
• LRU-RED: Traffic driven state management, differential RED (Globecom01)– Approximately fair BW distribution
• LRU-FQ: Traffic driven state management, fair queuing (ICC 04)– Contain DOS attacks
– Provide shorter delays for short-term flows

Narasimha Reddy
Texas A & M University
21
LRU-FQ Resource Management

Narasimha Reddy
Texas A & M University
22
LRU-FQ flow chart – enqueue event
Packet Arrival
Is Flow in Cache?
Yes
No Does Cache Have
space?
Yes
Admit flow with Probability ‘p’
No
Is Flow Admitted?
Record flow detailsInitialize ‘count’ to 0
Yes
Increment ‘count’Move flow to top of cache No
Is‘count’ >= ‘threshold’
No
Yes
Enqueue in Partial stateQueue
Enqueue in NormalQueue

Narasimha Reddy
Texas A & M University
23
Linux IP Packet Forwarding
Packet Arrival Check & StorePacket
Enqueue pkt
Request SchedulerTo invoke bottom half
Device Prepares
packet Packet Departure
Error checkingVerify
Destination
Route to destinationUpdate Packet
Packet Enqueued
Scheduler invokesBottom half Scheduler runs
Device driver
Local packetDeliver to upper layers UPPER LAYERS
IP LAYER
LINK LAYER
Design space

Narasimha Reddy
Texas A & M University
24
Linux Kernel traffic control
• Filters are used to distinguish between different classes of flows.
• Each class of flows can be further categorized into sub-classes using filters.
• Queuing disciplines control how the packets are enqueued and dequeued

Narasimha Reddy
Texas A & M University
25
LRU-FQ Implementation
• LRU component of the scheme is implemented as a filter. – All parameters: threshold, probability and
cache size are passed as parameters to the filter
• Fair Queuing employed as a queuing discipline. – Scheduling based on queue’s weight.– Start-time Fair Queuing

LRU-FQ - Results
Narasimha Reddy
Texas A & M University
27
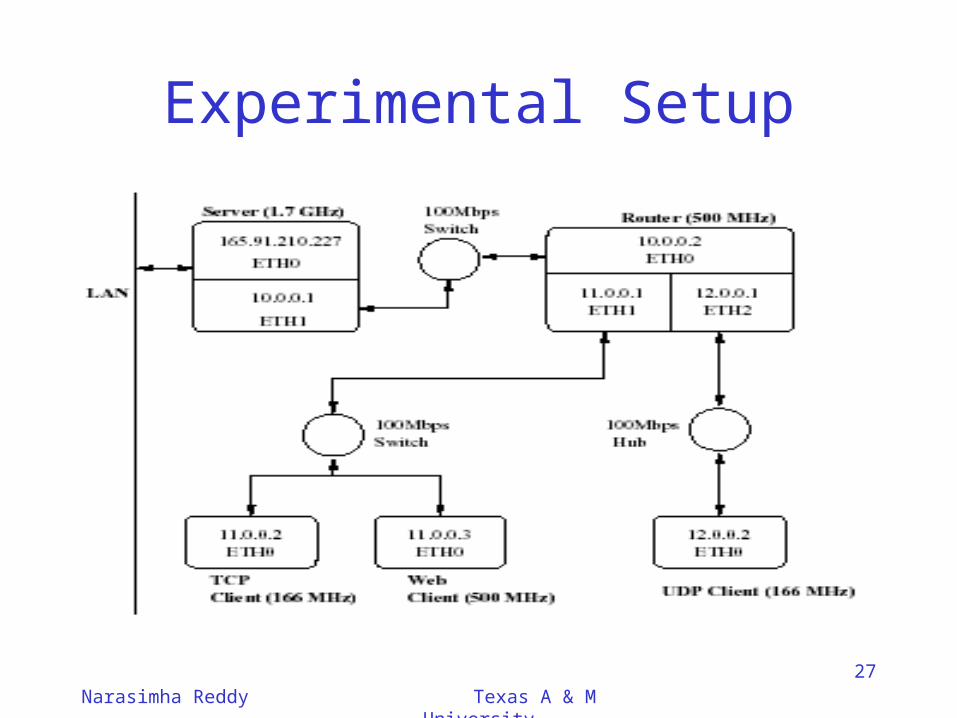
Experimental Setup

Narasimha Reddy
Texas A & M University
28
Control of Non-responsive Proportion
0
0.1
0.2
0.3
0.4
0.5
0.6
0.7
0.8
0.9
1
9 8 7 6 5 4 3 2 1
LRU Weight (x/10)
TC
P T
hro
ug
hp
ut
Fra
ctio
n (
20 T
CP
Flo
ws)
Ideal
UDP Flows = 2
UDP Flows = 3
UDP Flows = 4
UDP Flows = 5
Normal Router
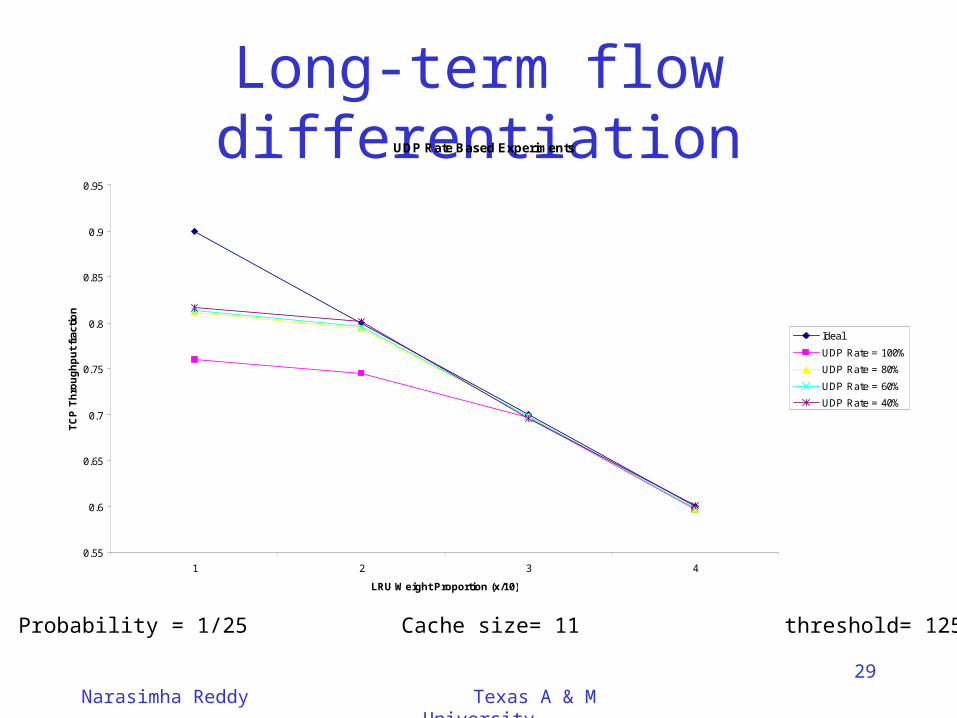
Long-Term flow differentiation
Probability = 1/25 Cache size= 11 threshold= 125
Normal TCP fraction = 0.07
Narasimha Reddy
Texas A & M University
29
Long-term flow differentiationUDP Rate Based Experiments
0.55
0.6
0.65
0.7
0.75
0.8
0.85
0.9
0.95
1 2 3 4
LRU Weight Proportion (x/10)
TC
P T
hro
ug
hp
ut
frac
tio
n
Ideal
UDP Rate = 100%
UDP Rate = 80%
UDP Rate = 60%
UDP Rate = 40%
Probability = 1/25 Cache size= 11 threshold= 125

Narasimha Reddy
Texas A & M University
30
Histogram of Web File Distribution
0
100
200
300
400
500
600
File Size
Fre
qu
ency
Histogram of Web File Distribution 350 500 140 9 1
500 5k 50k 500k 5m
Protecting Web Mice

Narasimha Reddy
Texas A & M University
31
Protecting Web mice
1:1LRU : Normal Queue
11LRU Cache Size
125Threshold
1/50Probability
20Web Clients
2 – 4LongTerm UDP Flows
20Long Term TCP Flows
Experimental Setup

Narasimha Reddy
Texas A & M University
32
Protecting Web MiceBandwidth Results
0.0656.2192789.134
0.0585.55128489.803
0.0625.88131389.452
TCP Fraction
TCP Tput
# Web Requests
UDP Tput
UDP Flows
0.4944.511363246.244
0.4944.831382845.733
0.4944.921391545.732
TCP Fraction
TCP Tput
# Web Requests
UDP Tput
UDP Flows
Normal Router
LRU-FQ Router

Narasimha Reddy
Texas A & M University
33
Protecting Web MiceTiming Results
UDP AvgRsp DevRsp MinRsp MaxRsp AvgConn DevConn MinConn MaxConn2 0.26 0.85 0.012 21.15 0.14 0.66 0.0014 21.013 0.26 0.85 0.013 22.27 0.13 0.59 0.0017 9.034 0.26 0.88 0.013 21.05 0.13 0.61 0.002 9.02
Normal Router
LRU-FQ Router
UDP AvgRsp DevRsp MinRsp MaxRsp AvgConn DevConn MinConn MaxConn2 2.54 4.43 0.026 45.08 1.95 3.07 0.0118 453 2.7 4.92 0.026 93.02 1.94 3.11 0.0115 45.014 3.06 4.83 0.026 45.03 2.11 3.42 0.0122 45

Narasimha Reddy
Texas A & M University
34
Summary of LRU-FQ
• Provides a good control of DOS attacks with limited number of flows
• Provides better delays for short-term flows
• Automatically identifies resource hogs
• Partial state packet handling cost -not an issue at 100Mbps.

Narasimha Reddy
Texas A & M University
35
Applications of Partial State• More intelligent control of network traffic
• Accounting and measurement of high bandwidth flows
• Denial of Service (DOS) attack prevention
• Tracing of high bandwidth flows
• QOS routing

Narasimha Reddy
Texas A & M University
36
Aggregated packet analysis

Narasimha Reddy
Texas A & M University
37
Approach
Network Traffic
Signal Generation
& Data Filtering
(Address correlation)
Anomaly Detection
(Thresholding)
Detection Signal
Statistical or Signal Analysis
(Wavelets or DCT)

Narasimha Reddy
Texas A & M University
38
Signal Generation
• Traffic volume (bytes or packets)– Analyzed before– May not be a great signal when links are always
congested (typical campus access links)
• Lot more information in packet headers– Source address– Destination address– Protocol number– Port numbers

Narasimha Reddy
Texas A & M University
39
Signal Generation
• Per packet cost is important driver• Update a counter for each packet header
field– Too much memory to put in SRAM
• Break the field into multiple 8-bit fields– 32-bit address into four 8-bit fields– 1024 locations instead of 2^32 locations– In general, 256* (k/8) instead of 2^k– k/8 counter updates instead of 1

Narasimha Reddy
Texas A & M University
40
Signal Generation
• What kind of signals can we generate with addresses, port numbers and protocol numbers?

Narasimha Reddy
Texas A & M University
41
Addresses are correlated
• Most of us have habits – Access same web sites
• Large web sites get significant part of traffic– Google.com, hp.com, yahoo.com
• Large downloads correlate over time– ftp, video
• On an aggregate, addresses are correlated

Narasimha Reddy
Texas A & M University
42
Address Correlation –attacks?
• Address correlation changes when traffic patterns change abruptly– Denial of service attacks– Flash crowds– Worms
• Results in differences in correlation – High --single attack victim– Low – lots of addresses --worm

Narasimha Reddy
Texas A & M University
43
Address correlation signals
• Address correlation:
• Simplified Address correlation:
m npmnpm npmnp
npmnpm npmnpn
2)(2)11(
)(*)11()(
m mnm mnmn pppnC 1)(

Narasimha Reddy
Texas A & M University
44
Address Correlation Signals

Narasimha Reddy
Texas A & M University
45
Address Correlation Signals

Narasimha Reddy
Texas A & M University
46
Signal Analysis
• Capture information over a sampling period– Of the order of a few seconds to minutes
• Analyze each sample to detect anomalies– Compare with historical norms
• Post-mortem/Real-time analysis– May use different amounts of data & analysis
• Detailed information of past few samples
• Less detailed information of older samples

Narasimha Reddy
Texas A & M University
47
Signal Analysis
• Address correlation as a time series signal
• Employ known techniques to analyze time series signals
• Wavelets –one powerful technique– Allows analysis in both time and frequency
domain
• Per-sample analysis has more flexibility– Not in forwarding path

Narasimha Reddy
Texas A & M University
48
Does this work?

Narasimha Reddy
Texas A & M University
49
Analysis of address signal

Narasimha Reddy
Texas A & M University
50
Image based analysis
• Treat the traffic data as images
• Apply image processing based analysis
• Treat each sample as a frame in a video– Video compression techniques lead to data
reduction– Scene change analysis leads to anomaly
detection– Motion prediction leads to attack prediction

Narasimha Reddy
Texas A & M University
51
Signal Generation
IP byte 0 IP byte 1
IP byte 2 IP byte 3
IP byte 0 IP byte 1
IP byte 2 IP byte 3
destination IP address
source IP
address
Figure 2. The visualization of network traffic signal in IP address
(a) 1 dimension (b) 2 dimension
0 1 14 15
16 17 30 31
224 225 238 239
240 241 254 255
..........
..........
..........
..........
..........
..........
..........
..........
IP byte 0
00
01
0254
0255
10
11
1254
1255
2540
2541
254254
254255
2550
2551
255254
255255
..........
..........
..........
..........
..........
..........
IP byte 0(source IP address,
destination IP address)

Narasimha Reddy
Texas A & M University
52
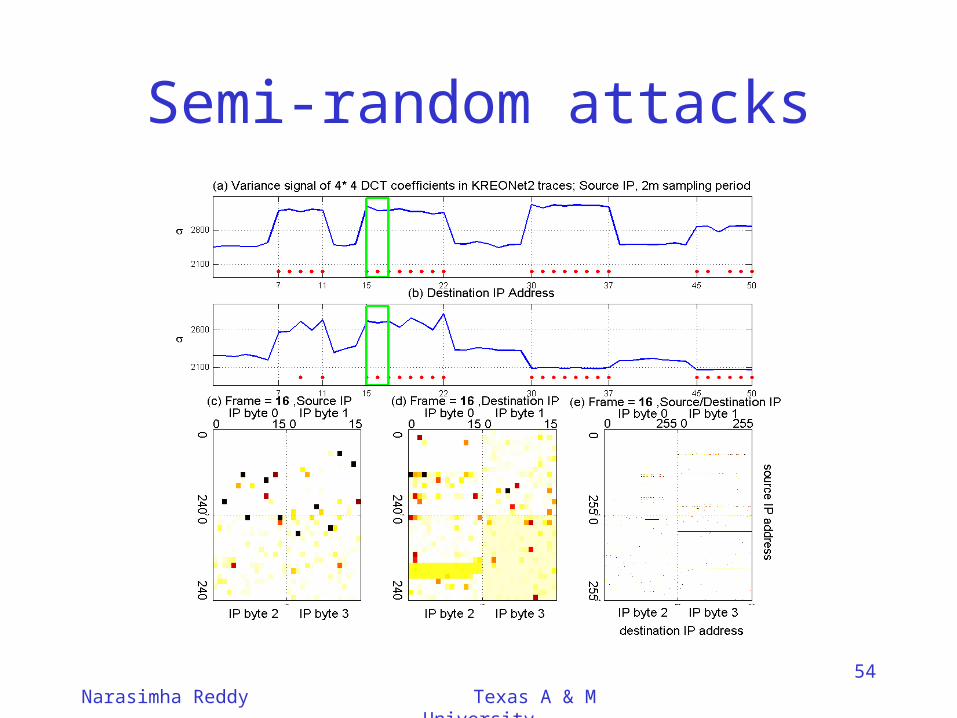
Two dimensional images
• Horizontal/vertical lines indicate anomalies– Infected machine contacting multiple
destinations (worm propagation)– Multiple source machines targeting a
destination (DDOS)

Narasimha Reddy
Texas A & M University
53
DCT analysis of addresses
Narasimha Reddy
Texas A & M University
54
Semi-random attacks

Narasimha Reddy
Texas A & M University
55
Random attacks

Narasimha Reddy
Texas A & M University
56
Better than volume analysis

Narasimha Reddy
Texas A & M University
57
Motion prediction

Narasimha Reddy
Texas A & M University
58
Advantages
• Not looking for specific known attacks
• Generic mechanism
• Works in real-time – Latencies of a few samples– Simple enough to be implemented inline

Narasimha Reddy
Texas A & M University
59
Prototypes
• Linux-PC boxes
• On Intel Network processors– Can push to Gbps packet forwarding rates– Forwarding throughput not impacted– Sampling rates of a few ms possible

Narasimha Reddy
Texas A & M University
60
Conclusion
• Real-time resource accounting is feasible
• Real-time traffic monitoring is feasible– Simple enough to be implemented inline
• Can rely on many tools from signal/image processing area– More robust offline analysis possible– Concise for logging and playback

Narasimha Reddy
Texas A & M University
61
Thank you !!
For more information,http://ee.tamu.edu/~reddy
Narasimha Reddy
Texas A & M University
62
Other work
• Enhancements to TCP– TCP-DCR for wireless losses, packet
reordering– Layered TCP for high-speed(Gbps) links
• Alternate routing for improving service availability during link transients– Continues routing packets until routing tables
are recomputed– Important for VOIP applications
Narasimha Reddy
Texas A & M University
63
TCP Enhancements
• TCP-DCR:– Modifies TCP’s congestion response to tolerate
non-congestion events (channel errors, packet reordering)
• LTCP (Layered TCP):– Improves TCP’s performance in high-speed
networks

Narasimha Reddy
Texas A & M University
64
TCP-DCR –channel errors

Narasimha Reddy
Texas A & M University
65
TCP-DCR –packet reordering

Narasimha Reddy
Texas A & M University
66
LTCP

Narasimha Reddy
Texas A & M University
67
Thank you !!
For more information,http://ee.tamu.edu/~reddy
Narasimha Reddy
Texas A & M University
68
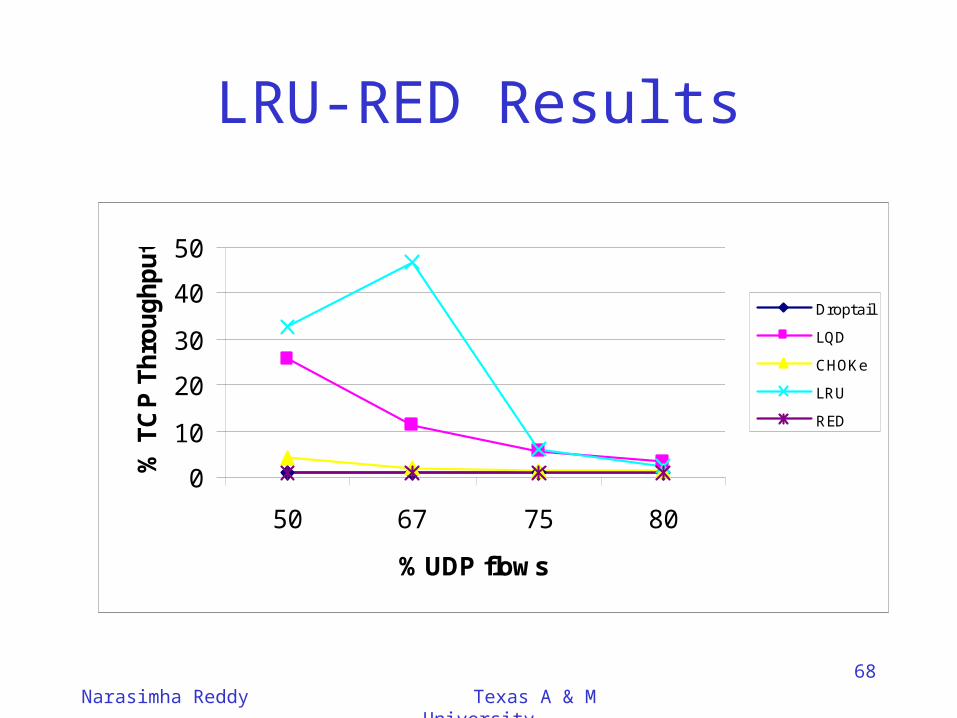
LRU-RED Results
0
10
20
30
40
50
50 67 75 80
% UDP flows
% T
CP
Th
rou
gh
pu
t
Droptail
LQD
CHOKe
LRU
RED

Narasimha Reddy
Texas A & M University
69
RTT Bias -TCP flows
0
1
2
3
4
5
6
7
8
8 8 44 84 84 124
204
204
404
RTT in ms
% D
rop
rate
CHOKe
RED
DropTail
LQD
LRU

Narasimha Reddy
Texas A & M University
70
Impact of Cache size
• Effect of varying cache size– to study impact of cache size on performance of
the scheme– probability= 1/55, threshold = 125– number of TCP flows=20– equal weights for both queues.

Narasimha Reddy
Texas A & M University
71
Results – Cache size

Narasimha Reddy
Texas A & M University
72
Normal Workloads
• Performance under normal workloads– working of scheme when non-responsive loads
are absent or use their fair share of bandwidth– cache size = 9, threshold =125– probability = 1/55

Narasimha Reddy
Texas A & M University
73
Results – Normal workload

Narasimha Reddy
Texas A & M University
74
Normal Mixed workload