Real-time setup to measure radon emission during rock ...
9
Geosci. Instrum. Method. Data Syst., 4, 111–119, 2015 www.geosci-instrum-method-data-syst.net/4/111/2015/ doi:10.5194/gi-4-111-2015 © Author(s) 2015. CC Attribution 3.0 License. Real-time setup to measure radon emission during rock deformation: implications for geochemical surveillance P. Tuccimei 1 , S. Mollo 2 , M. Soligo 1 , P. Scarlato 2 , and M. Castelluccio 1 1 Università “Roma Tre”, Dipartimento di Scienze, Largo S. L. Murialdo 1, 00146 Roma, Italy 2 Istituto Nazionale di Geofisica e Vulcanologia, Via di Vigna Murata 60, 00143 Roma, Italy Correspondence to: P. Tuccimei ([email protected]) Received: 24 November 2014 – Published in Geosci. Instrum. Method. Data Syst. Discuss.: 4 February 2015 Revised: 27 April 2015 – Accepted: 11 May 2015 – Published: 27 May 2015 Abstract. Laboratory experiments can represent a valid ap- proach to unravel the complex interplay between the geo- chemical behaviour of radon and rock deformation mecha- nisms. In light of this, we present a new real-time experimen- tal setup for analysing in continuum the alpha-emitting 222 Rn and 220 Rn daughters over variable stress–strain regimes. The most innovative segment of this setup consists of the radon accumulation chamber obtained from a tough and durable material that can host large cylindrical rock samples. The accumulation chamber is connected, in a closed-loop con- figuration, to a gas-drying unit and to a RAD7 radon moni- tor. A recirculating pump moves the gas from the rock sam- ple to a solid-state detector for alpha counting of radon and thoron progeny. The measured radon signal is enhanced by surrounding the accumulation chamber with a digitally con- trolled heating belt. As the temperature is increased, the num- ber of effective collisions of radon atoms increases favour- ing the diffusion of radon through the material and reducing the analytical uncertainty. The accumulation chamber con- taining the sample is then placed into a uniaxial testing ap- paratus where the axial deformation is measured throughout a linear variable displacement transducer. A dedicated soft- ware allows obtaining a variety of stress–strain regimes from fast deformation rates to long-term creep tests. Experiments conducted with this new real-time setup have important ram- ifications for the interpretation of geochemical anomalies recorded prior to volcanic eruptions or earthquakes. 1 Introduction Positive radon anomalies in soil gas and groundwater are commonly observed prior to earthquake ruptures and vol- canic eruptions, attracting considerable attention in studies on precursory geochemical signals (Cox et al., 1980; King et al., 1995; Linde and Sacks, 1998; Roeloffs, 1999; Trique et al., 1999). However, this simplified picture is frequently contradicted by the lack of significant anomalies recorded before an earthquake (Kerr, 1978; King, 1981; Tsunogai and Wakita, 1995; Steinitz et al., 2003). Moreover, nega- tive anomalies are sometimes measured at the seismic source (Hauksson, 1981; Kuo et al., 2006), while contemporaneous positive anomalies are inexplicably recorded at monitoring stations located hundreds of kilometres away (Kerr, 1978, 1981). Alternating increases and decreases of radon emis- sions are also measured prior to earthquakes (Wakita et al., 1980; Igarashi et al., 1995). Hence, although the radon signal is routinely measured and monitored in the field as possible precursor of earth- quakes and volcanic eruptions, in many cases the simple monitoring of radon emission does not appear to be useful as a warning signal. In view of this, laboratory experiments may represent the key to better understand the complex re- lationship between the geochemical behaviour of radon and rock deformation mechanisms. Paradoxically, a few experi- mental studies in the history of Earth sciences have attempted to understand the relationships between radon emission rate and rock deformation. In their early and pioneer work, Holub and Brady (1981) performed uniaxial compression tests on granite samples to monitor changes in radon exhalation as a function of microfracturing. Tests were carried out by cycli- Published by Copernicus Publications on behalf of the European Geosciences Union.
Transcript of Real-time setup to measure radon emission during rock ...

Geosci. Instrum. Method. Data Syst., 4, 111–119, 2015
www.geosci-instrum-method-data-syst.net/4/111/2015/
doi:10.5194/gi-4-111-2015
© Author(s) 2015. CC Attribution 3.0 License.
Real-time setup to measure radon emission during rock
deformation: implications for geochemical surveillance
P. Tuccimei1, S. Mollo2, M. Soligo1, P. Scarlato2, and M. Castelluccio1
1Università “Roma Tre”, Dipartimento di Scienze, Largo S. L. Murialdo 1, 00146 Roma, Italy2Istituto Nazionale di Geofisica e Vulcanologia, Via di Vigna Murata 60, 00143 Roma, Italy
Correspondence to: P. Tuccimei ([email protected])
Received: 24 November 2014 – Published in Geosci. Instrum. Method. Data Syst. Discuss.: 4 February 2015
Revised: 27 April 2015 – Accepted: 11 May 2015 – Published: 27 May 2015
Abstract. Laboratory experiments can represent a valid ap-
proach to unravel the complex interplay between the geo-
chemical behaviour of radon and rock deformation mecha-
nisms. In light of this, we present a new real-time experimen-
tal setup for analysing in continuum the alpha-emitting 222Rn
and 220Rn daughters over variable stress–strain regimes. The
most innovative segment of this setup consists of the radon
accumulation chamber obtained from a tough and durable
material that can host large cylindrical rock samples. The
accumulation chamber is connected, in a closed-loop con-
figuration, to a gas-drying unit and to a RAD7 radon moni-
tor. A recirculating pump moves the gas from the rock sam-
ple to a solid-state detector for alpha counting of radon and
thoron progeny. The measured radon signal is enhanced by
surrounding the accumulation chamber with a digitally con-
trolled heating belt. As the temperature is increased, the num-
ber of effective collisions of radon atoms increases favour-
ing the diffusion of radon through the material and reducing
the analytical uncertainty. The accumulation chamber con-
taining the sample is then placed into a uniaxial testing ap-
paratus where the axial deformation is measured throughout
a linear variable displacement transducer. A dedicated soft-
ware allows obtaining a variety of stress–strain regimes from
fast deformation rates to long-term creep tests. Experiments
conducted with this new real-time setup have important ram-
ifications for the interpretation of geochemical anomalies
recorded prior to volcanic eruptions or earthquakes.
1 Introduction
Positive radon anomalies in soil gas and groundwater are
commonly observed prior to earthquake ruptures and vol-
canic eruptions, attracting considerable attention in studies
on precursory geochemical signals (Cox et al., 1980; King
et al., 1995; Linde and Sacks, 1998; Roeloffs, 1999; Trique
et al., 1999). However, this simplified picture is frequently
contradicted by the lack of significant anomalies recorded
before an earthquake (Kerr, 1978; King, 1981; Tsunogai
and Wakita, 1995; Steinitz et al., 2003). Moreover, nega-
tive anomalies are sometimes measured at the seismic source
(Hauksson, 1981; Kuo et al., 2006), while contemporaneous
positive anomalies are inexplicably recorded at monitoring
stations located hundreds of kilometres away (Kerr, 1978,
1981). Alternating increases and decreases of radon emis-
sions are also measured prior to earthquakes (Wakita et al.,
1980; Igarashi et al., 1995).
Hence, although the radon signal is routinely measured
and monitored in the field as possible precursor of earth-
quakes and volcanic eruptions, in many cases the simple
monitoring of radon emission does not appear to be useful
as a warning signal. In view of this, laboratory experiments
may represent the key to better understand the complex re-
lationship between the geochemical behaviour of radon and
rock deformation mechanisms. Paradoxically, a few experi-
mental studies in the history of Earth sciences have attempted
to understand the relationships between radon emission rate
and rock deformation. In their early and pioneer work, Holub
and Brady (1981) performed uniaxial compression tests on
granite samples to monitor changes in radon exhalation as a
function of microfracturing. Tests were carried out by cycli-
Published by Copernicus Publications on behalf of the European Geosciences Union.

112 P. Tuccimei et al.: Real-time setup to measure radon emission during rock deformation
cally loading and unloading samples to increase rock dam-
age. However, from an analytical point of view, radon mea-
surement cycles lasting up to 200 min made difficult to un-
derstand the relationship between radon exhalation and mi-
crocrack growth. Moreover, radon emissions were measured
using an alpha radiation detection scintillator that did not dis-
criminate radon isotopes and was also affected by a large an-
alytical uncertainty. Using a more accurate radon measure-
ment system, Tuccimei et al. (2010) and Mollo et al. (2011a)
presented a new data set on radon emission from different
rock samples uniaxially deformed over incremental loading
conditions. The analytical system allowed for the simulta-
neous measurement of both radon main isotopes, i.e. radon
(222Rn) and thoron (220Rn), using the 218Po peak for 222Rn
and 216Po peak for 220Rn. Using this counting system, a rapid
equilibrium between polonium and radon nuclei is achieved;
therefore, the radon signal responds quickly (in the order
of a few minutes) to any change in rock deformation, also
reducing significantly the analytical uncertainty (Tuccimei
et al., 2006, 2011). Results from experiments of Tuccimei
et al. (2010) have evidenced that negative radon anomalies
measured in soil gas and groundwater may be explained
by the deformation of loosely consolidated and/or highly
porous rocks due to a pore collapse process that reduces the
radon exhaling surface. In contrast, Mollo et al. (2011a) have
demonstrated that no significant radon changes are recorded
prior to an earthquake due to the deformation of low porosity
and high strength crystalline igneous rocks. Only after fail-
ure, when a macroscopic rupture surface develops (e.g. in the
form of an earthquake), a significant increase in radon emis-
sion is recorded. This also suggests that geological bedrock
consisting of high-strength materials could drastically reduce
the prediction potential of radon monitoring in active seismic
and volcanic areas.
The experiments described above have important ramifi-
cations for the use of radon emissions as a predictive tool.
Namely, they go some way in providing an explanation for
the seemingly confusing array of radon anomalies seen prior
to earthquakes in nature. However, the measured radon sig-
nal is the result of a stepped experimental strategy in which
the sample is firstly deformed in a uniaxial machine and then
its radon emission is analysed in a counting system. We term
this laboratory strategy as “snapshot experiments” because
they can only provide radon emissions from a rock sample
deformed at predetermined stress conditions. Thus, interpre-
tations about changes of radon emission through time rest
on the assumption that a rock sample deformed at the same
stress value produces an identical radon emission irrespec-
tive of load paths and stress trajectories. Obviously, snapshot
experiments do not simulate the natural variability of stress–
strain conditions and, consequently, the evolution of radon
signals during continuous rock deformation is still under de-
bate.
Due to the lack of appropriate methodologies to reproduce
radon anomalies in the laboratory, here we present the result
Figure 1. Experimental setup for the detection of 222Rn and 220Rn
activity concentrations from rocks under uniaxial deformation. The
system consists of: rock sample (1), DryPack accumulation cham-
ber (2), digitally controlled heating belt (3), desiccant (4), RAD 7
radon monitor (5), uniaxial press (6), and vinyl tubing (7). Arrows
connect the different sections of the experimental system to give a
complete view of it. See text for explanation.
of the efforts conducted to develop and test a real-time ex-
perimental setup for measuring radon emissions during rock
deformation. This system allows us to fully unravel the com-
plex relationship between rock deformation style and radon
emission rate by analysing in continuum the alpha-emitting222Rn and 220Rn daughters.
2 Overview of the real-time experimental setup
2.1 Radon counting system
The most innovative segment of the experimental setup de-
scribed in this study is the radon accumulation chamber ob-
tained from a “dry pack” material (DryPackTM 3750, ITW
Richmond Technology) made up of three extremely tough
and durable layers: (i) an external polyester film, (ii) an in-
termediate solid aluminium shielding foil, and (iii) an inter-
nal antistatic polyethylene interior sealant. The dry pack is
cut and modelled to obtain a chamber of 36× 30× 15 cm
(Fig. 1). The rock sample is inserted into the chamber and
then each side of the dry pack is thermosealed. Two holes
are drilled at opposite sides of the dry pack to insert 140 cm
long vinyl tubes that connect, in a closed-loop configuration
(Fig. 1), the accumulation chamber to a gas-drying unit filled
with a desiccant (CaSO4 with 3 % CoCl2, as indicator) and
to a RAD7 radon monitor (Durridge Company Inc.). All the
connecting junctions are then carefully sealed with silicon to
avoid radon leakage.
Geosci. Instrum. Method. Data Syst., 4, 111–119, 2015 www.geosci-instrum-method-data-syst.net/4/111/2015/

P. Tuccimei et al.: Real-time setup to measure radon emission during rock deformation 113
To enhance the radon signal and reduce the analytical
uncertainty, the accumulation chamber containing the rock
sample is kept at a constant temperature through a custom-
designed, digitally controlled heating belt surrounding the
chamber (Fig. 1). The belt consists of a heating textile with
a warp-knitted basis structure (68 % PES and 32 % carbon
fibre) operating up to 90 ◦C. The temperature is monitored
by an insulated Pt100 resistance thermometer with accu-
racy ±1 ◦C (factory calibrated in oil bath and air by SAB
Bröckskes) that is connected to a 1/16 in. DIN size controller
(OMRON E5CSV). This specific device is intended to ex-
ploit the higher mobility of the gas supplying thermal energy
to the radon atoms. As the temperature is increased, the num-
ber of effective collision of radon atoms with other molecules
and grain walls is enhanced favouring the diffusion of radon
through the smallest pores of the material. The end result is a
higher radon exhalation with lower uncertainty that strongly
improves the ability of the system to capture any departure
from radioactive equilibrium (Tuccimei et al., 2009, 2011).
A recirculating pump in the RAD7 moves the gas from
the accumulation chamber through both the desiccant and
inlet filter to a solid-state detector for alpha counting of
radon and thoron progeny. The electrostatic detector collects
the charged ions and discriminates the electrical pulses gen-
erated by their alpha particles. This allows selecting only
the short-lived 218Po and 216Po counting for a rapid deter-
mination of 222Rn and 220Rn, respectively. The radioactive
equilibrium between 218Po and 222Rn is achieved in about
15 min, i.e. about 5 times the half-life of 218Po, whereas the
equilibrium between 216Po and 220Rn occurs in a few sec-
onds only, as the result of the very short thoron half-life of
55.6 s.
The accumulation chamber containing the sample and sur-
rounded by the heating belt is then placed into a uniaxial
testing apparatus (Fig. 1) with a maximum loading capac-
ity of 250 kN (cf. Mollo et al., 2011b). The axial deforma-
tion is measured throughout a linear variable displacement
transducer (LVDT, extensimeter) with a resolution of 1 µm.
A dedicated software allows switching from deformation to
load control and viceversa at any time of the experiment.
Since the piston is controlled via microadjustments operated
by a servo-controller actuator, the machine is suitable for a
wide variety of stress–strain experiments from fast deforma-
tion rates to long-term creep tests.
2.2 Testing material
The material used to test the experimental setup is the so-
called “Tufo Rosso a Scorie Nere” (hereafter named TRSN).
This is a lithophysae-rich tuff sampled from a pyroclastic
flow of the Vico volcanic apparatus (Latium, Italy). The tuff
belongs to the main body of a reddish ignimbrite deposit,
containing sanidine crystals and black pumices, mostly cen-
timetric in size. We have chosen TRSN because the rela-
tionship between radon emission and tuff deformation of
Figure 2. Schematic overview of the relationship between TRSN
sample deformation and radon emission as determined by previous
studies (Hudyma et al., 2004; Tuccimei et al., 2006, 2009, 2011).
Back-scattered electron (BSE) images were obtained using a field-
emission scanning electron microscopy (FE-SEM) at the HP-HT
Laboratory of Experimental Volcanology and Geophysics of the Is-
tituto Nazionale di Geofisica e Vulcanologia in Rome (Italy). Large
cavities, vugs and vesicles (i.e. lithophysae) are indicated for the
intact sample. Due to pore collapse, no lithophysae are observable
for the densely compacted sample; consequently, radon emission
decreases. In contrast, microfractures are formed prior to rock fail-
ure, causing a positive geochemical anomaly. After rupture, the for-
mation of macroscopic exhaling surface further increases the radon
emission.
this material has been the focus of previous studies (Tuc-
cimei et al., 2010; Mollo et al., 2011a; Scarlato et al., 2013).
As reported by Tuccimei et al. (2010), TRSN has a total
porosity of about 47 % with a characteristic bimodal distri-
bution (Fig. 2): macroporosity (from 1 mm to 1 cm) and mi-
croporosity (from 1 to 100 µm). Generally, this high poros-
ity is due to larger cavities, vugs and vesicles that over-
print smaller discontinuities, such as grain boundaries, cracks
and flaws. The bimodal porosity is typical in volcanic en-
vironments where macroporosity is given from lithophysae,
www.geosci-instrum-method-data-syst.net/4/111/2015/ Geosci. Instrum. Method. Data Syst., 4, 111–119, 2015

114 P. Tuccimei et al.: Real-time setup to measure radon emission during rock deformation
i.e. centimetre-scale cavities formed by trapped pockets of
gas within the cooling volcanic ash. Generally, larger cavities
are the main source of porosity and their variability in size
and shape were seen to control the radon exhalation (Tuc-
cimei et al., 2006) and mechanical properties of lithophysal
tuff (Hudyma et al., 2004). Due to the presence of a high
number of pores, TRSN is extremely weak with an uniax-
ial compressive strength (UCS; i.e. the capacity of a material
to withstand axially directed pushing forces prior to failure)
< 2.4 MPa. Thus, as the load is increased, the deformation
proceeds via two main mechanisms (Fig. 2): pore collapse
and microfracturing. The extensive pore collapse is due to the
closure of both macropores and micropores (Fig. 2), i.e. the
porosity decreases from 47 to 40 % (Tuccimei et al., 2010),
causing a densification of the material, i.e. both P-wave ve-
locity (Scarlato et al., 2013) and bulk density increase from
1.3 km s−1 and 0.9 g cm−3 to 1.8 km s−1 and 1.3 g cm−3, re-
spectively. According to Tuccimei et al. (2010), with respect
to the normal level of radon emission recorded for the intact
TRSN sample, a negative geochemical anomaly is measured
due to the reduction of porosity (Fig. 2), i.e. as the exhaling
surface is reduced. On the other hand, prior to TRSN sam-
ple rupture, microfractures develop gradually into macrofrac-
tures (Fig. 2); indeed, microfracturing has been recognized
by early studies (e.g. Brace et al., 1966; Scholz, 1968; Waw-
ersik, 1972) to be the main mechanism responsible for the
formation of macroscopic failure. Consequently, the radon
emission progressively increases (Fig. 2) giving reason for
the high positive anomaly recorded as macroscopic exhaling
surfaces are progressively produced by deformation (Tuc-
cimei et al., 2010)
TRSN is characterized by a high radium activity concen-
tration (226Ra= 254 Bq kg−1) and high uranium (21.2 ppm)
and thorium (52.3 ppm) contents (Tuccimei et al., 2006). The
significant concentration of these nuclides, which are precur-
sors of radon isotopes, along with the presence of macro-
porosity, made this material particularly suitable to anal-
yse variations of radon and thoron emissions under variable
loads. Moreover, to obtain a strong geochemical signal, we
used large cylindrical samples of 100 mm in diameter and
140 mm in length. The intact rock samples oven-dried at
110 ◦C for 24 h are characterized, at room temperature, by an
initial average 222Rn and 220Rn exhalation rates of 7.9 and
314 Bq kg−1 h−1, respectively (Tuccimei et al., 2010).
2.3 Experimental protocol
A dried TRSN sample is loaded into the accumulation cham-
ber that is then thermosealed. Although a constant activity
concentration of 220Rn is achieved in a few minutes, a pe-
riod of at least 20 days is required to reach 222Rn radioac-
tive equilibrium. Such a feature puts forward the preferential
use in laboratory experiments of 220Rn for monitoring rapid
changes of radon emission during rock deformation (cf. Tuc-
cimei et al., 2010; Mollo et al., 2011a). Indeed, thoron re-
sponds almost instantaneously to rock deformation changes,
drastically reducing the length of a single measurement cy-
cle. Moreover, even if 222Rn rather than 220Rn is usually
monitored in volcanic and seismic areas due to its higher
activity concentration and longer half-life, results from lab-
oratory analyses based on 220Rn are certainly comparable
with natural processes releasing 222Rn since heavy radon and
thoron isotopes do not fractionate due to their low mass dif-
ference (0.01 %).
At the end of the equilibration period, the accumulation
chamber is connected to the RAD 7, and the heating belt is
set to the desired experimental temperature. A few hours are
needed to reach stable initial conditions in the experimen-
tal setup, e.g. temperature homogenization in the closed-loop
configuration. A period of 30 min is selected as acquisition
time of a single measurement cycle. To reduce the uncer-
tainty associated with eventual slight variations of temper-
ature and load, 48 cycles per day (with 30 min acquisition
time) are collected. For each data set the uncertainty of the
mean at 95 % confidence level is then calculated. The initial
24 h average 220Rn activity concentration is generally chosen
as reference value to highlight any change in thoron concen-
tration under variable load conditions. The influence of other
parameters on radon emission, such as air relative humidity
and detection temperature in the closed-loop configuration,
were the object of previous studies (Tuccimei et al., 2006,
2009, 2011), demonstrating also that no gas sorption phe-
nomena occur on the desiccant (i.e. on the CaSO4 grains).
It is worth stressing that radon is chemically inert and
its transport behaviour in rocks is dominated by migration
through connected pores and cracks (either pre-existing or
stress-induced). Its short recoil length (3× 10⁻⁸ cm), due to
a short lifetime diffusion distance, implies that only atoms
produced at the surface of grains, trapped within the space
of pores and/or adsorbed by the free inner surface of microc-
racks can be released from rock to the surrounding medium.
Thus, the behaviour of radon emission from rocks subjected
to variable stress conditions is primarily dependent on the
increase or decrease of the rock exhaling surface (e.g. Sen-
gupta et al., 2005; Banerjee et al., 2011). This means that,
using our closed-loop experimental setup, changes in radon
emission result in a new value of equilibrium activity con-
centration within the inner volume of the equipment, namely
(i) a 220Rn increment if the exhalation surface increases due
to microfracturing and failure (Banerjee et al., 2011; Mollo et
al., 2011a) and (ii) a 220Rn radon reduction if the exhalation
surface decreases due to rock pore collapse and compaction
(Sengupta et al., 2005; Tuccimei et al., 2010).
Geosci. Instrum. Method. Data Syst., 4, 111–119, 2015 www.geosci-instrum-method-data-syst.net/4/111/2015/

P. Tuccimei et al.: Real-time setup to measure radon emission during rock deformation 115
3 Results and interpretation
3.1 Temperature-dependent radon concentration
experiments
A large number of studies is concerned with the effect
of physical parameters on radon fluxes and concentrations
through the pores of geological materials. Seasonal fluctua-
tions of temperature are strictly correlated with changes of
soil radon abundances. For example, summer climatic condi-
tions make top soil dry, enhancing its permeability (e.g. Wie-
gand, 2001); at the same time, as the daily or seasonal tem-
perature increases, the diffusion and release of radon at the
soil–air interface increases and the gas concentration at shal-
low depth decreases (e.g. Wiegand, 2001; Iskandar et al.,
2004). Similarly, previous laboratory measurements of radon
exhalation rates have evidenced the same direct positive cor-
relation between radon emission and sample temperature
(Stranden et al., 1984; Tuccimei et al., 2009). Thus, the use of
thermal enhancement to increase atomic mobility and there-
fore radon emission may be crucial in the study of low-
emitting, natural materials (e.g. limestones, travertines and
siliceous sands) and, importantly, to reduce the uncertainty
associated with the analytical measurement (Tuccimei et al.,
2006, 2011).
Here we present results from temperature-dependent
radon concentration (TDRC) measurements performed to
found the thermal conditions leading to the highest radon
signal and lowest analytical error. Measurements were car-
ried out using our experimental setup consisting of (i) the dry
pack accumulation chamber, (ii) the TRSN sample, (iii) the
heating belt, and (iv) the RAD7 radon monitor (Fig. 1). 220Rn
activity concentrations were obtained by means of 30 min
counting cycles. Our analyses were initially conducted at
room temperature (i.e. 24.3 ◦C); then, the temperature was
progressively increased from 30 to 90 ◦C using an incremen-
tal step of 10 ◦C and maintaining the temperature constant
for 24 h during each step. All data recorded during 8 days
of measurements are plotted in Fig. 3a and highlight that the
thoron signal increases with increasing temperature.
In order to quantify this relationship, we have calculated
the average 220Rn activity concentration for each 24 h mea-
surement. Results are presented in Fig. 3b, attesting a posi-
tive exponential dependence of thoron signal from tempera-
ture. The regression analysis based on data exponential fitting
yields a good correlation coefficient (R= 0.995) with a high
confidence interval for the eight data points (α0.001= 0.925).
Moreover, as the temperature is increased, the uncertainty of
the 24 h 220Rn mean at 95 % confidence interval decreases
from 5 % (at room temperature) to 2.7 % (at 90 ◦C), demon-
strating a significant improvement of data resolution. No-
tably, although the 24 h thoron activity concentration is in-
creased by 30 % at 90 ◦C, the 24 h average temperature mea-
sured in the detection chamber of the RAD7 slightly changes
from 21.6 to 25.7 ◦C (Fig. 3b). This finding is very impor-
Figure 3. 220Rn (thoron) data from temperature-dependent radon
concentration (TDRC) experiments conducted at room tempera-
ture and from 30 to 90 ◦C (using steps of 10 ◦C). 220Rn data from
30 min cycles are plotted together with 24 h average 220Rn activ-
ity concentrations (a). 24 h average 220Rn activity concentrations
are also plotted versus the exhalation temperature (b). Uncertain-
ties of the mean are calculated at a confidence level of 95 %. Re-
gression analysis yields an exponential fitting with a correlation
coefficient of 0.925 (α), which is the 0.001 probability reference
value for eight data points. The correlation factor (R) is also very
high (0.995). The 24 h average detection temperature in the radon
monitor is plotted versus the exhalation temperature of the TRSN
sample (b). No significant changes are observed for the detection
temperature, showing a variation lesser than 4 ◦C.
tant for assessing the overall quality of our measurements.
In fact, a great increase of the detection temperature at con-
stant relative humidity would reduce the counting efficiency
of the solid-state silicon detector, leading to biased analytical
results and misleading interpretations of the data (Roca et al.,
2004; Tuccimei et al., 2011).
On the basis of TDRC data, we have conducted defor-
mation experiments at 90 ◦C corresponding to the maxi-
mum operating temperature of the heating belt and provid-
ing the lowest analytical uncertainty. We stress that thermal
conditions > 100 ◦C are not recommended for our experi-
ments due to the thermal decomposition of volatile-bearing
minerals hosted in rocks as primary or secondary crystals,
xenocrysts, and matrix cement. For example, the dehydration
and dehydroxylation of H2O-bearing minerals, such as clays
and zeolites, start at 100 ◦C (Heller-Kallai et al., 1989) and
proceed up to 800 ◦C (Che et al., 2011); whereas, the decar-
bonation of CO2-bearing minerals starts at 500 and 700 ◦C
for dolomite (Rodriguez-Navarro et al., 2012) and calcite
(Mollo et al., 2013), respectively. Several studies have ex-
www.geosci-instrum-method-data-syst.net/4/111/2015/ Geosci. Instrum. Method. Data Syst., 4, 111–119, 2015

116 P. Tuccimei et al.: Real-time setup to measure radon emission during rock deformation
Figure 4. Deformation-dependent radon concentration (DDRC)
R1 experiment, at constant temperatures of 90 ◦C. The uniaxial load
and 24 h average 220Rn activity concentration are plotted versus the
experimental time. Six different load steps of 2, 4, 6, 8, 10, and
12 kN were used and the load was maintained constant for 1 day for
each step. 220Rn activity concentration invariably decreases with in-
creasing load due to pore collapse. At 12 kN, the load was increased
up to sample failure and the thoron signal substantially increased
due to the formation of macroscopic exhaling surfaces.
perimentally demonstrated that the thermal decomposition of
these minerals results in a progressive change of the physical
properties of the geological materials (i.e. porosity, Young’s
modulus, Poisson’s ratio, and P- and S-wave velocities) re-
ducing significantly their strength via thermal microcracking
or intercrystalline plasticity (Heap et al., 2012, 2013; Mollo
et al., 2012, 2013). Therefore, it is crucial to prevent ther-
mally induced reactions to correctly assess changes in radon
emission during deformation of naturally formed rocks.
3.2 Deformation-dependent radon concentration
experiments
To test the ability of our real-time experimental setup
for measuring radon variations during rock deformation,
we have designed three different types of Deformation-
Dependent Radon Concentration (DDRC) experiments,
i.e. R1, R2 and R3, conducted under variable load-time con-
ditions from 1 to 15 kN and from 7 to 17 days. Each DDRC
experiment was also replicated to verify data reproducibil-
ity; the whole analytical data set is reported in the Table 1.
According to results from TDRC experiments (Fig. 3), each
deformation test was carried out at 90 ◦C to maximize the
thoron signal and reduce the analytical uncertainty; notably,
the TRSN sample was also kept at 90 ◦C for 1 day to achieve
thermal homogenization prior to loading (see, the horizontal
segment from 0 to 1 on the x axis (days), with y coordinate
(kN) equal to 0). The load values and thoron activity concen-
trations (expressed as 24 h 220Rn mean activity concentration
in the closed-loop setup) measured during experiment R1 are
Figure 5. DDRC experiment R2, at constant temperatures of 90 ◦C.
The uniaxial load and 24 h average 220Rn activity concentration
are plotted versus the experimental time. Two load steps from 0 to
5 kN and from 5 to 10 kN were performed. For each step the load
was kept constant for 4 days. 220Rn concentration progressively de-
creases over time accounting for a pore collapse process. However,
at 10 kN, the thoron signal slightly increases the day before the rup-
ture. This is due to the formation of microfractures, anticipating the
macroscopic failure that occurs at about 15 kN.
reported in Fig. 4. Six different load steps of 2, 4, 6, 8, 10,
and 12 kN were used and the load was maintained constant
for 1 day during each step. The load was increased using a
rate of 1 kN min−1 to rapidly assure a new thoron equilib-
rium in the deformed rock. Then, at 12 kN the load was in-
creased up to sample failure (at about 15 kN). Figure 4 shows
that, as the load is higher than 2 kN, 220Rn concentration de-
creases by about 5 % for each step. Only when the TRSN
sample is failed, does the thoron signal drastically increase
by about 57 %. The behaviour of thoron observed from ex-
periment R1 is identical to that measured from snapshot ex-
periments of Tuccimei et al. (2010). As discussed above, the
authors demonstrated that thoron emission decreases with in-
creasing load due to a pore closure process that reduces the
exhaling surface of TRSN samples (Fig. 2). This finding is
also consistent with the knowledge that low porosity rocks
exhibit reduced radon flux, in spite of their enhanced radioac-
tive source content (Banerjee et al., 2011). In contrast, at the
end of the densification process, microfracturing occurs ex-
tensively prior to the formation of a macroscopic fault after
failure (Fig. 2), causing an overall increase of 220Rn activ-
ity concentration (Fig. 4). As demonstrated by Sengupta et
al. (2005), the concentration of radionuclides in a rock is
dependent on the microstructural fabric, attesting that mi-
crofractures (and, obviously, macroscopic faults) act as path-
ways for migration of radionuclides.
In Fig. 5 we report the change of thoron signal from ex-
periment R2. Two load steps (i.e. from 0 to 5 kN and from
5 to 10 kN, respectively) were performed using a very short
Geosci. Instrum. Method. Data Syst., 4, 111–119, 2015 www.geosci-instrum-method-data-syst.net/4/111/2015/
P. Tuccimei et al.: Real-time setup to measure radon emission during rock deformation 117
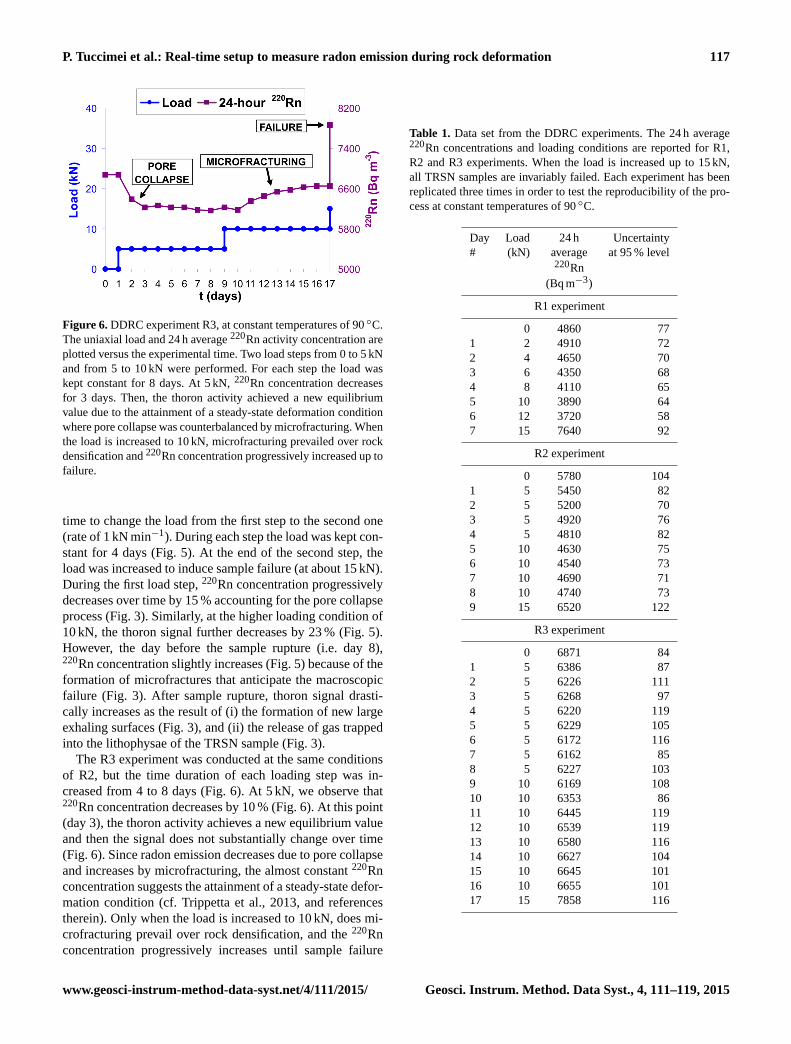
Figure 6. DDRC experiment R3, at constant temperatures of 90 ◦C.
The uniaxial load and 24 h average 220Rn activity concentration are
plotted versus the experimental time. Two load steps from 0 to 5 kN
and from 5 to 10 kN were performed. For each step the load was
kept constant for 8 days. At 5 kN, 220Rn concentration decreases
for 3 days. Then, the thoron activity achieved a new equilibrium
value due to the attainment of a steady-state deformation condition
where pore collapse was counterbalanced by microfracturing. When
the load is increased to 10 kN, microfracturing prevailed over rock
densification and 220Rn concentration progressively increased up to
failure.
time to change the load from the first step to the second one
(rate of 1 kN min−1). During each step the load was kept con-
stant for 4 days (Fig. 5). At the end of the second step, the
load was increased to induce sample failure (at about 15 kN).
During the first load step, 220Rn concentration progressively
decreases over time by 15 % accounting for the pore collapse
process (Fig. 3). Similarly, at the higher loading condition of
10 kN, the thoron signal further decreases by 23 % (Fig. 5).
However, the day before the sample rupture (i.e. day 8),220Rn concentration slightly increases (Fig. 5) because of the
formation of microfractures that anticipate the macroscopic
failure (Fig. 3). After sample rupture, thoron signal drasti-
cally increases as the result of (i) the formation of new large
exhaling surfaces (Fig. 3), and (ii) the release of gas trapped
into the lithophysae of the TRSN sample (Fig. 3).
The R3 experiment was conducted at the same conditions
of R2, but the time duration of each loading step was in-
creased from 4 to 8 days (Fig. 6). At 5 kN, we observe that220Rn concentration decreases by 10 % (Fig. 6). At this point
(day 3), the thoron activity achieves a new equilibrium value
and then the signal does not substantially change over time
(Fig. 6). Since radon emission decreases due to pore collapse
and increases by microfracturing, the almost constant 220Rn
concentration suggests the attainment of a steady-state defor-
mation condition (cf. Trippetta et al., 2013, and references
therein). Only when the load is increased to 10 kN, does mi-
crofracturing prevail over rock densification, and the 220Rn
concentration progressively increases until sample failure
Table 1. Data set from the DDRC experiments. The 24 h average220Rn concentrations and loading conditions are reported for R1,
R2 and R3 experiments. When the load is increased up to 15 kN,
all TRSN samples are invariably failed. Each experiment has been
replicated three times in order to test the reproducibility of the pro-
cess at constant temperatures of 90 ◦C.
Day Load 24 h Uncertainty
# (kN) average at 95 % level220Rn
(Bq m−3)
R1 experiment
0 4860 77
1 2 4910 72
2 4 4650 70
3 6 4350 68
4 8 4110 65
5 10 3890 64
6 12 3720 58
7 15 7640 92
R2 experiment
0 5780 104
1 5 5450 82
2 5 5200 70
3 5 4920 76
4 5 4810 82
5 10 4630 75
6 10 4540 73
7 10 4690 71
8 10 4740 73
9 15 6520 122
R3 experiment
0 6871 84
1 5 6386 87
2 5 6226 111
3 5 6268 97
4 5 6220 119
5 5 6229 105
6 5 6172 116
7 5 6162 85
8 5 6227 103
9 10 6169 108
10 10 6353 86
11 10 6445 119
12 10 6539 119
13 10 6580 116
14 10 6627 104
15 10 6645 101
16 10 6655 101
17 15 7858 116
www.geosci-instrum-method-data-syst.net/4/111/2015/ Geosci. Instrum. Method. Data Syst., 4, 111–119, 2015

118 P. Tuccimei et al.: Real-time setup to measure radon emission during rock deformation
(Fig. 6). As it was observed for experiments R1 and R2, the
formation of macroscopic exhaling surfaces (Fig. 3) causes
the highest thoron signal due to the fact that radon trapped
within the material escapes (Fig. 6).
By comparing data from experiments R1 (Fig. 4), R2
(Fig. 5) and R3 (Fig. 6), we observe that both negative and
positive changes of the radon signal may be recorded in
the laboratory. This variation could become the key to in-
terpret field monitoring data as geochemical anomalies prior
to rupture of the same rock type, in response to the prevail-
ing deformation mechanism. This means that, in seismic or
volcanic areas, pore collapse due to low stress conditions
may cause significant radon decrease until a constant activ-
ity concentration is achieved (Tuccimei et al., 2010). If the
low stress condition persists over time (for days and perhaps
weeks and months), the radon signal does not change after
rock compaction. Conversely, microfracturing due to a high
stress condition leads to the formation of new emanation sur-
faces and substantial increase of the radon signal, although
the applied stress remains constant over time. After rock fail-
ure, much larger emanation surfaces are created in the form
of macroscopic faults and, consequently, most of the radon
trapped within the material escapes leading to a significant
increase of radon activity concentration in the natural area
(Mollo et al., 2011a). Therefore, our real-time experimental
setup shows, for the first time, that the imposed stress and
time conditions have contrasting repercussions on the radon
signal measured by monitoring stations installed for seismic
and volcanic surveillance.
4 Conclusions
The originality of this study is the development of a new
real-time experimental setup to monitor the rapid changes
of radon activity concentration during rock deformation.
We have therefore designed and tested a new accumulation
chamber that allows us to obtain real-time radon measure-
ments during uniaxial deformation experiments. The main
advantage of this system is that parameters influencing radon
emission other than rock deformation are kept under control.
Using a digitally controlled heating belt, the radon signal re-
sults to be significant so that it is possible to (i) calculate an
average thoron value over a day, (ii) to reduce significantly
the uncertainty of the mean, and (iii) to improve the analyti-
cal resolution. With respect to previous snapshot experiments
from literature, results from our study put emphasis on the
great potential of the real-time experimental setup to improve
the use of radon gas emissions as predictor for earthquakes
and volcanic eruptions.
Acknowledgements. This study was supported by MIUR, PRIN
project – Experimental study on radon emission from rocks under
mechanical and thermal stress. Implications for volcanic and
seismic surveillance – and MIUR, Premiale project – NoRth: New
hORizons of the Technology applied to experimental researches
and geophysical and volcanological monitoring. The research
activities of the HP-HT laboratory of the INGV were supported by
the European Observing System Infrastructure project (EPOS).
Edited by: M. Díaz-Michelena
References
Banerjee, K. S., Basu, A., Guin, R., and Sengupta, D.: Radon
(222Rn) level variations on a regional scale from the Singhbhum
Shear Zone, India: A comparative evaluation between influence
of basement U-activity and porosity, Radiat. Phys. Chem., 80,
614–619, 2011.
Brace, W. F., Paulding Jr., B. W., and Scholz, C. H.: Dilatancy in the
fracture of crystalline rocks, J. Geophys. Res., 71, 3939–3953,
1966.
Che, C., Glotch, T. D., Bish, D. L., Michalski, J. R., and Xu, W.:
Spectroscopic study of the dehydration and/or dehydroxylation
of phyllosilicate and zeolite minerals, J. Geophys. Res., 116,
E05007, doi:10.1029/2010JE003740, 2011.
Cox, E. M., Cuff, E. K., and Thomas, M. D.: Variations of ground
radon concentrations with activity of Kilauea volcano, Hawaii,
Nature, 288, 74–76, 1980.
Hauksson, E.: Radon content of groundwater as an earthquake pre-
cursor: Evaluation of worldwide data and physical basis, J. Geo-
phys. Res., 86, 9397–9410, 1981.
Heap, M. J., Lavallee, Y., Laumann, A., Hess, K.-U., Meredith, P.
G., and Dingwell, D. B.: How tough is tuff in the event of fire?,
Geology, 40, 311–314, 2012.
Heap, M. J., Mollo, S., Vinciguerra, S., Lavallée, Y., Hess, K.-U.,
Dingwell, D. B., Baud, P., and Iezzi G.: Thermal weakening of
the carbonate basement under Mt. Etna volcano (Italy): Implica-
tions for volcano instability, J. Volcanol. Geoth. Res., 250, 42–
60, 2013.
Heller-Kallai, L., Miloslavski, I., and Grayevski, A.: Evolution of
hydrogen on dehydroxylation of clay minerals, Amer. Mineral.,
74, 818–820, 1989.
Holub, R. F. and Brady, B. T.: The effect of stress on radon emana-
tion from rock, J. Geophys. Res., 86, 1776–1784, 1981.
Hudyma, N., Burcin Avarb, B., and Karakouzian, M.: Compres-
sive strength and failure modes of lithophysae-rich Topopah
Spring Tuff specimens and analog models containing cavities,
Eng. Geol., 73, 179–190, doi:doi:10.1016/j.enggeo.2004.01.003,
2004.
Igarashi, G., Saeki, S., Takahata, N., Sumikawa, K., Tasaka, S.,
Sasaki, Y., Takahashi, M., and Sano, Y.: Ground-water radon
anomaly before the Kobe earthquake in Japan, Science, 269, 60–
61, 1995.
Iskandar, D., Yamazawa, H., and Lida, T.: Quantification of the de-
pendency of radon emanation power on soil temperature, Appl.
Radiat. Isot., 60, 971–973, 2004.
Kerr, R. A.: Earthquakes: Prediction proving elusive, Science, 200,
419–421, 1978.
Kerr, R. A.: The mountain is behaving itself – For now, Science,
212, 1258–1259, 1981.
King, C.-Y.: Do radon anomalies predict earthquakes?, Nature, 293,
262, 1981.
Geosci. Instrum. Method. Data Syst., 4, 111–119, 2015 www.geosci-instrum-method-data-syst.net/4/111/2015/

P. Tuccimei et al.: Real-time setup to measure radon emission during rock deformation 119
King, C.-Y., Koizumi, N., and Kitagawa, Y.: Hydrogeochemical
anomalies and the 1995 Kobe earthquake, Science, 269, 38–39,
1995.
Kuo, T., Fan, K., Kuochen, H., Han, Y., Chu, H., and Lee, Y.:
Anomalous decrease in groundwater radon before the Taiwan
M 6.8 Chengkung earthquake, J. Environ. Radioact., 88, 101–
106, 2006.
Linde, A. T. and Sacks, I. S.: Triggering of volcanic eruptions, Na-
ture, 395, 888–890, 1998.
Mollo, S., Tuccimei, P., Heap, M. J., Vinciguerra, S., Soligo, M.,
Castelluccio, M., Scarlato, P., and Dingwell, D. B.: Increase
in radon emission due to rock failure: An experimental study,
Geophys. Res. Lett., 38, L14304, doi:10.1029/2011GL047962,
2011a.
Mollo, S., Vinciguerra, S., Iezzi, G., Iarocci, A., Scarlato, P., Heap,
M. J., and Dingwell, D. B.: Volcanic edifice weakening via de-
volatilization reactions, Geophys. J. Int., 186, 1073–1077, 2011b.
Mollo, S., Heap, M. J., Iezzi, G., Hess, K.-U., Scarlato, P., and
Dingwell D. B.: Volcanic edifice weakening via decarbona-
tion: a self-limiting process?, Geophys. Res. Lett., 39, L15307,
doi:10.1029/2012GL052613, 2012.
Mollo, S., Heap, M. J., Dingwell, D. B., Hess, K.-U., Iezzi, G., Ma-
sotta, M., Scarlato, P., and Vinciguerra, S.: Decarbonation and
thermal microcracking under magmatic P–T –fCO2 conditions:
the role of skarn substrata in promoting volcanic instability, Geo-
phys. J. Int., 195, 369–380, 2013.
Roca, V., De Felice, P., Esposito, A. M., Pugliese, M., Sabarrese, C.,
and Vaupotich, J.: The influence of environmental parameters in
electrostatic cell radon monitor response, Appl. Radiat. Isotopes,
61, 243–247, doi:10.1016/j.apradiso.2004.03.053, 2004.
Rodriguez-Navarro, C., Kudlacz, K., and Ruiz-Agudo, E.: The
mechanism of thermal decomposition of dolomite: New insights
from 2D-XRD and TEM analyses, Amer. Min., 97, 38–51, 2012.
Roeloffs, E.: Earth science: Radon and rock deformation, Nature,
399, 104–105, 1999.
Sengupta, D., Ghosh, A., and Mamtani, M. A.: Radioactivity studies
along fracture zones in areas around Galudih, East Singhbhum,
Jharkhand, India, Appl. Radiat. Isot., 63, 409–414, 2005.
Scarlato, P., Tuccimei, P., Mollo, S., Soligo, M., and Castelluc-
cio, M.: Contrasting radon background levels in volcanic set-
tings: Clues from 220Rn activity concentrations measured dur-
ing long-term deformation experiments, Bull. Volcanol., 75, 751,
doi:10.1007/s00445-013-0751-0, 2013.
Scholz, C. H.: Mechanism of creep in brittle rock, J. Geophys. Res.,
73, 3295–3302, 1968.
Steinitz, G., Begin, Z. B., and Gazit-Yaari, N.: Statistically signif-
icant relation between radon flux and weak earthquakes in the
Dead Sea rift valley, Geology, 31, 505–508, 2003.
Stranden, E., Kolstad, A. K., and Lind, B.: Radon exhalation: mois-
ture and temperature dependence, Health Phys., 47, 480–484,
1984.
Trippetta, F., Collettini, C., Meredith, P. G., and Vinciguerra, S.:
Evolution of the elastic moduli of seismogenic Triassic Evapor-
ites subjected to cyclic stressing, Tectonophys, 592, 67–79, 2013.
Trique, M., Richon, P., Perrier, F., Avouac, J. P., and Sabroux, J.
C.: Radon emanation and electric potential variations associ-
ated with transient deformation near reservoir lakes, Nature, 399,
137–141, 1999.
Tsunogai, U. and Wakita, H.: Precursory chemical changes in
ground water: Kobe earthquake, Japan, Science, 269, 61–63,
1995.
Tuccimei, P., Moroni, M., and Norcia, D.: Simultaneous determi-
nation of 222Rn and 220Rn exhalation rates from building ma-
terials used in Central Italy with accumulation chambers and a
continuous solid state alpha detector: Influence of particle size,
humidity and precursors concentration, Appl. Radiat. Isotopes,
64, 254–263, 2006.
Tuccimei, P., Castelluccio, M., Soligo, M., and Moroni: M., Radon
exhalation rates of building materials: Experimental, Analytical
protocol and classification criteria, in: Building Materials: Prop-
erties, Performance and Applications, edited by: Cornejo, D. N.
and Haro, J. L., Nova Sci., Hauppauge, NY, 259–273, 2009.
Tuccimei, P., Mollo, S., Vinciguerra, S., Castelluccio, M., and
Soligo, M.: Radon and thoron emission from lithophysae-rich
tuff under increasing deformation: An experimental study, Geo-
phys. Res. Lett., 37, L05305, doi:10.1029/2009GL042134, 2010.
Tuccimei, P., Castelluccio, M., Moretti, S., Mollo, S., Vinciguerra,
S., and Scarlato, P.: Thermal enhancement of radon emission
from geological materials. Implications for laboratory exper-
iments on rocks under increasing deformation, in: Horizons
in Earth Science Research, vol. 4, edited by: Veress, B. and
Szigethy, J., Nova Sci., Hauppauge, NY, 247–256, 2011.
Wakita, H., Nakamura, Y., Notsu, K., Noguchi, M., and Asada, T.:
Radon anomaly: A possible precursor of the 1978 Izu-Oshima-
Kinkai earthquake, Science, 207, 882–883, 1980.
Wawersik, W. R.: Time-dependent rock behavior in uniaxial com-
pression, in: Proceedings of 14th Symp. Rock Mech., Penn. State
Univ., University Park, Pa, USA, 85–106, 1972.
Wiegand, J.: A guideline for the evaluation of the soil radon poten-
tial based on geogenic and anthropogenic parameters, Environ.
Geol., 40, 949–963, 2001.
www.geosci-instrum-method-data-syst.net/4/111/2015/ Geosci. Instrum. Method. Data Syst., 4, 111–119, 2015