
Real-Time Processing Strategies - Leica...
9
Study of Improved Observation Modeling for Surveying Type Applications in Multipath Environment Bernhard Richter Hans-Jürgen Euler September 2001 Published in ION GPS 2001 Proceedings Salt Lake City, Utah, September 11–14, 2001 Real-Time Processing Strategies
Transcript of Real-Time Processing Strategies - Leica...

S
R
eal-Time Processing Strategiestudy of Improved Observation Modelingfor Surveying Type Applications
in Multipath Environment
Bernhard RichterHans-Jürgen Euler
September 2001
Published in ION GPS 2001 ProceedingsSalt Lake City, Utah, September 11–14, 2001

2
Study of Improved Observation Modeling forSurveying Type Applications in Multipath
EnvironmentB. Richter, H.-J. Euler, Leica Geosystems AG, Switzerland
ABSTRACT
Besides ionospheric and tropospheric effects, multipathand diffraction are the factors which can most limit theaccuracy of real-time applications. Phase observationscontaminated by diffraction may have unwanted effects inkinematic applications and this would limit the suitabilityof monitoring systems based on GPS as well as pure GPSsurveying real-time applications.
The concept of a self-calibrating weighting model is pre-sented which can be used to weight down or completelyeliminate poor signals from processing. The Signal-to-Noise ratio (SNR) is highly correlated with signals con-taminated by diffraction. The problem with using the SNRfor the weighting model is that the SNR is dependent onthe setup, which means that different receiver/antennacombinations and cables with varying resistances showdifferent elevation dependent SNR patterns. Even a differ-ent location would have an influence on this pattern.
For real-time applications it is therefore necessary toautomatically calibrate a weighting model, which is basedon the SNR. Our paper describes the advantages of such aself-calibrating weighting model compared to purely ele-vation dependent weighting models. The efficiency of theused model is demonstrated for a kinematic real-timeapplication as well as for a typical static survey. Thekinematic test was conducted on the world’s largest sus-pension bridge in Hong Kong. Such monitoring applica-tions, where the place of mounting a GPS-antenna is al-most given, benefit strongly from this approach.
INTRODUCTION
GPS is becoming a standard measurement tool for both alarge number of standard surveying applications andmonitoring applications. Independence of visibility re-
quirements and the ability of GPS to work under severeweather are often reasons to use GPS in preference tosystems involving theodolites. GPS positioning accuracyis well understood in the user community and only inlocations with limited sky view a degradation is expected.Some of the degradations might be the result of signaldiffraction. Signal diffraction is an expression for an ob-structed satellite where the signal is not completelymasked and can still be tracked by the receiver.
Diffracted signals usually show higher residuals, becausethe signal’s travel path is extended compared to the directsignal path. Therefore, a purely elevation dependentweighting model does not represent the stochastic modelproperly. Diffraction weakens the GPS signals, indicatedby lower SNRs. This indicator can be used in an improvedweighting model. SNRs represent the power of a satellitesignal and are measured for L1&L2 independently. Thehigher this ratio, the better the receiver will perform inrapid static and kinematic applications, Nolan et al.(1992). The SNR translates directly into how long thereceiver needs to integrate or average, e.g., the time ittakes for the tracking loops to match the incoming signal.If the SNR of one receiver would be 10 times larger com-pared to another receiver, this would mean that the timefor integration or averaging is reduced by 90 per cent.
Under ideal conditions the SNR plotted over elevationangles unveil the strong correlation between both. A pureelevation dependent weighting model might be interpretedas a different way of using a SNR dependent weightingmodel. In the case of a distorted SNR elevation correla-tion, simple elevation dependent models are no longerappropriate. The benefit of using mixed weighting modelsenhanced with an SNR dependency is already shown byBrunner et al (1999), where the so-called SIGMA-DELTAmodel has been presented. The basic information of theSIGMA-DELTA model is the SNR, but additionally thedifference between a template and the actual SNR is takeninto account. This means for a certain elevation angle, a

3
certain SNR will be expected. The expected true SNRs arerepresented by a template, usually described by a polyno-mial of degree 2 or by the envelope of the values. How-ever, if the actual value deviates from the expected valueby ∆, the observation will be further down-weighted.Equation 1 describes how the variances of phase observa-tions for the SIGMA-DELTA model are derived. Thefactor Ci consists of the carrier loop noise band-width anda conversion term from cycle2 to mm2. The factor alphahas been included to equation 1 to allow empirical scalingof the effect of ∆.
10/)(2 10 ∆⋅−−∆ ⋅= ασ measuredSNR
iC (1)
The above-mentioned relationship between the elevationangle and the SNR is illustrated in figure 1. The outlinedactual measurement deviates from the expected value by∆.
Fig. 1. SNR characteristics of the Leica AT504 choke ringantenna.
To make use of the advantages of the SIGMA-DELTAweighting model for real-time applications as well as forpost-processing applications, templates would be neces-sary for each antenna/receiver combination. But there aremore aggravating factors, which make it difficult to pro-vide standard templates for different antenna/receivercombinations. It is not only the antenna and the combina-tion of antenna/receiver which influences the SNR char-acteristics, but even the attenuation of the coaxial cablebetween the antenna and receiver effects the SNR pat-terns. The relationship between antenna, cable and sensoris described in the next section. Apart from hardwarespecific parameters the location where the antenna ismounted can also influence the SNR patterns. Similar toantenna phase center (PCV) correction files, which areneeded to model the phase center variations, the templateinformation of the SNR characteristics would have to beavailable on the sensor for all used antennas. This wouldresult in an additional logistic effort on the manufacturer’sside as well as a deep technical understanding on the cus-tomer’s side.
The handling of the whole equipment would become quitecomplicated, if all these factors had to be observed. Inorder to keep the use of real-time GPS for surveying typeapplications as simple as they are today, but neverthelessprofit from an advanced weighting model, a study of animproved observation modeling was carried out. Two self-calibrating models will be described, which automaticallyadjust the SNR templates according to the antenna-receiver setup and according to the predominant condi-tions on the chosen location.
ATTENUATION EFFECTS
NOISE FIGURE OF THE ENTIRE SYSTEM
Apart from multipath, the total noise figure of the wholesystem determines the amount of noise being added to theincoming signal. If the signal strength is expressed in dBthere is a simple relationship between the signal strengthof the incoming signal and the total noise figure of thesystem, which is obtained by simply subtracting thosefigures. Figure 2 illustrates how the noise figure can beused to calculate the SNR at the output port from the noisefigure and the SNR at the input port.
Fig. 2. Noise figure example
The total noise figure of the system NFtotal itself comprisesof the noise figure of the antenna NFAnt and the noisefigure of the sensor NFSR divided by the antenna gain GAnt.Figure 3 and equation 2 illustrate this relationship.
Fig. 3. Second stage noise figure
Ant
SRAnttotal G
NFNFNF
1−+= (2)
(SNR)in = 10 dB (SNR) = 7 dB
NFtotal = 3 dBTS = 290K
NFSR
Antenna Sensor
NFAnt, GAnt
Second Stage
SignalSource
0 10 20 30 40 50 60 70 80 9034
36
38
40
42
44
46
48
50
52L1-Template Leica AT504
Elevation [deg]
dBH
z
∆∆∆∆====

4
INFLUENCE OF THE ANTENNA CABLE
As mentioned in the introduction even the cable lengthmay influence the SNR measured by the sensor. The gen-eral understanding that the resistance of the antenna cableattenuates the actual GPS-signal and the noise by the sameamount and therefore does not influence the derived SNRis only true to a certain extent. The impedance of the an-tenna cable directly influences the gain at the sensor input.A small overall gain value results in a higher influence ofthe noise figure of the sensor and consequently the totalnoise figure of the system is increased. Figure 4 illustratesthe attenuation in dependence on frequency of a com-monly used RG223 antenna cable. The unit of the at-tenuation in this figure is dB/100m. To derive the attenua-tion e.g. for a 10m cable, the value of the table has simplyto be divided by 10, because of the linear relationshipbetween attenuation and cable length.
Fig. 4. Attenuation values of a double screened antennacable (RG 223) at 20°C.
Fig. 5. SNR scatter diagram with a 1.5m antenna cableand with a 30m antenna cable.
The derived SNR in the sensor does not exactly follow thelinear behavior of equation 1. Providing the gain at thesensor input is above a certain value (dependent on the
receiver), there will be little difference seen in the SNRswhen using different antenna cables with different at-tenuation characteristics. But if the gain at the receiverinput is low, long antenna cables will influence the de-rived SNR by almost 1:1. This means that at a certain gainlevel a further attenuation of 1dB from the cable will ad-ditionally influence the SNR by 1dB. Such behavior isillustrated by figure 5, where the SNR scatter diagram of a30m long antenna cable with high attenuation is plottedversus a 1.5m long antenna cable. As clearly seen in fig-ure 5, one rigid SNR template used for all setups cannotcover all combinations.
IMPROVED STOCHASTIC MODELING
THE WEIGHTING MODEL
Observations at low elevations are much more corruptedby tropospheric and ionospheric refraction and multipatheffects than those at high elevations. The systematic errorswhich cannot be modeled increase the root mean squarevalue of the GPS-processing. In order to optimize theusage of low-elevation observations, elevation dependentweighting of the observations has become a standard in allreal-time and post-processing software packages.
The improved weighting model, worked out for this study,is a combination between Leica’s standard elevation de-pendent weighting model and the use of the difference ∆between the expected true SNR and the actual SNR. Thequestion arises how to combine the elevation dependentweighting model with the information ∆. Empirical testsresulted in an exponential relationship between phasevariance and SNR. This exponential relationship betweenSNRs and the residuals of a diffracted satellite can be seenin figure 6. The exponential relationship is described indetail by e.g. Ward (1996).
Fig. 6. Example of the relationship between L1-phaseresiduals of a diffracted satellite and the SNR.
[ ]222 )F( ∆⋅⋅= ασσ zoi(3)
10 20 40 70 100 200 400 7001000 2000 40001
2
4
710
20
40
70100
200300
Attenuation
Frequency [MHz]
Atte
nuat
ion
[dB/
100
m]
32 34 36 38 40 42 44 46 48-0.1
0
0.1
0.2
0.3
0.4
0.5
0.6
0.7
0.8Double difference L1-phase residuals
Signal-to-Noise ratio [dBHz]
Cyc
les
0 10 20 30 40 50 60 70 80 9036
38
40
42
44
46
48
50
52L1-Template
Elevation [deg]
dBHz
1.5m cable30m cable

5
Equation 3 describes how the a priori standard deviationsare derived in our studies. The term F(z) stands for Leica’sstandard elevation dependent weighting model, where z isthe zenith angle. The factor α is a scale factor less orequal to one and ∆ is the difference between the measuredSNR and the template value at the appropriate satelliteelevation. In addition to the weighting function, a limit ofthe maximum allowed difference ∆ between the actualSNR and the template value can be set. If the computedvalue ∆ of a certain observation exceeds this limit, thisobservation will not be used for processing.
AUTOMATIC CALIBRATION OF TEMPLATES
Returning to the problem that the correct template for thecorresponding antenna-receiver combination has to beavailable to make use of the benefits of our modifiedweighting model. As mentioned in the introduction, thisproblem would be similar to the problem of providing thecorrect PCV calibration files for the antennas. Althoughthe matching of all standard antennas is done automati-cally in Leica’s post processing software SKI-Pro andPCV-files can be downloaded from the internet and di-rectly imported into SKI-Pro, Leica has found many errorsare still made by the user. The automated generation oradjustment of an SNR template during processing is theonly way to avoid complication on the user’s side, whowould otherwise have to ensure that the correct template isprovided. As may be imagined the additional logisticeffort of providing templates for a weighting model for allpossible antenna/receiver combinations would be hugeand is the main reason that similar weighting models havenot yet been implemented in commercial GPS processingsoftware packages.
Fig. 7. SNR characteristics of the Leica AT502 antenna.
To point out the differences of templates of various an-tenna models we compare the scatter diagram of figure 1with the scatter diagram of figure 7. A distinct differencecan be recognized in the slope of the template, but also thepoints at which the signal strengths become almost con-stant vary. Looking at only these two examples we experi-ence, again, that only one standard template would not
fulfill the needs for the self-calibrating SNR weightingmodel. In the next two sections two different approachesare described which show how templates are generated.
Template generation – Method IAssuming that a sufficient amount of data has been col-lected, a purely statistical method can be implemented.The generation of the template is done in discrete steps,by counting the number of SNR measurements falling intoa certain signal strength interval. This is done for eachelevation interval at an interval width of a few degrees.The interval width can be adjusted. Figure 8 illustrates thecounted SNR measurements for elevation angles between30° and 35°. As to be expected, the majority of counts areconcentrating on some classes where the most, presuma-bly good, observations were collected. Observations withSNR values further away from this cluster, one wouldwant to down-weight or even exclude in the data proc-essing, since these observations will probably show higherdeviation from the truth. To derive the representativeSNR, used as the template value during the calculationslater, for such an interval, the median count value of allSNRs within the defined interval plus an additional cor-rection is computed (see figure 9).
Fig. 8. Example of a statistic of all measured SNRs ofsatellites between 30 and 35 degrees.
Fig. 9. Example of a template derived with method I.
0 10 20 30 40 50 60 70 80 9030
35
40
45
50
55L1-Template Leica AT502
Elevation [deg]
dBH
z
0 10 20 30 40 50 60 70 80 9038
40
42
44
46
48
50
52SNR scatter diagram - Leica AT502
Elevation [deg]
dBH
z
0
500
1000
1500
2000
2500
1 2 3 4 5 6 7 8 9 10 11
dBHz
Num
ber
41 46 45 44 43 42 47 51 50 49 48

6
During the actual calculations when an enhanced SNRweighting model is used, an observed SNR value wouldbe compared with the derived template value in a particu-lar elevation range. The difference between both is usedthen in the weighting model described in equation 3.
The method works perfectly as long as the majority ofSNR values in all elevation classes are those for uncor-rupted observations. This can be ensured when long ob-servation intervals are being analyzed in post-processingor when the system was running already several hours forreal-time. If not enough data is available, one problem ofmethod I will become obvious. As long as information hasonly been collected for a certain elevation angle classfrom a diffracted satellite, the template value will reflectthis diffraction. A weighting model based on that infor-mation would not down-weight the diffracted observationsduring processing. In some situations it may even amplifythe influences of diffracted observations by down-weighting undisturbed observations.
For method I it is crucial to provide sufficient data over along period, so that the template values would no longerchange. This is clearly a disadvantage of method I and,therefore, it is more practicable for post-processing andonly if a sufficient coverage of the sky is provided duringthe survey.
Template generation – Method IIThe approach of using the median values for defined ele-vation intervals turned out to be not applicable for real-time surveying applications. Because GPS post-processingseems to be a dying breed for pure surveying applications,post-processing will often only be used if the real-timeradio link fails. One requirement for these studies was todevelop a model which is also appropriate for real-timeapplications.
Independent of the antenna/receiver combination, all SNRpatterns show the same characteristic. Up to a certainpoint - the point of inflection - the SNR follows a linearcurve with a positive gradient. Elevation angles largerthan the point of inflection show ideally constant values.Method II is based on the observation that all analyzedSNR/elevation patterns show similar shapes for templatevalues within the same antenna type models. Under theassumption that the principle shape of the SNR/elevationpattern does not change, a different approach can be usedfor the generation of a template. We describe a character-istic master template for every antenna type model by twostraight lines. One line has a positive gradient and theother line is horizontal. The master template needs to beadjusted for representing the actual SNR data by findingsuitable coefficients of these two straight lines. One waywould be, for instance, to use a least-squares adjustmentin conjunction with the statistical table generated as inmethod I. However, to avoid outliers having too muchinfluence on the derived template this approach is notrecommended, especially when a considerable amount of
data is corrupted. The median of the residuals between themaster template and the statistical table as produced formethod I is calculated and the master template is shiftedby this amount to reflect the actual conditions.
With this approach the amount of data being necessary toderive a template is significantly reduced and already aftera few epochs of data, a representative template can begenerated. Predefining the slope and the elevation angle ofthe point of inflection for different antenna types is ad-vantageous for short observations, especially when dif-fracted signals would influence the gradient of the tem-plate.
For static surveys all SNRs of all satellites are retainedand used to generate the template. Over time the valueswould approximately converge to template values as be-ing derived with method I. For kinematic applications a socalled ring buffer is advantageous. Such a ring bufferstores the relevant SNR information only for a certainperiod of time and permanently updates the template.
TEST RESULTS
KINEMATIC TESTS ON TSING MA BRIDGE
Hong Kong’s Tsing Ma Bridge (see figure 10) is theworld’s largest span suspension bridge with 1,377 metersacross the Ma Wan shipping channel. A real-time kine-matic GPS monitoring system was installed to provide thecentimeter-level accuracy to detect bridge movementsbeyond normal ranges, Wong (2001).
Fig. 10. Tsing Ma Bridge (Hong Kong)
The trigger for the studies to integrate the SNR depend-ency in Leica’s weighting model function was the analysisof problematic data of this monitoring application. Alwaysat the same time of the day peaks in the height compo-nents were noticed. These peaks are highly correlated withan abnormal decrease (figure 11) of the signal strength ofone satellite in each case. One example of these unex-pected drops in the SNR is given by figure 11.

7
Fig. 11. Example of an abnormal decrease of the signalstrength of satellite 11.
The correlation between double difference L1-phase re-siduals and the measured SNRs is illustrated by figure 12.The double difference L1-phase residuals are computedwith reference to satellite 2, a satellite with a large eleva-tion angle. The extremely high and unexpected drop in thesignal strength of satellite 11 coincides with an increase ofthe residuals of satellite 11. Satellite 11 has still a rela-tively moderate elevation angle of more than 20 degreeswhen the satellite signal is distorted and the SNR immedi-ately goes down. According to the template the signalstrength should be about 46dBHz at an elevation angle of20° in an undisturbed environment.
The benefit of using the enhanced SNR weighting model,which reflects the stochastic of the observations muchbetter, can be clearly seen in figure 13. The top row offigure 13 was created by using a standard processingscheme without an additional phase check. By using theenhanced SNR weighting model the observations of thediffracted satellite PRN 11 are down-weighted and theimproved result is illustrated by the middle row of figure13. To generate the SNR template method II was used,which has been explained in the previous section. Ifmethod I were applied, exactly the same results would beproduced provided there is enough information to generatean appropriate template. In this case about one hour ofdata would be necessary to have a sufficient coverage ofthe sky. For processing, the scale factor α in equation 3was set to 1.1 and the maximum deviation from the tem-plate value to eliminate single satellites was 5dBHz. Thediffraction effect on the height component is completelyremoved and additionally the a posteriori rms is reducedfrom 3.1mm to 2.9mm. The diffraction effect on horizon-tal components is in most cases not as severe. In additionto the improvement of the positioning accuracy, the ambi-guity fixing process is considerably supported, if the sto-chastic model fits the truth more realistically.
The bottom row of figure 13 shows the height componentover a period of nine hours. The light-gray curve is com-puted by using the standard elevation dependent weightingmodel and the black curve is derived by using the en-hanced SNR weighting model. Every time a satellite
comes close to an area between 23 and 25 degrees ofelevation and between 38 and 40 degrees of azimuth,peaks repeatedly appear in the height component in thelight-gray curve, whereas the black curve is not influencedby these diffraction effects. It is important here to distin-guish between multipath and diffraction, where the effectsanalyzed here are diffraction effects and not caused bymultipath.
Fig. 12. Correlation between double difference L1-phaseresiduals of a diffracted satellite and the SNRs of the samesatellite.
Fig. 13. Top row Standard elevation dependent weighting.Middle row Improved weighting model. Bottom row Ele-vation dependent weighting model versus improvedweighting model over a period of nine hours.
It has to be noted, pseudorange multipath and carrierphase multipath behave very much the same, except thatthe variation of the pseudorange multipath is in phase withthe variation of the SNR variations whereas for the carrierphase multipath there is a phase shift of π/2, Braasch(1996). A phase shift of π/2 cannot be recognized in theexample data and is an indication that multipath is not thereason for the peaks in height. Furthermore, the enhancedSNR weighting model may have a counterproductiveeffect in the existence of true, pure phase multipath.
120 130 140 150 160 170 180-0.05
0
0.05
0.1
0.15Double difference L1-phase residuals
m120 130 140 150 160 170 180
30
35
40
45
50
55SNR scatter diagram
time [min]dB
Hz
PRN 11
PRN 11
PRN 4, 7, 8, 20
PRN 4, 7, 8, 20
0 10 20 30 40 50 60 70 80 9032
34
36
38
40
42
44
46
48
50
52SNR scatter diagram
Elevation [deg]
dBH
z
PRN 11
PRN 2, 8, 20, 27
120 130 140 150 160 170 180207.4
207.45
207.5
207.55Height components
m
120 130 140 150 160 170 180207.4
207.45
207.5
207.55
m
0 60 120 180 240 300 360 420 480 540207.3
207.4
207.5
207.6
time [min]
m
8
STATIC TESTS
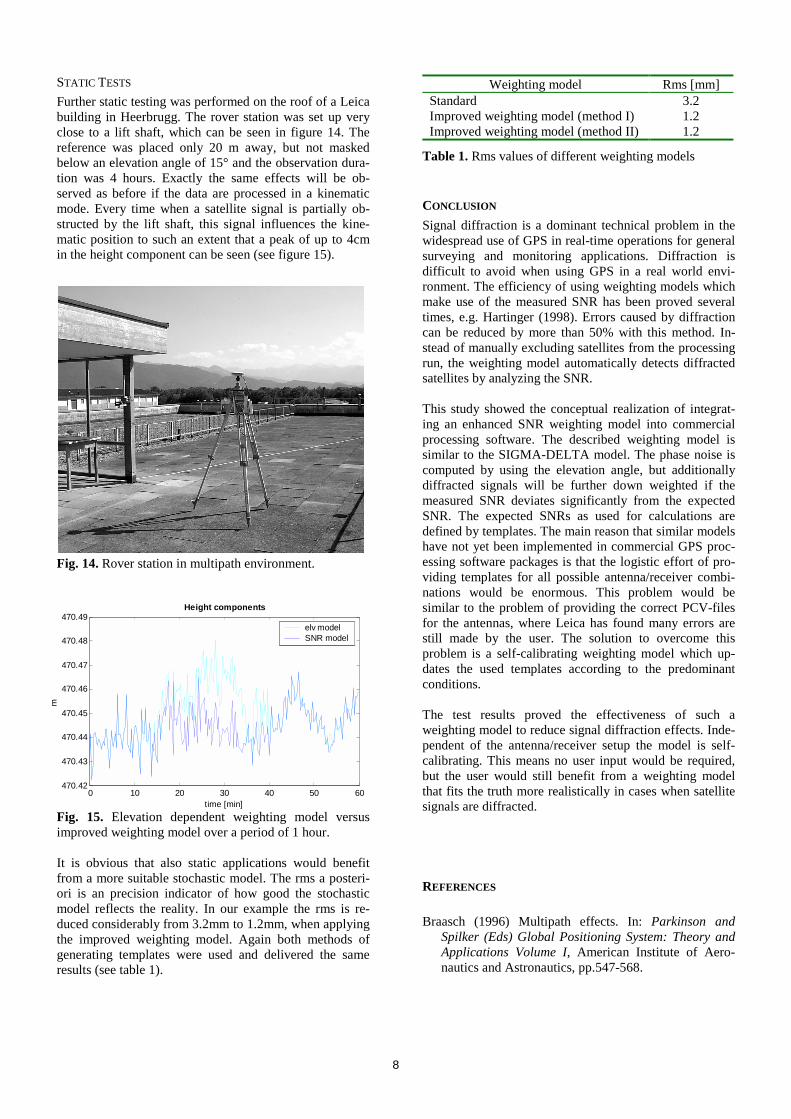
Further static testing was performed on the roof of a Leicabuilding in Heerbrugg. The rover station was set up veryclose to a lift shaft, which can be seen in figure 14. Thereference was placed only 20 m away, but not maskedbelow an elevation angle of 15° and the observation dura-tion was 4 hours. Exactly the same effects will be ob-served as before if the data are processed in a kinematicmode. Every time when a satellite signal is partially ob-structed by the lift shaft, this signal influences the kine-matic position to such an extent that a peak of up to 4cmin the height component can be seen (see figure 15).
Fig. 14. Rover station in multipath environment.
Fig. 15. Elevation dependent weighting model versusimproved weighting model over a period of 1 hour.
It is obvious that also static applications would benefitfrom a more suitable stochastic model. The rms a posteri-ori is an precision indicator of how good the stochasticmodel reflects the reality. In our example the rms is re-duced considerably from 3.2mm to 1.2mm, when applyingthe improved weighting model. Again both methods ofgenerating templates were used and delivered the sameresults (see table 1).
Weighting model Rms [mm]Standard 3.2Improved weighting model (method I) 1.2Improved weighting model (method II) 1.2
Table 1. Rms values of different weighting models
CONCLUSION
Signal diffraction is a dominant technical problem in thewidespread use of GPS in real-time operations for generalsurveying and monitoring applications. Diffraction isdifficult to avoid when using GPS in a real world envi-ronment. The efficiency of using weighting models whichmake use of the measured SNR has been proved severaltimes, e.g. Hartinger (1998). Errors caused by diffractioncan be reduced by more than 50% with this method. In-stead of manually excluding satellites from the processingrun, the weighting model automatically detects diffractedsatellites by analyzing the SNR.
This study showed the conceptual realization of integrat-ing an enhanced SNR weighting model into commercialprocessing software. The described weighting model issimilar to the SIGMA-DELTA model. The phase noise iscomputed by using the elevation angle, but additionallydiffracted signals will be further down weighted if themeasured SNR deviates significantly from the expectedSNR. The expected SNRs as used for calculations aredefined by templates. The main reason that similar modelshave not yet been implemented in commercial GPS proc-essing software packages is that the logistic effort of pro-viding templates for all possible antenna/receiver combi-nations would be enormous. This problem would besimilar to the problem of providing the correct PCV-filesfor the antennas, where Leica has found many errors arestill made by the user. The solution to overcome thisproblem is a self-calibrating weighting model which up-dates the used templates according to the predominantconditions.
The test results proved the effectiveness of such aweighting model to reduce signal diffraction effects. Inde-pendent of the antenna/receiver setup the model is self-calibrating. This means no user input would be required,but the user would still benefit from a weighting modelthat fits the truth more realistically in cases when satellitesignals are diffracted.
REFERENCES
Braasch (1996) Multipath effects. In: Parkinson andSpilker (Eds) Global Positioning System: Theory andApplications Volume I, American Institute of Aero-nautics and Astronautics, pp.547-568.
0 10 20 30 40 50 60470.42
470.43
470.44
470.45
470.46
470.47
470.48
470.49Height components
time [min]
m
elv modelSNR model

9
Brunner, F.K., Hartinger, H., and Troyer, L. (1999). GPSSignal Diffraction Modelling: the stochastic SIGMA-∆Model. Journal of Geodesy, 73, pp. 259-267
Hartinger, H., Brunner, F.K. (1998). Variances of GPSphase observations: The SIGMA-ε model. GPS Solu-tions, 2/4, pp. 35-43
Leick, A. (1994). Satellite Surveying. 2nd Edition, NewYork
Meinke, H.H., Grundlach, F.W. (1992). Taschenbuch derHochfrequenztechnik. Grundlagen, Komponenten,Systeme, Springer, Berlin
Nolan, J., Gourevitch, S., Ladd, J. (1992). Geodetic proc-essing using full dual band observables. In: Proc. ION-GPS-92, pp. 1033-1041
Ward, P. (1996). Satellite signal acquisition and tracking.In: Kaplan ED Understanding GPS: principles andapplications. Artech House, Bosten, pp. 119-208
Wieser, A., Brunner, F.K. (2001). Robust estimation ap-plied to correlated GPS phase observations. In: Proc.1st International Symposium on Robust Statistics andFuzzy Techniques in Geodesy and GIS, Zürich, pp193-198
Wong K., Man K., Chan W. (2001), Monitoring HongKong’s Bridges – Real-Time Kinematic Spans theGap. GPS World, Vol. 12, No. 7, pp. 10-18


