Real-Time Mobile Teleophthalmology for the Detection of ...
14
University of Texas Rio Grande Valley University of Texas Rio Grande Valley ScholarWorks @ UTRGV ScholarWorks @ UTRGV School of Medicine Publications and Presentations School of Medicine 10-2021 Real-Time Mobile Teleophthalmology for the Detection of Eye Real-Time Mobile Teleophthalmology for the Detection of Eye Disease in Minorities and Low Socioeconomics At-Risk Disease in Minorities and Low Socioeconomics At-Risk Populations Populations Lama A. Al-Aswad New York University School of Medicine Cansu Yuksel Elgin Vipul Patel Deborah Popplewell Kalashree Gopal See next page for additional authors Follow this and additional works at: https://scholarworks.utrgv.edu/som_pub Digital Commons Network Logo Part of the Health Information Technology Commons, and the Ophthalmology Commons Recommended Citation Recommended Citation Al-Aswad, L. A., Elgin, C. Y., Patel, V., Popplewell, D., Gopal, K., Gong, D., Thomas, Z., Joiner, D., Chu, C. K., Walters, S., Ramachandran, M., Kapoor, R., Rodriguez, M., Alcantara-Castillo, J., Maestre, G. E., Lee, J. H., & Moazami, G. (2021). Real-Time Mobile Teleophthalmology for the Detection of Eye Disease in Minorities and Low Socioeconomics At-Risk Populations. Asia-Pacific journal of ophthalmology (Philadelphia, Pa.), 10(5), 461–472. https://doi.org/10.1097/APO.0000000000000416 This Article is brought to you for free and open access by the School of Medicine at ScholarWorks @ UTRGV. It has been accepted for inclusion in School of Medicine Publications and Presentations by an authorized administrator of ScholarWorks @ UTRGV. For more information, please contact [email protected], william.fl[email protected].
Transcript of Real-Time Mobile Teleophthalmology for the Detection of ...

University of Texas Rio Grande Valley University of Texas Rio Grande Valley
ScholarWorks @ UTRGV ScholarWorks @ UTRGV
School of Medicine Publications and Presentations School of Medicine
10-2021
Real-Time Mobile Teleophthalmology for the Detection of Eye Real-Time Mobile Teleophthalmology for the Detection of Eye
Disease in Minorities and Low Socioeconomics At-Risk Disease in Minorities and Low Socioeconomics At-Risk
Populations Populations
Lama A. Al-Aswad New York University School of Medicine
Cansu Yuksel Elgin
Vipul Patel
Deborah Popplewell
Kalashree Gopal
See next page for additional authors
Follow this and additional works at: https://scholarworks.utrgv.edu/som_pub
Digital
Commons
Network
Logo
Part of the Health Information Technology Commons, and the Ophthalmology Commons
Recommended Citation Recommended Citation Al-Aswad, L. A., Elgin, C. Y., Patel, V., Popplewell, D., Gopal, K., Gong, D., Thomas, Z., Joiner, D., Chu, C. K., Walters, S., Ramachandran, M., Kapoor, R., Rodriguez, M., Alcantara-Castillo, J., Maestre, G. E., Lee, J. H., & Moazami, G. (2021). Real-Time Mobile Teleophthalmology for the Detection of Eye Disease in Minorities and Low Socioeconomics At-Risk Populations. Asia-Pacific journal of ophthalmology (Philadelphia, Pa.), 10(5), 461–472. https://doi.org/10.1097/APO.0000000000000416
This Article is brought to you for free and open access by the School of Medicine at ScholarWorks @ UTRGV. It has been accepted for inclusion in School of Medicine Publications and Presentations by an authorized administrator of ScholarWorks @ UTRGV. For more information, please contact [email protected], [email protected].

Authors Authors Lama A. Al-Aswad, Cansu Yuksel Elgin, Vipul Patel, Deborah Popplewell, Kalashree Gopal, Dan Gong, Zach Thomas, Devon Joiner, Cha-Kai Chu, and Gladys E. Maestre
This article is available at ScholarWorks @ UTRGV: https://scholarworks.utrgv.edu/som_pub/422

Dow
nloadedfrom
http://journals.lww.com
/apjooby
BhDMf5ePH
Kav1zEoum1tQ
fN4a+kJLhEZgbsIH
o4XMi0hC
ywCX1AW
nYQp/IlQ
rHD3i3D
0OdR
yi7TvSFl4Cf3VC
1y0abggQZXdtw
nfKZBYtws=
on10/04/2021
Downloadedfromhttp://journals.lww.com/apjoobyBhDMf5ePHKav1zEoum1tQfN4a+kJLhEZgbsIHo4XMi0hCywCX1AWnYQp/IlQrHD3i3D0OdRyi7TvSFl4Cf3VC1y0abggQZXdtwnfKZBYtws=on10/04/2021
Real-Time Mobile Teleophthalmology for the Detection of EyeDisease in Minorities and Low Socioeconomics At-Risk Populations
Lama A. Al-Aswad, MD, MPH�, Cansu Yuksel Elgin, MD�, Vipul Patel�, Deborah Popplewell, ODy,Kalashree Gopal, BAy, Dan Gong, MDy, Zach Thomas, BSy, Devon Joiner, BM, MMy,
Cha-Kai Chu, MDy, Stephen Walters, MDy, Maya Ramachandran, BAy, Rahul Kapoor, MDy,Maribel Rodriguez, MD, Jennifer Alcantara-Castillo, BA, COA�, Gladys E. Maestre, MD, PhDz,
Joseph H. Lee, DrPHy, and Golnaz Moazami, MDy
Purpose: To examine the benefits and feasibility of a mobile, real-time,
community-based, teleophthalmology program for detecting eye diseases
in the New York metro area.
Design: Single site, nonrandomized, cross-sectional, teleophthalmologic
study.
Methods: Participants underwent a comprehensive evaluation in a Wi-
Fi–equipped teleophthalmology mobile unit. The evaluation consisted of
a basic anamnesis with a questionnaire form, brief systemic evaluations
and an ophthalmologic evaluation that included visual field, intraocular
pressure, pachymetry, anterior segment optical coherence tomography,
posterior segment optical coherence tomography, and nonmydriatic
fundus photography. The results were evaluated in real-time and fol-
low-up calls were scheduled to complete a secondary questionnaire form.
Risk factors were calculated for different types of ophthalmological
referrals.
Results: A total of 957 participants were screened. Out of 458 (48%)
participants that have been referred, 305 (32%) had glaucoma, 136 (14%)
had narrow-angle, 124 (13%) had cataract, 29 had (3%) diabetic retinop-
athy, 9 (1%) had macular degeneration, and 97 (10%) had other eye
disease findings. Significant risk factors for ophthalmological referral
consisted of older age, history of high blood pressure, diabetes mellitus,
Hemoglobin A1c measurement of �6.5, and stage 2 hypertension. As for
the ocular parameters, all but central corneal thickness were found to be
significant, including having an intraocular pressure>21 mm Hg, vertical
cup-to-disc ratio �0.5, visual field abnormalities, and retinal nerve fiber
layer thinning.
Conclusions: Mobile, real-time teleophthalmology is both workable and
effective in increasing access to care and identifying the most common
causes of blindness and their risk factors.
Key Words: access to care, diabetes and hypertension, leading causes of
blindness, synchronies video consultation, teleophthalmology
(Asia Pac J Ophthalmol (Phila) 2021;10:461–472)
R apid developments of telecommunication and information
technology in the last decade brought along a rising field of
medicine, that is, telehealth/telemedicine.1 Ophthalmology is a
specialty that lends itself well to the implementation of telemedi-
cine because interpretations of screenings are routinely used for
diagnosis and prognosis of several eye diseases.2 Even though
teleophthalmology began to develop in rural and remote areas
with the idea of facilitating health care services for underserved
populations, there is also a great need for it in both urban
communities and high-income regions.3,4 The COVID-19 pan-
demic has showed how much essential it is.5 Although tele-
ophthalmology is already accepted within the medical
community to improve eye care adherence and access, there is
still a great need for a teleophthalmologic protocol to detect the
most common eye diseases.
Although the field of eye care remains stable despite its
shortage of specialists, the growing population and the rise of old-
age population leads to an exponential increase in follow-up
visits, which indicates that the demand for teleophthalmology
will continue to increase in the near future.6,7 We believe that an
effective, economic, and comfortable screening way of teleoph-
thalmologic approach will be an inevitable means to reduce
hospital visits.
The objective of this pilot study is to examine the benefit and
feasibility of a real-time mobile teleophthalmology program for
screening of undetected eye diseases in the at-risk neighborhoods
of the metro area and provide an evaluation for this program. In
this program, vision test results were evaluated in real time and
remote consultation with an eye care professional was immedi-
ately available. Our team previously conducted urban-located,
community-based screenings with teleophthalmologic models to
better understand different systematic approaches.8,9 In the cur-
rent study, a real-time mobile teleophthalmology program was
designed in the northern Manhattan of New York City. In a
Submitted January 3, 2021; accepted May 21, 2021.From the �New York University (NYU) Grossman school of Medicine, NYU
Langone Health, NY, US; yColumbia University Medical Center, New York,NY, US; and zDepartment of Neuroscience, Department of Human Genetics,University of Texas Rio Grande Valley School of Medicine, Brownsville, TX,US
Meeting Poster Presentation: 2019 American Academy of Ophthalmology, AnnualMeeting.
This study was financially supported by Save Vision Foundation, Russell BerrieFoundation, Congressional Glaucoma Caucus Foundation, New World Medicaland Research to Prevent Blindness, New York, New York.
Lama A. Al-Aswad is a past president of the Save Vision Foundation and currentlya nonvoting member of the board.
Address correspondence and reprint requests to: Lama A. Al-Aswad, New YorkUniversity (NYU) Grossman school of Medicine, NYU Langone Eye Center,222 E 41ST, Suite 4-092, New York, NY 10017. E-mail: [email protected]
Copyright � 2021 Asia-Pacific Academy of Ophthalmology. Published by WoltersKluwer Health, Inc. on behalf of the Asia-Pacific Academy of Ophthalmology.This is an open access article distributed under the terms of the CreativeCommons Attribution-Non Commercial-No Derivatives License 4.0 (CCBY-NC-ND), where it is permissible to download and share the work provided it isproperly cited. The work cannot be changed in any way or used commerciallywithout permission from the journal.
ISSN: 2162-0989DOI: 10.1097/APO.0000000000000416
� 2021 Asia-Pacific Academy of Ophthalmology. https://journals.lww.com/apjoo | 461
ORIGINAL STUDY
previous study using data from surrounding neighborhoods of
northern Manhattan, both at fixed sites and in a mobile unit, it is
shown that 25% of 8547 participants screened were glaucoma
suspects, 15% were deemed to need further investigation of ocular
diseases other than glaucoma, and 57% had never seen an eye
doctor in their lifetime.8,10 These rates are highly motivating for
further teleophthalmologic studies, including the current paper, to
detect public health originated problems and modeling ideal
teleophthalmologic modalities which, we believe, constitute an
emergent need. For the current study, we hypothesized that people
living in northern Manhattan were at risk of undiagnosed eye
disease and that it would be worthwhile to make vision-evaluating
services more readily accessible to them.
METHODSThis study adhered to the tenets of the Declaration of
Helsinki and was approved by the Columbia University Institu-
tional Review Board.
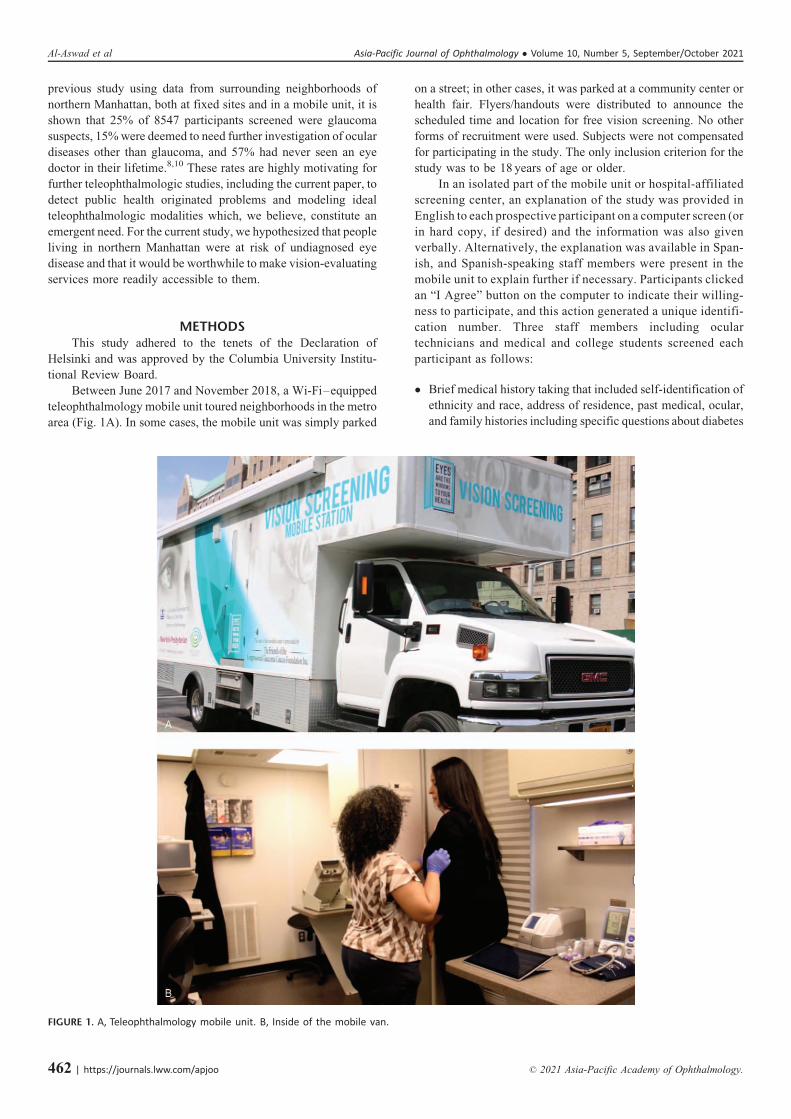
Between June 2017 and November 2018, a Wi-Fi–equipped
teleophthalmology mobile unit toured neighborhoods in the metro
area (Fig. 1A). In some cases, the mobile unit was simply parked
on a street; in other cases, it was parked at a community center or
health fair. Flyers/handouts were distributed to announce the
scheduled time and location for free vision screening. No other
forms of recruitment were used. Subjects were not compensated
for participating in the study. The only inclusion criterion for the
study was to be 18 years of age or older.
In an isolated part of the mobile unit or hospital-affiliated
screening center, an explanation of the study was provided in
English to each prospective participant on a computer screen (or
in hard copy, if desired) and the information was also given
verbally. Alternatively, the explanation was available in Span-
ish, and Spanish-speaking staff members were present in the
mobile unit to explain further if necessary. Participants clicked
an “I Agree” button on the computer to indicate their willing-
ness to participate, and this action generated a unique identifi-
cation number. Three staff members including ocular
technicians and medical and college students screened each
participant as follows:
� Brief medical history taking that included self-identification of
ethnicity and race, address of residence, past medical, ocular,
and family histories including specific questions about diabetes
FIGURE 1. A, Teleophthalmology mobile unit. B, Inside of the mobile van.
Al-Aswad et al Asia-Pacific Journal of Ophthalmology � Volume 10, Number 5, September/October 2021
462 | https://journals.lww.com/apjoo � 2021 Asia-Pacific Academy of Ophthalmology.

mellitus, hypertension, sleep apnea, hyperlipidemia, smoking
and dental examinations. This questionnaire was created to
help the evaluation of risk factors for major eye diseases.
After this medical history taking process, participants were
evaluated with basic systemic measurements such as:
� Height and weight measurement for calculation of body mass
index (BMI)
� Blood pressure measurement using an electronic sphygmoma-
nometer
� Hemoglobin A1c (HbA1c) testing (Alere Afinion point-of-care
assay, Abbott, Abbott Park, IL)
Next, participants were taken to different stations for various
ocular screening:
� Visual acuity measurement using the Snellen chart (Titmus 2s
Vision Screener)
� Intraocular pressure (IOP) measurement via noncontact tonom-
etry (Reichert 7CR Auto Tonometer, Cal Coast Ophthalmic
Instruments Inc., Torrance, CA)
� Anterior and posterior segment optical coherence tomography
(OCT) (3D OCT-1 Maestro, Topcon Medical Systems Inc.,
Oakland, NJ)
� Nonmydriatic fundus photography (3D OCT-1 Maestro, Top-
con Medical Systems Inc., Oakland, NJ)
� Peripheral visual field measurement using frequency
doubling technology
The data obtained was entered and transmitted via a secure
Virtual Private Network connection to the Edward Harkness Eye
Institute reading center. The reading center is a centralized center
where all data is securely transmitted utilizing an internally built
data capturing system, imaging system, and video conferencing
system. An ophthalmologist or optometrist at the center analyzed
the data in real time. The eye care professional then video-confer-
enced in real time with the participant via Skype for Business,
which incorporates end-to-end encryption for voice and video, to
give recommendations for follow-up care. The conversation was
conducted in a private part of the mobile unit. Before leaving the
screening site, each participant received a printed copy of his or her
results and recommendations for follow-up care as well as a copy of
the informed consent form. Each participant also received a list of
eye care professionals whose offices were in or near their neigh-
borhood. All the evaluations including anamnesis, basic systematic
measurements, ocular screenings, real-time video conference with
an eye care professional and information about follow-up recom-
mendations, took about 20 minutes for each participant. All the
evaluations were performed in the efficient design mobile van
(Fig. 1B) and only one participant was taken into the mobile van at a
time to establish effective confidentiality.
To check follow-up rates and results within 2 to 4 months of
the screening, participants who were referred to an ophthalmic
examination were contacted by a patient navigator to ensure a
follow-up visit with a local eye doctor. If participants failed to
follow up, we inquired as to what prevented them from a follow-
up to better understand the needs of the population.
The reading guidelines were prepared by an experienced
glaucoma specialist for an interpretation of the findings. An
experienced ophthalmologist or an optometrist analyzed the data
in real time and referred to participants according to defined
criteria.
DefinitionsGlaucoma suspect:
� IOP >21 mm Hg with corneal thickness taken into consider-
ation, and/or glaucomatous appearance of the optic disc and/or
an abnormal OCT consistent with glaucoma [deterioration of
double hump appearance, asymmetry between 2 eyes in retinal
nerve fiber layer (RNFL), generalized thinning in RNFL] and/
or a narrow angle on anterior segment OCT and/or frequency
doubling technology (FDT) abnormalities inconsistent with
retinal pathologies.
Narrow-angle suspect:
� Structurally assessed angles based on anterior segment OCT.
Angles were defined as narrow if they were �20 degrees on
anterior segment OCT. The narrow-angle suspect group is
categorized as a glaucoma suspect as well.
Cataract suspect:
� Visual acuity �20/40 with evidence of cataract on anterior
segment OCT
Diabetic retinopathy:
� Hemorrhages or exudates on 451 fundus photography
Diabetic state:
� Prediabetic state: HbA1c between 5.7% and 6.4%
� Diabetes: HbA1c 6.5% or above11
Blood pressure guidelines:
� Low blood pressure: Systolic �90 mm Hg or diastolic
�60 mm Hg
� Normal: <120/80 mm Hg
� Elevated: Systolic 120–129 mm Hg and diastolic <80 mm Hg
� Stage 1 hypertension: Systolic 130–139 mm Hg or diastolic
80–89 mm Hg
� Stage 2 hypertension: Systolic �140 mm Hg or diastolic
�90 mm Hg 12
BMI state:
� Obesity: BMI �30
� Above morbid obesity: BMI >40
The usual equation for calculating BMI (weight in pounds /
height in inches2) was adjusted to account for the fact that the
participants were clothed (�2.65 for males;�1.76 for females).13
Data AnalysisRelative risk ratios (RRR) for each predictor and their
corresponding p-values were used for statistical inference. A
multivariate Bayesian logistic regression was performed to iden-
tify patient characteristics associated with possible abnormal
ophthalmic findings. A Bayesian approach to logistic regression
was chosen to specify the prior distribution of each continuous
variable and to avoid model overfitting. The regression model was
built from the full set of candidate predictor variables, that is, all
of the patient demographics and characteristics, and their pairwise
interactions. Computerized statistical analyses were conducted
using STATA software (version 14, StataCorp, College Station,
TX). The alpha level (type 1 error) was set to be 0.05.
RESULTSOf 957 adults screened with 3828 total images, 3744
(97.81%) were readable images. No participant who wished to
be screened was turned away, and no one refused screening once
the study was explained. We eliminated 9 participants from the
Asia-Pacific Journal of Ophthalmology � Volume 10, Number 5, September/October 2021 Real Teleophthalmology for the Detection
� 2021 Asia-Pacific Academy of Ophthalmology. https://journals.lww.com/apjoo | 463

TA
BLE
1.DemographicsandPatientCharacteristics
Ch
ara
cter
isti
csT
ota
l(n¼
95
7)
Hea
lth
yO
cula
rF
ind
ing
s(n¼
49
9)
Op
hth
alm
olo
gy
Ref
erre
dP
ati
ents
(n¼
45
8)
Gla
uco
ma
Su
spec
ts(n¼
30
5)
An
ato
mic
Na
rro
wA
ng
leS
usp
ects
(n¼
13
6)
Ca
tara
ctS
usp
ects
(n¼
12
4)
AM
DS
usp
ects
(n¼
9)
Ret
ina
lD
isord
ers
Su
spec
ts(n¼
29
)
Oth
erO
cula
rF
ind
ing
s(n¼
97
)
Ag
e,m
ean�
std
57
.72�
12
.9
25
4.4
9�
13
.01
61
.24�
11
.87
61
.6�
11
.25
59
.74�
9.6
16
7.7
7�
10
.96
7.8
9�
11
.49
62
.31�
9.5
56
0.2
0�
12
.11
18�
age�
44
,n
(%)
14
2(1
5%
)1
04
(21
%)
38
(8%
)1
7(6
%)
6(4
%)
3(2
%)
0(0
%)
1(3
%)
12
(12
%)
45�
age�
54
,n
(%)
21
7(2
3%
)1
33
(27
%)
84
(18
%)
60
(20
%)
34
(25
%)
12
(10
%)
1(1
1%
)7
(24
%)
16
(16
%)
55�
age�
64
31
8(3
3%
)1
36
(27
%)
14
8(3
2%
)1
04
(34
%)
53
(39
%)
36
(29
%)
3(3
3%
)9
(31
%)
30
(31
%)
Ag
e�
65
28
0(2
9%
)1
26
(25
%)
18
8(4
1%
)1
24
(41
%)
43
(32
%)
73
(59
%)
5(5
6%
)1
2(4
1%
)3
9(4
0%
)G
end
er,
n(%
)F
emal
e5
19
(54
%)
27
8(5
6%
)2
41
(%)
16
2(5
3%
)8
5(6
3%
)6
4(5
2%
)7
(78
%)
11
(38
%)
51
(53
%)
Mal
e4
38
(46
%)
22
1(4
4%
)2
17
(%)
14
3(4
7%
)5
1(3
8%
)6
0(4
8%
)2
(22
%)
18
(62
%)
46
(47
%)
Eth
nic
ity
,n
(%)
Afr
ican
Am
eric
an3
00
(31
%)
14
2(2
8%
)1
58
(34
%)
10
7(3
5%
)4
3(3
2%
)3
4(2
7%
)4
(44
%)
7(2
4%
)2
7(2
8%
)A
sian
94
(10
%)
52
(10
%)
42
(9%
)2
6(9
%)
11
(8%
)1
2(1
0%
)4
(44
%)
1(3
%)
10
(10
%)
Cau
casi
an5
5(6
%)
35
(7%
)2
0(4
%)
14
(5%
)3
(2%
)1
4(1
1%
)0
(0%
)1
(3%
)3
(3%
)H
isp
anic
44
3(4
6%
)2
35
(47
%)
20
8(4
5%
)1
40
(46
%)
68
(50
%)
59
(48
%)
1(1
1%
)1
8(6
2%
)4
6(4
7%
)O
ther
65
(7%
)3
5(7
%)
28
(6%
)1
7(6
%)
11
(8%
)5
(4%
)0
(0%
)2
(7%
)9
(9%
)S
elf-
dec
lara
tio
n,
n(%
)In
sura
nce
73
8(7
7%
)3
83
(77
%)
35
5(7
8%
)2
31
(76
%)
10
0(7
4%
)2
1(7
2%
)9
(10
0%
)2
1(7
2%
)8
6(8
9%
)C
urr
ent
smo
ker
18
2(1
9%
)8
9(1
8%
)9
3(2
0%
)5
7(1
9%
)2
7(2
0%
)2
3(1
9%
)2
(22
%)
7(2
4%
)1
7(1
8%
)S
leep
apn
ea9
3(1
0%
)4
9(1
0%
)4
4(1
0%
)2
6(9
%)
9(7
%)
14
(11
%)
1(1
1%
)2
(7%
)1
0(1
0%
)H
yp
erte
nsi
on
38
3(4
0%
)2
1(4
%)
21
9(4
8%
)1
45
(48
%)
52
(38
%)
70
(56
%)
1(1
1%
)1
8(6
2%
)4
4(4
5%
)D
iab
etes
mel
litu
s2
13
(22
%)
13
(3%
)1
19
(26
%)
71
(23
%)
29
(21
%)
33
(27
%)
1(1
1%
)2
8(9
7%
)3
1(3
2%
)D
ysl
ipid
emia
30
2(3
2%
)2
0(4
%)
16
3(3
6%
)1
13
(37
%)
46
(34
%)
45
(36
%)
1(1
1%
)1
4(4
8%
)3
2(3
3%
)G
lau
com
a(a
ll)
62
(6%
)1
2(2
%)
50
(11
%)
44
(14
%)
10
(7%
)1
4(1
1%
)0
(0%
)6
(21
%)
5(5
%)
Cat
arac
ts1
13
(12
%)
41
(8%
)7
2(1
6%
)4
8(1
6%
)1
2(9
%)
30
(24
%)
3(3
3%
)1
4(4
8%
)1
2(1
2%
)M
acu
lar
deg
ener
atio
n6
(<1
%)
3(<
1%
)3
(<1
%)
3(1
%)
2(1
%)
1(1
%)
0(0
%)
0(0
%)
1(1
%)
Ret
inal
dis
ord
ers
18
(2%
)6
(1%
)1
2(3
%)
9(3
%)
3(2
%)
2(2
%)
0(0
%)
4(1
4%
)5
(5%
)L
ast
den
tal
exam
<1
yea
r6
22
(65
%)
31
9(6
4%
)3
03
(66
%)
19
6(6
4%
)8
7(6
4%
)7
5(6
0%
)8
(89
%)
16
(55
%)
66
(68
%)
>2
yea
rs2
13
(22
%)
11
7(2
3%
)9
6(2
1%
)7
0(2
3%
)3
2(2
4%
)3
1(2
5%
)1
(11
%)
9(3
1%
)1
4(1
4%
)>
5y
ears
10
8(1
1%
)5
4(1
1%
)5
4(1
1%
)3
6(1
2%
)1
6(1
2%
)1
5(1
2%
)0
(0%
)3
(10
%)
17
(18
%)
Nev
er1
4(1
%)
9(2
%)
5(1
%)
3(1
%)
1(<
1%
)3
(2%
)0
(0%
)1
(3%
)0
(0%
)L
ast
eye
exam
<1
yea
r4
07
(43
%)
17
8(3
6%
)2
00
(44
%)
15
4(5
0%
)6
5(4
8%
)1
9(6
6%
)4
(44
%)
19
(66
%)
54
(56
%)
>2
yea
rs3
17
(33
%)
18
0(3
6%
)1
08
(24
%)
98
(32
%)
43
(32
%)
4(1
4%
)2
(22
%)
4(1
4%
)2
1(2
2%
)>
5y
ears
17
1(1
8%
)9
7(1
9%
)4
1(9
%)
41
(13
%)
22
(16
%)
5(1
7%
)3
(33
%)
5(1
7%
)2
0(2
1%
)N
ever
61
(6%
)4
3(9
%)
6(1
%)
12
(4%
)6
(4%
)1
(3%
)0
(0%
)1
(3%
)2
(2%
)
Al-Aswad et al Asia-Pacific Journal of Ophthalmology � Volume 10, Number 5, September/October 2021
464 | https://journals.lww.com/apjoo � 2021 Asia-Pacific Academy of Ophthalmology.
analysis because they did not finish the screening, or did not have
images taken (fundus photographs and OCT images).
The median age of the participants was 58 years and 54%
were female as shown in Table 1. The vast majority (93%) were
ethnic/racial minorities (nonwhite Hispanic, 46%; African Amer-
ican, 31%; Asian, 10%; Caucasian, 6%; others, 7%). Evidently,
the non-Hispanic and non–African American percentages in our
study group are relatively small. That is why even though the large
size of our study group would still allow some (but not strong)
statistical comparison across different ethnicities, we refrain from
doing so in the paper. Nevertheless, we should yield that this is a
limitation for our study. Sizeable percentages had other risk
factors for eye disease; close to one-third of the participants
reported dyslipidemia, close to one-fifth were current smokers,
and about 10% reported sleep apnea, which is a risk factor for
glaucoma.14 One-third of the participants had not had a dental
examination within 2 years (more than 5 years, 11%; never, 1%)
and nearly half (43%) had not had an eye examination within
1 year (more than 5 years, 18%; never, 6%).
Of the 957 participants whose data was analyzed, 380
participants (40%) were newly diagnosed and 458 (48%) were
referred for further ophthalmic evaluation. Of those, 305 (52%)
were glaucoma suspects, 124 (25%) cataracts, 29 (6%) diabetic
retinopathy, and 9 (1.8%) participants were macular degeneration
suspects.
Since this was a community-based screening study, the only
inclusion criterion for the study was to be 18 years of age or older.
All participants who may have an ocular disease were evaluated
with the same screening protocol as those who do not. Although
some of the participants had self-reported eye conditions or were
being monitored for a previously detected eye condition and
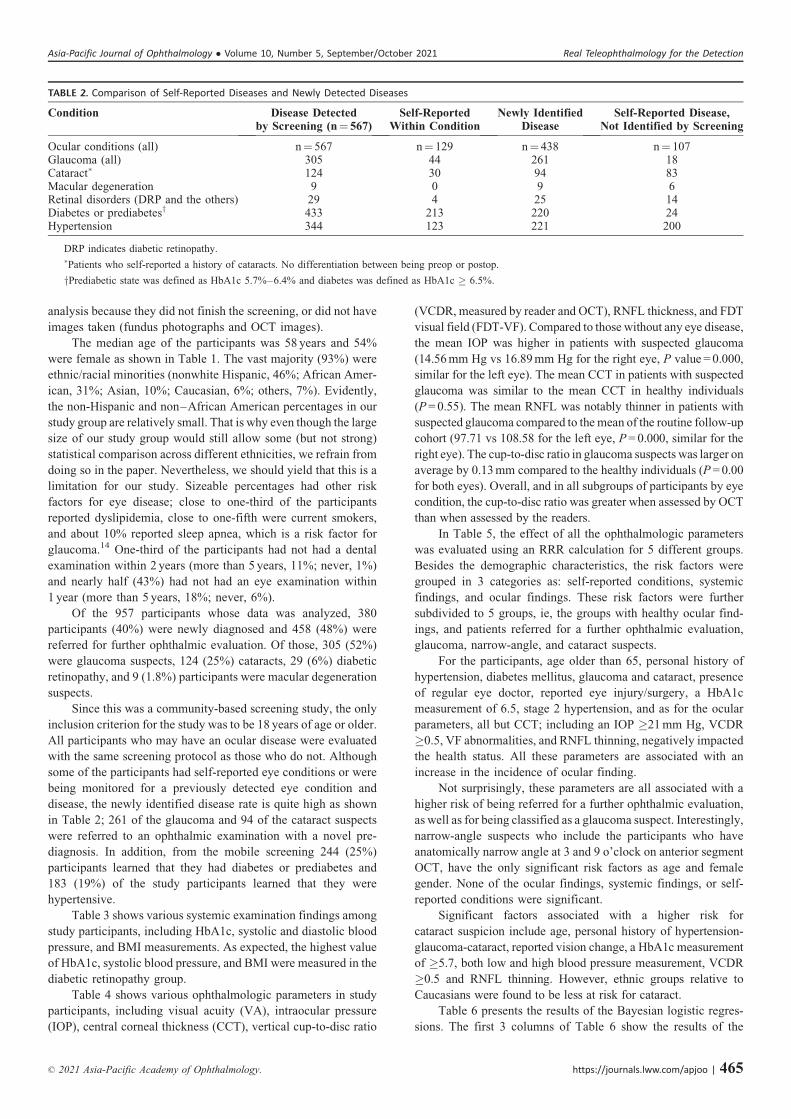
disease, the newly identified disease rate is quite high as shown
in Table 2; 261 of the glaucoma and 94 of the cataract suspects
were referred to an ophthalmic examination with a novel pre-
diagnosis. In addition, from the mobile screening 244 (25%)
participants learned that they had diabetes or prediabetes and
183 (19%) of the study participants learned that they were
hypertensive.
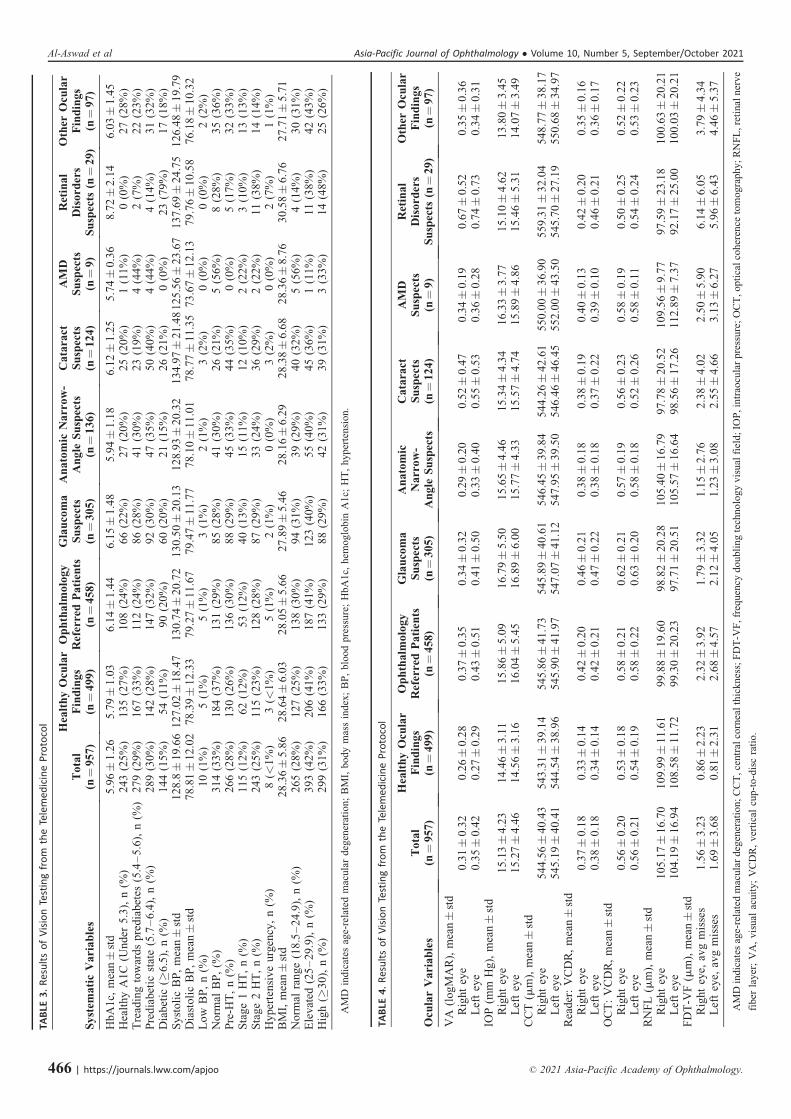
Table 3 shows various systemic examination findings among
study participants, including HbA1c, systolic and diastolic blood
pressure, and BMI measurements. As expected, the highest value
of HbA1c, systolic blood pressure, and BMI were measured in the
diabetic retinopathy group.
Table 4 shows various ophthalmologic parameters in study
participants, including visual acuity (VA), intraocular pressure
(IOP), central corneal thickness (CCT), vertical cup-to-disc ratio
(VCDR, measured by reader and OCT), RNFL thickness, and FDT
visual field (FDT-VF). Compared to those without any eye disease,
the mean IOP was higher in patients with suspected glaucoma
(14.56 mm Hg vs 16.89 mm Hg for the right eye, P value = 0.000,
similar for the left eye). The mean CCT in patients with suspected
glaucoma was similar to the mean CCT in healthy individuals
(P = 0.55). The mean RNFL was notably thinner in patients with
suspected glaucoma compared to the mean of the routine follow-up
cohort (97.71 vs 108.58 for the left eye, P = 0.000, similar for the
right eye). The cup-to-disc ratio in glaucoma suspects was larger on
average by 0.13 mm compared to the healthy individuals (P = 0.00
for both eyes). Overall, and in all subgroups of participants by eye
condition, the cup-to-disc ratio was greater when assessed by OCT
than when assessed by the readers.
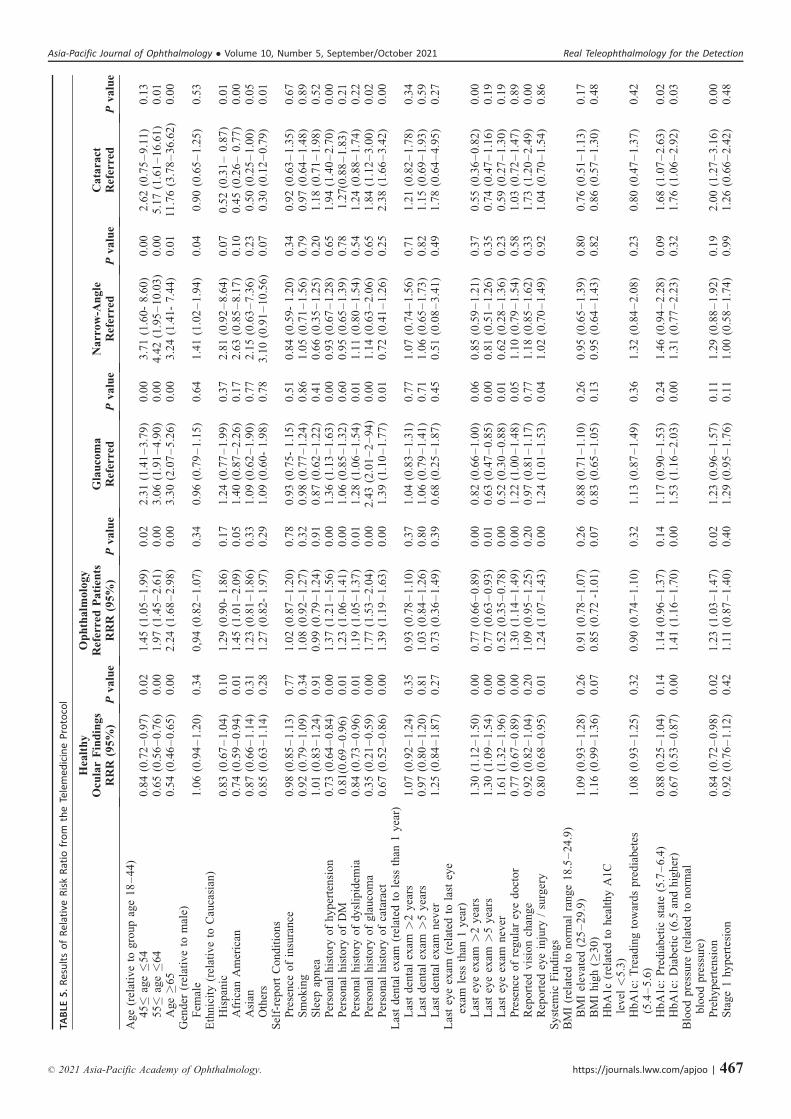
In Table 5, the effect of all the ophthalmologic parameters
was evaluated using an RRR calculation for 5 different groups.
Besides the demographic characteristics, the risk factors were
grouped in 3 categories as: self-reported conditions, systemic
findings, and ocular findings. These risk factors were further
subdivided to 5 groups, ie, the groups with healthy ocular find-
ings, and patients referred for a further ophthalmic evaluation,
glaucoma, narrow-angle, and cataract suspects.
For the participants, age older than 65, personal history of
hypertension, diabetes mellitus, glaucoma and cataract, presence
of regular eye doctor, reported eye injury/surgery, a HbA1c
measurement of 6.5, stage 2 hypertension, and as for the ocular
parameters, all but CCT; including an IOP �21 mm Hg, VCDR
�0.5, VF abnormalities, and RNFL thinning, negatively impacted
the health status. All these parameters are associated with an
increase in the incidence of ocular finding.
Not surprisingly, these parameters are all associated with a
higher risk of being referred for a further ophthalmic evaluation,
as well as for being classified as a glaucoma suspect. Interestingly,
narrow-angle suspects who include the participants who have
anatomically narrow angle at 3 and 9 o’clock on anterior segment
OCT, have the only significant risk factors as age and female
gender. None of the ocular findings, systemic findings, or self-
reported conditions were significant.
Significant factors associated with a higher risk for
cataract suspicion include age, personal history of hypertension-
glaucoma-cataract, reported vision change, a HbA1c measurement
of �5.7, both low and high blood pressure measurement, VCDR
�0.5 and RNFL thinning. However, ethnic groups relative to
Caucasians were found to be less at risk for cataract.
Table 6 presents the results of the Bayesian logistic regres-
sions. The first 3 columns of Table 6 show the results of the
TABLE 2. Comparison of Self-Reported Diseases and Newly Detected Diseases
Condition Disease Detectedby Screening (n¼ 567)
Self-ReportedWithin Condition
Newly IdentifiedDisease
Self-Reported Disease,Not Identified by Screening
Ocular conditions (all) n¼ 567 n¼ 129 n¼ 438 n¼ 107Glaucoma (all) 305 44 261 18Cataract� 124 30 94 83Macular degeneration 9 0 9 6Retinal disorders (DRP and the others) 29 4 25 14Diabetes or prediabetesy 433 213 220 24Hypertension 344 123 221 200
DRP indicates diabetic retinopathy.�Patients who self-reported a history of cataracts. No differentiation between being preop or postop.
yPrediabetic state was defined as HbA1c 5.7%–6.4% and diabetes was defined as HbA1c � 6.5%.
Asia-Pacific Journal of Ophthalmology � Volume 10, Number 5, September/October 2021 Real Teleophthalmology for the Detection
� 2021 Asia-Pacific Academy of Ophthalmology. https://journals.lww.com/apjoo | 465
TA
BLE
3.ResultsofVisionTestingfrom
theTelemedicineProtocol
Sy
stem
ati
cV
ari
ab
les
To
tal
(n¼
95
7)
Hea
lth
yO
cula
rF
ind
ing
s(n¼
49
9)
Op
hth
alm
olo
gy
Ref
erre
dP
ati
ents
(n¼
45
8)
Gla
uco
ma
Su
spec
ts(n¼
30
5)
An
ato
mic
Na
rro
w-
An
gle
Su
spec
ts(n¼
13
6)
Ca
tara
ctS
usp
ects
(n¼
12
4)
AM
DS
usp
ects
(n¼
9)
Ret
ina
lD
iso
rder
sS
usp
ects
(n¼
29
)
Oth
erO
cula
rF
ind
ing
s(n¼
97
)
Hb
A1
c,m
ean�
std
5.9
6�
1.2
65
.79�
1.0
36
.14�
1.4
46
.15�
1.4
85
.94�
1.1
86
.12�
1.2
55
.74�
0.3
68
.72�
2.1
46
.03�
1.4
5H
ealt
hy
A1
C(U
nd
er5
.3),
n(%
)2
43
(25
%)
13
5(2
7%
)1
08
(24
%)
66
(22
%)
27
(20
%)
25
(20
%)
1(1
1%
)0
(0%
)2
7(2
8%
)T
read
ing
tow
ard
sp
red
iab
etes
(5.4
–5
.6),
n(%
)2
79
(29
%)
16
7(3
3%
)1
12
(24
%)
86
(28
%)
41
(30
%)
23
(19
%)
4(4
4%
)2
(7%
)2
2(2
3%
)P
red
iab
etic
stat
e(5
.7–
6.4
),n
(%)
28
9(3
0%
)1
42
(28
%)
14
7(3
2%
)9
2(3
0%
)4
7(3
5%
)5
0(4
0%
)4
(44
%)
4(1
4%
)3
1(3
2%
)D
iab
etic
(�6
.5),
n(%
)1
44
(15
%)
54
(11
%)
90
(20
%)
60
(20
%)
21
(15
%)
26
(21
%)
0(0
%)
23
(79
%)
17
(18
%)
Sy
sto
lic
BP
,m
ean�
std
12
8.8�
19
.66
12
7.0
2�
18
.47
13
0.7
4�
20
.72
13
0.5
0�
20
.13
12
8.9
3�
20
.32
13
4.9
7�
21
.48
12
5.5
6�
23
.67
13
7.6
9�
24
.75
12
6.4
8�
19
.79
Dia
sto
lic
BP
,m
ean�
std
78
.81�
12
.02
78
.39�
12
.33
79
.27�
11
.67
79
.47�
11
.77
78
.10�
11
.01
78
.77�
11
.35
73
.67�
12
.13
79
.76�
10
.58
76
.18�
10
.32
Lo
wB
P,
n(%
)1
0(1
%)
5(1
%)
5(1
%)
3(1
%)
2(1
%)
3(2
%)
0(0
%)
0(0
%)
2(2
%)
No
rmal
BP
,(%
)3
14
(33
%)
18
4(3
7%
)1
31
(29
%)
85
(28
%)
41
(30
%)
26
(21
%)
5(5
6%
)8
(28
%)
35
(36
%)
Pre
-HT
,n
(%)
26
6(2
8%
)1
30
(26
%)
13
6(3
0%
)8
8(2
9%
)4
5(3
3%
)4
4(3
5%
)0
(0%
)5
(17
%)
32
(33
%)
Sta
ge
1H
T,
n(%
)1
15
(12
%)
62
(12
%)
53
(12
%)
40
(13
%)
15
(11
%)
12
(10
%)
2(2
2%
)3
(10
%)
13
(13
%)
Sta
ge
2H
T,
n(%
)2
43
(25
%)
11
5(2
3%
)1
28
(28
%)
87
(29
%)
33
(24
%)
36
(29
%)
2(2
2%
)1
1(3
8%
)1
4(1
4%
)H
yp
erte
nsi
ve
urg
ency
,n
(%)
8(<
1%
)3
(<1
%)
5(1
%)
2(1
%)
0(0
%)
3(2
%)
0(0
%)
2(7
%)
1(1
%)
BM
I,m
ean�
std
28
.36�
5.8
62
8.6
4�
6.0
32
8.0
5�
5.6
62
7.8
9�
5.4
62
8.1
6�
6.2
92
8.3
8�
6.6
82
8.3
6�
8.7
63
0.5
8�
6.7
62
7.7
1�
5.7
1N
orm
alra
ng
e(1
8.5
–2
4.9
),n
(%)
26
5(2
8%
)1
27
(25
%)
13
8(3
0%
)9
4(3
1%
)3
9(2
9%
)4
0(3
2%
)5
(56
%)
4(1
4%
)3
0(3
1%
)E
lev
ated
(25
–2
9.9
),n
(%)
39
3(4
2%
)2
06
(41
%)
18
7(4
1%
)1
23
(40
%)
55
(40
%)
45
(36
%)
1(1
1%
)1
1(3
8%
)4
2(4
3%
)H
igh
(�3
0),
n(%
)2
99
(31
%)
16
6(3
3%
)1
33
(29
%)
88
(29
%)
42
(31
%)
39
(31
%)
3(3
3%
)1
4(4
8%
)2
5(2
6%
)
AM
Din
dic
ates
age-
rela
ted
mac
ular
deg
ener
atio
n;
BM
I,b
od
ym
ass
ind
ex;
BP
,b
loo
dp
ress
ure
;H
bA
1c,
hem
og
lob
inA
1c;
HT
,h
yp
erte
nsi
on.
TA
BLE
4.ResultsofVisionTestingfrom
theTelemedicineProtocol
Ocu
lar
Va
ria
ble
sT
ota
l(n¼
95
7)
Hea
lth
yO
cula
rF
ind
ing
s(n¼
49
9)
Op
hth
alm
olo
gy
Ref
erre
dP
ati
ents
(n¼
45
8)
Gla
uco
ma
Su
spec
ts(n¼
30
5)
An
ato
mic
Na
rro
w-
An
gle
Su
spec
ts
Ca
tara
ctS
usp
ects
(n¼
12
4)
AM
DS
usp
ects
(n¼
9)
Ret
ina
lD
iso
rder
sS
usp
ects
(n¼
29
)
Oth
erO
cula
rF
ind
ing
s(n¼
97
)
VA
(lo
gM
AR
),m
ean�
std
Rig
ht
eye
0.3
1�
0.3
20
.26�
0.2
80
.37�
0.3
50
.34�
0.3
20
.29�
0.2
00
.52�
0.4
70
.34�
0.1
90
.67�
0.5
20
.35�
0.3
6L
eft
eye
0.3
5�
0.4
20
.27�
0.2
90
.43�
0.5
10
.41�
0.5
00
.33�
0.4
00
.55�
0.5
30
.36�
0.2
80
.74�
0.7
30
.34�
0.3
1IO
P(m
mH
g),
mea
n�
std
Rig
ht
eye
15
.13�
4.2
31
4.4
6�
3.1
11
5.8
6�
5.0
91
6.7
9�
5.5
01
5.6
5�
4.4
61
5.3
4�
4.3
41
6.3
3�
3.7
71
5.1
0�
4.6
21
3.8
0�
3.4
5L
eft
eye
15
.27�
4.4
61
4.5
6�
3.1
61
6.0
4�
5.4
51
6.8
9�
6.0
01
5.7
7�
4.3
31
5.5
7�
4.7
41
5.8
9�
4.8
61
5.4
6�
5.3
11
4.0
7�
3.4
9C
CT
(mm
),m
ean�
std
Rig
ht
eye
54
4.5
6�
40
.43
54
3.3
1�
39
.14
54
5.8
6�
41
.73
54
5.8
9�
40
.61
54
6.4
5�
39
.84
54
4.2
6�
42
.61
55
0.0
0�
36
.90
55
9.3
1�
32
.04
54
8.7
7�
38
.17
Lef
tey
e5
45
.19�
40
.41
54
4.5
4�
38
.96
54
5.9
0�
41
.97
54
7.0
7�
41
.12
54
7.9
5�
39
.50
54
6.4
6�
46
.45
55
2.0
0�
43
.50
54
5.7
0�
27
.19
55
0.6
8�
34
.97
Rea
der
:V
CD
R,
mea
n�
std
Rig
ht
eye
0.3
7�
0.1
80
.33�
0.1
40
.42�
0.2
00
.46�
0.2
10
.38�
0.1
80
.38�
0.1
90
.40�
0.1
30
.42�
0.2
00
.35�
0.1
6L
eft
eye
0.3
8�
0.1
80
.34�
0.1
40
.42�
0.2
10
.47�
0.2
20
.38�
0.1
80
.37�
0.2
20
.39�
0.1
00
.46�
0.2
10
.36�
0.1
7O
CT
:V
CD
R,
mea
n�
std
Rig
ht
eye
0.5
6�
0.2
00
.53�
0.1
80
.58�
0.2
10
.62�
0.2
10
.57�
0.1
90
.56�
0.2
30
.58�
0.1
90
.50�
0.2
50
.52�
0.2
2L
eft
eye
0.5
6�
0.2
10
.54�
0.1
90
.58�
0.2
20
.63�
0.2
00
.58�
0.1
80
.52�
0.2
60
.58�
0.1
10
.54�
0.2
40
.53�
0.2
3R
NF
L(m
m),
mea
n�
std
Rig
ht
eye
10
5.1
7�
16
.70
10
9.9
9�
11
.61
99
.88�
19
.60
98
.82�
20
.28
10
5.4
0�
16
.79
97
.78�
20
.52
10
9.5
6�
9.7
79
7.5
9�
23
.18
10
0.6
3�
20
.21
Lef
tey
e1
04
.19�
16
.94
10
8.5
8�
11
.72
99
.30�
20
.23
97
.71�
20
.51
10
5.5
7�
16
.64
98
.56�
17
.26
11
2.8
9�
7.3
79
2.1
7�
25
.00
10
0.0
3�
20
.21
FD
T-V
F(m
m),
mea
n�
std
Rig
ht
eye,
avg
mis
ses
1.5
6�
3.2
30
.86�
2.2
32
.32�
3.9
21
.79�
3.3
21
.15�
2.7
62
.38�
4.0
22
.50�
5.9
06
.14�
6.0
53
.79�
4.3
4L
eft
eye,
avg
mis
ses
1.6
9�
3.6
80
.81�
2.3
12
.68�
4.5
72
.12�
4.0
51
.23�
3.0
82
.55�
4.6
63
.13�
6.2
75
.96�
6.4
34
.46�
5.3
7
AM
Din
dica
tes
age-
rela
ted
mac
ular
deg
ener
atio
n;
CC
T,c
entr
alco
rnea
lth
ick
nes
s;F
DT
-VF
,fr
eque
ncy
do
ubl
ing
tech
nolo
gy
vis
ual
fiel
d;
IOP
,in
trao
cula
rp
ress
ure
;O
CT
,op
tica
lco
her
ence
tom
ogr
aph
y;
RN
FL
,ret
inal
ner
ve
fiber
layer
;V
A,
vis
ual
acuit
y;
VC
DR
,ver
tica
lcu
p-t
o-d
isc
rati
o.
Al-Aswad et al Asia-Pacific Journal of Ophthalmology � Volume 10, Number 5, September/October 2021
466 | https://journals.lww.com/apjoo � 2021 Asia-Pacific Academy of Ophthalmology.
TA
BLE
5.ResultsofRelative
RiskRatiofrom
theTelemedicineProtocol
Hea
lth
yO
cula
rF
ind
ing
sR
RR
(95
%)
Pv
alu
e
Op
hth
alm
olo
gy
Ref
erre
dP
ati
ents
RR
R(9
5%
)P
va
lue
Gla
uco
ma
Ref
erre
dP
va
lue
Na
rro
w-A
ng
leR
efer
red
Pv
alu
eC
ata
ract
Ref
erre
dP
va
lue
Ag
e(r
elat
ive
tog
rou
pag
e1
8–
44
)4
5�
age�
54
0.8
4(0
.72
–0
.97
)0
.02
1.4
5(1
.05
–1
.99
)0
.02
2.3
1(1
.41
–3
.79
)0
.00
3.7
1(1
.60
-8
.60
)0
.00
2.6
2(0
.75
–9
.11
)0
.13
55�
age�
64
0.6
5(0
.56
–0
.76
)0
.00
1.9
7(1
.45
–2
.61
)0
.00
3.0
6(1
.91
–4
.90
)0
.00
4.4
2(1
.95
–1
0.0
3)
0.0
05
.17
(1.6
1–
16
.61
)0
.01
Ag
e�
65
0.5
4(0
.46
–0
.65
)0
.00
2.2
4(1
.68
–2
.98
)0
.00
3.3
0(2
.07
–5
.26
)0
.00
3.2
4(1
.41
-7
.44
)0
.01
11
.76
(3.7
8–
36
.62
)0
.00
Gen
der
(rel
ativ
eto
mal
e)F
emal
e1
.06
(0.9
4–
1.2
0)
0.3
40
,94
(0.8
2–
1.0
7)
0.3
40
.96
(0.7
9–
1.1
5)
0.6
41
.41
(1.0
2–
1.9
4)
0.0
40
.90
(0.6
5–
1.2
5)
0.5
3E
thn
icit
y(r
elat
ive
toC
auca
sian
)H
isp
anic
0.8
3(0
.67
–1
.04
)0
.10
1.2
9(0
.90
-1
.86
)0
.17
1.2
4(0
.77
–1
.99
)0
.37
2.8
1(0
.92
–8
.64
)0
.07
0.5
2(0
.31
–0
.87
)0
.01
Afr
ican
Am
eric
an0
.74
(0.5
9–
0.9
4)
0.0
11
.45
(1.0
1–
2.0
9)
0.0
51
.40
(0.8
7–
2.2
6)
0.1
72
.63
(0.8
5–
8.1
7)
0.1
00
.45
(0.2
6–
0.7
7)
0.0
0A
sian
0.8
7(0
.66
–1
.14
)0
.31
1.2
3(0
.81
–1
.86
)0
.33
1.0
9(0
.62
–1
.90
)0
.77
2.1
5(0
.63
–7
.36
)0
.23
0.5
0(0
.25
–1
.00
)0
.05
Oth
ers
0.8
5(0
.63
–1
.14
)0
.28
1.2
7(0
.82
-1
.97
)0
.29
1.0
9(0
.60
-1
.98
)0
.78
3.1
0(0
.91
–1
0.5
6)
0.0
70
.30
(0.1
2–
0.7
9)
0.0
1S
elf-
rep
ort
Co
nd
itio
ns
Pre
sen
ceo
fin
sura
nce
0.9
8(0
.85
–1
.13
)0
.77
1.0
2(0
.87
–1
.20
)0
.78
0.9
3(0
.75
-1
.15
)0
.51
0.8
4(0
.59
-1
.20
)0
.34
0.9
2(0
.63
–1
.35
)0
.67
Sm
ok
ing
0.9
2(0
.79
–1
.09
)0
.34
1.0
8(0
.92
–1
.27
)0
.32
0.9
8(0
.77
–1
.24
)0
.86
1.0
5(0
.71
–1
.56
)0
.79
0.9
7(0
.64
–1
.48
)0
.89
Sle
epap
nea
1.0
1(0
.83
–1
.24
)0
.91
0.9
9(0
.79
–1
.24
)0
.91
0.8
7(0
.62
–1
.22
)0
.41
0.6
6(0
.35
–1
.25
)0
.20
1.1
8(0
.71
–1
.98
)0
.52
Per
son
alh
isto
ryo
fh
yp
erte
nsi
on
0.7
3(0
.64
–0
.84
)0
.00
1.3
7(1
.21
–1
.56
)0
.00
1.3
6(1
.13
–1
.63
)0
.00
0.9
3(0
.67
–1
.28
)0
.65
1.9
4(1
.40
–2
.70
)0
.00
Per
son
alh
isto
ryo
fD
M0
.81
(0.6
9–
0.9
6)
0.0
11
.23
(1.0
6–
1.4
1)
0.0
01
.06
(0.8
5–
1.3
2)
0.6
00
.95
(0.6
5–
1.3
9)
0.7
81
.27
(0.8
8–
1.8
3)
0.2
1P
erso
nal
his
tory
of
dy
slip
idem
ia0
.84
(0.7
3–
0.9
6)
0.0
11
.19
(1.0
5–
1.3
7)
0.0
11
.28
(1.0
6–
1.5
4)
0.0
11
.11
(0.8
0–
1.5
4)
0.5
41
.24
(0.8
8–
1.7
4)
0.2
2P
erso
nal
his
tory
of
gla
uco
ma
0.3
5(0
.21
–0
.59
)0
.00
1.7
7(1
.53
–2
.04
)0
.00
2.4
3(2
.01
–2
–9
4)
0.0
01
.14
(0.6
3–
2.0
6)
0.6
51
.84
(1.1
2–
3.0
0)
0.0
2P
erso
nal
his
tory
of
cata
ract
0.6
7(0
.52
–0
.86
)0
.00
1.3
9(1
.19
–1
.63
)0
.00
1.3
9(1
.10
–1
.77
)0
.01
0.7
2(0
.41
–1
.26
)0
.25
2.3
8(1
.66
–3
.42
)0
.00
Las
td
enta
lex
am(r
elat
edto
less
than
1y
ear)
Las
td
enta
lex
am>
2y
ears
1.0
7(0
.92
–1
.24
)0
.35
0.9
3(0
.78
–1
.10
)0
.37
1.0
4(0
.83
–1
.31
)0
.77
1.0
7(0
.74
–1
.56
)0
.71
1.2
1(0
.82
–1
.78
)0
.34
Las
td
enta
lex
am>
5y
ears
0.9
7(0
.80
–1
.20
)0
.81
1.0
3(0
.84
–1
.26
)0
.80
1.0
6(0
.79
–1
.41
)0
.71
1.0
6(0
.65
–1
.73
)0
.82
1.1
5(0
.69
–1
.93
)0
.59
Las
td
enta
lex
amn
ever
1.2
5(0
.84
–1
.87
)0
.27
0.7
3(0
.36
–1
.49
)0
.39
0.6
8(0
.25
–1
.87
)0
.45
0.5
1(0
.08
–3
.41
)0
.49
1.7
8(0
.64
–4
.95
)0
.27
Las
tey
eex
am(r
elat
edto
last
eye
exam
less
than
1y
ear)
Las
tey
eex
am>
2y
ears
1.3
0(1
.12
–1
.50
)0
.00
0.7
7(0
.66
–0
.89
)0
.00
0.8
2(0
.66
–1
.00
)0
.06
0.8
5(0
.59
–1
.21
)0
.37
0.5
5(0
.36
–0
.82
)0
.00
Las
tey
eex
am>
5y
ears
1.3
0(1
.09
–1
.54
)0
.00
0.7
7(0
.63
–0
.93
)0
.01
0.6
3(0
.47
–0
.85
)0
.00
0.8
1(0
.51
–1
.26
)0
.35
0.7
4(0
.47
–1
.16
)0
.19
Las
tey
eex
amn
ever
1.6
1(1
.32
–1
.96
)0
.00
0.5
2(0
.35
–0
.78
)0
.00
0.5
2(0
.30
–0
.88
)0
.01
0.6
2(0
.28
–1
.36
)0
.23
0.5
9(0
.27
–1
.30
)0
.19
Pre
sen
ceo
fre
gu
lar
eye
do
cto
r0
.77
(0.6
7–
0.8
9)
0.0
01
.30
(1.1
4–
1.4
9)
0.0
01
.22
(1.0
0–
1.4
8)
0.0
51
.10
(0.7
9–
1.5
4)
0.5
81
.03
(0.7
2–
1.4
7)
0.8
9R
epo
rted
vis
ion
chan
ge
0.9
2(0
.82
–1
.04
)0
.20
1.0
9(0
.95
–1
.25
)0
.20
0.9
7(0
.81
–1
.17
)0
.77
1.1
8(0
.85
–1
.62
)0
.33
1.7
3(1
.20
–2
.49
)0
.00
Rep
ort
edey
ein
jury
/su
rger
y0
.80
(0.6
8–
0.9
5)
0.0
11
.24
(1.0
7–
1.4
3)
0.0
01
.24
(1.0
1–
1.5
3)
0.0
41
.02
(0.7
0–
1.4
9)
0.9
21
.04
(0.7
0–
1.5
4)
0.8
6S
yst
emic
Fin
din
gs
BM
I(r
elat
edto
no
rmal
ran
ge
18
.5–
24
.9)
BM
Iel
evat
ed(2
5–
29
.9)
1.0
9(0
.93
–1
.28
)0
.26
0.9
1(0
.78
–1
.07
)0
.26
0.8
8(0
.71
–1
.10
)0
.26
0.9
5(0
.65
–1
.39
)0
.80
0.7
6(0
.51
–1
.13
)0
.17
BM
Ih
igh
(�3
0)
1.1
6(0
.99
–1
.36
)0
.07
0.8
5(0
.72
-1.0
1)
0.0
70
.83
(0.6
5–
1.0
5)
0.1
30
.95
(0.6
4–
1.4
3)
0.8
20
.86
(0.5
7–
1.3
0)
0.4
8H
bA
1c
(rel
ated
toh
ealt
hy
A1
Cle
vel<
5.3
)H
bA
1c:
Tre
adin
gto
war
ds
pre
dia
bet
es(5
.4–
5.6
)1
.08
(0.9
3–
1.2
5)
0.3
20
.90
(0.7
4–
1.1
0)
0.3
21
.13
(0.8
7–
1.4
9)
0.3
61
.32
(0.8
4–
2.0
8)
0.2
30
.80
(0.4
7–
1.3
7)
0.4
2
Hb
A1
c:P
red
iab
etic
stat
e(5
.7–
6.4
)0
.88
(0.2
5–
1.0
4)
0.1
41
.14
(0.9
6–
1.3
7)
0.1
41
.17
(0.9
0–
1.5
3)
0.2
41
.46
(0.9
4–
2.2
8)
0.0
91
.68
(1.0
7–
2.6
3)
0.0
2H
bA
1c:
Dia
bet
ic(6
.5an
dh
igh
er)
0.6
7(0
.53
–0
.87
)0
.00
1.4
1(1
.16
–1
.70
)0
.00
1.5
3(1
.16
–2
.03
)0
.00
1.3
1(0
.77
–2
.23
)0
.32
1.7
6(1
.06
–2
.92
)0
.03
Blo
od
pre
ssu
re(r
elat
edto
no
rmal
blo
od
pre
ssu
re)
Pre
hy
per
ten
sio
n0
.84
(0.7
2–
0.9
8)
0.0
21
.23
(1.0
3–
1.4
7)
0.0
21
.23
(0.9
6–
1.5
7)
0.1
11
.29
(0.8
8–
1.9
2)
0.1
92
.00
(1.2
7–
3.1
6)
0.0
0S
tag
e1
hy
per
tesi
on
0.9
2(0
.76
–1
.12
)0
.42
1.1
1(0
.87
–1
.40
)0
.40
1.2
9(0
.95
–1
.76
)0
.11
1.0
0(0
.58
–1
.74
)0
.99
1.2
6(0
.66
–2
.42
)0
.48
Asia-Pacific Journal of Ophthalmology � Volume 10, Number 5, September/October 2021 Real Teleophthalmology for the Detection
� 2021 Asia-Pacific Academy of Ophthalmology. https://journals.lww.com/apjoo | 467

regressions of being referred for further evaluation and the
remaining 3 columns do the same for glaucoma suspicion.
According to the presented results, aging, HbA1c, being previ-
ously treated for glaucoma, high IOP and low RNFL are all
associated with a higher probability of being referred. The same
factors are also significant for glaucoma suspicion.
As shown in Table 7, telephone follow-up was successful for
only 38% of participants with cataracts, 38% with glaucoma, 30%
narrow angles, 48% with retinal disorders, and none with macular
degeneration. Besides, detected additional eye problems and
disease confirmation rates were shown in Table 7.
DISCUSSIONOur data indicate that 380 participants (40%) were newly
diagnosed. 458 (48%) participants were detected for having at
least 1 eye condition requiring treatment or control by an eye care
specialist. It is worth emphasizing that this is not in an under-
served neighborhood. Our team’s previous studies that were done
in the same area showed that this ratio is 40.79% for an abnormal
eye condition,9 and in another study, the percentage of the patients
who were referred just for glaucoma evaluation was 25%.8 These
rates were mainly described only as anatomically based abnor-
malities detected by comprehensive screening models and IOP
measurements and perimetry. One should yield that peripheral
retinal pathologies, corneal - lenticular - anterior segment pathol-
ogies require biomicroscopic evaluations, and therefore might be
easily missed.
In this study, both the prevalence of detected ophthalmologic
pathologies (48%) and newly diagnosed ocular conditions (40%)
are absolutely higher compared to the results of similar studies.
The prevalence of asymptomatic, newly diagnosed eye disease is
14% to 33% of patients in a great majority of the studies.15–18 It
must be emphasized that, these studies are mainly retrospective
analyses of optometry clinic documentations, 3 of which included
subjects originating from spectacle prescription applications15–17
and 1 included patients who were regular users of general medical
services.18 The only teleophthalmologic study that aimed to detect
abnormal ocular conditions is the study of Grau et al in occupa-
tional medicine,19 but in this study, only 13.47% of the workers
examined, whose ocular findings necessitating treatment or con-
trol by an ophthalmologist, were performed. Different from ours,
this was based on an occupational medical study in Germany with
a strikingly different population than ours and including insured
subjects from working age population who are not largely coming
from different ethnic origins contrary to our study.
The highest prevalence of abnormal ocular condition in
literature is seen in our study. There might be several reasons
that might contribute to this high rate. The high-risk populations
in our subject pool have inadequate health insurance, irregular eye
care, and ethnic and systemic risk factors. The participants
screened for eye diseases in this pilot study, of whom 93% are
racial or ethnic minority group, were confirmed to be considered
underserved. 23% of these individuals did not have health insur-
ance and more than half of them (57%) had not had an eye
examination within the past year, including 18% who could not
recall an eye examination within the past 5 years. An additional
6% said they had never had an eye examination. A similar report
was published by Wang et al,18 who found that a substantial
portion of the primary care clinic population (50%) in an urbanTA
BLE
5.(Continued)
Hea
lth
yO
cula
rF
ind
ing
sR
RR
(95
%)
Pv
alu
e
Op
hth
alm
olo
gy
Ref
erre
dP
ati
ents
RR
R(9
5%
)P
va
lue
Gla
uco
ma
Ref
erre
dP
va
lue
Na
rro
w-A
ng
leR
efer
red
Pv
alu
eC
ata
ract
Ref
erre
dP
va
lue
Sta
ge
2h
yp
erte
sio
n0
.81
(0.6
9–
0.9
5)
0.0
11
.27
(1.0
6–
1.5
1)
0.0
11
.33
(1.0
4–
1.7
0)
0.0
31
.04
(0.6
8–
1.6
0)
0.8
51
.79
(1.1
2–
2.8
9)
0.0
2H
yp
erte
nsi
ve
urg
ency
0.6
4(0
.26
–1
.58
)0
.33
1.5
0(0
.86
–2
.61
)0
.15
0.9
3(0
.28
–3
.12
)0
.90
4.5
4(1
.73
–1
1.9
5)
0.0
0L
ow
blo
od
pre
ssu
re(h
yp
oT
A)
0.8
6(0
.46
–1
.60
)0
.63
1.2
0(0
.64
–2
.27
)0
.57
1.1
1(0
.42
–2
.92
)0
.83
1.5
4(0
.43
–5
.48
)0
.51
3.6
3(1
.32
–1
0.0
4)
0.0
1O
cula
rF
ind
ing
s(i
nei
ther
eye)
IOP>
21
mm
Hg
0.2
7(0
.17
–0
.41
)0
.00
1.9
9(1
.78
–2
.22
)0
.00
2.7
0(2
.30
–3
.18
)0
.00
1.3
7(0
.91
–2
.08
)0
.13
1.8
9(1
.28
–2
.78
)0
.00
VC
DR�
0.5
acco
rdin
gto
spec
iali
st0
.60
(0.5
1–
0.7
0)
0.0
01
.60
(1.4
1–
1.8
2)
0.0
02
.50
(2.0
9–
3.0
1)
0.0
01
.11
(0.8
0–
1.5
3)
0.5
41
.24
(0.8
9–
1.7
3)
0.2
1V
CD
R�
0.7
acco
rdin
gto
spec
iali
st0
.21
(0.1
1–
0.3
9)
0.0
01
.99
(1.7
8–
2.2
20
.00
3.0
8(2
.66
–3
.56
)0
.00
0.9
2(0
.51
–1
.68
)0
.79
1.7
2(1
.07
–2
.75
)0
.02
VC
DR�
0.5
acco
rdin
gto
OC
T0
.82
(0.7
2–
0.9
4)
0.0
11
.27
(1.0
5–
1.5
3)
0.0
11
.89
(1.3
8–
2.5
7)
0.0
01
.31
(0.8
5–
2.0
1)
0.2
21
.00
(0.6
6–
1.5
1)
0.9
9V
CD
R�
0.7
acco
rdin
gto
OC
T1
.68
(0.5
8–
0.7
9)
0.0
01
.45
(1.2
7–
1.6
4)
0.0
02
.26
(1.8
9–
2.6
9)
0.0
00
.99
(0.7
1–
1.3
8)
0.9
41
.13
(0.8
0–
1.6
0)
0.4
8V
F(F
DT
)ab
no
rmal
ity
0.6
6(0
.58
–0
.75
)0
.00
1.3
6(1
.28
–1
.46
)0
.00
1.2
2(1
.10
–1
.36
)0
.00
0.8
3(0
.66
–1
.06
)0
.13
1.2
0(0
.98
–1
.47
)0
.07
RN
FL<
75
mm
0.0
7(0
.02
–0
.21
)0
.00
2.0
4(1
.84
–2
.21
)0
.00
2.7
6(2
.35
–3
.24
)0
.00
1.2
9(0
.78
–2
.14
)0
.32
2.5
7(1
.74
–3
.79
)0
.00
RN
FL<
95
mm
0.4
4(0
.35
–0
.54
)0
.00
1.8
8(1
.67
–2
.12
)0
.00
2.4
6(2
.07
–2
.93
)0
.00
1.0
6(0
.75
–1
.50
)0
.76
1.8
5(1
.33
–2
.57
)0
.00
CC
T<
53
5m
m1
.06
(0.9
4–
1.2
0)
0.3
40
.94
(0.8
2–
1.0
7)
0.3
50
.91
(0.7
5–
1.0
9)
0.3
10
.78
(0.5
7–
1.0
7)
0.1
31
.07
(0.7
7–
1.4
9)
0.6
8C
CT<
51
0m
m0
.98
(0.8
5–
1.1
4)
0.8
11
.02
(0.8
7–
1.1
9)
0.8
11
.07
(0.8
6–
1.3
3)
0.5
61
.08
(0.7
5–
1.5
6)
0.6
80
.98
(0.6
6–
1.4
6)
0.9
1
BM
Iin
dica
tes
bo
dy
mas
sin
dex
;C
CT
,ce
ntr
alco
rnea
lth
ick
nes
s;F
DT
,fr
equ
ency
do
ubl
ing
tech
no
log
y;
Hb
A1
c,h
emo
glo
bin
A1
c;IO
P,
intr
aocu
lar
pre
ssu
re;
OC
T,
op
tica
lco
her
ence
tom
ogr
aph
y;
RN
FL
,re
tin
aln
erv
efi
ber
layer
;R
RR
,re
lati
ve
risk
rati
os;
VA
,vis
ual
acui
ty;
VF
,vis
ual
fiel
d;
VC
DR
,ver
tica
lcu
p-t
o-d
isc
rati
o.
Al-Aswad et al Asia-Pacific Journal of Ophthalmology � Volume 10, Number 5, September/October 2021
468 | https://journals.lww.com/apjoo � 2021 Asia-Pacific Academy of Ophthalmology.

community had undiagnosed ocular diseases and concluded that
regular ophthalmic screenings would be required especially for
patients who were over 65 years, were in poor health, had not had
routine vision exams, or who did not have adequate insurance
coverage. Their infrequent eye examinations, inadequate insur-
ance coverage for eye care, and poor general health were consid-
ered to be relevant factors for the detection of ocular diseases.
Another study, the Los Angeles Latino Eye Study, is yet another
population-based study to detect undiagnosed eye diseases among
Latinos finding out that any type of eye disease or refractive error
frequency to be 53% in a population of older than 40.20 Ethnicity,
education, lack of insurance, insurance coverage, lack of regular
eye examination, and comorbidities were found to be significant
factors in this regard. Therefore, there is a need to develop better
strategies to educate the population about the importance of vision
screenings and management of ocular diseases, especially as our
population ages and the prevalence of diseases increases in the
near future. This type of study can also help plan targeted
educational awareness-raising campaigns to improve public
health.
Another possible reason for the high rate of detection of the
abnormal ocular conditions might be the comprehensiveness of
our screening. Although a comprehensive screening generally
assists clinicians in catching asymptomatic, mild diseases, it can
also lead to false positivits.21,22 We modeled the screening
protocol of our study using comprehensive tests as an aid, to
prediagnose and to refer effectively to a definite examination. We
used “either positive rule” for glaucoma references (the major part
of the referenced group) if either structural test, functional test, or
IOP was outside normal limits. Unexpectedly, more than one-
third of participants had these criteria and were referred to a
further ophthalmic examination as a glaucoma suspect. Large-
scale population-based glaucoma screening studies on 40 years
and older showed that the prevalence of patients referred for
additional testing and ophthalmic examination is between 10%-
33%23–25 and this is also less than our rate. These studies were not
performed with a teleophthalmologic approach. Also, they did not
include detailed anterior and posterior segment OCT screening for
the RNFL and macula to catch early preperimetric glaucoma and
narrow-angle glaucoma suspects.
TABLE 6. Bayesian Regression of Ophthalmological Referral (1,2,3) and Glaucoma Referral (4,5,6)
(1) (2) (3) (4) (5) (6)
Variables Oph. Ref. Oph. Ref. Oph. Ref. Glauc. Ref. Glauc. Ref. Glauc. Ref.
Age 0.04� 0.04� 0.04� 0.04� 0.02� 0.03�
(0.01) (0.01) (0.01) (0.01) (0.01) (0.01)Hispanic 0.63��� 0.71�� 0.70��� 0.53 0.61 0.60
(0.33) (0.34) (0.40) (0.40) (0.41) (0.48)African American 0.97� 1.02� 1.00�� 0.82�� 0.84�� 0.86���
(0.33) (0.35) (0.40) (0.40) (0.42) (0.48)Asian 0.57 0.60 0.65 0.38 0.42 0.43
(0.38) (0.40) (0.46) (0.45) (0.47) (0.53)Others 0.94�� 1.00�� 1.07�� 0.62 0.68 0.79
(0.42) (0.43) (0.48) (0.49) (0.50) (0.56)HbA1c 0.61� 0.51�� 0.58�� 0.41��� 0.27 0.48���
(0.21) (0.22) (0.26) (0.21) (0.22) (0.24)Treated glaucoma 1.26� 1.04� 0.66��� 1.54� 1.30� 1.17�
(0.32) (0.32) (0.37) (0.31) (0.32) (0.35)IOP >21mm Hg 2.10� 2.04� 2.39� 1.98� 1.92� 2.27v
RNFL <95 mm (0.28) (0.29) 1.05� (0.18) (0.35) 0.80� (0.21) (0.23) (0.24) 1.12� (0.18) (0.28) 0.89� (0.20)VF Abnormal 0.66� 0.15Constant -3.76� -3.53� (0.11) -3.96� -3.92� -3.60� (0.10) -3.86�
(0.49) (0.49) (0.55) (0.55) (0.54) (0.60)Observations 956 956 784 956 956 784
Robust standard errors in parentheses.
HbA1c indicates hemoglobin A1c; IOP, intraocular pressure; RNFL, retinal nerve fiber layer; VF, visual field.�P < 0.01��P < 0.05���P < 0.1
TABLE 7. Individual Follow-up
Disease, nReached,
n (%)Followed Up With
Ophthalmologist, n (%)�
DiseaseConfirmed,
n (%)�
AdditionalEye Problem
Detected, n (%)�Required
Rx, n (%)�
Cataract, n¼ 124 47 (38%) 39 (83%) 16 (34%) 7 (15%) 3 (6%)Glaucoma, n¼ 305 117 (38%) 82 (70%) 50 (42%) 20 (17%) 0 (0%)Narrow angle, n¼ 136 41 (30%) 41 (100%) 18 (44%) 25 (61%) 0 (0%)Retinal disorders, n¼ 29 14 (48%) 10 (71%) 11 (79%) 6 (43%) 0 (0%)Macular degeneration, n¼ 9 0 (0%) 0 (0%) 0 (0%) NA NA
NA indicates not applicable; Rx¼Prescription for glasses.�Percentage based on patients reached.
Asia-Pacific Journal of Ophthalmology � Volume 10, Number 5, September/October 2021 Real Teleophthalmology for the Detection
� 2021 Asia-Pacific Academy of Ophthalmology. https://journals.lww.com/apjoo | 469

In our study, glaucoma suspects are the largest group among
all referrals. Similar to our study, the largest referred group
(38.7%) in Maa et al26 is made up of glaucoma suspects. A high
rate of glaucoma referral, complicated with asymptomatic early
stages of glaucoma, led Maa et al to further their research with the
next parts of their Technology-based Eyecare Services (TECS)
study to establish consensus upon diagnosis. The TECS protocol
was powered for glaucoma/glaucoma suspect detection at the first
part27 and impact of OCT on the accuracy of the TECS protocol at
the second part.28 These teleophthalmologic approaches
prompted us to keep the definition criteria as sensitive as possible
and to construct an OCT integrated model.
We used glaucoma suspect as an umbrella term to include all
glaucoma possibilities (probable-definite, possible, likely) in a
group of healthy participants who face risk factors for glaucoma
(IOP>21mm Hg, narrow angle on anterior segment OCT, etc) or
mimic glaucomatous appearance. Diagnosing glaucoma still
remains a challenge as there is no single litmus test that can
reliably tell whether glaucomatous changes are present. Even in
the clinic, a definitive examination and the diagnosis of glau-
coma is multifactorial and includes IOP, CCT, VF, disc appear-
ance, OCT-RNFL findings, all of which were performed in this
study. Despite all these factors, we should also yield that there is
no single and definite consensus on glaucoma diagnosis param-
eters. Luckily, for most patients, these definitive parameters
make the condition obvious that they either have or do not have
glaucoma and they display objective documentation of the disease
status. However, the detection of early glaucoma still remains
challenging, as there is a significant overlap between normal
variants and factors leading to an early detection of disease.
Therefore, multiple diagnostic tests may play a massive role to
overcome uncertainty. On the other hand, healthy subjects may still
be categorized as glaucoma suspects due to “statistical
abnormality” of outputs of diagnostic devices. Clinician affinity
and over-reliance on newer diagnostic devices may lead to over-
diagnosing glaucoma if findings are interpreted in isolation without
taking into consideration the complete clinical scenario.22,29 Pre-
vious studies have also shown that the diagnostic accuracies of
screening tests can vary with the severity of the disease and that the
performance of the tests tail off from advanced to mild stage.30–32
The accuracy of tests may also vary according to the population
characteristics.29 However, one should keep in mind that these
previous studies were based at clinics, unlike our randomly sam-
pled, population screening teleophthalmolgic model. This differ-
ence is especially important when one considers Maul and Jampel33
who argue a diagnostic test will not perform as well in the real
world, even more so in a random sample of a population, as in a
clinic setting. In line with this, Grødum et al34 showed that normal-
tension glaucoma, unilateral glaucoma, and better visual fields
were more common in random populations compared to routine
clinical glaucoma practice. This may suggest that even mild dis-
eases are easily be missed in the population.
In summary, the inability to clearly distinguish between early
glaucoma and normal variants is one of the major issues in
glaucoma and it has persisted despite technological improve-
ments, including teleophthalmologic innovations that may further
aggravate the problem.
In the modeling phase of our study, definition criteria and
reference conditions were aimed to be as sensitive as possible to
cover all possible diseases. As the prevalence of open-angle
glaucoma among adults in the US was stated to be 1.8% over
the age of 40,35 this nonpractically high rate showed us the
diagnostic tests “abnormality” rate in a more general population.
In this regard, our study is an indicator of how large the positive
screening findings might be in the population.
False positives generate direct costs due to unneeded further
clinical examinations and excessive testing which may affect the
participants’ quality of life. Even in face-to-face examination, it is
possible to come across the unneeded initiation of treatment due to
the slightest hint in ophthalmic screening. Therefore, mass oph-
thalmic screening and over-reliance of these techniques in tele-
ophthalmology might lead to overtreatment, unnecessary
medication costs, follow-up visits, and the risks of side effects
without much gain. We believe the problems related to underdiag-
nosis and overtreatment can be tackled by creating a proper, well-
designed teleophthalmologic model. For our future studies, we plan
to continuously modify our algorithm based on lesson learned to
decrease the false positive to create more accurate references.
Danish teleophthalmology platform is a good example to
overcome this challenge.36 It was a real-world, large-scale, e-
health based teleophthalmologic model. The authors of this study
point out the requirement of an e-health model due to the
dramatically risen eye care patients and concomitant referral
system emergency. Their strategy was established to lighten
the burden of reference system and it was mainly designed with
a risk-stratified approach. According to the findings they lead the
patients to an optometrist, telemedical service, or National Danish
eye care service in the appropriate timing in one of the acute,
subacute, and nonacute categories. Observing the group of
patients with borderline or subacute findings in the telemedical
service before referring them to the ophthalmology clinic is a
well-thought model that optimizes the health care source. This
would be an inspirational model for us in a future study.
Undoubtedly, devices cannot diagnose the patients and each
condition requires a comprehensive assessment of personal history,
risk factors, examination, and screening findings. In traditional
clinical practice, information gained from the examination leads to
ordering diagnostic tests where the clinician can then decide the
probability of disease being present. The study we designed with
this teleophthalmologic model is quite the opposite, beginning with
a comprehensive screening which then leads to face-to-face exam-
ination for definite diagnosis. Despite the existence of potential
issues, we believe technology-based teleophthalmologic approach
will be the inevitable method in the near future. Teleophthalmology
is an expanding domain that could mitigate resource-incentive
aspects of image analysis, nonmydriatic fundus photographs and
remote interpretation, which have been used smoothly in both rural
and urban settings.3 Fast technological advancements make perim-
eters, fundus cameras, and OCT machines easily accessible with
less costs, all of which will be performed in a widespread manner.
Monitorization and documentation of findings for future compar-
isons constitute the personal normative data system. High repro-
ducibility of testing allows each individual to have his or her own
normative data and individualize early detection of baseline
changes rather than relying on population norms.37 Even at the
time of this writing, interesting innovations are ongoing with the
incorporation of artificial intelligence and deep learning to oph-
thalmic diagnosis.38–46 We believe these methods will help get an
effective diagnosis with teleophthalmologic models, and these
models will be an ideal implication area for these innovations.
Al-Aswad et al Asia-Pacific Journal of Ophthalmology � Volume 10, Number 5, September/October 2021
470 | https://journals.lww.com/apjoo � 2021 Asia-Pacific Academy of Ophthalmology.

The effective, applicable technology-based eye screening
models require not only comprehensive screening devices, but
also detailed questionnaire forms to detect personal risk factors
effectively. Thus, the questionnaire form was prepared to take the
necessary information from participants as fast and as effectively
as possible. It included specific questions which might be risk
factors for major eye diseases. Dental health and glaucoma were
also found to be related in a prospective cohort study of men with
glaucoma. Pasquale et al also identified poor oral health and
recent tooth loss as risk factors for primary open-angle glaucoma
in men.47 Somewhat contrary with the findings of Pasquale et al,
in our analysis, we did not find any significant increase in risks
associated with subjects that did not have a dental examination for
more than 2 years.
In addition to the questionnaire form, basic systemic exami-
nation findings are also assessed as risk factors for eye diseases.
Substantial proportions of participants had newly detected diabe-
tes, hypertension, and conditions that predisposed them to ocular
disease.48,49 In all groups, only 25% of the participants had a
healthy HbA1c level, only the blood pressure of 33% was in
normal limits, and only 28% had a normal range of BMI. The
percentages of the participants who have healthy HbA1c levels
and a normal range of blood pressure were even less in the
referred group. Similarly, as seen in Table 5, both self-reported
systemic diseases and systemic evaluations that are done by our
mobile unit are among the significant risk factors in this group.
The systemic risk factors were found more than literature-based
anticipations.50–52 We believe that our findings show that there is
a great need for a comprehensive public health study in New York
City. Our study also points to interesting spots for future epide-
miological and public health studies.
In Table 5, the effects of all parameters (demographic
characteristics as well as systemic and ocular findings) were
evaluated using an RRR calculation. This analysis was also
complemented with a Bayesian logistic regression as presented
in Table 6. As it was a pilot study, the deficiencies were
detected—detailed statistical evaluation of the parameters will
help improve our models. Different thresholds for risk groups,
giving different weights to each technique instead of the either
positive rule, modeling combined testing for diagnosis, and
priority queuing for reference, shall further be investigated. All
these possibilities for future research require a clinically inte-
grated model to see the coherent match between the teleophthal-
mologic model and clinical diagnosis. These future studies may
shed a further light on the clinical significance of our results
beyond the statistically significant findings we presented in the
current paper.
One major limitation of our study is that it was not designed
with a consecutive clinical and comprehensive eye examination.
Even though we aimed to understand the true-false-positive-
negative diagnosis rates with the follow-up calls, results presented
in Table 7 suggest that this was not really feasible. As seen in
Table 7, first, the rate of answered phone calls was quite limited.
The rate of follow-up examinations done by ophthalmologists was
considerably limited. Follow-up visit results were obtained from
the participants through phone conversations by using special
follow-up questionnaire forms. Therefore, we had to rely on
participants’ self-reports about disease confirmation or contradic-
tion. All these factors were the barriers to report accurate true-
false positive-negative diagnosis. This would constitute a further
motivation to construct a health record integrated teleophthalmo-
logic model. We believe such a potentially integrated system
would provide a well-settled diagnostic prediction model and risk
analysis with demographics and past medical history.
CONCLUSIONIn conclusion, our study demonstrates the feasibility of real-
time, ophthalmology screening in high risk and low socioeco-
nomics minorities of New York City. Additionally, it has the
potential to drastically improve access to ophthalmic care while
presenting an opportunity to share health information with the
community. We obtained important results that are relevant to the
population; however, we also believe that our study has room to
improve upon the sensitivity and specificity. We plan to perform
further research studies that will be guided by this pilot study.
REFERENCES
1. Klaassen B, van Beijnum BJ, Hermens HJ. Usability in telemedicine
systems-A literature survey. Int J Med Inform. 2016;93:57–69.
2. Maa AY, Evans C, DeLaune WR, et al. A novel tele-eye protocol for
ocular disease detection and access to eye care services. Telemed J E
Health. 2014;20:318–323.
3. Rathi S, Tsui E, Mehta N, et al. The current state of teleophthalmology in
the United States. Ophthalmology. 2017;124:1729–1734.
4. Holekamp NM. Moving from clinic to home: what the future holds for
ophthalmic telemedicine. Am J Ophthalmol. 2018;187:xxviii–xxxv.
5. Saleem SM, Pasquale LR, Sidoti PA, et al. Virtual
Ophthalmology: telemedicine in a COVID-19 Era. Am J Ophthalmol.
2020;216:237–242.
6. Eye Health Statistics - American Academy of Ophthalmology [Internet].
Available from: https://www.aao.org/newsroom/eye-health-statistics.
Accessed November 30, 2020.
7. Quigley HA, Broman AT. The number of people with glaucoma worldwide
in 2010 and 2020. Br J Ophthalmol. 2006;90:262–267.
8. Al-Aswad LA, Joiner DB, Wang X, et al. Screening for glaucoma in
populations at high risk: The eye screening New York Project. Cogent
Med. 2017;4:1367059.
9. Kapoor R, Yuksel-Elgin C, Patel V, et al. Detecting common eye diseases
using the first teleophthalmology GlobeChek Kiosk in the United States: a
pilot study. Asia Pac J Ophthalmol (Phila). 2020;9:315–325.
10. King L, Hinterland K, Dragan KL, et al. For the New York City
Department of Health and Mental Hygiene. Community Health Profiles:
Manhattan Community District 12: Washington Heights and Inwood.
2015;12:1–16. Available from: https://www1.nyc.gov/assets/doh/downloads/
pdf/data/2015chp-mn12.pdf. Accessed September 12, 2020.
11. Centers for Disease Control and Prevention. Type 1 diabetes, type 2
diabetes, and prediabetes. Available from: www.cdc.gov/diabetes/basics/
getting-tested.html. Accessed September 26, 2020.
12. Whelton PK, Carey RM, Aronow WS, et al. 2017 ACC/AHA/AAPA/ABC/
ACPM/AGS/APhA/ASH/ASPC/NMA/PCNA Guideline for the Prevention,
Detection, Evaluation, and Management of High Blood Pressure in Adults:
A Report of the American College of Cardiology/American Heart
Association Task Force on Clinical Practice Guidelines [published
correction appears in J Am Coll Cardiol. 2018 May 15;71(19):2275-2279].
J Am Coll Cardiol. 2018;71:e127–e248.
Asia-Pacific Journal of Ophthalmology � Volume 10, Number 5, September/October 2021 Real Teleophthalmology for the Detection
� 2021 Asia-Pacific Academy of Ophthalmology. https://journals.lww.com/apjoo | 471

13. Whigham LD, Schoeller DA, Johnson LK, et al. Effect of clothing weight
on body weight. Int J Obes (Lond). 2013;37:160–161.
14. Santos M, Hofmann RJ. Ocular manifestations of obstructive sleep apnea. J
Clin Sleep Med. 2017;13:1345–1348.
15. Michaud L, Forcier P. Prevalence of asymptomatic ocular conditions in
subjects with refractive-based symptoms. J Optom. 2014;7:153–160.
16. Robinson BE. Prevalence of asymptomatic eye disease. CJO. 2003;65.
175Y80.
17. Irving EL, Harris JD, Machan CM, et al. Value of routine eye
examinations in asymptomatic patients. Optom Vis Sci. 2016;93:660–666.
18. Wang F, Ford D, Tielsch JM, et al. Undetected eye disease in a primary
care clinic population. Arch Intern Med. 1994;154:1821–1828.
19. Grau E, Horn F, Nixdorff U, et al. OCT and IOP findings
in a healthy worker cohort: results from a teleophthalmic study in
occupational medicine. Graefes Arch Clin Exp Ophthalmol.
2019;257:2571–2578.
20. Varma R, Mohanty SA, Deneen J, et al. Burden and predictors of
undetected eye disease in Mexican-Americans: the Los Angeles Latino Eye
Study. Med Care. 2008;46:497–506.
21. Garway-Heath DF, Friedman DS. How should results from clinical tests be
integrated into the diagnostic process? Ophthalmology. 2006;113:1479–
1480.
22. Halkin A, Reichman J, Schwaber M, et al. Likelihood ratios: getting
diagnostic testing into perspective. QJM. 1998;91:247–258.
23. Tielsch JM, Katz J, Singh K, et al. A population-based evaluation of
glaucoma screening: the Baltimore Eye Survey. Am J Epidemiol.
1991;134:1102–1110.
24. Leske MC, Connell AM, Schachat AP, et al. The Barbados
Eye Study. Prevalence of open angle glaucoma. Arch Ophthalmol.
1994;112:821–829.
25. Budenz DL, Barton K, Whiteside-de Vos J, et al. Prevalence of glaucoma
in an urban West African population: the Tema Eye Survey. JAMA
Ophthalmol. 2013;131:651–658.
26. Maa AY, Wojciechowski B, Hunt KJ, et al. Early experience with
technology-based eye care Services (TECS): a novel ophthalmologic
telemedicine initiative. Ophthalmology. 2017;124:539–546.
27. Maa AY, Medert CM, Lu X, et al. Diagnostic accuracy of technology-
based eye care services: the technology-based eye care services compare
trial part I. Ophthalmology. 2020;127:38–44.
28. Maa AY, McCord S, Lu X, et al. The impact of OCT on diagnostic
accuracy of the technology-based eye care services protocol: part ii of the
technology-based eye care services compare trial. Ophthalmology.
2020;127:544–549.
29. Mowatt G, Burr JM, Cook JA, et al. Screening tests for detecting open-
angle glaucoma: systematic review and meta-analysis. Invest Ophthalmol
Vis Sci. 2008;49:5373–5385.
30. Medeiros FA, Zangwill LM, Bowd C, et al. Influence of disease severity
and optic disc size on the diagnostic performance of imaging instruments in
glaucoma. Invest Ophthalmol Vis Sci. 2006;47:1008–1015.
31. Rao HL, Leite MT, Weinreb RN, et al. Effect of disease severity and optic
disc size on diagnostic accuracy of RTVue spectral domain optical
coherence tomograph in glaucoma. Invest Ophthalmol Vis Sci.
2011;52:1290–1296.
32. Leite MT, Zangwill LM, Weinreb RN, et al. Effect of disease severity on
the performance of Cirrus spectral-domain OCT for glaucoma diagnosis.
Invest Ophthalmol Vis Sci. 2010;51:4104–4109.
33. Maul EA, Jampel HD. Glaucoma screening in the real world [published
correction appears in Ophthalmology.. Ophthalmology. 2010;117:1665–1666.
34. Grødum K, Heijl A, Bengtsson B. A comparison of glaucoma patients
identified through mass screening and in routine clinical practice. Acta
Ophthalmol Scand. 2002;80(6):627–631.
35. Friedman DS, Wolfs RC, O’Colmain BJ, et al. Prevalence of open-angle
glaucoma among adults in the United States [published correction appears
in Arch Ophthalmol. 2011 Sep;129(9):1224]. Arch Ophthalmol.
2004;122:532–538.
36. Muttuvelu DV, Buchholt H, Nygaard M, et al. Danish teleophthalmology
platform reduces optometry referrals into the national eye care system.
BMJ Open Ophthalmol. 2021;6:e000671.
37. Chang RT, Singh K. Glaucoma suspect: diagnosis and management. Asia
Pac J Ophthalmol (Phila). 2016;5:32–37.
38. Li Z, He Y, Keel S, et al. Efficacy of a deep learning system for detecting
glaucomatous optic neuropathy based on color fundus photographs.
Ophthalmology. 2018;125:1199–1206.
39. Phene S, Dunn RC, Hammel N, et al. Deep learning and glaucoma
specialists: the relative importance of optic disc features to predict glaucoma
referral in fundus photographs. Ophthalmology. 2019;126:1627–1639.
40. Al-Aswad LA, Kapoor R, Chu CK, et al. Evaluation of a deep learning
system for identifying glaucomatous optic neuropathy based on color
fundus photographs. J Glaucoma. 2019;28:1029–1034.
41. Kapoor R, Walters SP, Al-Aswad LA. The current state of artificial
intelligence in ophthalmology. Surv Ophthalmol. 2019;64:233–240.
42. Jammal AA, Thompson AC, Mariottoni EB, et al. Human versus machine:
comparing a deep learning algorithm to human gradings for detecting
glaucoma on fundus Photographs. Am J Ophthalmol. 2020;211:123–131.
43. Balyen L, Peto T. Promising artificial intelligence-machine learning-deep
learning algorithms in ophthalmology. Asia Pac J Ophthalmol (Phila).
2019;8:264–272.
44. Raman R, Srinivasan S, Virmani S, Sivaprasad S, et al. Fundus
photograph-based deep learning algorithms in detecting diabetic
retinopathy. Eye (Lond). 2019;33:97–109.
45. Ting DSW, Pasquale LR, Peng L, et al. Artificial intelligence and deep
learning in ophthalmology. Br J Ophthalmol. 2019;103:167–175.
46. Lim G, Bellemo V, Xie Y, et al. Different fundus imaging modalities and
technical factors in AI screening for diabetic retinopathy: a review. Eye Vis
(Lond). 2020;7:21.
47. Pasquale LR, Hyman L, Wiggs JL, et al. Prospective study of oral health
and risk of primary open-angle glaucoma in men: data from the health
professionals Follow-up Study. Ophthalmology. 2016;123:2318–2327.
48. Wong TY, Mitchell P. The eye in hypertension [published correction
appears in Lancet. 2007 Jun 23;369(9579):2078. Wong, Tien [corrected to
Wong, Tien Yin]]. Lancet. 2007;369(9559):425–435.
49. Jeganathan VS, Wang JJ, Wong TY. Ocular associations of diabetes other
than diabetic retinopathy. Diabetes Care. 2008;31:1905–1912.
50. Seo JY, Hwang SS, Kim JH, et al. Distribution of glycated haemoglobin
and its determinants in Korean youth and young adults: a nationwide
population-based study. Sci Rep. 2018;8:1962. Published January 31, 2018.
doi:10.1038/s41598-018-20274-8.
51. Mills KT, Bundy JD, Kelly TN, et al. Global Disparities of Hypertension
Prevalence and Control: A Systematic Analysis of Population-Based
Studies From 90 Countries. Circulation. 2016;134:441–450.
52. Nuttall FQ. Body mass index: obesity, BMI, and health: a critical review.
Nutr Today. 2015;50:117–128.
Al-Aswad et al Asia-Pacific Journal of Ophthalmology � Volume 10, Number 5, September/October 2021
472 | https://journals.lww.com/apjoo � 2021 Asia-Pacific Academy of Ophthalmology.