REAL-TIME EVALUATION OF THE HUMANITARIAN RESPONSE … · REAL-TIME EVALUATION OF THE HUMANITARIAN...
57
IASC REAL-TIME EVALUATION OF THE HUMANITARIAN RESPONSE TO THE HORN OF AFRICA DROUGHT CRISIS ETHIOPIA FEBRUARY 2012 Lewis Sida, Bill Gray and Eleni Asmare. Funding for the evaluation was provided by UNICEF, OCHA, UNHCR, WFP, FAO and Save the Children
Transcript of REAL-TIME EVALUATION OF THE HUMANITARIAN RESPONSE … · REAL-TIME EVALUATION OF THE HUMANITARIAN...
IASC REAL-TIME EVALUATION
OF THE HUMANITARIAN RESPONSE TO THE HORN OF AFRICA
DROUGHT CRISIS
ETHIOPIAFEBRUARY 2012
Lewis Sida, Bill Gray and Eleni Asmare.
Funding for the evaluation was provided by UNICEF, OCHA, UNHCR, WFP, FAO and Save the Children

2 3
2 3
Acknowledgements
The team would like to thank the Government of the Federal Democratic Republic of Ethiopia for facilitating and participating in this evaluation so comprehensively. In particular the evaluation would like to thank state minister Ato Mitiku Kassa for opening the RTE findings workshop and Ato Yehualashet Medhin from ARRA and Ato Tadesse Bekele from DRMFSS for supporting the enquiry throughout.
The evaluation team would also like to thank the humanitarian coordinator Mr Eugene Owusu for his support and participation and the team from OCHA who facilitated the work in every way. In particular Ms Amy Martin who oversaw the process and Ms Tsigemariam Yohannes who so ably managed the very challenging logistics and administration. The evaluation team would like to thank UNHCR for facilitating a week long visit to Dolo Ado, in particular Ms Tracey Buckenmeyer who organised the visit and Mr Steven Kajirwa, acting officer in charge. The evaluation team would also like to thank USAID for participating actively, in particular Mr John Graham from whose insight we benefited.
The evaluation team would like to thank some of the hundreds of people from NGOs, donor agencies, government and UN agencies who gave up their time to help the process, facilitated field visits, gave time to be interviewed or attended the various workshops. Finally we would like to thank all of the communities we visited, who generously gave us their hospitality and valuable time.

4 5
4 5
Contents
Executive Summary. Page 09
Section 1 Introduction. Page 14
1.1 Objectives and purpose. Page 141.2 Method. Page 14
Section 2 The context of Ethiopia. Page 16 2.1 The drought of 2011. Page 19
Section 3 Findings. Page 21
3.1 Early warning and needs assessment. Page 213.1.1 Refugees. Page 273.2 Strategy, operational planning and resource mobilisation. Page 283.2.1 Water. Page 313.2.2 Food security, livelihoods and livestock. Page 323.2.3 Education and protection. Page 343.2.2 Gender Page 353.2.4 Resource mobilisation. Page 363.2.5 Refugees. Page 383.3 Coordination. Page 413.4 Response covering the needs and set standards. Page 453.4.1 Refugees. Page 47
Section 4 Conclusions and recommendations. Page 48
Annexes.
1. Terms of reference. 2. People interviewed. 3. Ethiopia overview. 4. Focus group and household interviews. 5. Crude mortality in Dolo Ado. 6. Timeline.
6 7
Abbreviations and acronyms
ARRA Administration for Refugee and Returnee Affairs
AWD Acute Watery Diarrhoea
CF Contingency Fund
CMR Crude Mortality Rate
CRS Catholic Relief Services
CSB Corn Soya Blend
DFID UK Department for International Development
DPPB Disaster Preparedness and Prevention Bureau (regional)
DRMFSS Disaster Risk Management and Food Security Sector
ERC Emergency Relief Coordinator
ESFRA Ethiopian Strategic Food Reserve Agency
EWS Early Warning System
FAO UN Food and Agriculture Organisation
GDP Gross Domestic Product
GFDRE Government of the Federal Democratic Republic of Ethiopia
GOAL Irish NGO
HARP Household Asset Rebuilding Programme
HEA Household Economy Analysis
HRD Humanitarian Requirements Document
HRF Humanitarian Response Fund
IASC Inter-Agency Standing Committee
INGO International Non-Governmental Organisations
IP Implementing Partner
6 7
JEOP Joint Emergency Operation Programme
Kebele Ethiopian administrative unit, equivalent to a village
MSF Medecins sans Frontiers
MUAC Mid-Upper Arm Circumference
NGO Non-Government Organisation
OCHA UN Office for the Coordination of Humanitarian Affairs
OFDA US Office for Foreign Disaster Assistance
OTP Outpatient Therapeutic Programme
PLI Pastoralist Livelihoods Initiative
PSNP Productive Safety Net Programme
REST Relief Society of Tigray
RFM Risk Finance Mechanism
RTE Real Time Evaluation
SAM Severely Acutely Malnourished
SC Stabilisation Centres
SCUS/UK Save the Children US/UK
SMAC Strategic multi-agency co-ordination forum
SNNPR Southern Nations, Nationalities and Peoples Region
TFP Therapeutic Feeding Programme
TMAC Technical multi-agency coordination forum
UN United Nations
UNICEF UN Children’s Fund
UNHCR UN High Commission for Refugees
USAID United States Agency for International Development
Woreda Ethiopian administrative unit, equivalent to a district.
WFP UN World Food Programme

8 9
8 9
Executive Summary
The severe drought in the Horn of Africa in 2011 affected large areas of southern Ethiopia, leaving hundreds of thousands of people in need of assistance. The Government of Ethiopia and
its international partners responded at scale to these threats, providing assistance to millions and offering sanctuary to tens of thousands of Somali refugees.
This real time evaluation (RTE) is one of four commissioned by the Inter-Agency Standing Commit-tee (IASC), looking at the response to the Horn of Africa drought and food security crisis. In total some US $2.8bn was raised for the response, with US $820m going to Ethiopia. In such large scale operations it is now standard practice to commission inter-agency evaluations.
The evaluation was undertaken during February 2012 and as such fell somewhat short of being ‘real time’ as most of the major interventions had taken place. This offered advantages in terms of data availability however, allowing for a more in-depth analysis of the response. As a result the evalu-ation was able to carry out some primary data collection, interviewing over 250 households and conducting 40 separate community focus group interviews. In addition a wide number of stake-holder interviews (99) formed part of the analysis, as did document review and a two day validation workshop, opened by the state minister for disaster management. The evaluation commissioned a separate context analysis by Oxford University. Recommendations were developed during the validation workshop with key stakeholders.
FindingsThe findings are set out against the terms of reference, which were generic to all four Horn of Africa evaluations. The four key areas of enquiry were:
1. Needs assessment and early warning.2. Strategy, operational planning and resource mobilisation.3. Coordination.4. Response against the needs and set standards.
Broadly the evaluation concluded that the response to the 2011 drought in Ethiopia saved lives. The results are an improvement on earlier years and are largely due to a number of predictable systems that have been put in place as well as the additional support provided by international partners. Whilst the response saved lives, it is less clear that it protected livelihoods. In the predominantly agricultural areas of the southern highlands people sold assets and borrowed money to make it through the most difficult periods. In the livestock dependent dry-lands, people lost animals – impacting their livelihoods. However, for many this may not have been as bad as previous droughts owing to the existence of innovative marketing linkages forged during
10 11
earlier programmes. Nevertheless those with the smallest herds, and mostly marginal living, may have been hit hardest.Allowing refugees sanctuary in Ethiopia also saved lives, although the refu-gee assistance operation was not initially as successful. Mortality and malnutrition remained high for some months and whilst these are now under control the situation remains fragile.
Needs assessment and early warning.The needs assessment system in Ethiopia is highly efficient, having evolved over many years into one of the world’s most sophisticated. It uses well practised methods and has a significant amount of data that allows detailed comparison with previous years. It is carried out twice yearly and is multi-agency.
Whilst the technical process yields accurate answers, the results are not immediately released, needing to go through a political process of approval first. This both delays the response and usu-ally reduces the numbers to unrealistically low levels. In 2011 this resulted in the numbers of people affected having to be revised upwards twice, losing valuable response time (the peak of malnutri-tion from the hunger gap in SNNP for instance was in June, but their appeal was not revised until July). This is counter-productive as the needs assessment method used allows for prediction – theoretically meaning that responses can prevent malnutrition, rather than reacting to it (when arguably it is already too late). Such an approach also reduces costs.
If the assessment process for food needs is highly sophisticated, it is less so for other sectors. The water supply operation in the worst affected areas of Somali region and Borena reached some four million people, and yet it relied almost entirely on emergency trucking. This was hostage to commercial firms and consequently was expensive and at times unreliable. Given that water supply is in many ways like food security – a chronic as well as acute problem – a more predictable and sophisticated solution appears to be the way forward.
The refugee influx from Somalia into southern Ethiopia could have, and should have, been better anticipated. Despite the obviously deepening crisis in that country there was little urgency in the preparation for their arrival in southern Ethiopia, meaning the death rate and acute hunger remained high for weeks after their arrival. The emergency response mobilised did eventually stabilise the situation, although arguably this could have happened faster.
n Main finding: The needs assessment and early warning system is technically good but the political approval process slows the system down.
n Main recommendation: Ensure the early warning and needs assessments are released early with figures accurately matching the technical findings.
10 11
Strategy, operational planning and resource mobilisation.Ethiopia has put in place a long term strategy for tackling chronic vulnerability with a large scale safety net programme. Although the formal national disaster management policy is not approved, this de facto strategy has contributed to better outcomes for vulnerable families in times of hardship.
Alongside the safety net programme another component of the predictable system is a large scale expansion of decentralised health and nutrition services. This government system, supported by international partners, served over 329,000 children with severe acute malnutrition, with recovery rates comfortably above international standards.
Despite the presence of these predictable systems, there was still a need for ‘emergency’ type responses, constituting a humanitarian appeal for food, water, health and nutrition services and emergency education. Donors responded well to the appeal, and to its later revision, meaning the needs were largely met. Non-government partners (NGOs) also mobilised well to the emerging need both in terms of their own efforts and in support of the established system (for instance by helping with logistics).
The strategy with regard to ‘acute’ response increasingly also contains elements of predictability. Ethiopia has long had a food security reserve that agencies such as WFP can borrow against with secure pledges; long established NGOs and UN agencies can increase the scale at which they work if there is greater need. The safety net programme also introduced a new ‘acute’ mechanism in 2011, called ‘risk financing’. Whilst in practice it was somewhat late, the idea itself shows promise.
The predictable systems of safety net and localised health and nutrition care work best in the densely populated agricultural areas, typically in the highlands. In the dry lands of southern Ethiopia where people are mostly livestock herders, ‘pastoralist’, these systems have been less uniformly successful. The safety net programme is harder to administer and often less predictable, whilst health services suffer from needing to cover large, sparsely populated areas. Nevertheless, in these areas too the response was improved in 2011 with innovative measures aimed at livestock showing some impact. Previous schemes aimed at making market links for herders meant they could sell their animals early, before drought weakened them. Mobile health clinics also meant health and nutrition services did reach further. Cumulatively these measures, combined with a large scale and largely effective emergency food and water distribution, meant that there was not the large scale mortality seen in earlier similar droughts.
Work to understand precisely the impact of the drought in 2011 is ongoing. It seems that while lives were saved, livelihoods were definitely under stress. Pastoralists lost livestock, although arguably not at the same scale as before. This has probably meant those with the smallest herds were worst affected, and for some that has meant trying to find other ways of making a living. In the highland agricultural areas people have sold assets and borrowed, eroding the gains of earlier better years. This suggests there is a race between development on the one hand, lifting people out of poverty, and successive shocks on the other, moving them back towards subsistence.
12 13
n Main finding: The strategy of having long term predictable systems in place addressing chronic and acute vulnerability reduces suffering and saves lives.
n Main recommendation: Work towards making more of the acute response system predictable, including further developing systems such as Risk Finance Mechanism (RFM), livestock measures and better developing water responses.
CoordinationThe coordination system in Ethiopia is highly evolved as a result of many years of emergency response. Government leads sector coordination through the line ministries and these change from regular development business to emergency as required. Decentralisation and federalism in Ethiopia has also meant an increasing role for the regions and districts in Ethiopia with regions such as Somali mobilising their emergency response at the end of 2010.
Because of the decentralised nature of disaster response there is an increasing need for the disaster management policy to be finalised. This would confer formal authority on many of these structures, giving them the resources to better prepare.
The international system has long supported government coordination in emergencies, both through technical participation and strategically. The Ethiopian humanitarian country team meets regularly and in 2011 was able to make decisions and take on difficult issues. In 2011 the Government also introduced a new strategic and technical multi-agency coordination mechanism, allowing for the better interface of the international and national systems. This showed promise and could in future emergencies meet more regularly.
Despite the generally well functioning coordination, there remains a level of mistrust throughout the system which is counter-productive. The Federal level anticipates that regions will exaggerate their problems – leading to the slow needs analysis outlined above, and the regions often suspect districts in the same way. The Government equally is wary of NGOs, putting in place a series of legis-lative measures aimed at scrutinising the sector. This evaluation has found that all components of the system – all partners – are needed to ensure the best outcomes, with NGOs playing a valuable role in supporting government at a local level.
n Main finding: Coordination in Ethiopia works well and can be further enhanced with more decentralisation and more systematic linkage between government and its international partners.
n Main recommendation: Finalise the new disaster risk management policy, and work with the regions to enhance their capacity.
12 13
Response against the needs and set standardsAs outlined in the general findings, the response saved lives by providing essential support, mostly on time. Nutrition recovery rates were higher than the international minimum standard and better than previous years, despite a higher caseload. Standards for food rations, health care and water provision were also within these international standards, although water was only enough for ‘survival’.
The evaluation has also found relatively high levels of beneficiary satisfaction, with a majority receiving the assistance they needed most. This did not mean perfection however, and there are improvements that can be made across the board, especially with regard to timeliness and coverage.
In contrast, the initial refugee response did not meet international standards and as a result led to excess mortality. Once this was realised a reasonably effective response was mobilised, and the situation stabilised, albeit several months later.
n Main finding: Internationally recognised standards have been met with a significant degree of beneficiary satisfaction, apart from in the early refugee response.
n Main recommendation: Scale up livestock response measures and asset (livelihoods) protection measures.
14 15
Section 1. Introduction
1. The crisis of food security and severe drought that hit parts of the Horn of Africa in 2011 affected up to 13 million1 people. In Somalia tens of thousands died due to starvation and famine.
2. The international community, through various appeals in four principally affected countries (Kenya, Ethiopia, Somalia and Djibouti), mobilised over US $2.8 billion,2 with another US $721 million3 pledged. As is required by the Inter-Agency Standing Committee (IASC) for such a large-scale response, the Emergency Relief Coordinator called for an IASC Real Time Evaluation (RTE) to assess the overall response. The full RTE process comprises four separate assessment missions leading to four different reports (plus an additional synthesis report) covering country responses in Somalia, Kenya and Ethiopia, and regional mechanisms and support structures.
3. This evaluation report looks at the response in Ethiopia primarily in 2011 but includes analysis from when rains first failed in 2010 into 2012 when the evaluation was conducted.
1.1 Objectives and purpose
4. The main objective of the IASC RTE process is to provide real-time feedback to the Humanitarian Country Teams, look at the lessons learned for the future and to get the views of affected people on the quality of the response. The scope is the provision of relief and the transition to recovery.
5. The RTE was broadly asked to look at four areas. These were:
n situation, context and needsn strategic and operational planning and resource mobilisationn coordination and connectednessn response covering the needs and set standards
6. A set of more specific questions are elaborated in the Terms of Reference (at annex 1).
1.2 Method
7. A RTE is conceived of as a light, participatory process, able to provide a snapshot of the response and enable those in charge to make strategic adjustments where necessary. In reality the Ethiopia RTE took place as the main relief operations were winding down, or moving into a different phase. This meant there was the opportunity to adopt some of the characteristics of a standard evaluation, marrying the best of both techniques.
1. Source: OCHA (2011a). Horn of Africa Drought: Country-based Pooled Funds in 2011.
2.Source: http://fts.unocha.org Accessed on 24/04/2012.
3. Source: http://fts.unocha.org Accessed on 24/04/2012.
14 15
8. The evaluation used the standard suite of social science research techniques, namely document review, interviews with key stakeholders, focus group interviews with affected communities, household interviews with affected people and visits to projects dealing with issues from nutrition to water provision. Projects were sampled to ensure there was coverage of the main areas of expenditure and interviews were undertaken with users and providers (so nutrition projects would be analysed by visiting facilities, examining standards and data, interviewing health staff and mothers of affected children, as well as NGO staff and often following up in the provincial capital).
9. The evaluation took place in February 2012 and constituted three weeks of field work in Ethiopia. The evaluation team visited and conducted research in the Borena region of Oromia, in three zones in the Southern Nations region (Wolayta, Sidama and Bedawacho), in Gode and Jijiga zones, Somali region and the Dolo Ado refugee camps. The team spent a week together initially in Addis Ababa interviewing agency and government staff and then split to cover as much ground as possible in the following two weeks.
10. The team consisted of three core members and additional team members who were contracted for field visits. In each of three substantive field visits (Oromia, Somali and Dolo Ado), there was an additional (national) team member contracted to organise interviews. These team members in turn hired extra technical staff and enumerators as needed. There were four additional team members of ‘professional’ level who worked on interviews and approximately 15 enumera-tors. Focus group and household interviews were ‘semi structured’, with a few key areas of enquiry. Household interviews were the more structured of the two, allowing for a spreadsheet to be developed ascribing numerical scores to qualitative responses, and thus allowing quantitative analysis. Annex 4 sets out the results from focus group and household interviews.
11. A context analysis was undertaken by Oxford University (OU) (reproduced at annex 3). Document analysis was also carried out by the OU team and the evaluation team. The team used the document review to generate evidence referenced in the main evaluation report.
12. The results were triangulated in part using the responses from affected people, but additionally with the wealth of secondary data and research that exists in Ethiopia. There were ‘feedback sessions’ in two of the four contexts visited, and a two day ‘validation’ workshop with almost 100 participants opened by the state minister for Disaster Risk Management and Food Secu-rity Sector (DRMFSS). The recommendations were developed during the two day validation work-shop in Addis Ababa in March 2011. Representatives of government, donors, UN agencies and NGOs developed the recommendations in a participatory way on the basis of the initial evaluation findings.
Key stakeholder interviews 98 (47 NGO, 32 UN, 4 donor, 15 Government of Ethiopia)
Focus group interviews 40
Household interviews 250
13. The draft report was peer reviewed by a noted Ethiopia expert.
16 17
Section 2. The context of Ethiopia4
14. Ethiopia has suffered a series of droughts of varying intensities, most recognised over the past 40 years, but recorded for over 100 years. While droughts affecting the densely populated northern highlands are best known, those impacting the southern highlands and pastoralist economies have predominated over the past 15 years.
15. Dramatic variations in the climate contribute to food insecurity. Rainfall data for the period 1967 to 2000 indicate that annual variability in rainfall across different zones in Ethiopia ranged from a low of 15% to a high of 81% – among the highest in the world. Ethiopia is ranked ninth in the world in terms of overall vulnerability to climate change.5 The country has a range of climate zones described by altitude and latitude,6 but has recently experienced an increase in extreme climatic events and variations in seasonal and annual rainfall.7 These factors make the country more vulner-able to predictable cyclical events such as La Nina phenomenon in the eastern Pacific. In late 2010 and 2011 the La Nina phenomenon caused below average rainfall in both the October to December and March to May seasons.
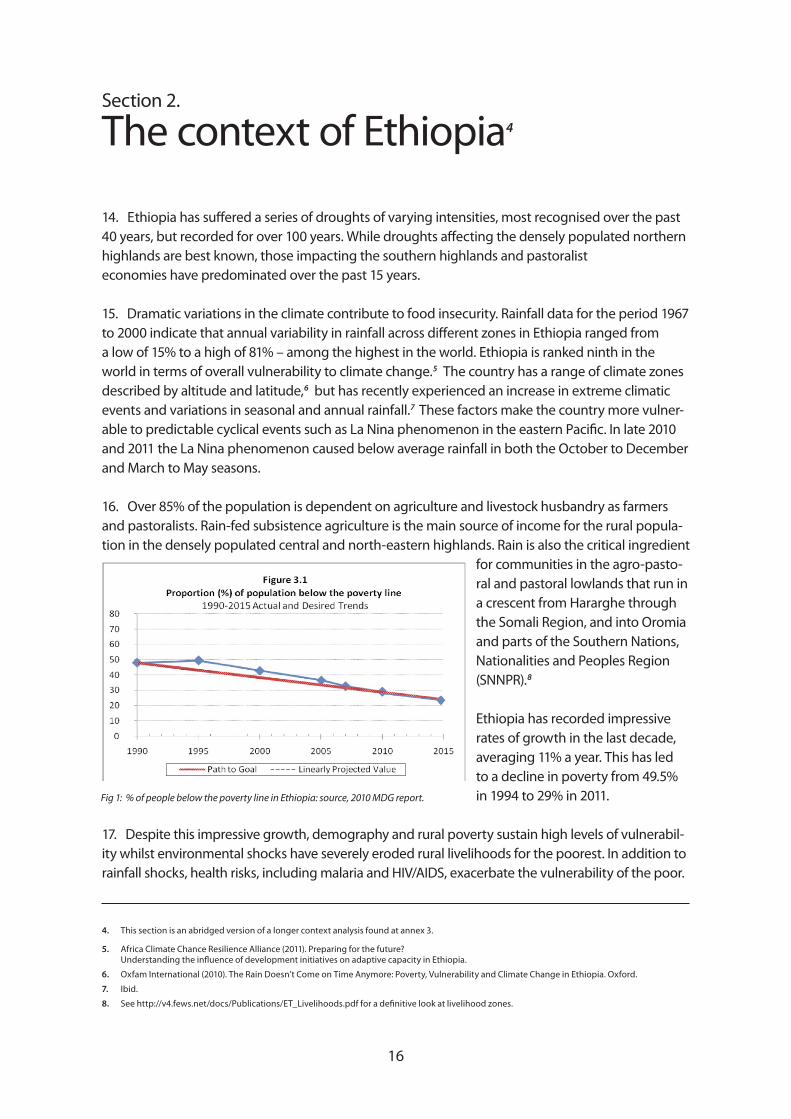
16. Over 85% of the population is dependent on agriculture and livestock husbandry as farmers and pastoralists. Rain-fed subsistence agriculture is the main source of income for the rural popula-tion in the densely populated central and north-eastern highlands. Rain is also the critical ingredient
for communities in the agro-pasto-ral and pastoral lowlands that run in a crescent from Hararghe through the Somali Region, and into Oromia and parts of the Southern Nations, Nationalities and Peoples Region (SNNPR).8
Ethiopia has recorded impressive rates of growth in the last decade, averaging 11% a year. This has led to a decline in poverty from 49.5% in 1994 to 29% in 2011.
17. Despite this impressive growth, demography and rural poverty sustain high levels of vulnerabil-ity whilst environmental shocks have severely eroded rural livelihoods for the poorest. In addition to rainfall shocks, health risks, including malaria and HIV/AIDS, exacerbate the vulnerability of the poor.
4. This section is an abridged version of a longer context analysis found at annex 3. 5. Africa Climate Chance Resilience Alliance (2011). Preparing for the future? Understanding the influence of development initiatives on adaptive capacity in Ethiopia.
6. Oxfam International (2010). The Rain Doesn’t Come on Time Anymore: Poverty, Vulnerability and Climate Change in Ethiopia. Oxford.
7. Ibid.
8. See http://v4.fews.net/docs/Publications/ET_Livelihoods.pdf for a definitive look at livelihood zones.
Fig 1: % of people below the poverty line in Ethiopia: source, 2010 MDG report.
16 17
18. Food security was also affected in 2011 by increasing food prices. By June 2011 for instance, the nominal price of white maize in Addis Ababa was 56% higher than the five year average and 61% higher than the same month in 2010. 9 Inflation has been an ongoing problem in Ethiopia. In July 2011 the Central Statistics Agency announced that year-on-year inflation had reached 40.6%, while food inflation reached 52.3%.10
19. Much of the drought affected area, at least initially in 2010, was in Ethiopia’s pastoral areas. Ethiopia’s pastoralist population is estimated at 10 million, around 15% of the country’s total.11 Pas-toralists occupy over 60% of the Ethiopian landmass12 and own a large proportion of the country’s livestock, itself the largest national herd in Africa and the tenth largest in the world. The livestock sector is of great economic importance. It is the second largest foreign exchange earner after coffee, providing around 12-15% of GDP and 25-30% of agricultural GDP.13
20. Pastoralist and agrarian populations alike face almost constant crisis. Survey data for Ethiopia as a whole shows that, between 1999 and 2004, more than half of all households in the country experienced at least one major drought shock.14 The southern middle-highland and lowlands of Ethiopia have suffered at least five droughts in this century alone (2000, 2002, 2006, 2008, 2010-11). Pastoralists are in crisis and have been “fire fighting, one drought after another, and have lttle time for anything else.” 15 Environmental degradation has been worsening due to increasingly prolonged drought conditions and there has been a breakdown of customary rangeland management prac-tices. Increasing population density is also putting pressure on scarce resources.
21. The patterns of pastoralist mobility are changing. Commercialisation of farming and changes in livestock ownership patterns are affecting access to land.16 Mobility is also complicated by international borders and cross-border policies that focus more on security than natural resource management.17
22. Increases in road networks, urban markets, and agricultural investment have benefited richer pastoralists better able to access capital. Wealthier pastoralists are able to adapt by haymaking and investing more in camels and goats than cattle. Inequality is increasing, and those with only small herds have difficulty navigating obstacles that come with land enclosures, private boreholes, or the need to pay for water trucking or fodder.18 Poorer households who turn to agriculture often end up with poor quality land, leaving them vulnerable to environmental hazards. Those most at risk during drought periods are female-headed households with small numbers of livestock, large households and poor households without cash reserves or savings.
23. Ethiopia has been at the forefront of early warning for many years. The system developed since the mid 1980s, linked more recently to household economy analysis and the Productive Safety 23.
9. http://reliefweb.int/sites/reliefweb.int/files/resources/Full_report_188.pdf
10. World Food Programme. Ethiopia Monthly Market Watch, July, 2011. Addis Ababa.
11. http://af.reuters.com/article/ethiopiaNews/idAFL5E7KD2KJ20110913. blah
12. PFE, IIRR and DF, Pastoralism and Land: Land Tenure, administration and use in pastoral areas of Ethiopia.
13. Africa Climate Chance Resilience Alliance (2011). Preparing for the future? Understanding the influence of development initiatives on adaptive capacity in Ethiopia.
14. Ethiopia Climate Risk Fact Sheet, World Bank, 2008.
15. Pavenello, S and Levine, S (2011). Rules of the range: natural resource management in Kenya-Ethiopia border areas. ODI, London.
16. http://www.operationspaix.net/DATA/DOCUMENT/4215~v~Conflict in the Somali Region of Ethiopia Can Education Promote Peace-Building .pdf)
17. Levine, Crosskey and Abdinoor (2011). System Failure? Revisiting the problems of timely response to crisis in the Horn of Africa.
18. Ibid.
18 19
Programme (PSNP), has ensured that in chronic conditions the most vulnerable areas and house-holds within them are identified on time and their needs addressed.
24. The PSNP is designed to address chronic food insecurity by enabling the chronically poor to graduate from dependency over a number of years. It does this through a mix of food, cash-for-work, cash transfers and asset replacement. It currently targets 7.6 million households, and is ac-knowledged as the only social protection programme targeting settled and pastoralist communities alike. In recognition of the difference between chronic and emergency conditions, a Risk Financing Mechanism and Contingency Fund have been introduced to permit a scaling up of support based on a set of established early warning indicators and agreed district-level (called Woreda in Ethiopia) contingency plans.
25. For those deemed to be experiencing transitory food insecurity, there is an established ‘relief’ system, governed by the twice yearly release of a Humanitarian Requirements Document. This too is linked to the early warning system and focuses predominantly on the distribution of free food, although it also contains elements of health, nutrition, water and education.
26. Relief food is brought into the country by the World Food Programme (WFP) and distributed by the Ethiopian government’s DRMFSS. An NGO consortium called the Joint Emergency Operation Programme also distributes USAID food imported directly. This is led by Catholic Relief Services, the other partners being CARE, World Vision, Food for the Hungry Ethiopia, Save the Children US, Save the Children UK, and the Relief Society of Tigray.
27. The Somali region is an exception to this with the WFP operating a “hubs and spokes” distribu-tion system of five extended delivery points (hubs) and over 300 final distribution points (spokes), from which government then distributes. While the system is often subject to security concerns, re-quiring it to travel in convoys and with military escorts, it has encouraged commercial distributors to operate in remote areas either as contractors to the WFP or through joining the WFP convoy system.
28. In recognition of the acute malnutrition facing children in both highland and lowland commu-nities, and in the lifesaving potential of addressing the problem at the community level, the Govern-ment of the Federal Democratic Republic of Ethiopia promoted a rapid expansion of the Outpatient Therapeutic Programme (OTP). Supported by UNICEF, and implemented between 2004 and the present, over 7,500 sites have been opened and coverage dramatically increased. This initiative has been credited as one of the main reasons that human mortality levels have decreased through successive drought events.
29. In addition to the recurrent drought-related food and nutrition crises facing Ethiopia’s own population, the country has played regular host to major refugee movements from Eritrea, Sudan and Somalia. The drought- and conflict-related refugee influx from Somalia in 2011 posed a major logistical challenge to the government and its international community partners, compounded by the security problems associated with Ethiopia’s opposition to the insurgency in Somalia itself.
16. http://www.operationspaix.net/DATA/DOCUMENT/4215~v~Conflict in the Somali Region of Ethiopia Can Education Promote Peace-Building .pdf)
17. Levine, Crosskey and Abdinoor (2011). System Failure? Revisiting the problems of timely response to crisis in the Horn of Africa.
18. Ibid.
18 19
2.1 The drought of 2011
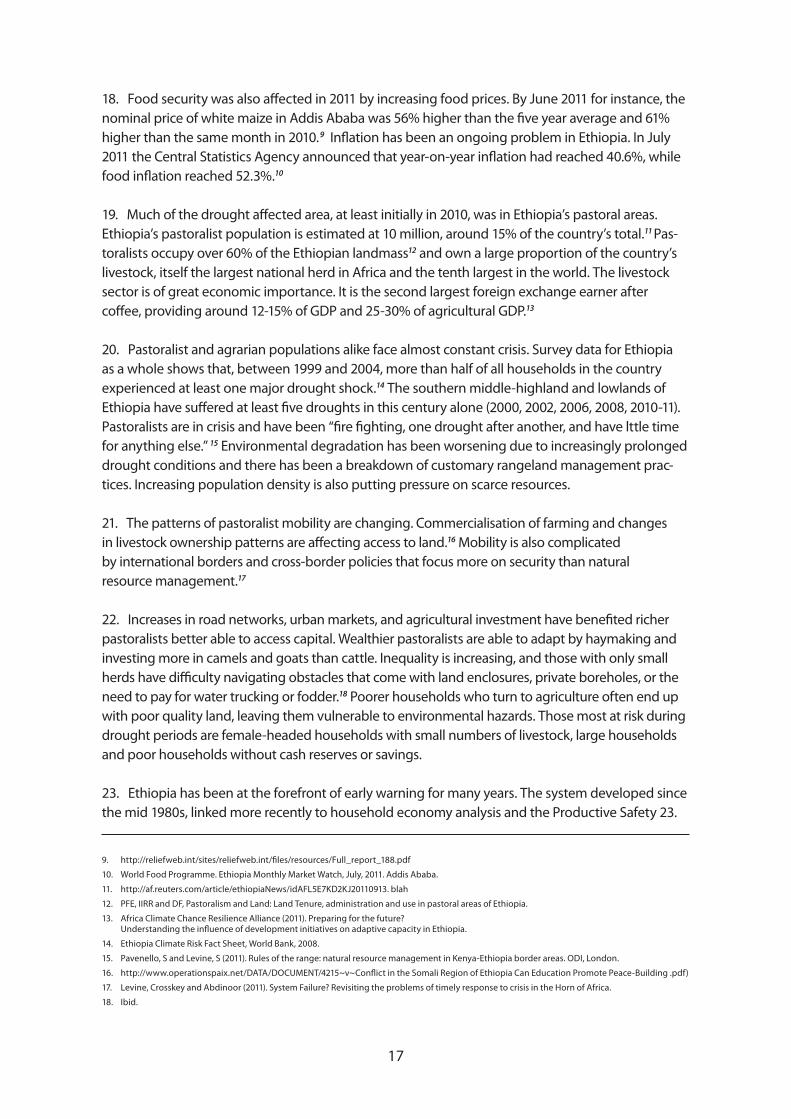
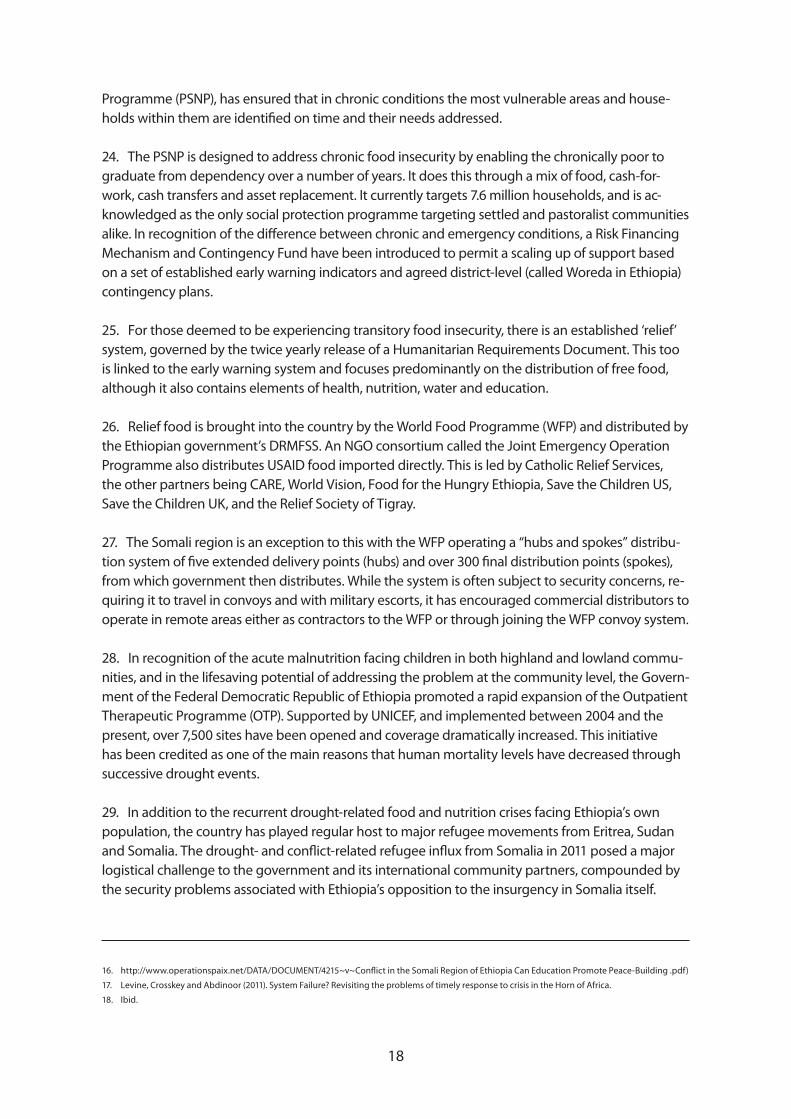
30. The effects of the Horn of Africa drought started to be felt in Ethiopia in late 2010. Whilst some were calling it the worst drought in 60 years, there remains some dispute as to its severity in Ethiopia. What is clear is that for some areas it was the driest on re-cent record (see fig 3 below). Three successive rain failures in the lowland arid and semi-arid areas of Ethiopia,19 and one failure of the short rains in the southern highlands, led to food insecurity, migration and asset disposal of varying magnitudes, with associated differen-tial impacts on human and animal health and household economies.
31. There is no straightforward explanation of the interplay between drought, vulnerability, livelihoods and public policy that frames food security crises in Ethiopia (all of which is com-pounded by conflict in neighbouring countries). The different livelihood strategies of settled and transhumant populations deployed in times of rain failure (and in particular concurrent failed rains)is balanced by the response of Government and its international partners to the resultant shocks
19. This quote was widely used at the time. See for instance the BBC on June 28, 2011 at http://www.bbc.co.uk/news/world-africa-13944550
Fig 2: areas of Ethiopia affected by food insecurity.
Fig 3: rainfall patterns in parts of northern Kenya and Southern Ethiopia.
Source: FEWS NET/USGS & FEWS NET/NOAA Graphics: FEWS NET
20 21
and consequent needs. This is compounded in the long term by the impact of development policy, a burgeoning population and a changing climate.
32. In Ethiopia, the failure of the rains and the ensuing drought manifested itself in three distinct ways.
1. The impact of three successive rain failures in the southern lowlands on pastoral and agro-pastoral communities was complex and will be further analysed in the first section of the findings on needs and context. 20
2. The failure of the short Belg rains in the traditionally food insecure, southern highlands, led to many people losing their main crops, putting vulnerable families under huge stress.
3. The same rain failures in Somalia (in contiguous areas across the national frontier) led – with the further complication of the escalation of Somalia’s insurgency – to famine and the mass movement of the population. Many of those found sanctuary in Ethiopia as refugees.
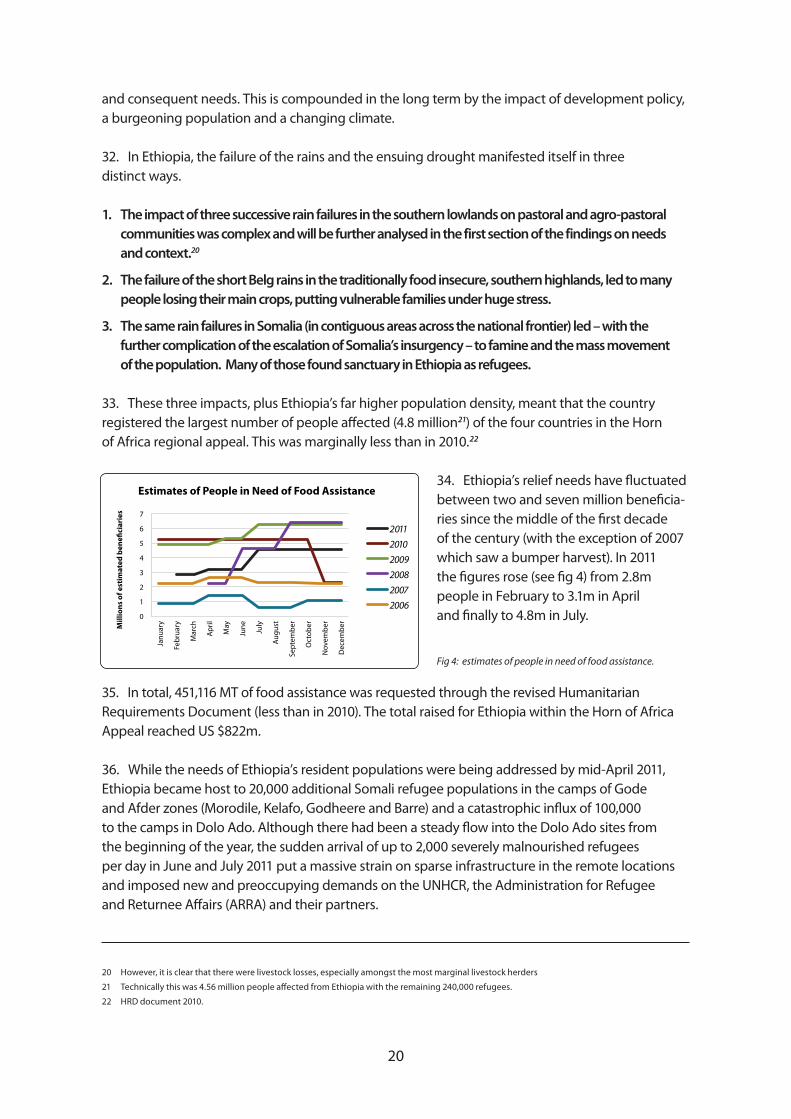
33. These three impacts, plus Ethiopia’s far higher population density, meant that the country registered the largest number of people affected (4.8 million21) of the four countries in the Horn of Africa regional appeal. This was marginally less than in 2010.22
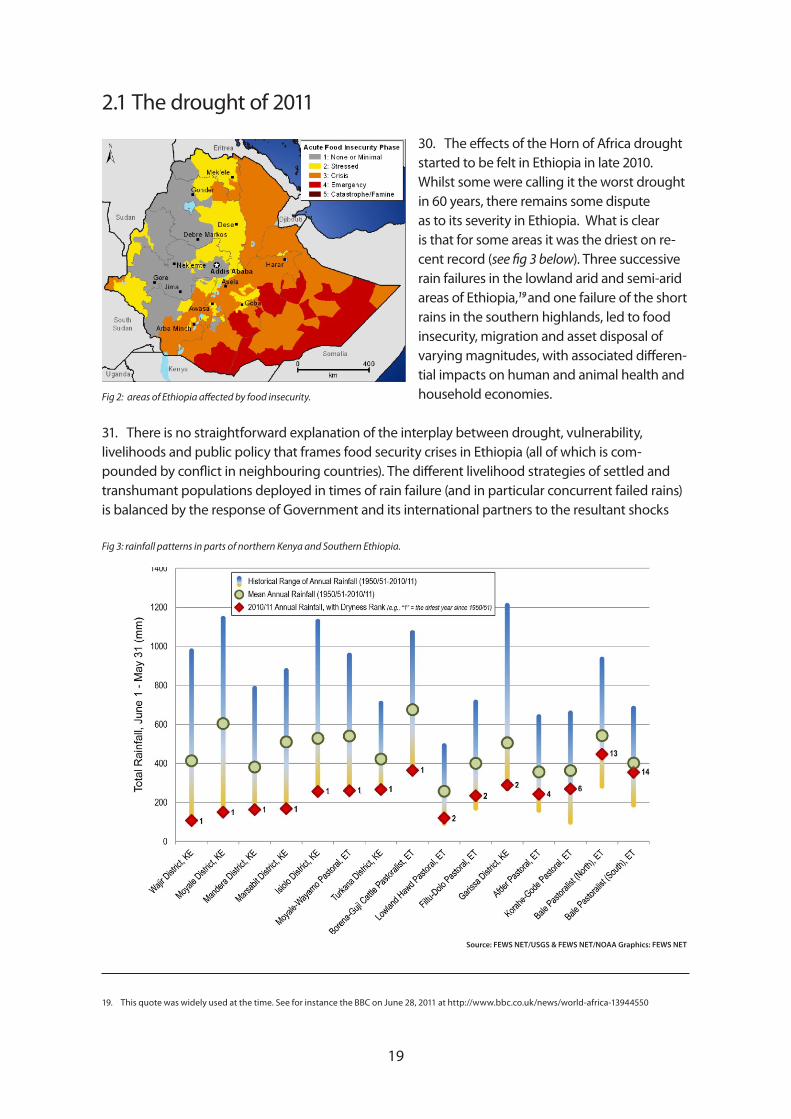
34. Ethiopia’s relief needs have fluctuated between two and seven million beneficia-ries since the middle of the first decade of the century (with the exception of 2007 which saw a bumper harvest). In 2011 the figures rose (see fig 4) from 2.8m people in February to 3.1m in April and finally to 4.8m in July.
35. In total, 451,116 MT of food assistance was requested through the revised Humanitarian Requirements Document (less than in 2010). The total raised for Ethiopia within the Horn of Africa Appeal reached US $822m.
36. While the needs of Ethiopia’s resident populations were being addressed by mid-April 2011, Ethiopia became host to 20,000 additional Somali refugee populations in the camps of Gode and Afder zones (Morodile, Kelafo, Godheere and Barre) and a catastrophic influx of 100,000 to the camps in Dolo Ado. Although there had been a steady flow into the Dolo Ado sites from the beginning of the year, the sudden arrival of up to 2,000 severely malnourished refugees per day in June and July 2011 put a massive strain on sparse infrastructure in the remote locations and imposed new and preoccupying demands on the UNHCR, the Administration for Refugee and Returnee Affairs (ARRA) and their partners.
201120102009200820072006
Estimates of People in Need of Food Assistance
Mill
ions
of e
stim
ated
ben
e�ci
arie
s
Janu
ary
Febr
uary
Mar
ch
Apr
il
May
June July
Augu
st
Sept
embe
r
Oct
ober
Nov
embe
r
Dec
embe
r
20 However, it is clear that there were livestock losses, especially amongst the most marginal livestock herders
21 Technically this was 4.56 million people affected from Ethiopia with the remaining 240,000 refugees.
22 HRD document 2010.
Fig 4: estimates of people in need of food assistance.
20 21
Section 3. Findings
37. The response to the drought in 2011 in Ethiopia saved lives. Despite 329, 535 children being treated for severe acute malnutrition, there were few deaths associated with acute hunger.23 This is a significant improvement on earlier years. 24
38. The main reason for this improvement is the work of the Government of Ethiopia and its partners to put in place long term, predictable systems to deal with both chronic and acute need. Whilst there are improvements that can still be made – especially in timely response to acute need – there is no doubt this long term strategy is working.
39. Whilst the response saved lives, it is less clear that it protected livelihoods. This is a more complex issue to measure, and differs from region to region, but interviews for this evaluation suggest asset loss in affected areas amongst the most vulnerable. Whilst livestock deaths are the subject of much discussion, it is clear that for some marginal herders in the worst affected areas the drought significantly affected their ability to support themselves. In the highland rain-fed subsistence agricultural areas of Southern Nations, people sold assets and borrowed money to make it through the worst.
40. The decision to afford tens of thousands of Somalis sanctuary saved lives. Whilst the decision to keep the borders open to the refugees was commendable, the assistance they received fell short of that needed to prevent some people dying. The Crude Mortality Rate (CMR) remained unacceptably high until the middle of September, despite the influx beginning in April. Malnutrition was still alarmingly high at the end of November.
41. The situation in the camps was much better when this evaluation was undertaken in February, but still fragile. The onset of the rains, the security concerns, the unresolved issues around rations and cooking fuel leave considerable potential for malnutrition to rise once more.
3.1 Early warning and needs assessment
42. There is little doubt that in Borena and in SNNPR (and to a lesser verifiable degree in Somali region) the needs assessments carried out for the February 2011 drought crisis both reflected the situation on the ground and prompted responses that largely addressed the needs of the most vulnerable in the Ethiopian population.
43. The early warning (EW) system in Ethiopia has been developed over decades and is an
23 Emergency Nutrition Coordination Unit, DRMFSS.
24 The average mortality rate in feeding centres nationally in 2011 was 0.5%, less than half the 1.2% in 2008. In 2011 three times as many children were admitted into feeding centres, reflecting the increased number of centres. Using a crude comparison (which of course is not accurate, but rather indicative) this suggests several thousand children saved.
22 23
acknowledged leader both in Africa and further afield. Coupled with the Household Economy As-sessment methodology developed by Save the Children UK and adopted by the Government of Ethiopia in 2004, it provides a picture of likely short-term future events based on the most recent available data and, through reference to Household Economy Analysis (HEA) baseline information, predicts what impact this will have at zonal, district and household levels.
44. The efficacy of the EW and needs assessment systems is reduced, however, by continuing concerns over the quality of data gathered and analysed at woreda and regional bureau levels. It is further reduced by a perceived “bargaining” process between departments, administrative levels and partners which permits a consensus of the level of beneficiary need identified to be arrived at. The Government of Ethiopia hopes to mitigate this through a transition from a seasonal to an early-warning-based assessment process.
45. While the multi-agency assessment is the agreed vehicle for the establishment of a national humanitarian requirement, individual agency assessments can provide a clearer picture at the regional, zonal and woreda levels.25 All individual assessment data are submitted to line ministries and the Disaster Preparedness and Prevention Bureau at regional level. The RTE heard of a number of instances where individual partner agency assessments alerting the humanitarian community to a deteriorating local situation were followed up by verification missions by regional authorities. This duplicated efforts and resulted in the wastage of the limited resources available at regional level and below.
Estimated Beneficiaries in 2011 Humanitarian Requirements Documents
Region February HRD April Revision(% increase)
July Revision (% increase)
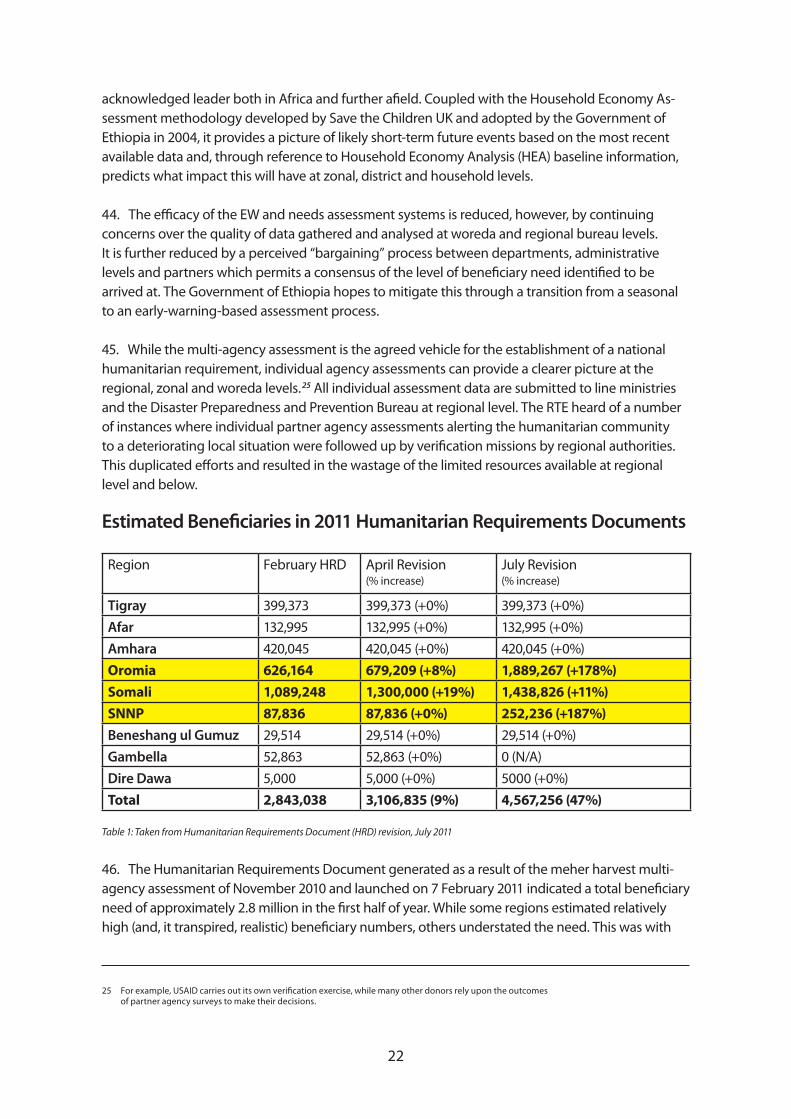
Tigray 399,373 399,373 (+0%) 399,373 (+0%)Afar 132,995 132,995 (+0%) 132,995 (+0%)Amhara 420,045 420,045 (+0%) 420,045 (+0%)Oromia 626,164 679,209 (+8%) 1,889,267 (+178%)Somali 1,089,248 1,300,000 (+19%) 1,438,826 (+11%)SNNP 87,836 87,836 (+0%) 252,236 (+187%)Beneshang ul Gumuz 29,514 29,514 (+0%) 29,514 (+0%)Gambella 52,863 52,863 (+0%) 0 (N/A)Dire Dawa 5,000 5,000 (+0%) 5000 (+0%)Total 2,843,038 3,106,835 (9%) 4,567,256 (47%)
Table 1: Taken from Humanitarian Requirements Document (HRD) revision, July 2011
46. The Humanitarian Requirements Document generated as a result of the meher harvest multi- agency assessment of November 2010 and launched on 7 February 2011 indicated a total beneficiary need of approximately 2.8 million in the first half of year. While some regions estimated relatively high (and, it transpired, realistic) beneficiary numbers, others understated the need. This was with
25 For example, USAID carries out its own verification exercise, while many other donors rely upon the outcomes of partner agency surveys to make their decisions.
22 23
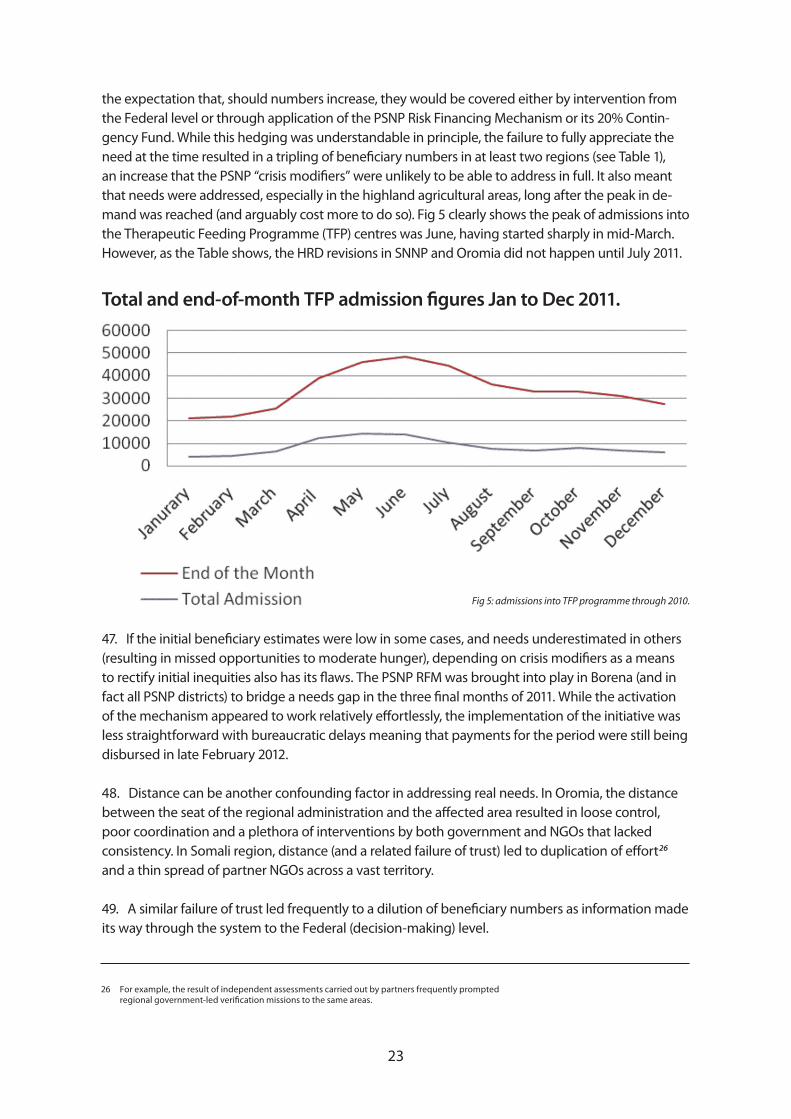
the expectation that, should numbers increase, they would be covered either by intervention from the Federal level or through application of the PSNP Risk Financing Mechanism or its 20% Contin-gency Fund. While this hedging was understandable in principle, the failure to fully appreciate the need at the time resulted in a tripling of beneficiary numbers in at least two regions (see Table 1), an increase that the PSNP “crisis modifiers” were unlikely to be able to address in full. It also meant that needs were addressed, especially in the highland agricultural areas, long after the peak in de-mand was reached (and arguably cost more to do so). Fig 5 clearly shows the peak of admissions into the Therapeutic Feeding Programme (TFP) centres was June, having started sharply in mid-March. However, as the Table shows, the HRD revisions in SNNP and Oromia did not happen until July 2011.
Total and end-of-month TFP admission figures Jan to Dec 2011.
47. If the initial beneficiary estimates were low in some cases, and needs underestimated in others (resulting in missed opportunities to moderate hunger), depending on crisis modifiers as a means to rectify initial inequities also has its flaws. The PSNP RFM was brought into play in Borena (and in fact all PSNP districts) to bridge a needs gap in the three final months of 2011. While the activation of the mechanism appeared to work relatively effortlessly, the implementation of the initiative was less straightforward with bureaucratic delays meaning that payments for the period were still being disbursed in late February 2012.
48. Distance can be another confounding factor in addressing real needs. In Oromia, the distance between the seat of the regional administration and the affected area resulted in loose control, poor coordination and a plethora of interventions by both government and NGOs that lacked consistency. In Somali region, distance (and a related failure of trust) led to duplication of effort 26 and a thin spread of partner NGOs across a vast territory.
49. A similar failure of trust led frequently to a dilution of beneficiary numbers as information made its way through the system to the Federal (decision-making) level.
26 For example, the result of independent assessments carried out by partners frequently prompted regional government-led verification missions to the same areas.
Fig 5: admissions into TFP programme through 2010.
24 25
50. An assumption that figures are inflated at the district level prompts both an automatic reduction at zonal and regional levels and a further audit at Federal level. Were there to be greater trust between the various administrative levels (or, put differently, if the various levels could be confident that their assessment efforts would be seen as valid), then it might be assumed that final beneficiary numbers would more accurately reflect the actual conditions at community level. A culture of multi-agency assessments with agreed findings should encourage this.
51. Lastly, needs assessments are frequently justified by data that tend to indicate “what was” rather than “what is” or “what will be……”. Nutrition surveys can tell us the situation at community level three months ago, on average. Needs assessments in general compile recent historical data, and will tell us how the situation was at the point in time approximate to when the assessment was carried out. The strength of the Household Economy Analysis methodology adopted by the Government of Ethiopia is that it can help to predict what the situation of a household or community will be as a result of a developing shock, because it builds upon a baseline (the recorded regular economic activities of the household or community) and extrapolates the effect of a shock on that community in terms of immediate and longer-term need. It can thus help to provide the “answer” before the “question” has been formally asked.
52. When used to its full potential, HEA, the underlying methodology for the Federal Government’s (and international community’s) deliberations on annual need in Ethiopia, can help to minimise the problems of trust and validity between administrative levels and between partners, and can be a powerful tool for planning and response.
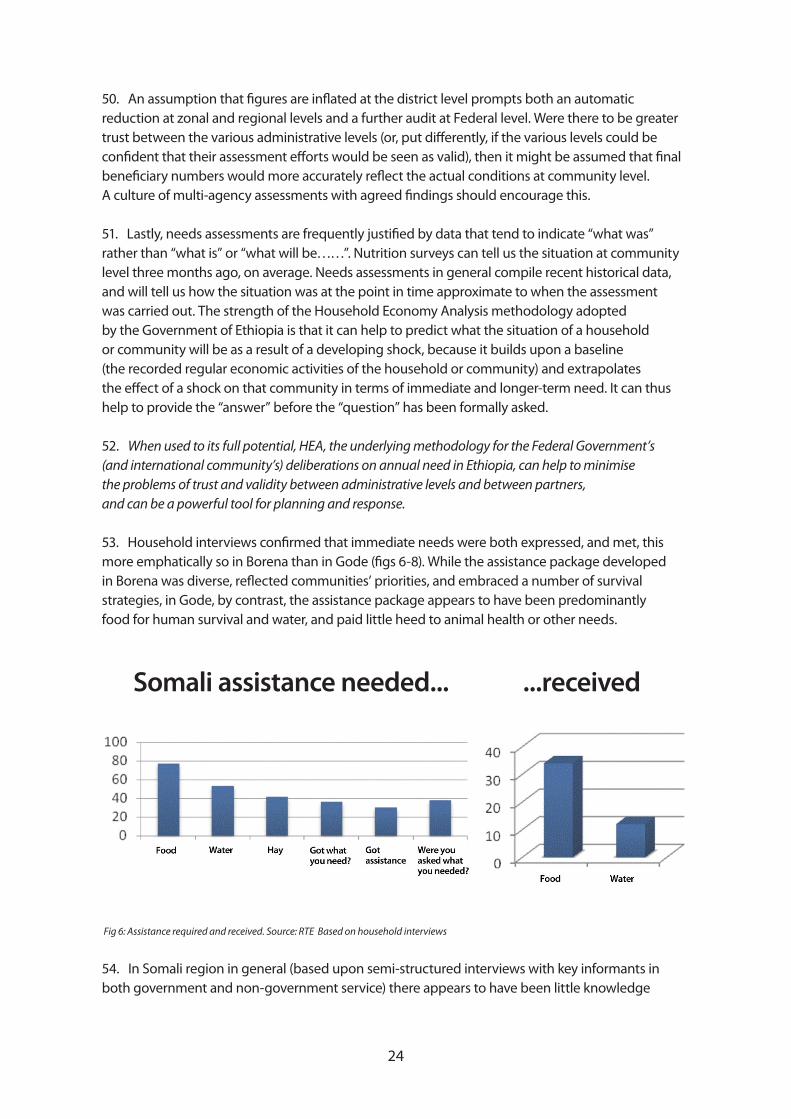
53. Household interviews confirmed that immediate needs were both expressed, and met, this more emphatically so in Borena than in Gode (figs 6-8). While the assistance package developed in Borena was diverse, reflected communities’ priorities, and embraced a number of survival strategies, in Gode, by contrast, the assistance package appears to have been predominantly food for human survival and water, and paid little heed to animal health or other needs.
Fig 6: Assistance required and received. Source: RTE Based on household interviews
54. In Somali region in general (based upon semi-structured interviews with key informants in both government and non-government service) there appears to have been little knowledge
Somali assistance needed... ...received
24 25
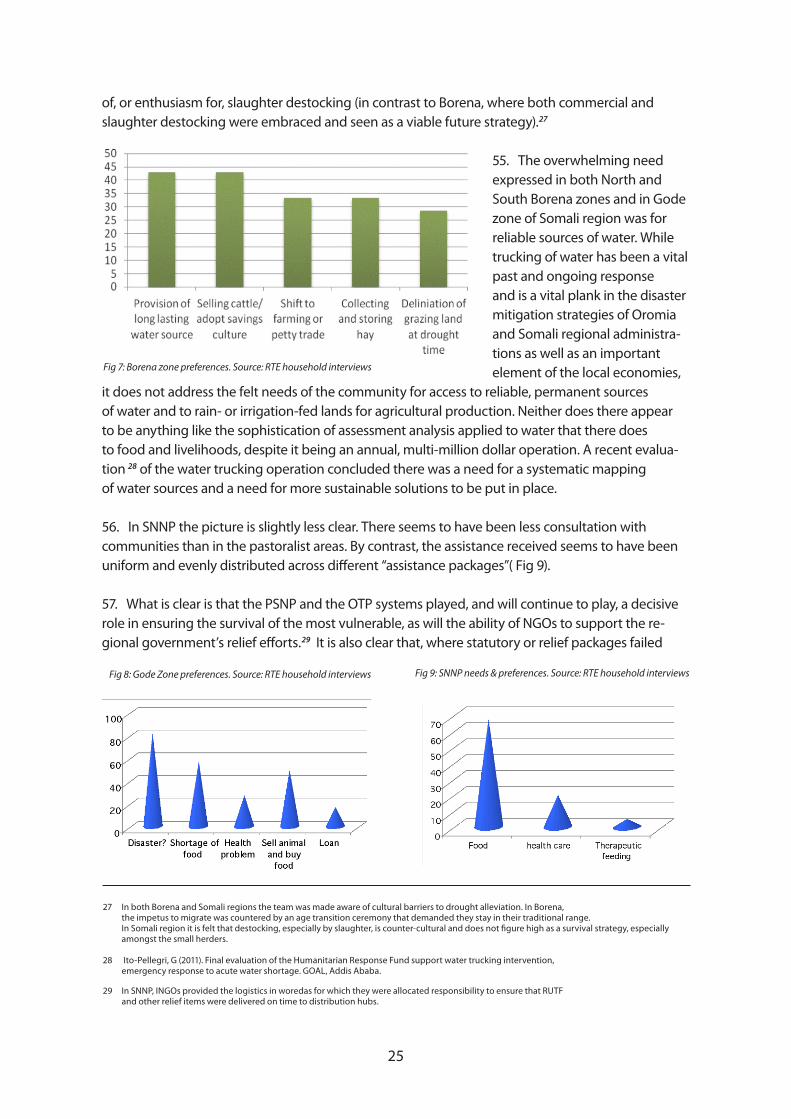
of, or enthusiasm for, slaughter destocking (in contrast to Borena, where both commercial and slaughter destocking were embraced and seen as a viable future strategy).27
55. The overwhelming need expressed in both North and South Borena zones and in Gode zone of Somali region was for reliable sources of water. While trucking of water has been a vital past and ongoing response and is a vital plank in the disaster mitigation strategies of Oromia and Somali regional administra-tions as well as an important element of the local economies,
it does not address the felt needs of the community for access to reliable, permanent sources of water and to rain- or irrigation-fed lands for agricultural production. Neither does there appear to be anything like the sophistication of assessment analysis applied to water that there does to food and livelihoods, despite it being an annual, multi-million dollar operation. A recent evalua-tion 28 of the water trucking operation concluded there was a need for a systematic mapping of water sources and a need for more sustainable solutions to be put in place.
56. In SNNP the picture is slightly less clear. There seems to have been less consultation with communities than in the pastoralist areas. By contrast, the assistance received seems to have been uniform and evenly distributed across different “assistance packages”( Fig 9).
57. What is clear is that the PSNP and the OTP systems played, and will continue to play, a decisive role in ensuring the survival of the most vulnerable, as will the ability of NGOs to support the re-gional government’s relief efforts.29 It is also clear that, where statutory or relief packages failed
Fig 7: Borena zone preferences. Source: RTE household interviews
27 In both Borena and Somali regions the team was made aware of cultural barriers to drought alleviation. In Borena, the impetus to migrate was countered by an age transition ceremony that demanded they stay in their traditional range. In Somali region it is felt that destocking, especially by slaughter, is counter-cultural and does not figure high as a survival strategy, especially amongst the small herders.
28 Ito-Pellegri, G (2011). Final evaluation of the Humanitarian Response Fund support water trucking intervention, emergency response to acute water shortage. GOAL, Addis Ababa.
29 In SNNP, INGOs provided the logistics in woredas for which they were allocated responsibility to ensure that RUTF and other relief items were delivered on time to distribution hubs.
Fig 8: Gode Zone preferences. Source: RTE household interviews Fig 9: SNNP needs & preferences. Source: RTE household interviews
26 27
to meet requirements, many households resorted to loans which are likely to have debilitating rates of interest.
58. It is probably unsurprising that, in a structurally food insecure area, food was the greatest expressed future need.
59. Common to all three economies is the tendency to asset depletion. Less clearly stated in Somali region, but significant in both Borena and SNNP, was the pressure to dispose of assets as a means to feed families and livestock (obtaining loans can be seen as an enduring and debilitating legacy of this pressure).
60. With a tightening drought cycle and a diminishing humanitarian presence, asset depletion (and its concomitant replenishment through assistance or self-help) will increasingly become an emergency response strategy and a continuing beneficiary demand, rather than a route to a secure future livelihood.
61. What the needs assessment could not bring out, and what the drought response has failed to identify, is the actual figure for livestock losses as a result of the drought. Original estimates indicated up to 300,000 livestock fatalities in Borena (10% of the total) and 20,000 in Somali region.30
A Tufts University study made public in September 2011 asserted a different figure, proposing that some inflated estimates of livestock mortality were based upon observations of cattle left at home rather than migrated herds. An independent but informed opinion in Somali region is that 11,000 deaths would be a high figure, partly based on the cultural propensity not to kill and consume your own live meat.
62. In the absence of a livestock census it is almost impossible to estimate the impact of the drought and resultant losses on communities and families, and similarly difficult to verify individual or group assertions of the needs they faced and the extent to which they were satisfied.
63. Finally, the needs assessment process suggested an apparent reticence on the part of estab-lished International Non-Governmental Organisation (INGO) partners to venture beyond their known areas of operation. This is partly explained by an understandable aversion to risk in an uncertain funding environment. It might also be explained by the loss of institutional knowledge brought about by an increasing dependency on project (i.e. relatively short-term) funds for devel-opmental activities, itself resulting in hesitancy in returning to geographical areas with which they have been familiar in the past. Both factors contribute to collective delay in addressing identified need at an early stage.31
30 Borena Zonal administration estimates that, as of mid-February 2012, the zonal herd is made up thus
•Cattle: 1,604,977 •Shoats: 1,176,742 •Camels: 161,064
Total 2,942,783
This herd is shared by a gross human population of 1,113,538, or 3 head of livestock per person. There is no available similar estimate for the Somali regional herd.
31 For example, a number of UK INGOs with a long history in Ethiopia were only able to respond to need or to scale up existing activities following a very successful Disasters Emergency Committee (DEC) appeal in the UK in July 2011.
26 27
3.1.1 Refugees
64. Jijiga and Gode zones have hosted Somali refugee populations of varying sizes since 2006, and Somali region in general since 1988. Refugees from the insurgency and drought in Somalia started to arrive in noticeable quantities in early 2011 in Morodile, Kelafo, Godere, Danan and Mustahil and in Dolo Ado from February or March 2011. With the difficult security situation in the south east of Somali region in 2011, it is perhaps not surprising that the estimation and response to needs in the early part of the year were tardy.
65. That accepted, the UN’s maintenance of a regional analysis of the growing problems in Somalia should have prompted a far more aggressive pre-emptive operation, in association with ARRA, to cope with the almost inevitable influx of refugees in the course of the year.
66. While three camps already existed in Jijiga zone, sheltering 41,000 refugees, Dolo Ado had only two in the early part of the year (Bokolomanyo and Melkadida) with a combined population of ap-proximately 40,000.32 While it might not have been predictable at that stage that operations in So-malia against the Al Shabaab insurgency would be stepped up by combined armed forces, it should have been expected that the distressed population would be squeezed into a funnel that gave out into the long-standing camps in NE Kenya and traditional areas of refuge in Ethiopia.
67. This failure to anticipate future events meant that Dolo Ado was unprepared for the influx of refugees that started in April 2011 and peaked in July/August. The outcome was:
n A need to establish new camps after a major influx, leaving a transit centre designed for 1,500 with over 14,000 for some weeks.n Alarmingly high infant mortality rates.n Malnutrition and morbidity rates standing far outside internationally-accepted standards.
Conclusions
1. Needs identified were, by and large met.
2. The Early Warning System is highly efficient but does not permit early action to be taken.
This will change as the system moves from seasonal assessments to an anticipatory approach.
3. The multi-agency assessment process is hostage to the auditing process carried out at various
levels due to issues of trust.
4. There should be greater recognition of the congruence between pastoralist adaptation
strategies and the policies advocated by the Government of Ethiopia to mitigate
pastoralist vulnerability.
5. Asset replenishment has increasingly become an emergency intervention.
6. The assessment of water needs, infrastructure and market mechanism was less systematic
and sophisticated than that for food security.
7. Refugee preparedness was inadequate.
32 2011 Operational Highlights, UNHCR, January 2012..
28 29
n Main finding 1: The needs assessment and early warning system is technically good but the political approval process slows the system down.
n Main recommendation 1:Ensure the early warning and needs assessments are released early with figures accurately matching the technical findings.
3.2 Strategy, operational planning and resource mobilisation
68. The Government of Ethiopia and its partners have put in place a long term strategy for dealing with both chronic and acute need. It is this system that the evaluation has found prevented famine or hunger related deaths in 2011.
69. The major components of this strategy are:
n The PSNP, a cash and food based support for the most vulnerablen An ongoing ‘relief’ operation that expands and contracts in size as neededn The OTP, the decentralised treatment of basic health care, including malnutrition n Significant improvements in the response to livestock stress in drought.
70. In essence, the systematisation of ‘emergency’ assistance in Ethiopia acknowledges the reality that a certain percentage of the population finds it difficult to meet all of their needs throughout the year.33 The government and its partners, by making what was once thought of as emergency assistance into something predictable and planned, has made a major step forward in providing for the most vulnerable in Ethiopian society. They have also put in place a system that is potentially cheaper and an example to other developing countries.
71. The PSNP can be thought of as the first line of defence, in that it provides help to the most vul-nerable families, or rather those deemed ‘chronically food insecure’. The PSNP provides cash or food equivalent to 15kgs of cereal for each household member for a six month period of the year, usually from February to July. Currently there are about 7.6 million people who receive assistance under the PSNP.
72. In addition to regular grain or cash payments, the PSNP has two further mechanisms, or ‘add ons’, to implement in times of increased stress.
1. A Contingency Fund (CF) of up to 20%, allowing the inclusion of additional households in PSNP woredas experiencing “transitory” needs (i.e. they are temporarily food insecure). Woreda administrations are empowered to allocate an initial 5% while the remaining 15% is allocated by the region.
33 The PSNP draws a conceptual distinction between two groups of food insecure Ethiopians, the ‘unpredictably food insecure’ – those who face transitory food deficits because of erratic weather or other livelihood shocks and the predictably food insecure. The former continue to receive food aid and other humanitarian assistance, while those who face chronic food deficits because of poverty rather than food shocks should receive cash or food transfers, for work or freely, on a regular, predictable basis for a fixed period of five years (PSNP manual).
28 29
34 The HRD also requested resources for water provision, health and nutritional care, agriculture and livestock, and education.
35 There was also evidence of both the contingency fund (CF) and the RFM at work. The evaluation interviewed existing clients who had received extended rations under the RFM, although it was not possible to identify those who had received “transitory” assistance (this may simply have been because beneficiaries did not distinguish between CF, RFM and relief distributions).
36 This finding emerged strongly from focus group interviews – see annex 4 for transcripts of these. It was also an opinion expressed strongly by many key informants during interview.
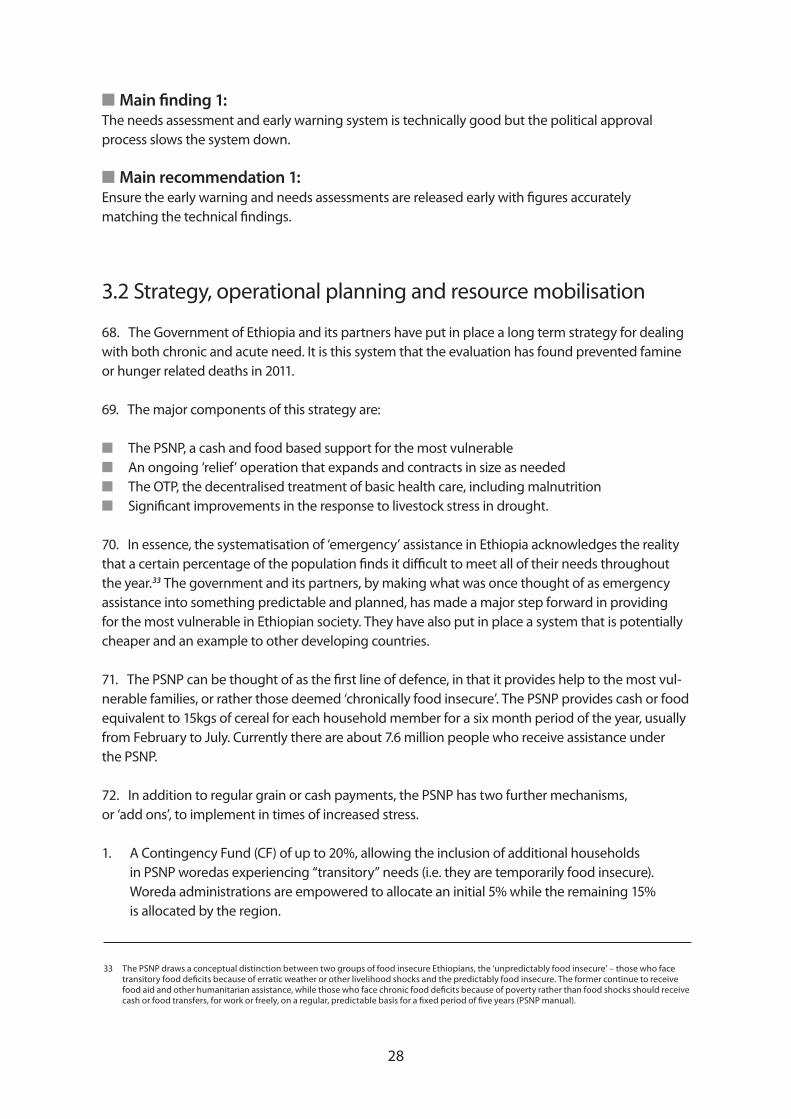
2. The Risk Financing Mechanisim (RFM), similar to the CF but larger, also enabling the authorities to address ‘transitory’ food insecurity.
73. In 2011 the RFM was triggered to address the transitory food needs for 9.6 million people, 6.5 million of whom were existing clients (who received an additional three months ration). Transitory food needs are also addressed through the HRD, based on bi-annual needs assessments (see section above on needs). The revised appeal of July 2011 requested approximately 380,000MT (see above), serving almost five million people.34
74. In 2011 the PSNP played a significant role in ensuring people did not “fall off the edge” into starvation. This was especially the case in the Southern Nations (SNNP) highlands, where malnutri-tion is a structural problem. Over 50% of those interviewed by the evaluation who were receiving assistance counted the PSNP as their best help through a very difficult period35 (see annex 4 for this data in more detail).
75. There were inevitably aspects of the PSNP that did not work perfectly. Clients reported late payments, forcing them to borrow at high interest rates to cover the gap. The RFM, whilst welcome, came 6 months after the main crisis hit and, in some cases, experienced further bureaucratic delays in payment (see above).
76. The PSNP works less well in pastoralist areas.36 It does not have the same reach as in highland areas, and there is a problem with timeliness and coverage, which in turn appears to be connected to the dispersed nature of the population in these areas. They are harder, and therefore more expensive, to reach.
77. This means that relief food is still the predominant form of assistance, especially in Somali re-gion. In household interviews for this evaluation people identified food assistance as the major help they received (see fig. 6 above, and annex 4 for more detail), and identified WFP as the organisation that gave them the most assistance. WFP was the main provider of relief food through its ‘hubs and spokes’ operation.
78. Assistance operations in Somali region have been complicated for several years by security, making its coverage patchy. This may be another reason why PSNP has not become the major form of welfare in these areas yet. Access to some parts of Somali region was a major issue during
Fig 10: PSNP and relief caseload
PSNP and relief caseload combined
30 31
the early parts of 2011, when an insurgent attack on WFP workers in Fik district led to a member of the team being killed, another injured and two other staff being abducted and held for over two months. This led to a security shut down in that area.
79. A more prosaic, but no less important issue with PSNP in pastoral areas, is illustrated by an example documented in Miyo Woreda in Oromia for this evaluation. A village nominally on the PSNP list had only received one distribution. However, inclusion on the system rendered the villag-ers ineligible for relief (food) assistance, and meant that the PSNP had the perverse effect of making people worse off. Whilst this is probably an isolated incident, it demonstrates that inflexibility in the scheme – especially in pastoral areas – can be unhelpful. An adapted PSNP is needed in these areas, designed with the communities and with experts on pastoral and agro-pastoral livelihoods.
80. If the PSNP is the first line of defence, then the OTP can be thought of as the last. Based on the health post at the village (or kebele) level, two health staff measure malnourished children using the mid-upper arm circumference bands. If children qualify as malnourished they are pre-scribed ready to use therapeutic foods (RUTF) and treated for some basic health problems. Weekly health statistics are transmitted to woreda health department staff.
81. In 2008 there were fewer than 300 OTP centres. In 2011 the OTP system catered for a total of 329,535 severely acutely malnourished (SAM) cases in an average of 7,479 sites across the country. This was a major contributing factor in the dramatic reduction in attendees at the higher-level ‘sta-bilisation centres’(SC) which resemble a classic feeding centre. While in the drought of 2008 woreda health clinics quickly became overwhelmed with malnourished children with nowhere else to go, in 2011 SCs were only needed for very sick children, or those with grade 3 Marasmus or Kwashiorkor.
82. Whilst the OTP system was a major success there was still a need for significant logistical sup-port from NGOs when the numbers started to increase. This took the form of transport for RUTF supplies to the kebele level, which otherwise would have run out using normal means of transport.
83. In fact the RUTF pipeline was challenged on a number of levels. UNICEF is the major supplier of RUTF in Ethiopia and tries to rely on national production as much as possible. At a critical moment in 2011 the factory producing RUTF in Ethiopia had an issue with hygiene and had to be closed for a week, affecting supply critically. Generally the supply is calculated retrospectively – regions order amounts based on what they have used rather than a forward prediction. When the numbers start-ed to rise quickly this left a gap in the pipeline that needed to be filled by rapid importation. Whilst this worked it was also costly and could arguably have been prevented by adequate buffer stocks.
84. The onward transportation of RUTF is the other big challenge for the system when scaling up rapidly (as above). UNICEF delivers to the regional and zonal warehouses and then the health system distributes onwards to woreda and kebele levels. However, with limited transport resources this requires additional transport to be organised when this system needs speeding up. NGOs filled this gap in SNNP. Additionally they provided refresher training, equipment for OTPs and SCs and filled in when shortages of RUTF and basic medicines were needed. In Southern Nations the NGOs were an essential part of the system, helping the government systems mobilise rapidly.
85. The pipeline issues experienced in nutrition were less of a problem for general food. Whilst there were shortages of some commodities (especially for the refugees, which will be tackled
30 31
separately below), generally the system was able to increase to meet increased demand (effectively a tripling of volume for relief food in SNNP and Oromia). Partly this was because the Ethiopian Stra-tegic Food Reserve (ESFRA) was able to fill critical gaps (although food has to be released against collateral i.e. a confirmed contribution); partly it was because the US, the principal food aid donor in Ethiopia, anticipated the rise in need ahead of time and planned for an increase in the pipeline before the appeal was altered. The ESFRA came close to being empty however, partly as a result of the decision to use it to stabilise prices in urban centres earlier.
86. Whilst this was the case at national level, the regions suffered periodic glitches in their distribu-tion system. In SNNP for instance some of the challenges faced included delays in food dispatch, delivery and distribution, poor storage facilities, lack of pre-positioned food and the lack of a stor-age and distribution budget at woreda level.
87. Although the pipeline worked for RUTF and the general food ration, this was not the case for targeted supplementary food (TSF), typically Corn Soya Blend (CSB). This is supposed to be given to families where children are moderately malnourished, have been discharged from a feeding programme or where the mother is pregnant. However, despite enough funding, the pipeline was slow and the distribution did not seem to be properly joined up with the nutritional programme.
3.2.1 Water
88. As has been noted in previous evaluations, the “strategy” described above works best for chronic and acute need in the densely populated highland areas of Ethiopia. It is also very focused on food and nutrition as the major need, which is largely appropriate given the high levels of food insecurity in these areas.
89. However the lowland pastoralist areas of Ethiopian bore the brunt of the recent drought with the lack of potable water being the preoccupying issue in both Somali region and Oromia. This led to a massive and, by and large timely, water supply intervention, mostly in the form of trucking.
90. At one point two million people were dependant on water provided by the emergency opera-tion and overall some four million people were served. Organisations like GOAL were very quick to provide water in Borena, and in Somali region UNICEF started an emergency operation with ten trucks in November 2010. In some areas of Somali region the price of water had quadrupled and shallow wells had dried up completely leaving only sludge containing toxic algae.
91. This evaluation has concluded that the water trucking operation also saved lives. There were no dramatic outbreaks of water borne diseases, and in surveys for this evaluation people generally felt the water had come on time. Many stated that it had been life saving.
92. The water trucking operation and water supply in general however appears to be less strategic than that in place for food security. This is a complex issue as many of the areas that suffered water shortages are by nature very dry and the water table can be very low, making drilling expensive and boreholes difficult to maintain. There can also be complex ownership issues with boreholes in clan based societies, making the sites of such valuable resources a difficult issue.
32 33
93. Nevertheless there is clearly a need for a systemic solution to the water trucking issue. In Somali region water trucking has become big business, indeed an integral part of the local economy. It is also costly when it has to be organised at short notice as truck fleet owners can ramp up prices at times of high demand. It also does not always take into account the resources of local communities, who can self organise for water provision.
94. A recent evaluation of the water operation 37 has found that whilst in general it managed to deliver the 5l/person day needed to the population, there were delays and stoppages due to dis-putes with truckers and other logistical issues. This evaluation concludes that a proper mapping of available water sources and water delivery infrastructure would deliver significant efficiency gains. It also recommends the use of water vouchers as trialled in Kenya and Somalia; something that seems likely to work well in a context where many people buy their water normally.
95. The three aspects of the current system described above – the strategy of safety nets, relief and health posts – provide a means of keeping people alive when conditions deteriorate to the point where they can no longer cope. What is less clear, and the subject of some debate, is the ability, or desirability, of the system protecting livelihoods as well as lives.
3.2.2 Food security, livelihoods and livestock
96. The PSNP, by its very nature, is not simply a survival mechanism. It is also a public works pro-gramme with an element aimed at improving assets and ultimately allowing people to ‘gradu-ate’. The public works aspect means that PSNP recipients help to implement community projects, including infrastructure and environment related works.
97. People who are entitled to assistance typically remain in the scheme for a number of years (theoretically five). This gives them time build up sufficient capability to provide for themselves and their families, so that they no longer need the help of the scheme. The Household Asset Rebuilding Programme also provides loans to people to generate livelihoods, with the aspiration that over time they will become able to support themselves.
98. There is certainly evidence that in good years the PSNP allows households to build assets. An example of this was in 2010 when a good harvest (farmers in SNNP reported one of the best for several years) meant households could use PSNP support to invest their surplus in assets38 – mainly livestock. A bad year results in people depleting their assets, despite PSNP support. In 2011 respon-dents to this evaluation in SNNP reported selling livestock to cover food needs (and borrowing money at high interest rates).39
99. This suggests there is a ‘race’ between the positive effects of the PSNP and the negative effects of shocks. It also suggests that there is a period of relatively good production needed for PSNP
37 Ito-Pellegri, G (2011). Final evaluation of the Humanitarian Response Fund support water trucking intervention, emergency response to acute water shortage. GOAL, Addis Ababa.
38 See for instance Sabates-Wheeler, R (2011). Evaluation of Ethiopia’s food security programme: documenting progress in the implementation of the productive safety nets programme and the household asset building programme. IDS and IPFRI.
39 See annex 4.
32 33
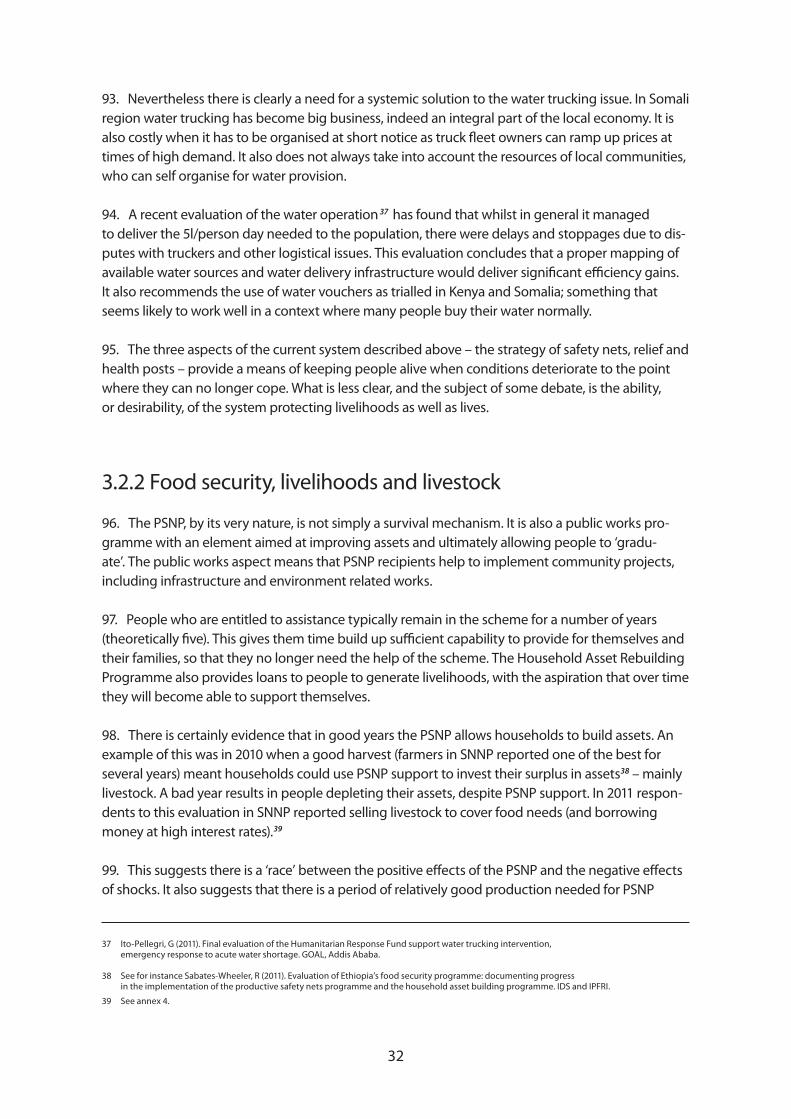
GRADUATIONFROM PSNP
COMMUNITYASSETS(CCI & PSNP PW)
FOOD SECUREINCLUDING
GRADUATES OF FSP.
GRADUATIONFROM FSP
FOOD INSECURE
INCLUDING GRADUATES
OF FSP.
ASSE
T ST
ABIL
ISAT
ION
ASSE
T AC
CU
MU
LATI
ON Extension services, including
business planning, input linkagesand market advivce
Repeat access to FSP credit
Intensive support andtailored products
PSNP Transfers
Village savings & credit and financial literacy
Mainsteam creditand serviceprovision
CHRONICALLYFOOD
INSECURE
ULTRA POOR
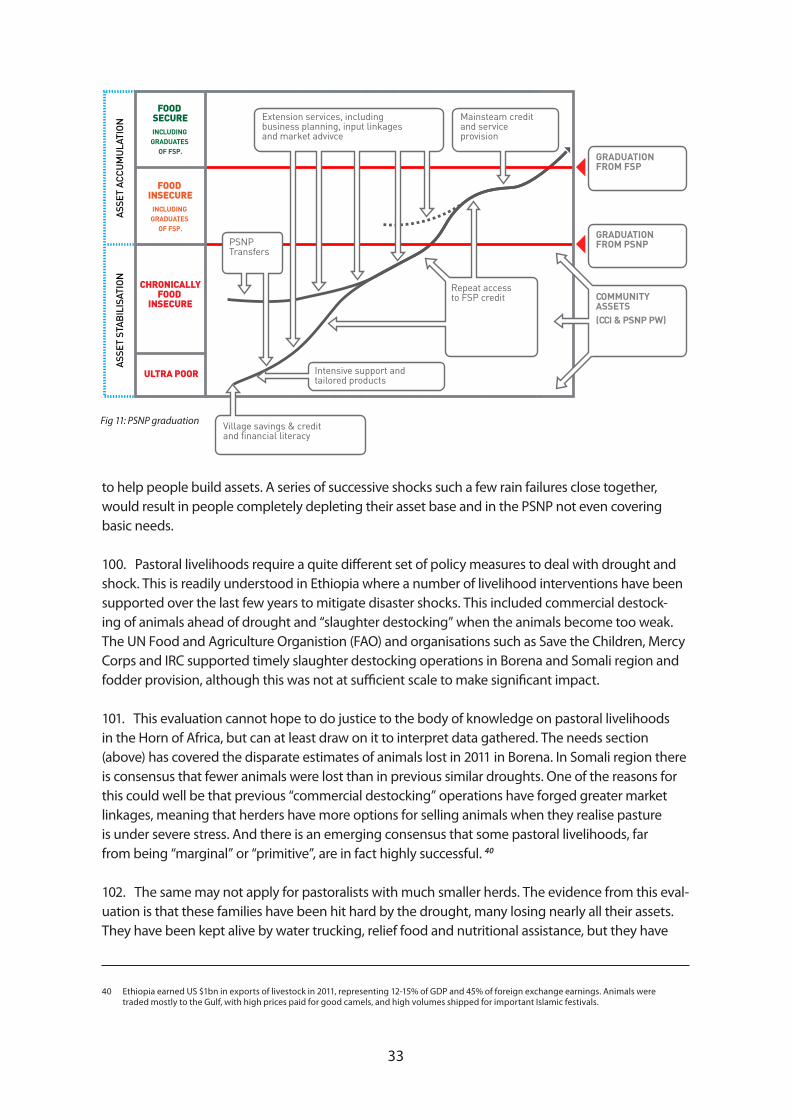
to help people build assets. A series of successive shocks such a few rain failures close together, would result in people completely depleting their asset base and in the PSNP not even covering basic needs.
100. Pastoral livelihoods require a quite different set of policy measures to deal with drought and shock. This is readily understood in Ethiopia where a number of livelihood interventions have been supported over the last few years to mitigate disaster shocks. This included commercial destock-ing of animals ahead of drought and “slaughter destocking” when the animals become too weak. The UN Food and Agriculture Organistion (FAO) and organisations such as Save the Children, Mercy Corps and IRC supported timely slaughter destocking operations in Borena and Somali region and fodder provision, although this was not at sufficient scale to make significant impact.
101. This evaluation cannot hope to do justice to the body of knowledge on pastoral livelihoods in the Horn of Africa, but can at least draw on it to interpret data gathered. The needs section (above) has covered the disparate estimates of animals lost in 2011 in Borena. In Somali region there is consensus that fewer animals were lost than in previous similar droughts. One of the reasons for this could well be that previous “commercial destocking” operations have forged greater market linkages, meaning that herders have more options for selling animals when they realise pasture is under severe stress. And there is an emerging consensus that some pastoral livelihoods, far from being “marginal” or “primitive”, are in fact highly successful. 40
102. The same may not apply for pastoralists with much smaller herds. The evidence from this eval-uation is that these families have been hit hard by the drought, many losing nearly all their assets. They have been kept alive by water trucking, relief food and nutritional assistance, but they have
Fig 11: PSNP graduation
40 Ethiopia earned US $1bn in exports of livestock in 2011, representing 12-15% of GDP and 45% of foreign exchange earnings. Animals were traded mostly to the Gulf, with high prices paid for good camels, and high volumes shipped for important Islamic festivals.
34 35
lost the means to support themselves in the short term. Interventions such as slaughter destocking were crucial to these families as was the supply of supplementary animal feed.41 Finding ways to keep animals alive is obviously the first preference, although the logistics and expenses of providing animal feed makes it an untested option at scale.
103. Many families in Somali region, and to a lesser degree in Borena, such as marginal herders (“dropouts”, or in “transition”) are considering an agro-pastoralist future. This is congruent with the Government of Ethiopia’s policy on settlement. Clearly the right kind of targeted development assistance would deliver results. Central to this however is the question of access to land and the encroachment on highly fertile riverine pastoralist lands of private and commercial interests. How the various interests will or can be accommodated will be crucial in determining whether people transitioning to an agricultural existence succeed or not.
104. Winning the race between disaster and development is one of Ethiopia’s biggest challenges. The PSNP is a vital plank in the strategy to win that race, as are livestock measures, bridging the gap between quick emergency fixes and the long-term development path that sees sustainable liveli-hoods for all at its end. There are, nevertheless, some major issues outstanding.
n Survival or livelihoods? In 2010 the Government changed the rules surrounding relief food, stipulating its use solely for protecting lives rather than livelihoods as before. This has effectively excluded (and the numbers are always contentious so this is simply an estimate) one to two million people who were receiving assistance previously. At the same time the lack of graduation has meant that there is little opportunity for these people to join the PSNP scheme – something that might be the natural solution otherwise. Does this suggest a group that will slip toward destitution, only being picked up once they are “on the edge” and slipping in and out of dependency annually?
n Can PSNP be flexible as well as predictable? The PSNP is a great and beneficial innovation, but its very predictability makes responding flexibly to an evolving situation challenging. The contingency fund and the risk financing mechanism are intended to resolve this dilemma.
3.2.3 Education and protection
105. The drought caused a large number of children to drop out of school, especially in Somali region, with estimates of drop out rates as high as 50% (or roughly 85,000 children) at the peak of the emergency. The Humanitarian Requirements Document appealed for US $4.9m to tackle this crisis ineducation, providing supplies, temporary learning spaces and catch-up teaching. Some food and water was also provided to schools.
106. The evaluation did not look specifically at the education response and therefore was not able to judge its effectiveness. However, it is clear that the drought had a significant impact on children’s schooling and that measuresto mitigate this did go ahead. What the outcomes of these measures were is uncertain, although evidence from similar responses suggests children will have benefitted.
41 The majority of respondents in household surveys for this evaluation also asked for support for animal feed, and in group interviews people were clear they would spend more time in future building up reserves of animal food.
34 35
Protection is a complex area to examine in Ethiopia, ranging from women’s rights through the rights of minority communities to children’s rights. Children can be at risk of abuse and worse. Agencies did respond in some of these areas with, for instance, the establishment of social protec-tion networks and para-social workers in Somali region. However the evaluation was not ableassess the efficacy or otherwise of these interventions.
107. The lack of information and analysis – and emphasis – in these two important sectors suggests that the situation described in the 2006 RTE remains mostly the same. The response in Ethiopia continues to be focused on the main priority – food security – and rather ignores some equally important aspects of the crisis. Both protection and education in emergencies are areas thatshould be pushed and supported by the Humanitarian Country Team in 2012, hopefully establish-ing these as routine areas to respond to and report in.
3.2.4 Gender
108. There were several areas in which the drought response in Ethiopia sought to take gender issues into account in 2011. Most of the main instruments that have been examined in this evalu-ation included a gender focus. Good examples include the PSNP which has gender equity as one of its eight principles and the HRF guidelines, that require agencies applying for funding to outline their work in this area. There were also good examples of practical measures aimed at women. In food aid programming there is targeting of pregnant and lactating mothers, and there were some good examples of livelihoods activities aimed at women such as husbandry of small rumi-nants, milk production and home gardens.
109. Generally, however implementation of gendered policy is a mixed picture. It is clear that the majority of implementing agencies – and government – attempted to follow through on their gender policies. The evaluation of water projects funded by the HRF found that agencies tried to hire women to ensure gender balanced teams, and tried to collect information on how women were affected by drought. However, the same evaluation found that there was no systematic targeting of women in the water trucking programmes.
110. The same is true for the PSNP. The ongoing longitudinal study has found that there is a clear policy that women should be given appropriate tasks in the public works programmes. At the village level however this is understood but not followed. In practice women are required in most instances to carry out the same heavy labour as the men; and then required to undertake all of the household duties when they get home.
111. Without conducting an exhaustive study of gendered programming in 2011 it is hard to be definitive. Nevertheless the sense of the evaluation team was that there had been progress in this area since the 2006 RTE evaluation found, “there was little understanding of the importance of gender issues in the emergency situation”, but that in practical terms how to address these consistently has not yet been resolved.
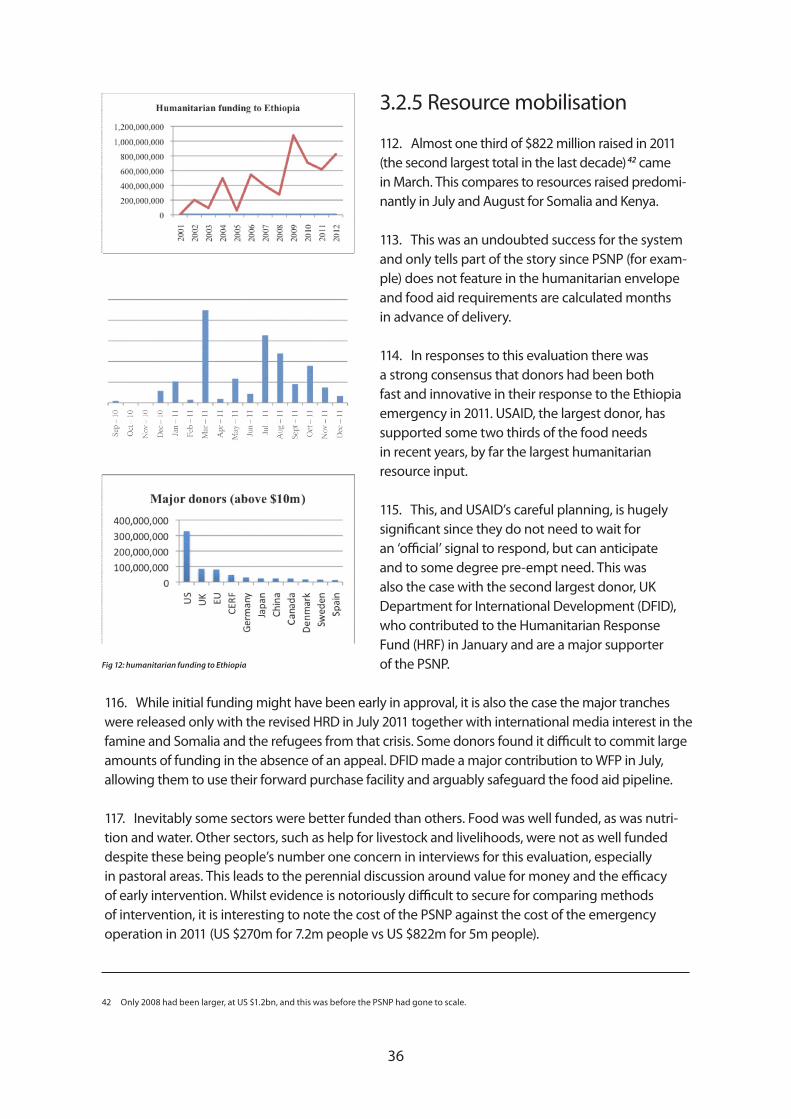
36 37
3.2.5 Resource mobilisation
112. Almost one third of $822 million raised in 2011 (the second largest total in the last decade) 42 came in March. This compares to resources raised predomi-nantly in July and August for Somalia and Kenya.
113. This was an undoubted success for the system and only tells part of the story since PSNP (for exam-ple) does not feature in the humanitarian envelope and food aid requirements are calculated months in advance of delivery.
114. In responses to this evaluation there was a strong consensus that donors had been both fast and innovative in their response to the Ethiopia emergency in 2011. USAID, the largest donor, has supported some two thirds of the food needs in recent years, by far the largest humanitarian resource input. 115. This, and USAID’s careful planning, is hugely significant since they do not need to wait for an ‘official’ signal to respond, but can anticipate and to some degree pre-empt need. This was also the case with the second largest donor, UK Department for International Development (DFID), who contributed to the Humanitarian Response Fund (HRF) in January and are a major supporter of the PSNP.
116. While initial funding might have been early in approval, it is also the case the major tranches were released only with the revised HRD in July 2011 together with international media interest in the famine and Somalia and the refugees from that crisis. Some donors found it difficult to commit large amounts of funding in the absence of an appeal. DFID made a major contribution to WFP in July, allowing them to use their forward purchase facility and arguably safeguard the food aid pipeline.
117. Inevitably some sectors were better funded than others. Food was well funded, as was nutri-tion and water. Other sectors, such as help for livestock and livelihoods, were not as well funded despite these being people’s number one concern in interviews for this evaluation, especially in pastoral areas. This leads to the perennial discussion around value for money and the efficacy of early intervention. Whilst evidence is notoriously difficult to secure for comparing methods of intervention, it is interesting to note the cost of the PSNP against the cost of the emergency operation in 2011 (US $270m for 7.2m people vs US $822m for 5m people).
42 Only 2008 had been larger, at US $1.2bn, and this was before the PSNP had gone to scale.
Fig 12: humanitarian funding to Ethiopia
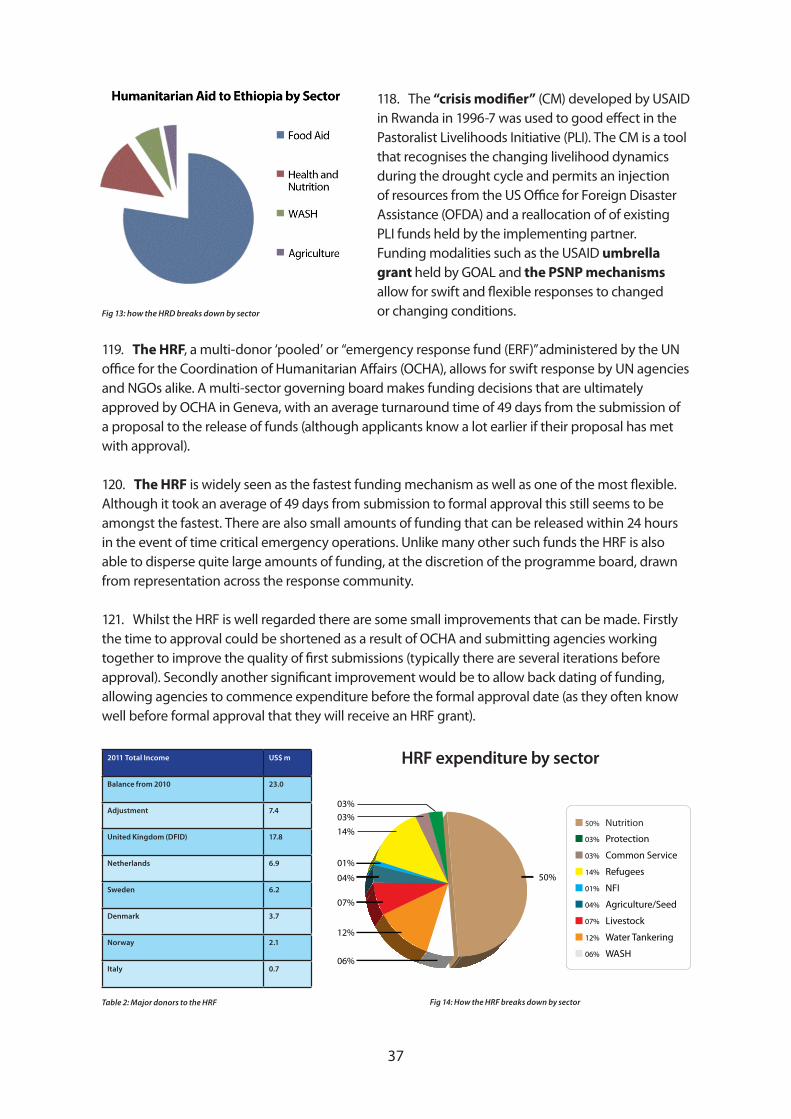
36 37
118. The “crisis modifier” (CM) developed by USAID in Rwanda in 1996-7 was used to good effect in the Pastoralist Livelihoods Initiative (PLI). The CM is a tool that recognises the changing livelihood dynamics during the drought cycle and permits an injection of resources from the US Office for Foreign Disaster Assistance (OFDA) and a reallocation of of existing PLI funds held by the implementing partner. Funding modalities such as the USAID umbrella grant held by GOAL and the PSNP mechanisms allow for swift and flexible responses to changed or changing conditions.
119. The HRF, a multi-donor ‘pooled’ or “emergency response fund (ERF)”administered by the UN office for the Coordination of Humanitarian Affairs (OCHA), allows for swift response by UN agencies and NGOs alike. A multi-sector governing board makes funding decisions that are ultimately approved by OCHA in Geneva, with an average turnaround time of 49 days from the submission of a proposal to the release of funds (although applicants know a lot earlier if their proposal has met with approval).
120. The HRF is widely seen as the fastest funding mechanism as well as one of the most flexible. Although it took an average of 49 days from submission to formal approval this still seems to be amongst the fastest. There are also small amounts of funding that can be released within 24 hours in the event of time critical emergency operations. Unlike many other such funds the HRF is also able to disperse quite large amounts of funding, at the discretion of the programme board, drawn from representation across the response community.
121. Whilst the HRF is well regarded there are some small improvements that can be made. Firstly the time to approval could be shortened as a result of OCHA and submitting agencies working together to improve the quality of first submissions (typically there are several iterations before approval). Secondly another significant improvement would be to allow back dating of funding, allowing agencies to commence expenditure before the formal approval date (as they often know well before formal approval that they will receive an HRF grant).
Fig 13: how the HRD breaks down by sector
2011 Total Income US$ m
Balance from 2010 23.0
Adjustment 7.4
United Kingdom (DFID) 17.8
Netherlands 6.9
Sweden 6.2
Denmark 3.7
Norway 2.1
Italy 0.7
Fig 14: How the HRF breaks down by sector Table 2: Major donors to the HRF
■ 50% Nutrition
■ 12% Water Tankering
■ 06% WASH
■ 07% Livestock
■ 04% Agriculture/Seed
■ 01% NFI
■ 14% Refugees
■ 03% Common Service
■ 03% Protection
03%03%
14%
01%
07%
04% 50%
12%
06%
HRF expenditure by sector
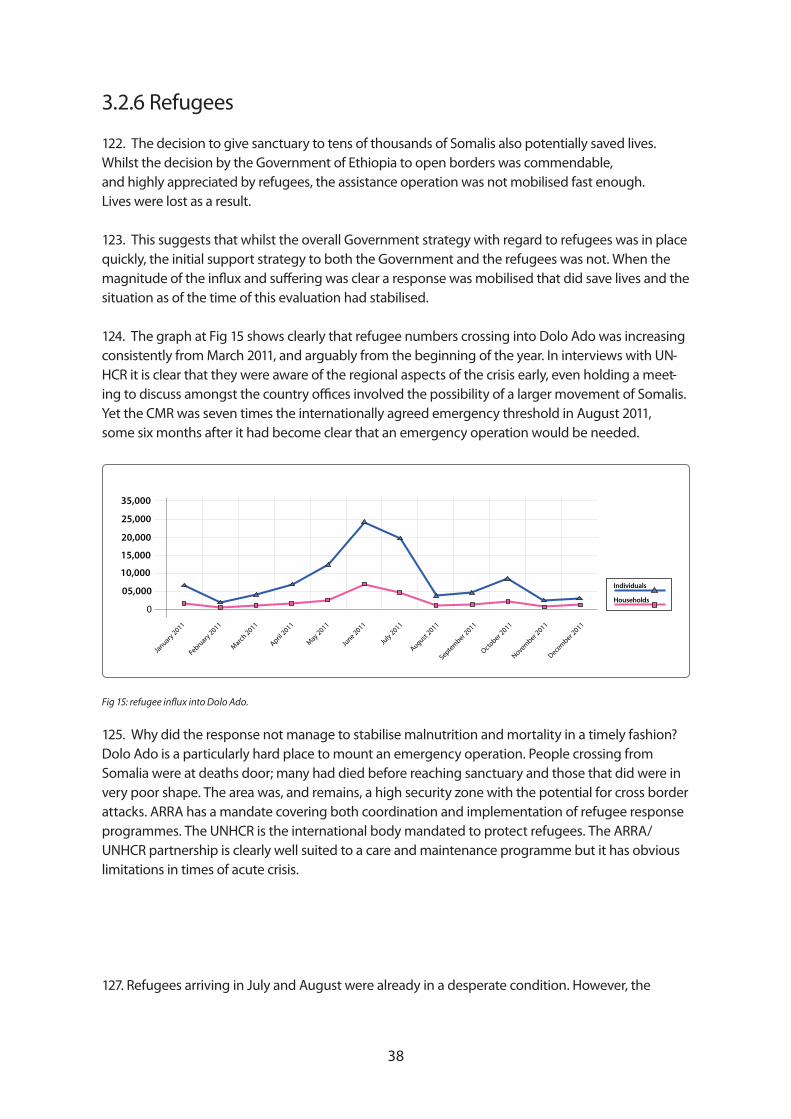
38
3.2.6 Refugees
122. The decision to give sanctuary to tens of thousands of Somalis also potentially saved lives. Whilst the decision by the Government of Ethiopia to open borders was commendable, and highly appreciated by refugees, the assistance operation was not mobilised fast enough. Lives were lost as a result.
123. This suggests that whilst the overall Government strategy with regard to refugees was in place quickly, the initial support strategy to both the Government and the refugees was not. When the
situation as of the time of this evaluation had stabilised.
124. The graph at Fig 15 shows clearly that refugee numbers crossing into Dolo Ado was increasing consistently from March 2011, and arguably from the beginning of the year. In interviews with UN-HCR it is clear that they were aware of the regional aspects of the crisis early, even holding a meet-
Yet the CMR was seven times the internationally agreed emergency threshold in August 2011, some six months after it had become clear that an emergency operation would be needed.
125. Why did the response not manage to stabilise malnutrition and mortality in a timely fashion? Dolo Ado is a particularly hard place to mount an emergency operation. People crossing from Somalia were at deaths door; many had died before reaching sanctuary and those that did were in very poor shape. The area was, and remains, a high security zone with the potential for cross border attacks. ARRA has a mandate covering both coordination and implementation of refugee response programmes. The UNHCR is the international body mandated to protect refugees. The ARRA/UNHCR partnership is clearly well suited to a care and maintenance programme but it has obvious limitations in times of acute crisis.
127. Refugees arriving in July and August were already in a desperate condition. However, the
35,000
25,000
15,000
10,000
05,000
05,000
20,000
January 2011
February 2011
March 2011
April 2011
May 2011
June 2011
July 2011
August 2011
September 2011
October 2
011
November 2011
December 2
011
Individuals
Households
39
available camp space refugees 43 were housed in large numbers (at one point 14,000) in a transit
acute malnutrition.
128. The measles outbreak in mid-July will have been a contributory factor to the high death rates. UNHCR and MSF Spain attempted to vaccinate all children on arrival but were hampered by inconsistent vaccine supply and obstructive government policy. The vaccines were not available at the beginning of 2011 as the increase in arrivals started, and once supply had resumed in May it proved inadequate. UNICEF took over the supply of vaccines in June, but this meant that only half of children aged 6 months to 15 years had been vaccinated by the time an outbreak was reported in July. A mass campaign was organised for early August once the outbreak had been con�rmed.
129. The appeal for the refugee crisis was launched in early July 2011, following the visit of the UN
refugee death rates indicated a major catastrophe (UNHCR Guidelines).45 The formal Appeal, and
130. The situation in Dolo Ado in February 2012, when the evaluation team visited, had stabilised.
malnutrition in the camps and this has now been achieved. Strong leadership in Dolo Ado has
people early on. Using the additional resources of NGO partners such as Medecins sans Frontiers, GOAL, Save the Children US and other UN agencies has also been critical.
131. Despite this progress the situation in Dolo Ado remains fragile. With the rainy season approaching there are some key logistical bottlenecks (bridges down in rivers that may well
a durable solution to fuel is found quickly may spin out of control. The food issues, principally
-cal issues, malnutrition could easily return. Finally, the security environment remains a concern, and agencies need better access to communications equipment to do their work properly.
Conclusions
1. The long term strategy put in place for chronic and acute need prevented famine and hunger related deaths in 2011.2. 3. PSNP works less well in pastoral areas meaning they are still largely reliant on relief food.
43 Camp establishment dates; Bokolomanyo: April 2009, Melkadia: Feb 2010, Kobe: June 2011, Hilaweyn: Aug 2011, Buramino: Nov 2011.
44 There is some dispute about whether all children were immunised on arrival – this is said to be the case, but the outbreak suggests otherwise. In addition the Government of Ethiopia did not allow for those over 15 to be immunised.
45 Crude mortality rate of over 5 per 10,000 per day.
40 41
4. Whilst the 2011 operation saved lives it did not save livelihoods. 5. In a year like 2011 assets are depleted, potentially leading to destitution. In a good year the PSNP allows households to rebuild their assets. The balance between these two scenarios is critical.6. The decentralised health and nutrition (OTP) system saved thousands of lives, catering for over 329,000 severely acutely malnourished children. 7. The OTP system needed reinforcing through NGO logistical support to cope with the sharp increase in intake. There were also pipeline issues with RUTF, although these were not critical.8. The general food ration pipeline held through a combination of good forward planning and use of the ESFRA (facilitated by donor and WFP flexibility).9. Water supply was another critical life saving intervention with over four million people receiv ing assistance. The emergency water system is ad hoc and inefficient as a result. A systematic approach needs to be developed in the same way as for food security.10. Resource mobilisation was a success in 2011 with a large amount of the financing in place early. There were several useful innovations that could potentially be expanded.11. The decision to allow refugees from Somalia sanctuary in Ethiopia was commendable and potentially saved thousands of lives. However the assistance operation on arrival fell short of their needs and there is a need to rethink how this is done in future.12. The refugee situation is now under control after considerable effort by both UNHCR, ARRA and partners. It remains fragile however and needs ongoing serious attention.
n Main finding 2:The strategy of having long term, predictable systems in place addressing chronic and acute vulnerability, reduces suffering and saves lives.
n Main recommendation 2:Work towards making more of the acute response system predictable, including further developing systems such as RFM, livestock measures and better developing water responses.
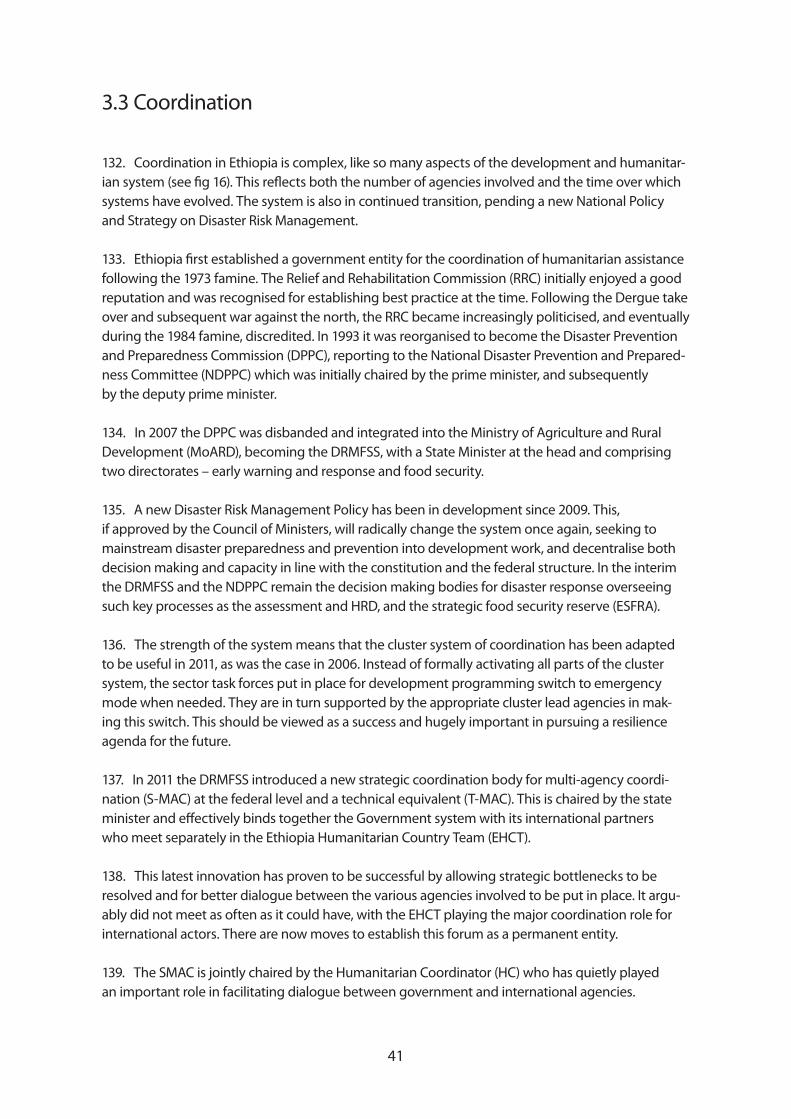
40 41
3.3 Coordination
132. Coordination in Ethiopia is complex, like so many aspects of the development and humanitar-ian system (see fig 16). This reflects both the number of agencies involved and the time over which systems have evolved. The system is also in continued transition, pending a new National Policy and Strategy on Disaster Risk Management.
133. Ethiopia first established a government entity for the coordination of humanitarian assistance following the 1973 famine. The Relief and Rehabilitation Commission (RRC) initially enjoyed a good reputation and was recognised for establishing best practice at the time. Following the Dergue take over and subsequent war against the north, the RRC became increasingly politicised, and eventually during the 1984 famine, discredited. In 1993 it was reorganised to become the Disaster Prevention and Preparedness Commission (DPPC), reporting to the National Disaster Prevention and Prepared-ness Committee (NDPPC) which was initially chaired by the prime minister, and subsequently by the deputy prime minister.
134. In 2007 the DPPC was disbanded and integrated into the Ministry of Agriculture and Rural Development (MoARD), becoming the DRMFSS, with a State Minister at the head and comprising two directorates – early warning and response and food security.
135. A new Disaster Risk Management Policy has been in development since 2009. This, if approved by the Council of Ministers, will radically change the system once again, seeking to mainstream disaster preparedness and prevention into development work, and decentralise both decision making and capacity in line with the constitution and the federal structure. In the interim the DRMFSS and the NDPPC remain the decision making bodies for disaster response overseeing such key processes as the assessment and HRD, and the strategic food security reserve (ESFRA).
136. The strength of the system means that the cluster system of coordination has been adapted to be useful in 2011, as was the case in 2006. Instead of formally activating all parts of the cluster system, the sector task forces put in place for development programming switch to emergency mode when needed. They are in turn supported by the appropriate cluster lead agencies in mak-ing this switch. This should be viewed as a success and hugely important in pursuing a resilience agenda for the future.
137. In 2011 the DRMFSS introduced a new strategic coordination body for multi-agency coordi-nation (S-MAC) at the federal level and a technical equivalent (T-MAC). This is chaired by the state minister and effectively binds together the Government system with its international partners who meet separately in the Ethiopia Humanitarian Country Team (EHCT).
138. This latest innovation has proven to be successful by allowing strategic bottlenecks to be resolved and for better dialogue between the various agencies involved to be put in place. It argu-ably did not meet as often as it could have, with the EHCT playing the major coordination role for international actors. There are now moves to establish this forum as a permanent entity.
139. The SMAC is jointly chaired by the Humanitarian Coordinator (HC) who has quietly played an important role in facilitating dialogue between government and international agencies.
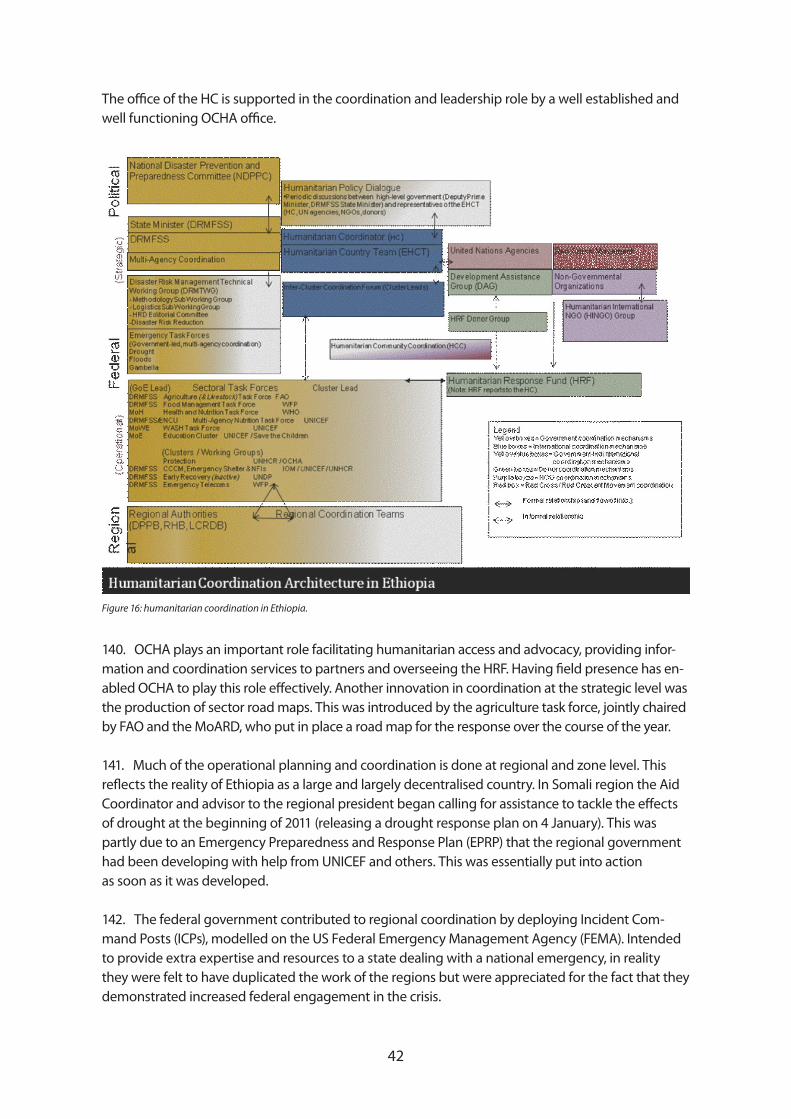
42 43
The office of the HC is supported in the coordination and leadership role by a well established and well functioning OCHA office.
Figure 16: humanitarian coordination in Ethiopia.
140. OCHA plays an important role facilitating humanitarian access and advocacy, providing infor-mation and coordination services to partners and overseeing the HRF. Having field presence has en-abled OCHA to play this role effectively. Another innovation in coordination at the strategic level was the production of sector road maps. This was introduced by the agriculture task force, jointly chaired by FAO and the MoARD, who put in place a road map for the response over the course of the year.
141. Much of the operational planning and coordination is done at regional and zone level. This reflects the reality of Ethiopia as a large and largely decentralised country. In Somali region the Aid Coordinator and advisor to the regional president began calling for assistance to tackle the effects of drought at the beginning of 2011 (releasing a drought response plan on 4 January). This was partly due to an Emergency Preparedness and Response Plan (EPRP) that the regional government had been developing with help from UNICEF and others. This was essentially put into action as soon as it was developed.
142. The federal government contributed to regional coordination by deploying Incident Com-mand Posts (ICPs), modelled on the US Federal Emergency Management Agency (FEMA). Intended to provide extra expertise and resources to a state dealing with a national emergency, in reality they were felt to have duplicated the work of the regions but were appreciated for the fact that they demonstrated increased federal engagement in the crisis.
42 43
143. Task forces were established at the zonal level.46 They also oversaw committees at the woreda and kebele, the main implementing levels. Whilst this coordination worked well and was much appreciated by partner agencies, it was often less systematic than regional coordination. Gaps were identified and covered but the packages people received depended to an extent on the implementing agency. In Borena, cash for work programmes varied between Birr 350 and Birr 750 per month depending on the agency (NGO) involved. Some woredas saw re-stocking programmes, whilst others did not appear to have done so at the time of the evaluation.
144. Such variation appears to be less about the authorities’ desire to ensure equity and more about how agencies view the situation and where they wish to work. In SNNP the coordination was much more systematic, reflecting a harder approach on the part of the regional authorities to coor-dination. NGOs, when they were allowed to work (and this was universally late), were allocated areas and effectively did the same thing – support to OTPs and SCs. This ensured uniformity of assistance – a good thing – but the delay in allowing work to start was frustrating for Woreda officials who could see the situation evolving. In reality NGOs with resources and presence started their support before receiving official sanction, meaning the bureaucratic delays did not hinder the response, apart from in those areas without ongoing NGO support.
Fig 17: Borena zone task force coordination map
46 In Borena zone (Yabello, Oromia region), for example, the very active heads of zone and relevant departments held weekly partner meetings
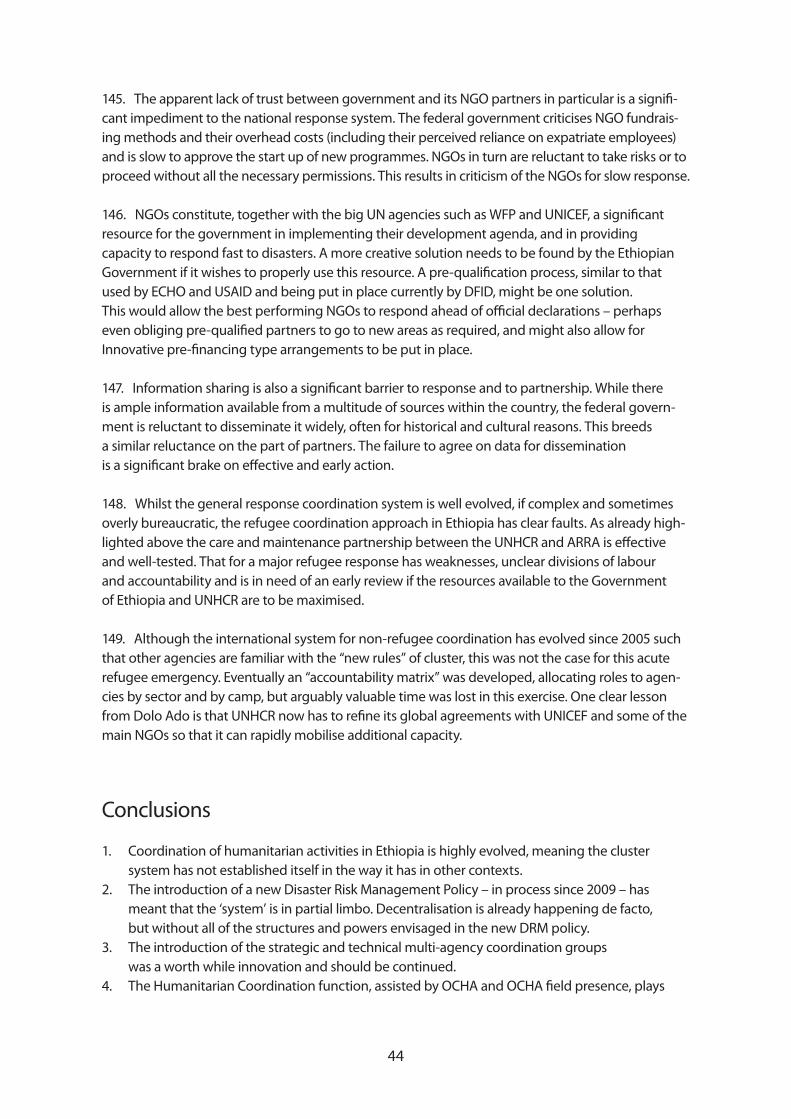
44 45
145. The apparent lack of trust between government and its NGO partners in particular is a signifi-cant impediment to the national response system. The federal government criticises NGO fundrais-ing methods and their overhead costs (including their perceived reliance on expatriate employees) and is slow to approve the start up of new programmes. NGOs in turn are reluctant to take risks or to proceed without all the necessary permissions. This results in criticism of the NGOs for slow response.
146. NGOs constitute, together with the big UN agencies such as WFP and UNICEF, a significant resource for the government in implementing their development agenda, and in providing capacity to respond fast to disasters. A more creative solution needs to be found by the Ethiopian Government if it wishes to properly use this resource. A pre-qualification process, similar to that used by ECHO and USAID and being put in place currently by DFID, might be one solution. This would allow the best performing NGOs to respond ahead of official declarations – perhaps even obliging pre-qualified partners to go to new areas as required, and might also allow for Innovative pre-financing type arrangements to be put in place.
147. Information sharing is also a significant barrier to response and to partnership. While there is ample information available from a multitude of sources within the country, the federal govern-ment is reluctant to disseminate it widely, often for historical and cultural reasons. This breeds a similar reluctance on the part of partners. The failure to agree on data for dissemination is a significant brake on effective and early action.
148. Whilst the general response coordination system is well evolved, if complex and sometimes overly bureaucratic, the refugee coordination approach in Ethiopia has clear faults. As already high-lighted above the care and maintenance partnership between the UNHCR and ARRA is effective and well-tested. That for a major refugee response has weaknesses, unclear divisions of labour and accountability and is in need of an early review if the resources available to the Government of Ethiopia and UNHCR are to be maximised.
149. Although the international system for non-refugee coordination has evolved since 2005 such that other agencies are familiar with the “new rules” of cluster, this was not the case for this acute refugee emergency. Eventually an “accountability matrix” was developed, allocating roles to agen-cies by sector and by camp, but arguably valuable time was lost in this exercise. One clear lesson from Dolo Ado is that UNHCR now has to refine its global agreements with UNICEF and some of the main NGOs so that it can rapidly mobilise additional capacity.
Conclusions
1. Coordination of humanitarian activities in Ethiopia is highly evolved, meaning the cluster system has not established itself in the way it has in other contexts.2. The introduction of a new Disaster Risk Management Policy – in process since 2009 – has meant that the ‘system’ is in partial limbo. Decentralisation is already happening de facto, but without all of the structures and powers envisaged in the new DRM policy.3. The introduction of the strategic and technical multi-agency coordination groups was a worth while innovation and should be continued.4. The Humanitarian Coordination function, assisted by OCHA and OCHA field presence, plays
44 45
a valuable role in bringing all of the actors together and negotiating space in which work can be carried out, whilst at the same time pursuing the most important issues. 5. The lack of trust in NGO partners, and reluctance to release information early, is a significant brake on rapid action.6. The refugee co-ordination system for acute emergencies needs a major overhaul in Ethiopia and lessons can be learned for emergency co-ordination internationally.
n Main finding 3: Coordination in Ethiopia works well and can be further enhanced with more decentralisation and more systematic linkage between government and its international partners.
n Main recommendation 3:Finalise the new disaster risk management policy and work with the regions to enhance their capacity.
3.4 Response covering the needs and set standards
150. This evaluation has already concluded that the response in Ethiopia saved lives. The figures from the nutritional feeding programme (the OTP system) are all well within the Sphere standards. Over 329,000 children were treated for severe acute malnutrition in 2011 with an 83.7% recovery rate, 4.7% defaulter rate and 0.5% mortality rate. These compare well to the Sphere standards of 75%, 15% and 3% respectively. They are also improvements on previous years, despite having a third more children in 2011 than 2010, and three times as many as in 2009.47
151. The focus group and household interviews conducted for this evaluation also confirm what the national and local statistics indicate. People interviewed did not identify family members as having died as a result of the emergency (apart from refugees), despite many clearly identifying themselves as having suffered disaster. Household interviews also identified high levels of satisfac-tion with assistance provided, especially in Borena.
152. Standards in water provision were well below the level counted as ideal by the population from focus group interviews for this evaluation. This is the Ministry of Water guidance and is within the bounds of the new Sphere guidelines on ‘survival’. However people were also clear in interviews that water provision was “life saving”. This despite the already mentioned irregularity of supply, which meant in reality people received different quantities at different times. It was not enough for animals or for household use.
153. The food ration is set at the Sphere standard of 2,100kcals/ adult/ day and in general was delivered as such. Once again this broad judgement masks a plethora of detail; rations were some-times reduced especially with regard to the usual high value commodities such as oil. The PSNP ration is not a full food basket, but is not strictly intended as such, meaning that when households are in full blown emergency there is a discrepancy between the fuller ration that ‘relief’ beneficiaries receive and that given to PSNP clients. CSB, as has also already been noted elsewhere in this report,
47 In 2008 there were 116,000 children admitted to TFP care with a recovery rate of 77%. In 2010, 232,000 children were admitted into TFP care with a recovery rate of 82%. In 2011 the figure was 329,000 children with a recovery rate of 84%.
46 47
was particularly erratic and not well connected to the OTP programme. Nevertheless in general it appears that the system delivered people the required ration most of the time, mostly on time.
Fig 18: monthly admission rates into OTP care during 2011.
154. Standards in the health sector are more difficult to judge. The evaluation was not supplied with health data, despite requests to both WHO and the epidemiology unit of the Ministry of Health. Reports over the course of 2011 indicate outbreaks of acute watery diarrhoea, measles and other communicable diseases, but the scale and the mortality associated with these cannot be reli-ably assessed. From household interviews it does not appear, in the areas sampled, that there were health issues above and beyond the norm. Sample areas were not chosen with regard to morbidity data, however, making any conclusion unreliable.
155. The health system was undoubtedly reinforced during the 2011 emergency. More than 50 mobile health clinics ran in Somali region and the OTP system that provided nutritional care was also the first port of call for basic health provision (more accurately these health posts also delivered nutritional care). NGOs and UN agencies supplemented the government drug supply, and supple-mentary immunisation campaigns were carried out in at risk areas (with the Ministry of Health, WHO and UNICEF collaborating to immunise 7 million children against measles as just one example).
156. Standards in the livestock sector were also broadly followed with the Livestock Emergency Guidelines (LEGS) used to assist in decision making such as when to stop interventions. As has been discussed elsewhere in the evaluation, the livelihoods and livestock sectors, whilst certainly paid more attention than in the past, were under-funded compared to other interventions and to the value placed on them by beneficiaries. In brief:
n Livelihoods have suffered across the intervention area, although to what degree is not clear. Asset depletion was high in the short term. Whether recovery is possible will depend on good rains in the next two to three years.n There is a continued disconnect between the technical needs assessment process and timely intervention. SNNP and Oromia figures tripled in July, but by then the worst of the emergency was over.n Pastoralist dropouts face an unnecessary dependence whilst beneficiaries express a clear will to adapt to a changing situation.
46 47
n PSNP and OTP clearly addressed at least half the problem in highland areas but did not prevent disposal of assets. n External and internal trade and migration flows are a significant but under-analysed factor.
3.4.1 Refugees
157. The refugee issue has been referred to several times in preceding sections of this evalua-tion. The “catastrophic” mortality figures and “alarming” malnutrition rates (both UNHCR’s own language) deserve more detailed analysis than the main body of the report can offer. The mortal-ity rates recorded in Dolo were the worst in 23 years and were not rivalled either in neighbouring Kenyan refugee camps or in IDP camps inside Somalia that could be accessed. The degree to which this represents a failure of response therefore is analysed in some detail in annex 5.
158. From the perspective of the evaluation the crisis in Dolo Ado suggests there is a need for a thorough examination of UNHCR’s capability to manage acute emergencies such as the one which took place in Dolo Ado and that this might also provide valuable learning.
Conclusions
1. Internationally recognised standards appear to have been met and exceeded in the food security and nutrition sector.2. Standards for potable water were below the beneficiary ideal but commensurate with Government of Ethiopia standards. Beneficiaries were highly appreciative of this assistance as a lifesaving intervention.3. There was a significant amount of beneficiary consultation, especially in Borena.4. Despite this the biggest expressed need of livestock feed and livelihoods support generally was insufficiently resourced.5. The refugee response was initially slow, resulting in alarming rates of malnutrition and catastrophic rates of mortality.
n Main finding 4: Internationally recognised standards have been met with a significant degree of beneficiary satisfaction apart from in the early refugee response.
n Main recommendation 4:Scale up livestock response measures and asset (livelihoods) protection measures.
48 49
Section 4. Conclusions & Recommendations
159. The recommendations set out in the matrix below were generated over the course of a two day workshop in Addis Ababa, following the data gathering phase and initial feedback of the evalu-ation. The participants were a broad range of implementers and policy makers, including govern-ment, major donors, UN agencies and NGOs. They represent the cumulative experience of the aid community in Ethiopia and are both strategic and achievable.
160. The recommendations cover a range of strategic and operational issues. Where possible the groups decided who the recommendations were primarily aimed at and a timeframe.
161. The evaluation team has attempted to be as true as possible both to the spirit and the letter of the recommendations developed by this group and as it represents consensus it is more likely to be implemented. In line with IASC endorsed RTE guidelines, the evaluation recommends that the HC, (with the support of DRMFSS and OCHA) develop a management response to the recommendations and tracks the implementation of those the government and the UN have accepted.
For clarity and accessibility the evaluation team have also developed four over-arching conclu-sions and recommendations, attempting to summarise both the findings of the evaluation and the work represented by the list of recommendations below. These are also reproduced in the main body of the report and the executive summary.
Needs assessment and early warningn Main finding:The needs assessment and early warning system is technically good but the political approval pro-cess slows the system down.
n Main recommendation:Ensure the early warning and needs assessments are released early with figures accurately match-ing the technical findings.
Conclusions
1. Needs identified were, by and large met.2. The Early Warning System is highly efficient, but does not permit early action to be taken.3. The multi-agency assessment process is hostage to the auditing process carried out at various levels due to issues of trust.4. There needs to be recognition that pastoralist adaptation strategies match those of government.
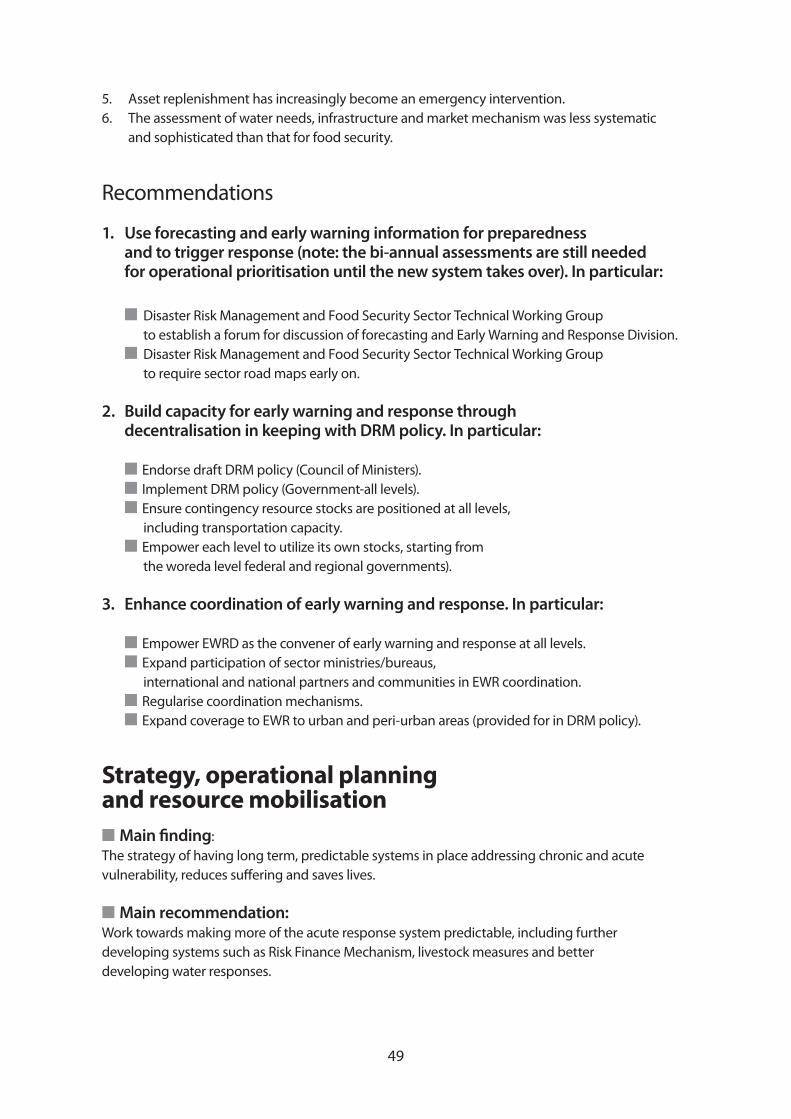
48 49
5. Asset replenishment has increasingly become an emergency intervention.6. The assessment of water needs, infrastructure and market mechanism was less systematic and sophisticated than that for food security.
Recommendations
1. Use forecasting and early warning information for preparedness and to trigger response (note: the bi-annual assessments are still needed for operational prioritisation until the new system takes over). In particular:
n Disaster Risk Management and Food Security Sector Technical Working Group to establish a forum for discussion of forecasting and Early Warning and Response Division. n Disaster Risk Management and Food Security Sector Technical Working Group to require sector road maps early on.
2. Build capacity for early warning and response through decentralisation in keeping with DRM policy. In particular:
n Endorse draft DRM policy (Council of Ministers). n Implement DRM policy (Government-all levels). n Ensure contingency resource stocks are positioned at all levels, including transportation capacity. n Empower each level to utilize its own stocks, starting from the woreda level federal and regional governments).
3. Enhance coordination of early warning and response. In particular:
n Empower EWRD as the convener of early warning and response at all levels. n Expand participation of sector ministries/bureaus, international and national partners and communities in EWR coordination. n Regularise coordination mechanisms. n Expand coverage to EWR to urban and peri-urban areas (provided for in DRM policy).
Strategy, operational planning and resource mobilisationn Main finding:The strategy of having long term, predictable systems in place addressing chronic and acute vulnerability, reduces suffering and saves lives.
n Main recommendation:Work towards making more of the acute response system predictable, including further developing systems such as Risk Finance Mechanism, livestock measures and better developing water responses.
50 51
Conclusions
1. The long term strategy put in place for chronic and acute need prevented famine and hunger related deaths in 2011.2. The PSNP played a major role in ensuring that people did not “fall off the edge” into starvation.3. PSNP works less well in pastoral areas, meaning they are still largely reliant on relief food.4. Whilst the 2011 operation saved lives, it did not save livelihoods. 5. In a year like 2011 assets are depleted, potentially leading to destitution. In a good year the PSNP allows households to rebuild their assets. The balance between these two scenarios is critical.6. The decentralised health and nutrition (OTP) system saved thousands of lives, catering for over 329,000 severely acutely malnourished children. 7. The OTP system needed reinforcing through NGO logistical support to cope with the sharp increase in intake. There were also pipeline issues with RUTF, although these were not critical.8. The general food ration pipeline held, through a combination of good forward planning and use of the Ethiopian Strategic Food Reserve Agency.9. Water supply was another critical life saving intervention, with over four million people receiving assistance. The emergency water system is ad hoc, and inefficient as a result. A systematic approach needs to be developed, in the same way as for food security.10. Resource mobilisation was a success in 2011, with a large amount of the financing in place early. There were several useful innovations that could potentially be expanded.
Recommendations
1. Strengthen safety net programmes, expand the coverage of the PSNP and clarify its future. In particular:
n Expand the coverage/retarget the PSNP, starting with a holistic picture of the woreda population. Government – all levels, donors, international actors and communities. n Strengthen and adapt PSNP/social protection policies for pastoralist areas (government supported by donors, UN & NGOs in mid-term - three years). n Ensure that emergency mechanisms (i.e. HRD) cover the gap between PSNP coverage (in PSNP woredas) and total population in need (including in non-PSNP woredas). Government-all levels, international and national humanitarian actors, donors, communities. n Develop stronger linkages between safety net mechanisms and mainstream development objectives/programmes. Government-all levels, development partners. n Address the “disincentives” for graduation (i.e. loss of capital funds for infrastructure development that support public works). n Rather than focusing on ending PSNP, shift the dialogue to renegotiating the programme post-2014. n Support the decentralisation of decision-making on assistance coverage i.e. kebele/woreda officials make the recommendation, which is final.
2. Improve the linkages and harmonisation between humanitarian and development programmes. In particular:
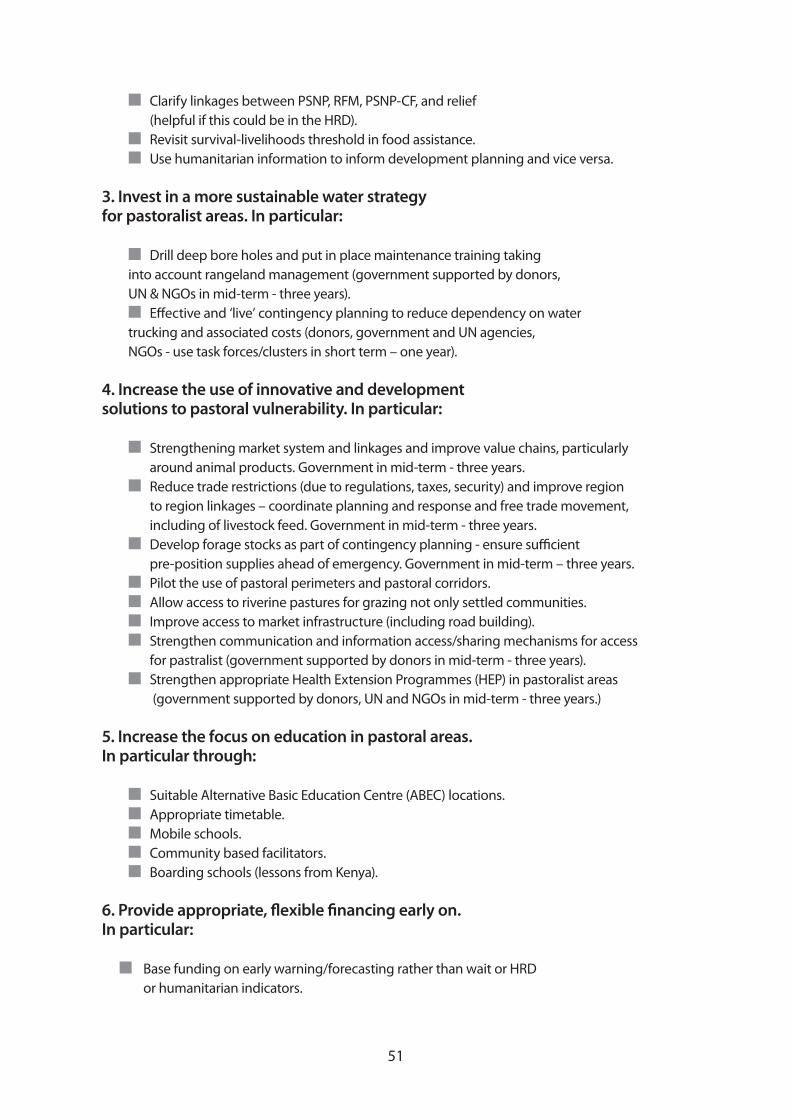
50 51
n Clarify linkages between PSNP, RFM, PSNP-CF, and relief (helpful if this could be in the HRD). n Revisit survival-livelihoods threshold in food assistance. n Use humanitarian information to inform development planning and vice versa.
3. Invest in a more sustainable water strategy for pastoralist areas. In particular:
n Drill deep bore holes and put in place maintenance training taking into account rangeland management (government supported by donors, UN & NGOs in mid-term - three years). n Effective and ‘live’ contingency planning to reduce dependency on water trucking and associated costs (donors, government and UN agencies, NGOs - use task forces/clusters in short term – one year).
4. Increase the use of innovative and development solutions to pastoral vulnerability. In particular:
n Strengthening market system and linkages and improve value chains, particularly around animal products. Government in mid-term - three years. n Reduce trade restrictions (due to regulations, taxes, security) and improve region to region linkages – coordinate planning and response and free trade movement, including of livestock feed. Government in mid-term - three years. n Develop forage stocks as part of contingency planning - ensure sufficient pre-position supplies ahead of emergency. Government in mid-term – three years. n Pilot the use of pastoral perimeters and pastoral corridors. n Allow access to riverine pastures for grazing not only settled communities. n Improve access to market infrastructure (including road building). n Strengthen communication and information access/sharing mechanisms for access for pastralist (government supported by donors in mid-term - three years). n Strengthen appropriate Health Extension Programmes (HEP) in pastoralist areas (government supported by donors, UN and NGOs in mid-term - three years.)
5. Increase the focus on education in pastoral areas.In particular through:
n Suitable Alternative Basic Education Centre (ABEC) locations. n Appropriate timetable. n Mobile schools. n Community based facilitators. n Boarding schools (lessons from Kenya).
6. Provide appropriate, flexible financing early on.In particular:
n Base funding on early warning/forecasting rather than wait or HRD or humanitarian indicators.
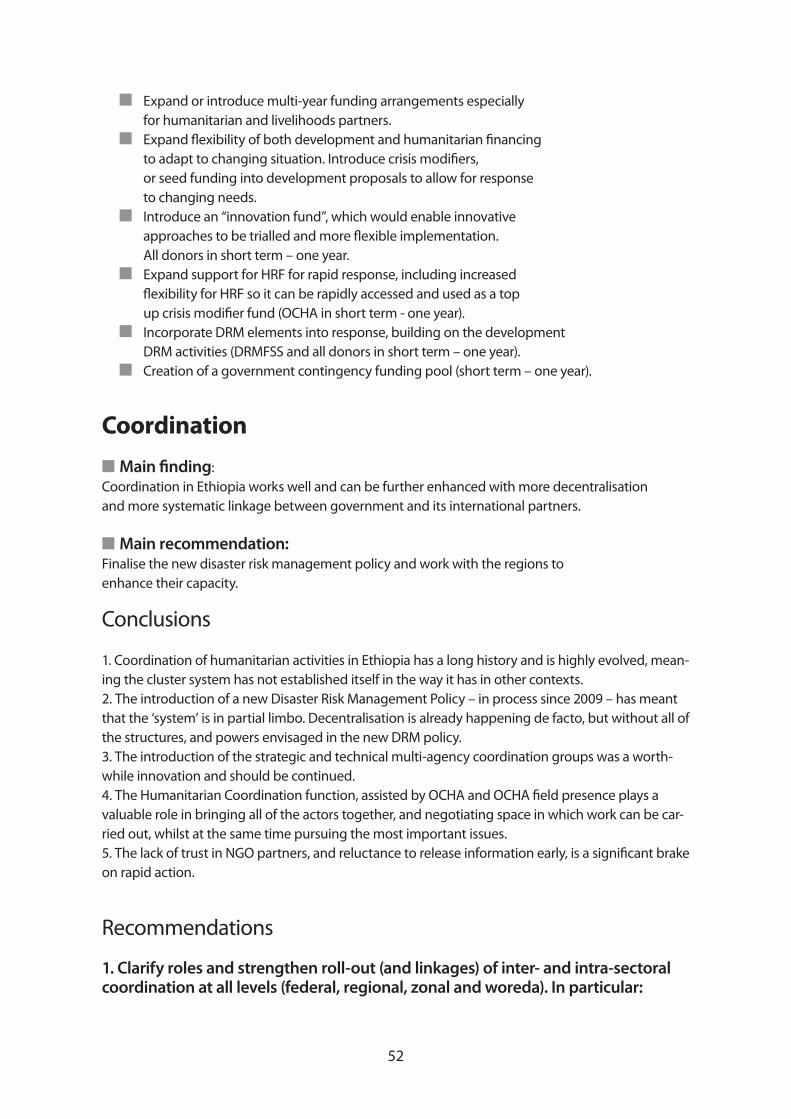
52 53
n Expand or introduce multi-year funding arrangements especially for humanitarian and livelihoods partners. n Expand flexibility of both development and humanitarian financing to adapt to changing situation. Introduce crisis modifiers, or seed funding into development proposals to allow for response to changing needs. n Introduce an “innovation fund”, which would enable innovative approaches to be trialled and more flexible implementation. All donors in short term – one year. n Expand support for HRF for rapid response, including increased flexibility for HRF so it can be rapidly accessed and used as a top up crisis modifier fund (OCHA in short term - one year). n Incorporate DRM elements into response, building on the development DRM activities (DRMFSS and all donors in short term – one year). n Creation of a government contingency funding pool (short term – one year).
Coordinationn Main finding:Coordination in Ethiopia works well and can be further enhanced with more decentralisation and more systematic linkage between government and its international partners.
n Main recommendation:Finalise the new disaster risk management policy and work with the regions to enhance their capacity.
Conclusions
1. Coordination of humanitarian activities in Ethiopia has a long history and is highly evolved, mean-ing the cluster system has not established itself in the way it has in other contexts.2. The introduction of a new Disaster Risk Management Policy – in process since 2009 – has meant that the ‘system’ is in partial limbo. Decentralisation is already happening de facto, but without all of the structures, and powers envisaged in the new DRM policy.3. The introduction of the strategic and technical multi-agency coordination groups was a worth-while innovation and should be continued.4. The Humanitarian Coordination function, assisted by OCHA and OCHA field presence plays a valuable role in bringing all of the actors together, and negotiating space in which work can be car-ried out, whilst at the same time pursuing the most important issues. 5. The lack of trust in NGO partners, and reluctance to release information early, is a significant brake on rapid action.
Recommendations
1. Clarify roles and strengthen roll-out (and linkages) of inter- and intra-sectoral coordination at all levels (federal, regional, zonal and woreda). In particular:
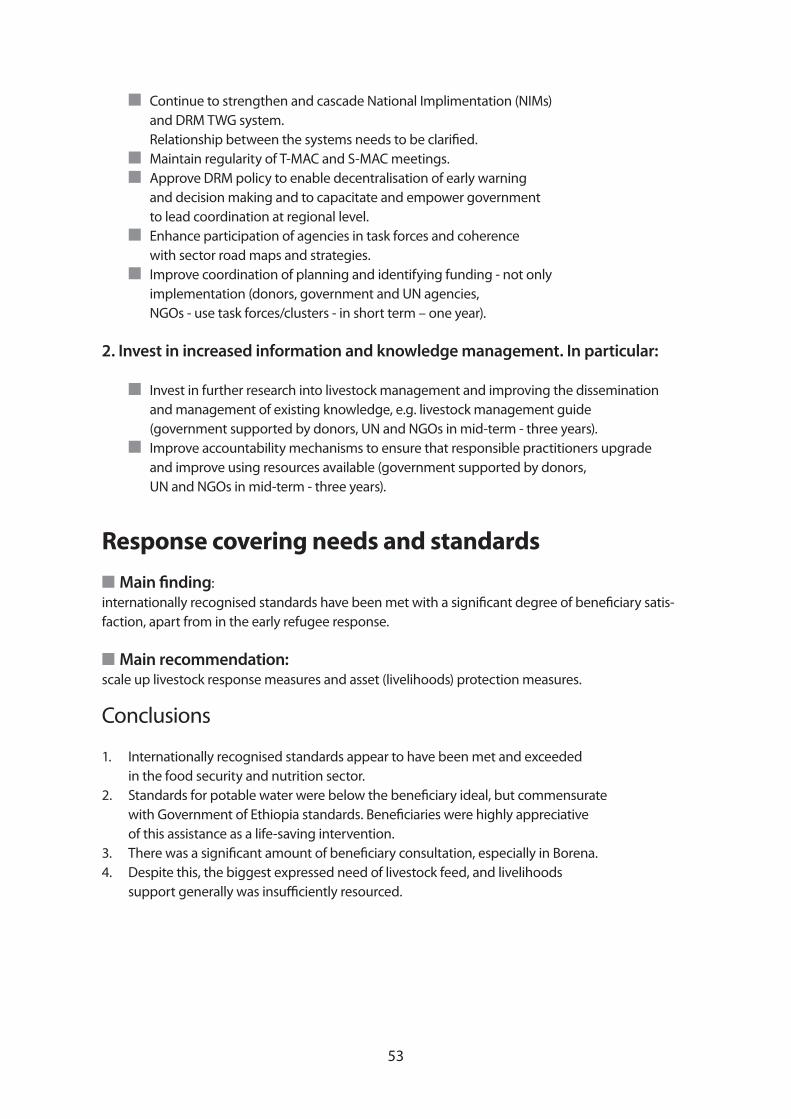
52 53
n Continue to strengthen and cascade National Implimentation (NIMs) and DRM TWG system. Relationship between the systems needs to be clarified. n Maintain regularity of T-MAC and S-MAC meetings. n Approve DRM policy to enable decentralisation of early warning and decision making and to capacitate and empower government to lead coordination at regional level. n Enhance participation of agencies in task forces and coherence with sector road maps and strategies. n Improve coordination of planning and identifying funding - not only implementation (donors, government and UN agencies, NGOs - use task forces/clusters - in short term – one year).
2. Invest in increased information and knowledge management. In particular:
n Invest in further research into livestock management and improving the dissemination and management of existing knowledge, e.g. livestock management guide (government supported by donors, UN and NGOs in mid-term - three years). n Improve accountability mechanisms to ensure that responsible practitioners upgrade and improve using resources available (government supported by donors, UN and NGOs in mid-term - three years).
Response covering needs and standardsn Main finding: internationally recognised standards have been met with a significant degree of beneficiary satis-faction, apart from in the early refugee response.
n Main recommendation:scale up livestock response measures and asset (livelihoods) protection measures.
Conclusions
1. Internationally recognised standards appear to have been met and exceeded in the food security and nutrition sector.2. Standards for potable water were below the beneficiary ideal, but commensurate with Government of Ethiopia standards. Beneficiaries were highly appreciative of this assistance as a life-saving intervention.3. There was a significant amount of beneficiary consultation, especially in Borena.4. Despite this, the biggest expressed need of livestock feed, and livelihoods support generally was insufficiently resourced.
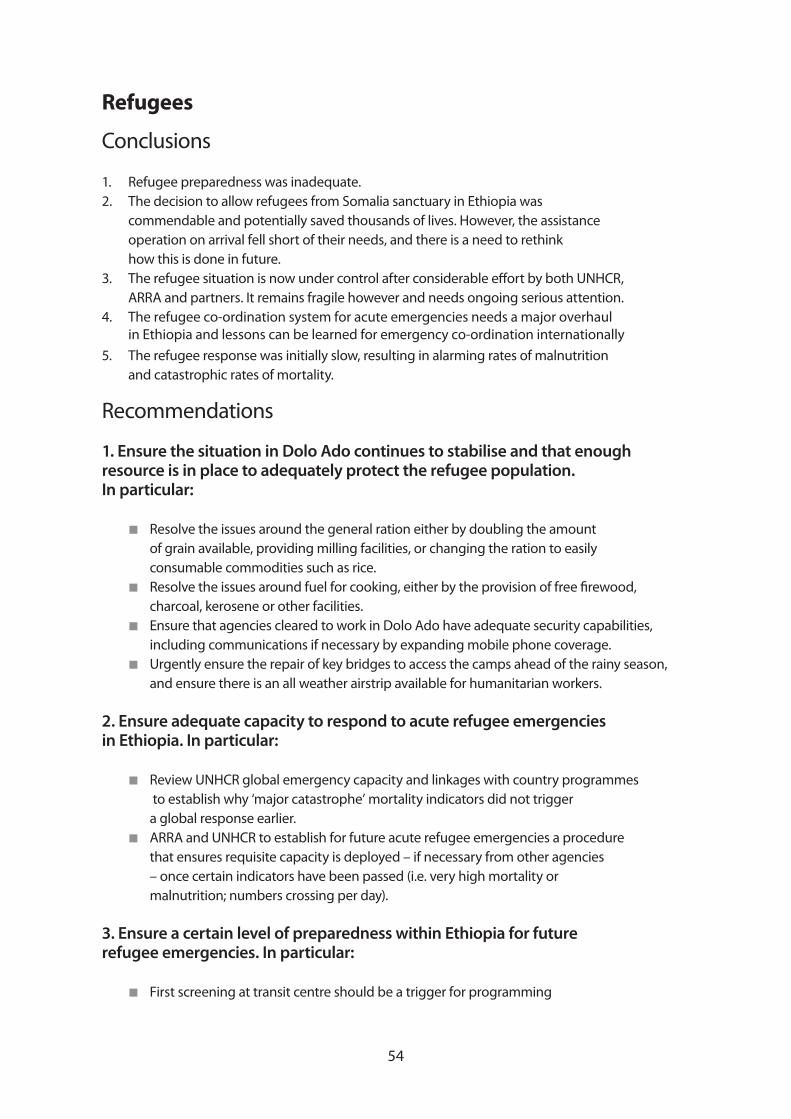
54
Refugees
Conclusions
1. Refugee preparedness was inadequate.2. The decision to allow refugees from Somalia sanctuary in Ethiopia was commendable and potentially saved thousands of lives. However, the assistance operation on arrival fell short of their needs, and there is a need to rethink how this is done in future.3. ARRA and partners. It remains fragile however and needs ongoing serious attention.4. The refugee co-ordination system for acute emergencies needs a major overhaul
in Ethiopia and lessons can be learned for emergency co-ordination internationally
5. The refugee response was initially slow, resulting in alarming rates of malnutrition and catastrophic rates of mortality.
Recommendations
1. Ensure the situation in Dolo Ado continues to stabilise and that enough resource is in place to adequately protect the refugee population. In particular:
■ Resolve the issues around the general ration either by doubling the amount of grain available, providing milling facilities, or changing the ration to easily consumable commodities such as rice. ■ charcoal, kerosene or other facilities. ■ Ensure that agencies cleared to work in Dolo Ado have adequate security capabilities, including communications if necessary by expanding mobile phone coverage. ■ Urgently ensure the repair of key bridges to access the camps ahead of the rainy season, and ensure there is an all weather airstrip available for humanitarian workers.
2. Ensure adequate capacity to respond to acute refugee emergencies in Ethiopia. In particular:
■ Review UNHCR global emergency capacity and linkages with country programmes to establish why ‘major catastrophe’ mortality indicators did not trigger a global response earlier. ■ ARRA and UNHCR to establish for future acute refugee emergencies a procedure that ensures requisite capacity is deployed – if necessary from other agencies – once certain indicators have been passed (i.e. very high mortality or malnutrition; numbers crossing per day). 3. Ensure a certain level of preparedness within Ethiopia for future refugee emergencies. In particular:
■ First screening at transit centre should be a trigger for programming
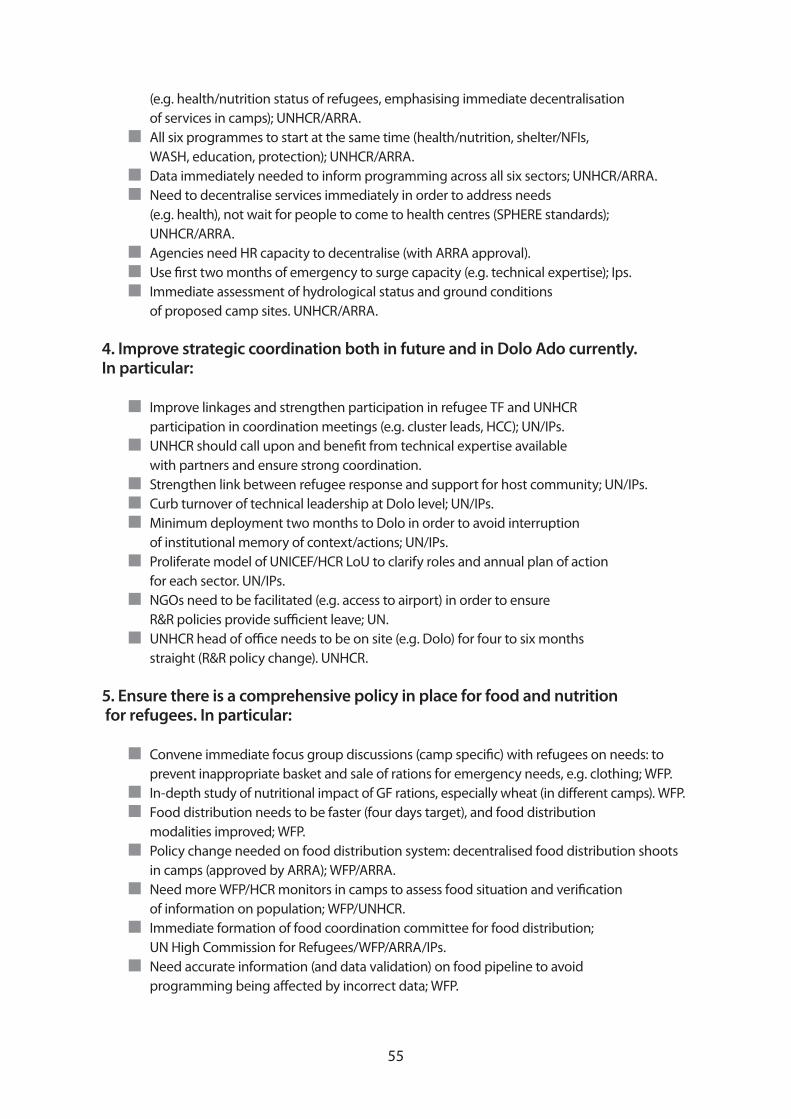
54 55
(e.g. health/nutrition status of refugees, emphasising immediate decentralisation of services in camps); UNHCR/ARRA. n All six programmes to start at the same time (health/nutrition, shelter/NFIs, WASH, education, protection); UNHCR/ARRA.n Data immediately needed to inform programming across all six sectors; UNHCR/ARRA. n Need to decentralise services immediately in order to address needs (e.g. health), not wait for people to come to health centres (SPHERE standards); UNHCR/ARRA. n Agencies need HR capacity to decentralise (with ARRA approval).n Use first two months of emergency to surge capacity (e.g. technical expertise); Ips.n Immediate assessment of hydrological status and ground conditions of proposed camp sites. UNHCR/ARRA.
4. Improve strategic coordination both in future and in Dolo Ado currently. In particular:
n Improve linkages and strengthen participation in refugee TF and UNHCR participation in coordination meetings (e.g. cluster leads, HCC); UN/IPs.n UNHCR should call upon and benefit from technical expertise available with partners and ensure strong coordination.n Strengthen link between refugee response and support for host community; UN/IPs.n Curb turnover of technical leadership at Dolo level; UN/IPs.n Minimum deployment two months to Dolo in order to avoid interruption of institutional memory of context/actions; UN/IPs.n Proliferate model of UNICEF/HCR LoU to clarify roles and annual plan of action for each sector. UN/IPs.n NGOs need to be facilitated (e.g. access to airport) in order to ensure R&R policies provide sufficient leave; UN.n UNHCR head of office needs to be on site (e.g. Dolo) for four to six months straight (R&R policy change). UNHCR.
5. Ensure there is a comprehensive policy in place for food and nutrition for refugees. In particular:
n Convene immediate focus group discussions (camp specific) with refugees on needs: to prevent inappropriate basket and sale of rations for emergency needs, e.g. clothing; WFP.n In-depth study of nutritional impact of GF rations, especially wheat (in different camps). WFP.n Food distribution needs to be faster (four days target), and food distribution modalities improved; WFP.n Policy change needed on food distribution system: decentralised food distribution shoots in camps (approved by ARRA); WFP/ARRA.n Need more WFP/HCR monitors in camps to assess food situation and verification of information on population; WFP/UNHCR.n Immediate formation of food coordination committee for food distribution; UN High Commission for Refugees/WFP/ARRA/IPs.n Need accurate information (and data validation) on food pipeline to avoid programming being affected by incorrect data; WFP.
56 57
n Socio-cultural norms and preferred diet need to be incorporated into programming (provide the staple diet of the target population).WFP.
6. Ensure the data collection system, including for health information, is properly in place and adopted by all partners. In particular:
n Existing standardised emergency data collection system (developed by UNHCR and approved by ARRA), to be rolled-out and officially adopted by all IPs (and continuously evaluated). UNHCR/INGOs.n Realistic information platform in place (taking into consideration limited internet access, low tech information strategies needed). UNHCR.n Health Information System (HIS) group to be created within UNHCR Emergency Response Team (ERT) system (need people on stand-by for immediate deployment). UNHCR.n Agencies need data specialist in order to ensure data input AND information specialists at UN sectors (to analyse data).n ARRA information specialists available for deployment. ARRA.

56 57