
Real-Time eneRgy managemenT - NRDC · PDF fileReal-Time eneRgy managemenT A CAse study of...
30
REAL-TIME ENERGY MANAGEMENT A CASE STUDY OF THREE LARGE COMMERCIAL BUILDINGS IN WASHINGTON, D.C. N R DC CASE STUDY OCTOBER 2013 CS:13-07-A AUTHORS Philip Henderson Meg Waltner Natural Resources Defense Council
Transcript of Real-Time eneRgy managemenT - NRDC · PDF fileReal-Time eneRgy managemenT A CAse study of...
Real-Time eneRgy managemenT A CAse study of three LArge CommerCiAL BuiLdings in WAshington, d.C.
NRDC CAse study october 2013Cs:13-07-A
AuthorsPhilip hendersonmeg Waltner Natural Resources Defense Council

AcknowledgmentsMany thanks to Tower Companies for enabling this case study, especially David Borchardt and Eugenia Gregorio for shepherding the authors through the project, fulfilling endless data requests, and providing visibility into the daily life of three buildings. The AtSite team was gracious and professional throughout this project. They allowed us to watch their work, they educated our team, shared data and methods, and exhibited patience with our data requests. Thank you to Jeremy Poling, of Goby LLC, in Chicago, Illinois, and to David Goldstein of NRDC for their excellent comments and general review of our work and findings. The authors are indebted to Robin Roy of NRDC for his leadership and guidance throughout this project—many of the ideas that launched this project were his. And thank you to Jessica Lam, our Stanback Intern in 2012, for her hard work and diligence on this project. Many thanks to NRDC and the Center for Market Innovation for providing the time, funding, and support to pursue this project. Jeffrey Abramson, a principal of Tower Companies, serves on an advisory board for NRDC’s Center for Market Innovation.
About the Authors PHILIP HENDERSON is a Senior Financial Policy Specialist with the Center for Market Innovation. Philip’s work with CMI is focused on buildings, specifically how to use financing tools and information technology to achieve greater energy efficiency. Following work on Capitol Hill and with a law firm, he worked at LendingTree from 1999 to 2006, as legal counsel and on the business team. Philip was then General Counsel for Overture Technologies, a firm that creates underwriting systems that enable greater rigor and transparency in loan decisions. Philip has a law degree from the
University of Virginia.
MEg WaLtNER works in the Natural Resources Defense Council’s San Francisco office as the Manager for Building Energy Policy. In her work at NRDC, Meg advocates for policies to promote energy efficiency in buildings and appliances at both the state and federal level, including building energy codes, appliance standards, voluntary labels and rating systems, and incentive programs. Meg started with NRDC in 2009 in its Washington, DC office where she worked on federal policies to promote building efficiency. Meg transferred to NRDC’s San Francisco office in 2013
where she is NRDC’s lead advocate for California’s building energy code and other state and federal policies related to building efficiency. Meg is an engineer by training, holding an MS and BS in Civil and Environmental Engineering from Stanford University, with a focus on efficiency in buildings and renewable energy technologies. Meg is also a LEED AP.
About NrDc’s center for Market InnovationThe core mission of the Center for Market Innovation (CMI) is to expand the impact of the Natural Resources Defense Council by creating market conditions that will redirect capital flows toward sustainable uses. We believe that engaging mainstream capital is a critical component in achieving our common goals. We do so by engaging with the business community to articulate and implement sustainable value propositions, with a current focus on energy efficiency, water management, and regenerative agriculture.
About NrDcThe Natural Resources Defense Council is an international nonprofit environmental organization with more than 1.4 million members and online activists. Since 1970, our lawyers, scientists, and other environmental specialists have worked to protect the world's natural resources, public health, and the environment. NRDC has offices in New York City, Washington, D.C., Los Angeles, San Francisco, Chicago, Bozeman, and Beijing. Visit us at www.nrdc.org and follow us on Twitter @NRDC.
NRDC’s policy publications aim to inform and influence solutions to the world’s most pressing environmental and public health issues. For additional policy content, visit our online policy portal at www.nrdc.org/policy.
NRDC Director of Communications: Edwin ChenNRDC Deputy Director of Communications: Lisa GoffrediNRDC Policy Communications Director: Alex KennaughLead Editor: Carlita SalazarDesign and Production: www.suerossi.comPhotos: Photos of buildings used on the cover and throughout this case study are credited to Ron Blunt Photography.
© 2013 Natural Resources Defense Council
tAble of coNteNts
I. executive summary ................................................................................................................................................................. 4
II. Project Description ................................................................................................................................................................... 8
III. case studies ............................................................................................................................................................................ 10
IV. expenses .................................................................................................................................................................................. 17
V. our findings ............................................................................................................................................................................ 19
VI. conclusion ............................................................................................................................................................................... 23
VII. Appendices .............................................................................................................................................................................. 24
endnotes ....................................................................................................................................................................................... 29
PAGe 4 | reAl-tIMe eNerGY MANAGeMeNt IN three lArGe coMMercIAl offIce buIlDINGs
This case study examines the energy management initiative implemented by
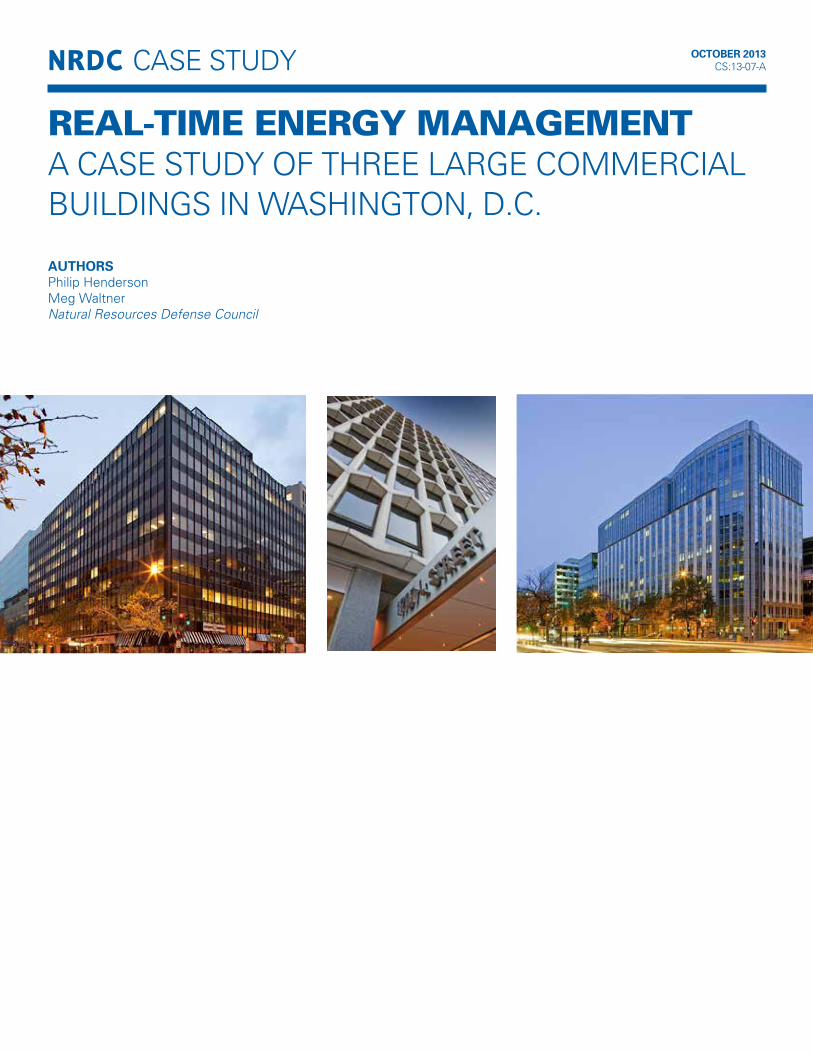
The Tower Companies (“Tower”), in three large, multi-tenant office buildings
it owns and operates in downtown Washington, D.C. The buildings are located
at 1707 L Street NW, 1828 L Street NW, and 1909 K Street NW.
Tower’s initiative was designed to deliver to its buildings operations team better
information about the energy use in each building to catch and correct operational
stray, and to provide actionable recommendations to optimize energy use.
This case study found that Tower’s real-time energy management initiative
achieved a 13.2 percent reduction in electricity use in the three buildings, showing
that substantial gains are possible when building owners operate their buildings with
attention devoted to reducing the amount of energy wasted.
The project was highly profitable, with savings from reduced electricity use in the
first year alone exceeding total project expenses by more than $74,000. Additional
savings are expected from reduced maintenance expenses, and savings are expected
to be persistent beyond year one.
The energy management initiative that produced these strong results focused on
operational improvements—measures that do not require construction, disruption
to an occupied office building, or substantial capital investment. This case study
provides building owners, tenants, efficiency programs, and others with a model
of an energy management initiative with proven results.
I. executIVe suMMArY
PAGe 5 | reAl-tIMe eNerGY MANAGeMeNt IN three lArGe coMMercIAl offIce buIlDINGs
tower’s energy Management InitiativeThe centerpiece of Tower’s initiative was engaging AtSite, Inc., to deliver a range of services aimed at improving the energy performance of the subject buildings: AtSite assessed each building, delivered a plan for improvement, monitored the energy use in each building over the 12-month study period, delivered actionable recommendations on a regular basis, worked with the building engineers to implement the recommendations and best practices, and held regular meetings with Tower engineers and owners to address opportunities and review progress.
A key element of AtSite’s service is detecting and correcting operational stray, as illustrated by this example: AtSite reviewed the electricity usage in 1909 K Street and noticed an unusual pattern on July 7, 2012. The analysis suggested that both of the building’s chillers were cycling on for a few minutes at a time, then shutting off. AtSite alerted the building engineer, and working together the team found and corrected faulty variable-air-volume (VAV) controls that were signaling the chiller to turn on even though the building management system (BMS) called for the chiller to remain off. While this problem might have been discovered eventually without AtSite’s service, it could have continued undetected for months. This delay would have resulted in wasted energy, wear and tear on the building equipment, and possible disruption to tenants when equipment failed.
AtSite’s recommendations also included best practices, such as regularly auditing controls to confirm temperature deadband is set at four degrees. This means the heating, ventilation, and air-conditioning (HVAC) would cool the building to, say, 72 degrees, then remain off until the temperature rose to 76 degrees. A larger deadband allows the HVAC system to remain off while the building is in the “comfort zone,” resulting in energy savings and reduced wear and tear on equipment.
The second element of Tower’s initiative was engaging HVAC Concepts, Inc. (HVACC), to provide a detailed
alarm service for building systems. HVACC established procedures to remotely monitor certain systems settings, such as chilled water temperature, and to send messages to the building engineer if system conditions were outside defined parameters. HVACC would follow up by phone or text messages with the engineer to assure that red flags were addressed. While certain aspects of the monitoring service were automated, HVACC personnel had an escalation routine to engage Tower supervisors in specific instances.
HVACC also enabled Tower to quickly implement adjustments to BMS control routines or settings as needed to implement AtSite’s recommendations.
It is important to emphasize the services provided by the companies involved in this project (or comparable services) are offered today by many firms in the market to building owners and tenants.1 Property owners or management firms may also perform this type of energy management function without the use of outside firms. This report is focused on assessing the type of service provided, not the service of the individual firms involved in this case study.
Tower’s initiative focused on operational settings for building systems and identifying and correcting faults. We refer to this as real-time energy management.2 In every case, Tower was free to accept or decline AtSite’s and HVACC’s recommendations.
KeY fINDINGs of thIs cAse stuDYsavings Provided high return on InvestmentWe found that during the 12-month study period, the initiative led to electricity savings of 23 percent in 1707 L Street, 7 percent in 1828 L Street, and 17 percent in 1909 K Street. Electricity use was reduced by 13 percent across all three buildings during the study period. The reduction in electricity expenses averaged $72,901 per building ($218,703 across all three buildings) in the 2012 study period alone (see table 1).
square feet2012
occupancy 2011 kWh 2012 kWh kWh savings $ savingsPercent of
kWh savings
1707 l street 109,926 302 1,965,135 1,516,274 448,861 $58,352 23%
1828 l street 332,928 928 5,590,937 5,227,183 363,754 $47,288 7%
1909 K street 239,128 462 5,197,305 4,327,589 869,716 $113,063 17%
total for three buildings combined 12,753,377 11,071,046 1,682,331 $218,703 13.2%Average
energy savings were determined using a whole building, year-over-year method. results were normalized for weather and occupancy. the 12-month study period was January 2012 through december 2012, and the 12-month baseline period was January 2011 through december 2011. the total percentage of energy savings is determined by total normalized usage in all three buildings in 2012 as compared with total usage in 2011.
table 1. summary of energy savings
PAGe 6 | reAl-tIMe eNerGY MANAGeMeNt IN three lArGe coMMercIAl offIce buIlDINGs
Actual energy savings will likely be greater than the observed savings because many measures implemented in the 2012 study period will deliver savings in 2013 and beyond.
Project expenses consisted of metering, hardware, and set-up expenses of about $21,233 per building ($63,700 for three buildings), plus annual energy management and monitoring expenses of $15,900 for AtSite and $4,740 for HVACC per building. Annual recurring costs, excluding set-up, were $21,840 per buildings ($65,520 for all three buildings) which includes estimated costs for Tower personnel time of about $3,600 per building. Total project expenses averaged $48,107 per building ($144,320 for all three buildings). (See Table 2 on page 17 for detail.) This case study examined only electricity use and did not assess savings from reduced fuel oil or natural gas usage.
We note that Tower’s project expenses appear to be lower than typical expenses for other similarly sized buildings for two reasons. First, Tower negotiated rates based on a portfolio of 11 buildings (the three commercial office buildings in this case study plus a group of multifamily buildings). Second, Tower’s buildings were configured in a manner that reduced installation expenses of metering devices as compared with typical buildings, which often require more submeters and longer runs of wiring.3
Even with all metering and set-up costs fully expensed during the study period, and only counting electricity savings realized during the 12-month study period, the project returned over $74,000 on total project costs of $144,320.
Value to the owner and tenantsUnder the terms of Tower’s typical leases, electricity expenses are generally passed through to tenants. Therefore, reducing electricity expenses will, for the most part, lower the expenses allocated to and borne by tenants. Tower expects to realize substantial value from reducing energy expenses in the following ways:
1. If tenants pay the same effective total rent to Tower (nominal rent plus utility expenses and allocations) as compared with competing buildings, Tower will retain greater actual rents by reducing the portion paid out to utilities.
2. Improved energy performance can lead to increased occupancy and rents because of the premium attributed to high-performance buildings.4 Many tenants and their employees attribute material value to buildings with greater efficiency levels. Certain tenants with sustainability commitments may consider only buildings with high-efficiency ratings. For example, the U.S. General Services Administration, the largest tenant in the country, requires new leased space to be Energy Star rated.5
3. Improved energy performance is expected to reduce maintenance expenses and increase the life of major building systems. This initiative enabled Tower to quickly find and correct faults, such as chillers that were running outside of parameters, which reduced wear and tear on the machinery, lowered the risk of major disruptions to the building, and increased the effectiveness of building professionals—all of which have value to the building owner.
4. If the benefits of energy reductions accrue to tenants, there is a strong basis for an owner to count the cost of the energy management project as a building expense allocated to tenants.
A service backed by technologyWhile better information (such as charts or an online dashboard) and automated alerts delivered to the building engineers and managers could provide value, we found that the consultative and advisory services were essential to the success of this energy management initiative.
AtSite delivered consultative services based on its expertise in energy management. Also, AtSite built a trusted relationship that enabled the building engineers to respond to recommendations effectively and helped the combined team to troubleshoot problems. Similarly, HVACC’s monitoring services gave the building engineers additional tools and gave Tower supervisors additional confidence that exceptions would be identified.
Building engineers have many day-to-day responsibilities—managing complex building systems and settings, keeping the building comfortable and productive for occupants, and responding to service requests. Our observations strongly suggest that Tower implemented recommendations in part because they were validated and prioritized through discussions with trusted energy management experts.
Our conclusion on this point is reinforced by the fact that Tower was provided with access to an AtSite online portal, which included many of the same charts and diagnostic information and self-service tools. We saw little evidence that the building engineers used it. Yet we observed regular interaction between the Tower building engineers and the AtSite team, which proved productive.
David Borchardt, chief of sustainability at Tower, concurred that building professionals are more likely to respond to recommendations, alarms, and e-mail when they know a person is involved on the other end and that the subject could be raised at a monthly in-person meeting.
By engaging HVACC to assist with making changes to building system settings, Tower was able to implement suggested changes quickly.
PAGe 7 | reAl-tIMe eNerGY MANAGeMeNt IN three lArGe coMMercIAl offIce buIlDINGs
excellent buildings from the startThe three buildings in this case study were high-performing buildings before the energy management initiative began—the buildings had high Energy Star scores and were good facilities. 1707 L Street had a score of 71; 1828 L Street had a score of 78; and 1909 K Street had a score of 86 in September 2011.6 Yet, at the end of the study period, all three buildings’ scores had improved substantially to 91, 87, and 88. The fact that these already-high-performing buildings realized substantial savings during the 12-month study period suggests that even more substantial gains are available in typical buildings.
Management and leadershipTower management displayed leadership in the course of this initiative, which was important to success. This suggests why the buildings had high Energy Star scores to start with, and was key to enabling their teams to respond to the recommended improvements. David Borchardt; Eugenia Gregorio, the sustainability manager; Jim Lewis, the director of engineering; and Debbie Webb, the director of property management held regular monthly meetings with Tower engineers and with AtSite and HVACC to review recommendations, track progress, and identify challenges. They communicated to building engineers that improving energy efficiency was an important company goal. Tower owners, through a quarterly meeting, reinforced this message to the entire team. Our observations suggest that this level of leadership is an important ingredient to success.
broader lessons learnedIn addition to providing building owners and tenants a substantial savings in the form of reduced energy expenses, reducing wasted energy use is a vital national goal. NRDC undertook this case study to identify what level of energy savings would result from an energy management initiative focused on operational improvements. Office buildings, such as those in this case study, are responsible for a major portion of the energy used in the United States and a major portion of the pollution resulting from power plants.
This case study strongly suggests that large amounts of electricity are used in commercial office buildings to do no useful work. The electricity is simply wasted, every day and night, to power systems that do not improve the operation of the buildings or supply tenants’ needs. With better energy management, building owners can identify where energy is wasted and prevent that waste from happening in the first place. This is true even in the best buildings, because building systems routinely stray from optimal.
Many utility programs and initiatives at the city, state, and federal levels are focused on encouraging building owners to invest in building improvements (or “retrofits”). This case study shows that emphasis on operational improvements is also warranted.
Tower’s initiative and the services of AtSite and HVACC show how better information and advice enable building teams to minimize operational stray and to correct it quickly when it occurs. This study shows the kind of savings available in the first year alone—13 percent across three buildings—provides a roadmap for a model initiative, and holds valuable lessons for building owners, tenants, and policy makers interested in encouraging investment in energy efficiency.
PAGe 8 | reAl-tIMe eNerGY MANAGeMeNt IN three lArGe coMMercIAl offIce buIlDINGs
NRDC initiated this project in 2011 by approaching Jeffrey Abramson,
a principal of Tower Companies, and David Borchardt, Tower’s chief
sustainability officer, about implementing an energy management initiative
in one or more buildings that Tower owns and operates. We learned that Borchardt had
already envisioned a project with a combination of systems and services that would
give his team of building professionals the information they needed to better manage
energy use in three downtown office buildings.7 Tower Companies generously agreed
to allow NRDC to conduct this case study by observing the project and tracking the
results.
NRDC followed the implementation and operation of this project for 12 months. The question we sought to address was: What level of energy savings and what return on investment would a building owner realize from an energy management initiative in a multi-tenant commercial office building?
Tower's energy management initiative was led by David Borchardt, with substantial support from Eugenia Gregorio, Jim Lewis, and the Tower buildings team, as identified in appendix A.
The centerpiece of Tower’s initiative was engaging AtSite, Inc., of Washington, D.C., to provide energy management services. AtSite would monitor energy use in the buildings to detect operational stray and deliver actionable recommendations to the building engineers to correct faults and implement best practices.
The second element of Tower’s initiative was implementing highly detailed alarms tied to building systems and a monitoring service provided by HVAC Concepts, Inc. (HVACC), a local energy services firm. HVACC would send e-mail or phone messages to the building engineers when system conditions were outside defined parameters, such as the temperature of chilled water rising above or dropping below set points. HVACC would follow up by phone or text messages with the engineers—or a supervisor, in certain instances—to ensure that red flags were addressed.
Tower’s building professionals met monthly with AtSite and HVACC to review recommendations, track progress, and identify challenges.
set-uP AND hArDWAre Tower first arranged for new electricity meters to be installed by the local utility—Potomac Electric Power Company (PEPCO)—to provide more detailed interval data. Tower also engaged HVACC to install additional metering devices at each building’s main utility meter that would measure and transmit electricity usage data to both AtSite and HVACC.8 Electrical submeters were installed on each building’s chillers. We note that Tower also installed meters on natural gas service, but in this case study we examine only the electricity usage and savings. Tower also engaged HVACC to install devices to enable greater access to and control of certain BMS functions.
AtsIte’s eNerGY MANAGeMeNt serVIcesTower engaged AtSite in September 2011. AtSite began the process it deems as “light up,” in which it installed additional devices to collect meter and submeter data, monitored data from those devices, and used its evaluation tools to build profiles for each building.9 AtSite created a Web interface for Tower so its personnel could access displays of usage information and other metrics.
building Assessment AtSite performed a detailed, in-person assessment of each of the three buildings in December 2011. It examined all building systems, including HVAC components, mechanical systems, lighting and lighting controls, sample tenant spaces, garages, and other building facilities. AtSite devoted a substantial amount of time to becoming familiar with the BMS in each building and how
II. Project DescrIPtIoN
PAGe 9 | reAl-tIMe eNerGY MANAGeMeNt IN three lArGe coMMercIAl offIce buIlDINGs
the engineer typically used the system. AtSite performed a review of the system, checking certain important settings and verifying that certain commands corresponded with the actual operating status of the equipment. The company also discussed the systems and schedules with each building engineer.
Planning AtSite prepared a “Performance Improvement Roadmap” for Tower with estimated savings in each building. AtSite and Tower agreed to a target of 7 percent reduction in energy use across the three buildings. The parties did not establish payments contingent upon hitting the 7 percent target or any other energy use reductions or performance.
Kickoff AtSite convened an initial meeting with Tower management and the building engineers in January 2012. AtSite provided a preliminary analysis based on 2011 data and the initial walk-through and provided its initial set of recommended energy conservation measures (ECMs) for each building. AtSite introduced several key metrics used to analyze building operations, such as close-down ratio, average load curves, and energy-use intensity as measured at different points of time.
Daily reports and contact AtSite delivered daily reports by e-mail to each building engineer and the Tower buildings team. The building engineers could quickly view the previous day’s energy usage pattern, identify anomalies, and prepare the building for the current day. In addition, AtSite’s performance analysts reviewed each building’s report every day and contacted the building engineers and Tower’s management when anomalies were detected.
Monthly Meetings During the 12-month study period, AtSite met monthly with the building engineers and the Tower buildings management team to review findings and recommendations. These meetings typically lasted one hour. During each meeting, AtSite provided an overview of the previous month’s electricity use for each building, explained any issues found, and offered recommendations.10 Also, the group would review and discuss the “change logs” of all energy conservation measures that had been accomplished since the previous meeting and set goals for the next month.
Analytics, charts, and Metrics AtSite provided charts, graphs, and metrics to reflect building performance and to identify opportunities, including charts of electricity use for the whole building and for just the chillers over a full day; metrics related to speed of building start-up in the morning and shutdown in the evening; energy use intensity (energy use per square foot); and night variance, which shows the high and low electricity use (in watts) during the building’s unoccupied period. Some of these materials were delivered to the building engineer daily by e-mail, other materials were available through an online tool, and selected materials were reviewed in the monthly meeting.
Atsite recommendations At the first meeting in January 2012, AtSite provided recommendations for improvement that covered a wide range of operational settings in each building and included a combination of fault detection and best practices for Tower to consider. AtSite also detected many system faults during the study period and made recommendations for correction of these faults. Examples of both fault detection and best practice recommendations for each building are detailed on the following pages.
PAGe 10 | reAl-tIMe eNerGY MANAGeMeNt IN three lArGe coMMercIAl offIce buIlDINGs
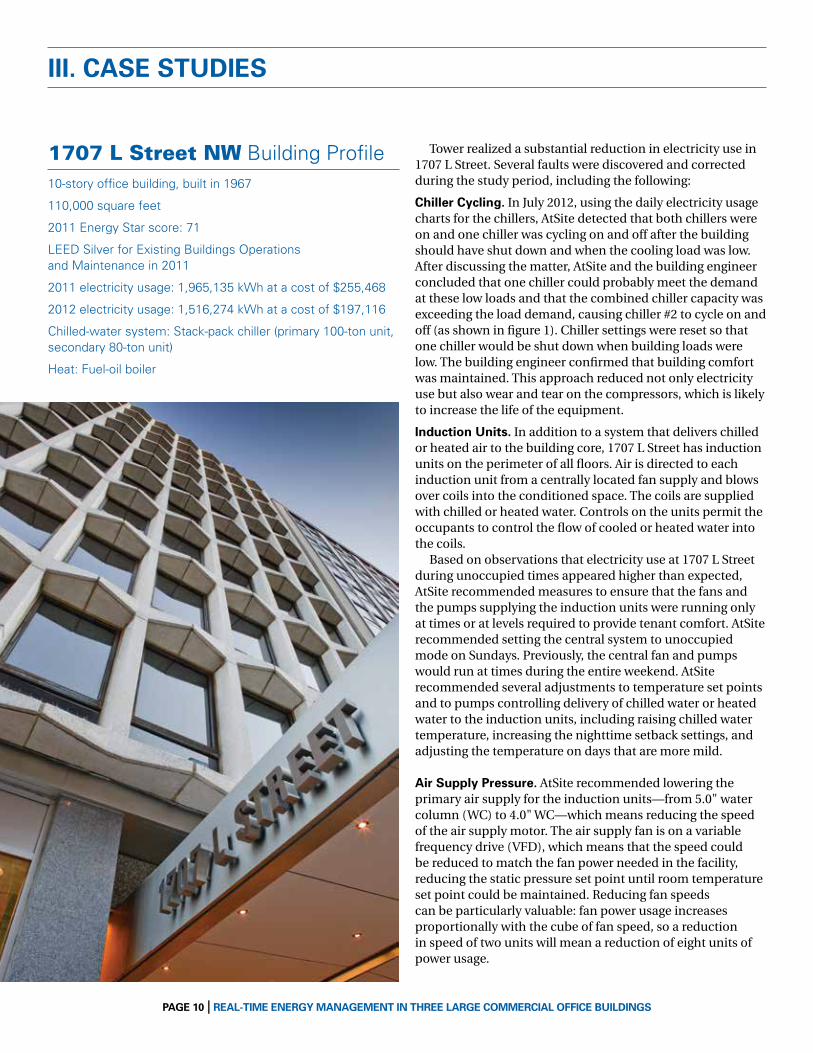
1707 l Street nW Building Profile 10-story office building, built in 1967
110,000 square feet
2011 energy star score: 71
Leed silver for existing Buildings operations and maintenance in 2011
2011 electricity usage: 1,965,135 kWh at a cost of $255,468
2012 electricity usage: 1,516,274 kWh at a cost of $197,116
Chilled-water system: stack-pack chiller (primary 100-ton unit, secondary 80-ton unit)
heat: fuel-oil boiler
Tower realized a substantial reduction in electricity use in 1707 L Street. Several faults were discovered and corrected during the study period, including the following:
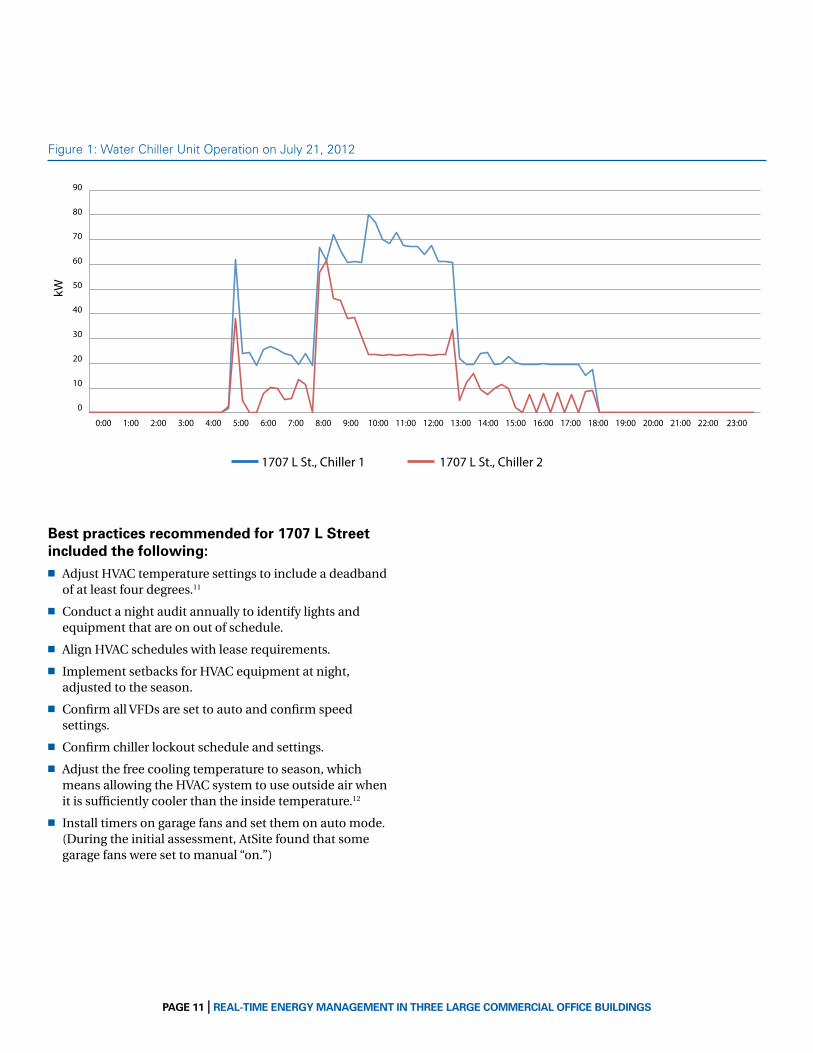
chiller cycling. In July 2012, using the daily electricity usage charts for the chillers, AtSite detected that both chillers were on and one chiller was cycling on and off after the building should have shut down and when the cooling load was low. After discussing the matter, AtSite and the building engineer concluded that one chiller could probably meet the demand at these low loads and that the combined chiller capacity was exceeding the load demand, causing chiller #2 to cycle on and off (as shown in figure 1). Chiller settings were reset so that one chiller would be shut down when building loads were low. The building engineer confirmed that building comfort was maintained. This approach reduced not only electricity use but also wear and tear on the compressors, which is likely to increase the life of the equipment.
Induction units. In addition to a system that delivers chilled or heated air to the building core, 1707 L Street has induction units on the perimeter of all floors. Air is directed to each induction unit from a centrally located fan supply and blows over coils into the conditioned space. The coils are supplied with chilled or heated water. Controls on the units permit the occupants to control the flow of cooled or heated water into the coils.
Based on observations that electricity use at 1707 L Street during unoccupied times appeared higher than expected, AtSite recommended measures to ensure that the fans and the pumps supplying the induction units were running only at times or at levels required to provide tenant comfort. AtSite recommended setting the central system to unoccupied mode on Sundays. Previously, the central fan and pumps would run at times during the entire weekend. AtSite recommended several adjustments to temperature set points and to pumps controlling delivery of chilled water or heated water to the induction units, including raising chilled water temperature, increasing the nighttime setback settings, and adjusting the temperature on days that are more mild.
Air supply Pressure. AtSite recommended lowering the primary air supply for the induction units—from 5.0" water column (WC) to 4.0" WC—which means reducing the speed of the air supply motor. The air supply fan is on a variable frequency drive (VFD), which means that the speed could be reduced to match the fan power needed in the facility, reducing the static pressure set point until room temperature set point could be maintained. Reducing fan speeds can be particularly valuable: fan power usage increases proportionally with the cube of fan speed, so a reduction in speed of two units will mean a reduction of eight units of power usage.
III. cAse stuDIes
PAGe 11 | reAl-tIMe eNerGY MANAGeMeNt IN three lArGe coMMercIAl offIce buIlDINGs
90
80
70
60
50
40
30
20
10
0
kW
23:0022:0021:0020:0019:0018:0017:0016:0015:0014:0013:0012:0011:0010:009:008:007:006:005:004:003:002:001:000:00
1707 L St., Chiller 1 1707 L St., Chiller 2
best practices recommended for 1707 l street included the following:n Adjust HVAC temperature settings to include a deadband
of at least four degrees.11
n Conduct a night audit annually to identify lights and equipment that are on out of schedule.
n Align HVAC schedules with lease requirements.
n Implement setbacks for HVAC equipment at night, adjusted to the season.
n Confirm all VFDs are set to auto and confirm speed settings.
n Confirm chiller lockout schedule and settings.
n Adjust the free cooling temperature to season, which means allowing the HVAC system to use outside air when it is sufficiently cooler than the inside temperature.12
n Install timers on garage fans and set them on auto mode. (During the initial assessment, AtSite found that some garage fans were set to manual “on.”)
figure 1: Water Chiller unit operation on July 21, 2012
PAGe 12 | reAl-tIMe eNerGY MANAGeMeNt IN three lArGe coMMercIAl offIce buIlDINGs
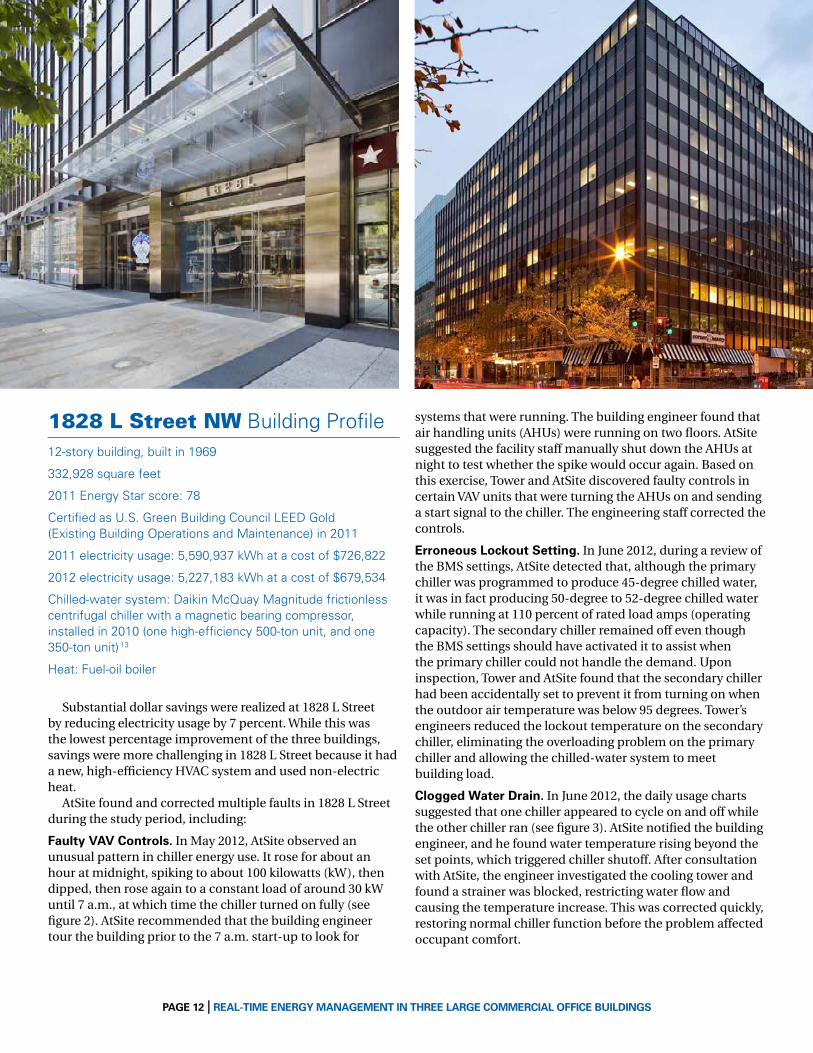
1828 l Street nW Building Profile 12-story building, built in 1969
332,928 square feet
2011 energy star score: 78
Certified as u.s. green Building Council Leed gold (existing Building operations and maintenance) in 2011
2011 electricity usage: 5,590,937 kWh at a cost of $726,822
2012 electricity usage: 5,227,183 kWh at a cost of $679,534
Chilled-water system: daikin mcQuay magnitude frictionless centrifugal chiller with a magnetic bearing compressor, installed in 2010 (one high-efficiency 500-ton unit, and one 350-ton unit) 13
heat: fuel-oil boiler
Substantial dollar savings were realized at 1828 L Street by reducing electricity usage by 7 percent. While this was the lowest percentage improvement of the three buildings, savings were more challenging in 1828 L Street because it had a new, high-efficiency HVAC system and used non-electric heat. AtSite found and corrected multiple faults in 1828 L Street during the study period, including:
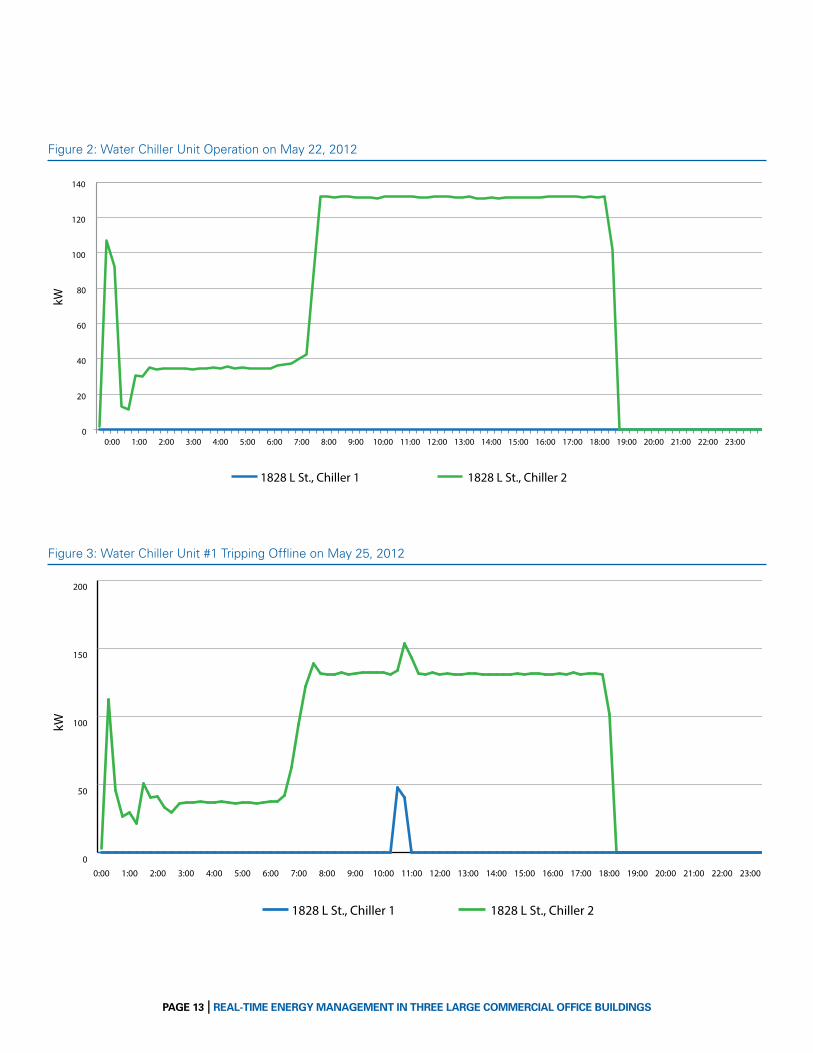
faulty VAV controls. In May 2012, AtSite observed an unusual pattern in chiller energy use. It rose for about an hour at midnight, spiking to about 100 kilowatts (kW), then dipped, then rose again to a constant load of around 30 kW until 7 a.m., at which time the chiller turned on fully (see figure 2). AtSite recommended that the building engineer tour the building prior to the 7 a.m. start-up to look for
systems that were running. The building engineer found that air handling units (AHUs) were running on two floors. AtSite suggested the facility staff manually shut down the AHUs at night to test whether the spike would occur again. Based on this exercise, Tower and AtSite discovered faulty controls in certain VAV units that were turning the AHUs on and sending a start signal to the chiller. The engineering staff corrected the controls.
erroneous lockout setting. In June 2012, during a review of the BMS settings, AtSite detected that, although the primary chiller was programmed to produce 45-degree chilled water, it was in fact producing 50-degree to 52-degree chilled water while running at 110 percent of rated load amps (operating capacity). The secondary chiller remained off even though the BMS settings should have activated it to assist when the primary chiller could not handle the demand. Upon inspection, Tower and AtSite found that the secondary chiller had been accidentally set to prevent it from turning on when the outdoor air temperature was below 95 degrees. Tower’s engineers reduced the lockout temperature on the secondary chiller, eliminating the overloading problem on the primary chiller and allowing the chilled-water system to meet building load.
clogged Water Drain. In June 2012, the daily usage charts suggested that one chiller appeared to cycle on and off while the other chiller ran (see figure 3). AtSite notified the building engineer, and he found water temperature rising beyond the set points, which triggered chiller shutoff. After consultation with AtSite, the engineer investigated the cooling tower and found a strainer was blocked, restricting water flow and causing the temperature increase. This was corrected quickly, restoring normal chiller function before the problem affected occupant comfort.
PAGe 13 | reAl-tIMe eNerGY MANAGeMeNt IN three lArGe coMMercIAl offIce buIlDINGs
!"
#!"
$!"
%!"
&!"
'!!"
'#!"
'$!"
'%!"
'&!"
'#(!!")*
"
'#(+!")*"
'(!!")
*"
'(+!")
*"
#(!!")*
"
#(+!")*"
+(!!")*
"
+(+!")*"
$(!!")*
"
$(+!")*"
,(!!")
*"
,(+!")
*"
%(!!")*
"
%(+!")*"
-(!!")
*"
-(+!")
*"
&(!!")*
"
&(+!")*"
.(!!")
*"
.(+!")
*"
'!(!!"
)*"
'!(+!")
*"
''(!!")
*"
''(+!")
*"
'#(!!"/*
"
'#(+!"/*"
'(!!"/
*"
'(+!"/
*"
#(!!"/*
"
#(+!"/*"
+(!!"/*
"
+(+!"/*"
$(!!"/*
"
$(+!"/*"
,(!!"/
*"
,(+!"/
*"
%(!!"/*
"
%(+!"/*"
-(!!"/
*"
-(+!"/
*"
&(!!"/*
"
&(+!"/*"
.(!!"/
*"
.(+!"/
*"
'!(!!"
/*"
'!(+!"/
*"
''(!!"/
*"
''(+!"/
*"
!"#$%&'$%()%$
'&#&"0"1233456'&#&0"6"789:"6"5;<889=3!'">?@A" '&#&"0"1233456'&#&0"6"789:"6"5;<889=3!#">?@A"
*+$
*+$
0
50
100
150
200
23:0022:0021:0020:0019:0018:0017:0016:0015:0014:0013:0012:0011:0010:009:008:007:006:005:004:003:002:001:000:00
kW
1828 L St., Chiller 1 1828 L St., Chiller 2
0
50
100
150
200
23:0022:0021:0020:0019:0018:0017:0016:0015:0014:0013:0012:0011:0010:009:008:007:006:005:004:003:002:001:000:00
kW
1828 L St., Chiller 1 1828 L St., Chiller 2
kW
1828 L St., Chiller 1 1828 L St., Chiller 2
23:0022:0021:0020:0019:0018:0017:0016:0015:0014:0013:0012:0011:0010:009:008:007:006:005:004:003:002:001:000:000
20
40
60
80
100
120
140
figure 2: Water Chiller unit operation on may 22, 2012
figure 3: Water Chiller unit #1 tripping offline on may 25, 2012
PAGe 14 | reAl-tIMe eNerGY MANAGeMeNt IN three lArGe coMMercIAl offIce buIlDINGs
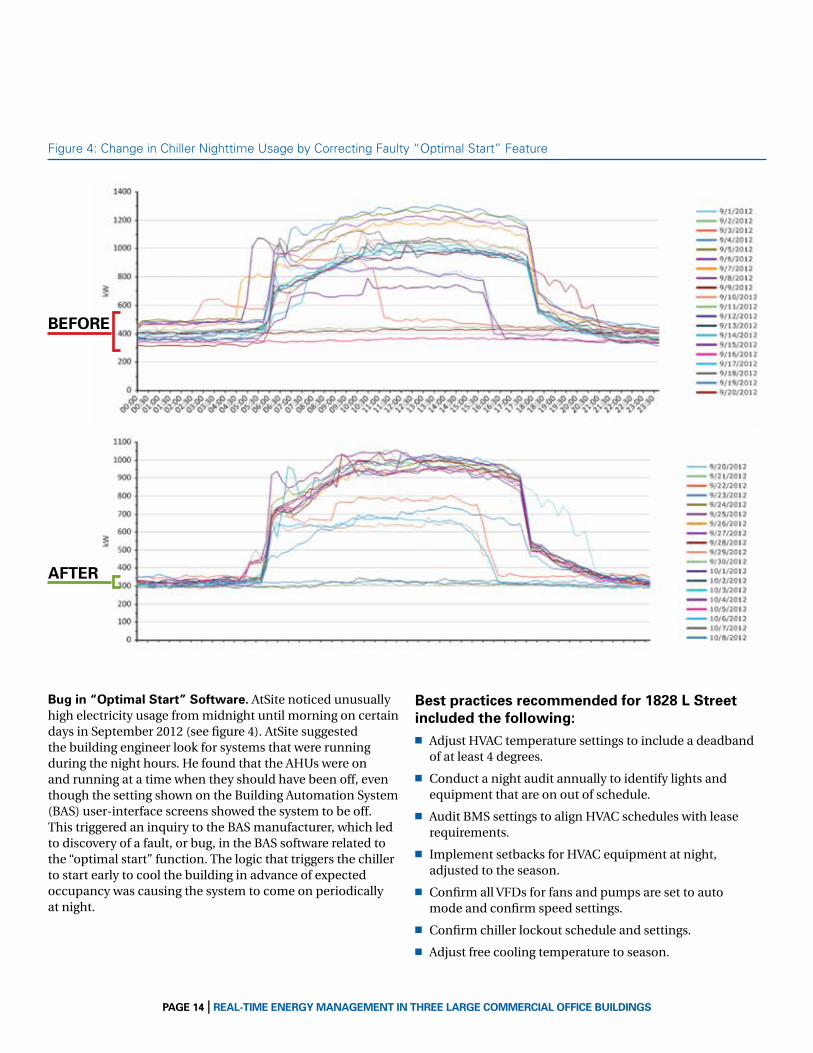
figure 4: Change in Chiller nighttime usage by Correcting faulty “optimal start” feature
bug in “optimal start” software. AtSite noticed unusually high electricity usage from midnight until morning on certain days in September 2012 (see figure 4). AtSite suggested the building engineer look for systems that were running during the night hours. He found that the AHUs were on and running at a time when they should have been off, even though the setting shown on the Building Automation System (BAS) user-interface screens showed the system to be off. This triggered an inquiry to the BAS manufacturer, which led to discovery of a fault, or bug, in the BAS software related to the “optimal start” function. The logic that triggers the chiller to start early to cool the building in advance of expected occupancy was causing the system to come on periodically at night.
best practices recommended for 1828 l street included the following: n Adjust HVAC temperature settings to include a deadband
of at least 4 degrees.
n Conduct a night audit annually to identify lights and equipment that are on out of schedule.
n Audit BMS settings to align HVAC schedules with lease requirements.
n Implement setbacks for HVAC equipment at night, adjusted to the season.
n Confirm all VFDs for fans and pumps are set to auto mode and confirm speed settings.
n Confirm chiller lockout schedule and settings.
n Adjust free cooling temperature to season.
before
After
PAGe 15 | reAl-tIMe eNerGY MANAGeMeNt IN three lArGe coMMercIAl offIce buIlDINGs
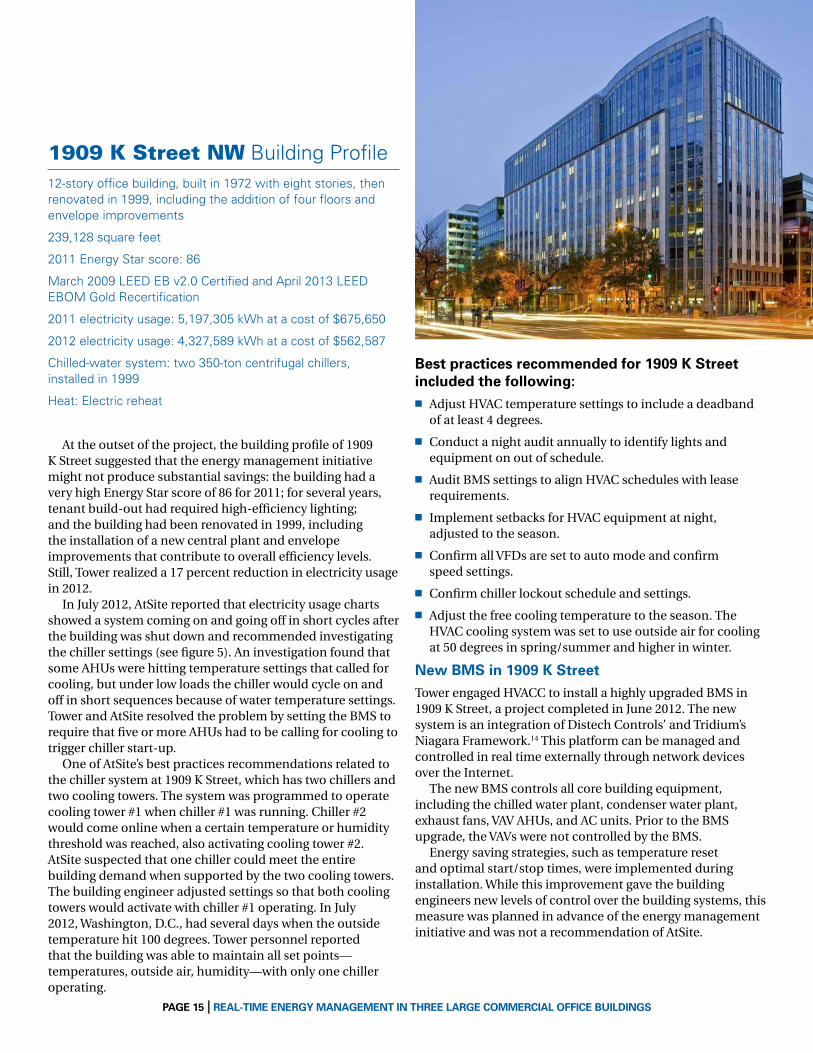
1909 K Street nW Building Profile12-story office building, built in 1972 with eight stories, then renovated in 1999, including the addition of four floors and envelope improvements
239,128 square feet
2011 energy star score: 86
march 2009 Leed eB v2.0 Certified and April 2013 Leed eBom gold recertification
2011 electricity usage: 5,197,305 kWh at a cost of $675,650
2012 electricity usage: 4,327,589 kWh at a cost of $562,587
Chilled-water system: two 350-ton centrifugal chillers, installed in 1999
heat: electric reheat
At the outset of the project, the building profile of 1909 K Street suggested that the energy management initiative might not produce substantial savings: the building had a very high Energy Star score of 86 for 2011; for several years, tenant build-out had required high-efficiency lighting; and the building had been renovated in 1999, including the installation of a new central plant and envelope improvements that contribute to overall efficiency levels. Still, Tower realized a 17 percent reduction in electricity usage in 2012.
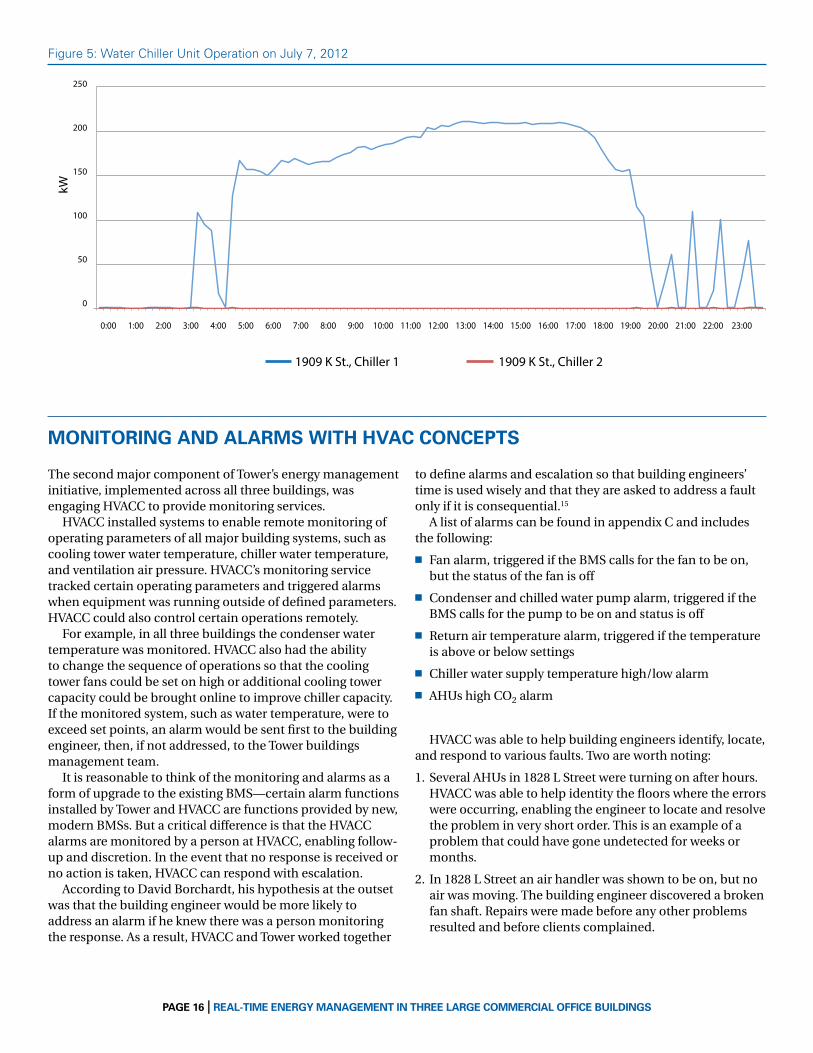
In July 2012, AtSite reported that electricity usage charts showed a system coming on and going off in short cycles after the building was shut down and recommended investigating the chiller settings (see figure 5). An investigation found that some AHUs were hitting temperature settings that called for cooling, but under low loads the chiller would cycle on and off in short sequences because of water temperature settings. Tower and AtSite resolved the problem by setting the BMS to require that five or more AHUs had to be calling for cooling to trigger chiller start-up.
One of AtSite’s best practices recommendations related to the chiller system at 1909 K Street, which has two chillers and two cooling towers. The system was programmed to operate cooling tower #1 when chiller #1 was running. Chiller #2 would come online when a certain temperature or humidity threshold was reached, also activating cooling tower #2. AtSite suspected that one chiller could meet the entire building demand when supported by the two cooling towers. The building engineer adjusted settings so that both cooling towers would activate with chiller #1 operating. In July 2012, Washington, D.C., had several days when the outside temperature hit 100 degrees. Tower personnel reported that the building was able to maintain all set points—temperatures, outside air, humidity—with only one chiller operating.
best practices recommended for 1909 K street included the following:n Adjust HVAC temperature settings to include a deadband
of at least 4 degrees.
n Conduct a night audit annually to identify lights and equipment on out of schedule.
n Audit BMS settings to align HVAC schedules with lease requirements.
n Implement setbacks for HVAC equipment at night, adjusted to the season.
n Confirm all VFDs are set to auto mode and confirm speed settings.
n Confirm chiller lockout schedule and settings.
n Adjust the free cooling temperature to the season. The HVAC cooling system was set to use outside air for cooling at 50 degrees in spring/summer and higher in winter.
New bMs in 1909 K streetTower engaged HVACC to install a highly upgraded BMS in 1909 K Street, a project completed in June 2012. The new system is an integration of Distech Controls’ and Tridium’s Niagara Framework.14 This platform can be managed and controlled in real time externally through network devices over the Internet.
The new BMS controls all core building equipment, including the chilled water plant, condenser water plant, exhaust fans, VAV AHUs, and AC units. Prior to the BMS upgrade, the VAVs were not controlled by the BMS.
Energy saving strategies, such as temperature reset and optimal start/stop times, were implemented during installation. While this improvement gave the building engineers new levels of control over the building systems, this measure was planned in advance of the energy management initiative and was not a recommendation of AtSite.
PAGe 16 | reAl-tIMe eNerGY MANAGeMeNt IN three lArGe coMMercIAl offIce buIlDINGs
The second major component of Tower’s energy management initiative, implemented across all three buildings, was engaging HVACC to provide monitoring services.
HVACC installed systems to enable remote monitoring of operating parameters of all major building systems, such as cooling tower water temperature, chiller water temperature, and ventilation air pressure. HVACC’s monitoring service tracked certain operating parameters and triggered alarms when equipment was running outside of defined parameters. HVACC could also control certain operations remotely.
For example, in all three buildings the condenser water temperature was monitored. HVACC also had the ability to change the sequence of operations so that the cooling tower fans could be set on high or additional cooling tower capacity could be brought online to improve chiller capacity. If the monitored system, such as water temperature, were to exceed set points, an alarm would be sent first to the building engineer, then, if not addressed, to the Tower buildings management team.
It is reasonable to think of the monitoring and alarms as a form of upgrade to the existing BMS—certain alarm functions installed by Tower and HVACC are functions provided by new, modern BMSs. But a critical difference is that the HVACC alarms are monitored by a person at HVACC, enabling follow-up and discretion. In the event that no response is received or no action is taken, HVACC can respond with escalation.
According to David Borchardt, his hypothesis at the outset was that the building engineer would be more likely to address an alarm if he knew there was a person monitoring the response. As a result, HVACC and Tower worked together
to define alarms and escalation so that building engineers’ time is used wisely and that they are asked to address a fault only if it is consequential.15 A list of alarms can be found in appendix C and includes the following:
n Fan alarm, triggered if the BMS calls for the fan to be on, but the status of the fan is off
n Condenser and chilled water pump alarm, triggered if the BMS calls for the pump to be on and status is off
n Return air temperature alarm, triggered if the temperature is above or below settings
n Chiller water supply temperature high/low alarm
n AHUs high CO2 alarm
HVACC was able to help building engineers identify, locate, and respond to various faults. Two are worth noting:
1. Several AHUs in 1828 L Street were turning on after hours. HVACC was able to help identity the floors where the errors were occurring, enabling the engineer to locate and resolve the problem in very short order. This is an example of a problem that could have gone undetected for weeks or months.
2. In 1828 L Street an air handler was shown to be on, but no air was moving. The building engineer discovered a broken fan shaft. Repairs were made before any other problems resulted and before clients complained.
figure 5: Water Chiller unit operation on July 7, 2012
250
200
150
100
50
0
kW
23:0022:0021:0020:0019:0018:0017:0016:0015:0014:0013:0012:0011:0010:009:008:007:006:005:004:003:002:001:000:00
1909 K St., Chiller 1 1909 K St., Chiller 2
MoNItorING AND AlArMs WIth hVAc coNcePts
PAGe 17 | reAl-tIMe eNerGY MANAGeMeNt IN three lArGe coMMercIAl offIce buIlDINGs
1. submetering and Network Tower’s implementation expenses included installation
of metering and network devices in each of the three buildings to enable collection of electricity usage information (on the whole building and the buildings’ chillers); devices to allow HVACC to reset certain BMS control settings remotely; and fees charged by PEPCO to install interval meters. We note that Tower’s implementation expenses appear lower than many other similarly sized buildings because of the ease of installation of metering devices and the need for fewer submetering points. We understand Tower buildings allowed for shorter runs of wiring for meter devices and easy configuration of hardware. Anecdotal reports suggest similarly sized buildings could have implementation expenses ranging from $25,000 to $40,000.
AtSite’s implementation expenses also included an assessment of each building, development of a profile of the buildings to enable ongoing analysis, and configuration of Tower access to Web-based tools to see information from meters and charts.
2. Atsite set-up AtSite’s monitoring includes daily monitoring and
analysis, delivery of recommendations, and monthly meetings with building engineers and quarterly meetings with Tower senior management.
3. Atsite (Annual costs) With regard to Tower’s expenses for both implementation
and monitoring, it is important to note that Tower engaged AtSite and HVACC to provide services to a portfolio of more than 10 buildings—the three commercial office buildings in this case study and a group of other buildings, including several multifamily buildings. The costs per building for the several services were lower because of the negotiated rate for a portfolio engagement.
4. hVAcc (Annual costs) HVACC monitoring includes monitoring and alarm
sequences for key system functions.
5. tower Personnel time To approximate the added level of effort required to
achieve these results, we used time reports from two senior Tower professionals, David Borchardt and Eugenia Gregorio, who together devoted about two hours per building per month, including implementation and monthly meetings. We added three hours per month for each building engineer, including the monthly meeting.
IV. exPeNses
table 2. Cost of implementation
one-time Implementation expenses
total for 3 buildings
Average per building
1. submetering and network $33,700 $11,233
2. Atsite set-up $30,000 $10,000
ongoing Monitoring service
total for 3 buildings
Average per building
3. Atsite annual costs $47,700 $15,900
4. hVACC annual costs $14,220 $4,740
5. tower Personnel time ~ Value ~hours
Building engineers $3,600 36
management and Administration $7,200 72
6. Bms upgrade in 1909 K street (One-Time Cost)
$7,900
total for 3 buildings
Average per buildinga
total Project costs (Year 1) $144,320 $48,107
Annual recurring cost (Year 2) $65,520b $21,840
Year 1 electricity savings $218,703 $72,901
a Average per building costs are derived by taking one-third of total expenses.b for year 1 costs, we included values for engineer and management time, and
for annual recurring costs, we included only engineer time.
6. bMs upgrade in 1909 K street Tower invested $79,000 to implement a new BMS system
at 1909 K Street. This capital expense was not part of the energy management initiative, though it likely had positive effects on energy management through better controls. We have included a portion of the total expenses in the project costs—one tenth, assuming the savings attributable to the new system will be realized evenly during a 10-year period. This added $7,900 to the implementation costs for 1909 K Street.

PAGe 18 | reAl-tIMe eNerGY MANAGeMeNt IN three lArGe coMMercIAl offIce buIlDINGs
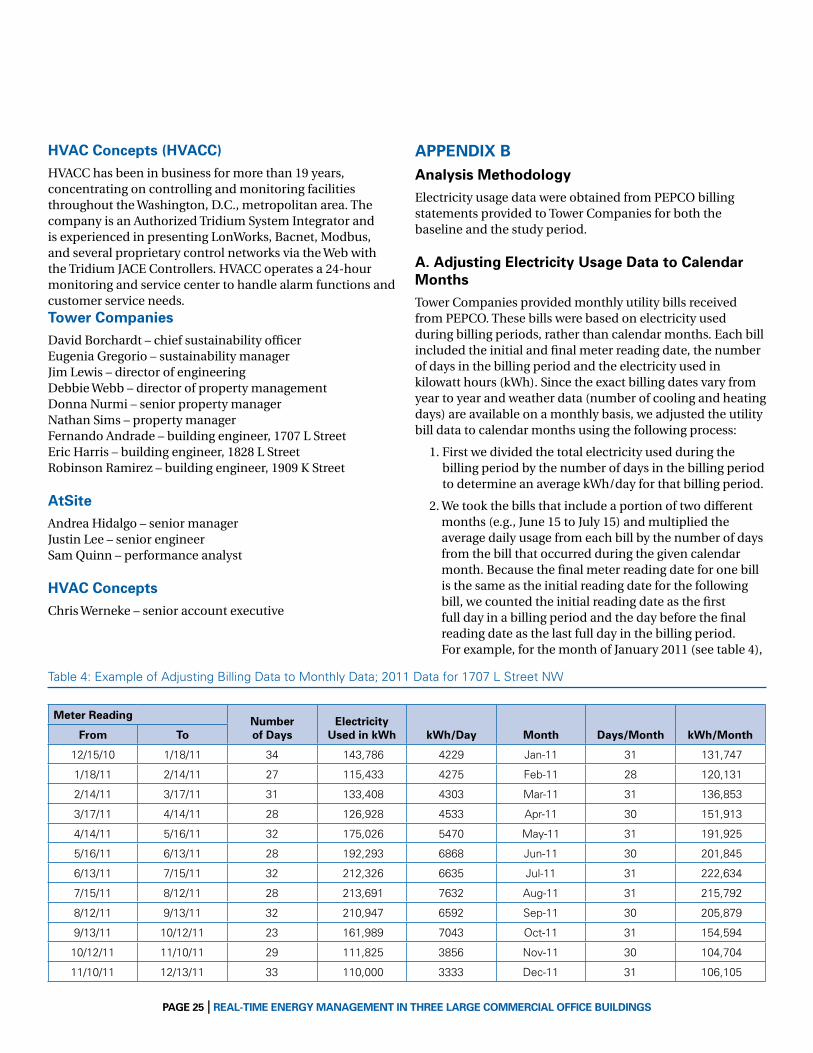
NrDc MethoDoloGYTo estimate the energy savings resulting from the energy management initiative, NRDC established a baseline of whole-building electricity usage during a 12-month period from January 1, 2011, through December 31, 2011. The 12-month study period was January 1, 2012, through December 31, 2012.
Electricity usage data were obtained from PEPCO billing statements provided to Tower Companies for both the baseline and study periods.16 Using regularly applied methods, we adjusted the monthly electricity usage data from billing dates to calendar month dates by averaging the daily electricity use over the billing period for each bill and attributing the usage to the appropriate month.17 We then normalized this adjusted electricity usage data from the baseline period to account for differences in weather and occupancy, in the manner described at appendix B.
We did not attempt to directly identify energy savings for any specific measures implemented. Many measures were implemented in the study period, and the measures have substantial interactive effects.
We did not make any adjustments to the baseline or study period usage data to account for other factors that could have affected energy use, including known events, such as construction during tenant build-out, changes in lighting, or configuration of tenant spaces. We discussed the status of the buildings on a monthly basis with Tower and AtSite to identify events that could potentially require adjustment. All events that occurred appeared to be normal events in the life of a typical building.
We only included electricity usage data in this case study and excluded fuel oil and natural gas usage from our analysis.18 More detail about methodology appears at appendix B.
PAGe 19 | reAl-tIMe eNerGY MANAGeMeNt IN three lArGe coMMercIAl offIce buIlDINGs
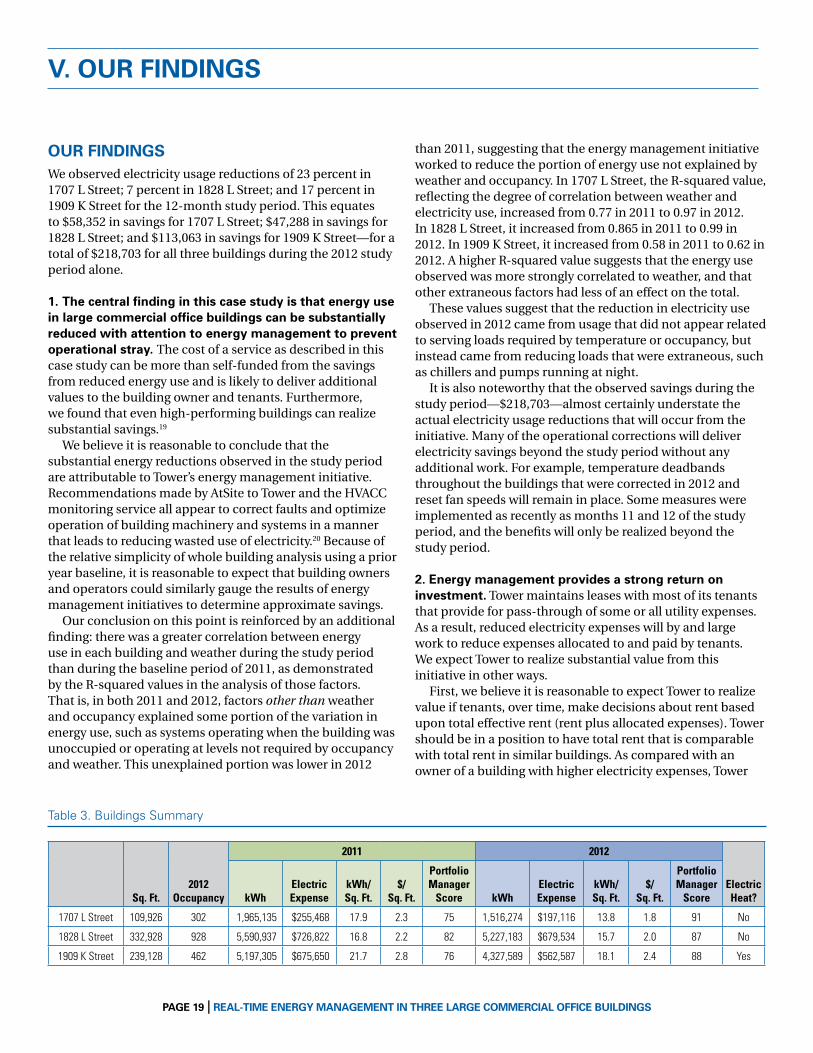
table 3. Buildings summary
Sq. Ft.2012
Occupancy
2011 2012
Electric Heat?kWh
Electric Expense
kWh/Sq. Ft.
$/ Sq. Ft.
PortfolioManager
Score kWhElectric Expense
kWh/Sq. Ft.
$/ Sq. Ft.
PortfolioManager
Score
1707 L Street 109,926 302 1,965,135 $255,468 17.9 2.3 75 1,516,274 $197,116 13.8 1.8 91 No
1828 L Street 332,928 928 5,590,937 $726,822 16.8 2.2 82 5,227,183 $679,534 15.7 2.0 87 No
1909 K Street 239,128 462 5,197,305 $675,650 21.7 2.8 76 4,327,589 $562,587 18.1 2.4 88 Yes
our fINDINGsWe observed electricity usage reductions of 23 percent in 1707 L Street; 7 percent in 1828 L Street; and 17 percent in 1909 K Street for the 12-month study period. This equates to $58,352 in savings for 1707 L Street; $47,288 in savings for 1828 L Street; and $113,063 in savings for 1909 K Street—for a total of $218,703 for all three buildings during the 2012 study period alone.
1. the central finding in this case study is that energy use in large commercial office buildings can be substantially reduced with attention to energy management to prevent operational stray. The cost of a service as described in this case study can be more than self-funded from the savings from reduced energy use and is likely to deliver additional values to the building owner and tenants. Furthermore, we found that even high-performing buildings can realize substantial savings.19
We believe it is reasonable to conclude that the substantial energy reductions observed in the study period are attributable to Tower’s energy management initiative. Recommendations made by AtSite to Tower and the HVACC monitoring service all appear to correct faults and optimize operation of building machinery and systems in a manner that leads to reducing wasted use of electricity.20 Because of the relative simplicity of whole building analysis using a prior year baseline, it is reasonable to expect that building owners and operators could similarly gauge the results of energy management initiatives to determine approximate savings.
Our conclusion on this point is reinforced by an additional finding: there was a greater correlation between energy use in each building and weather during the study period than during the baseline period of 2011, as demonstrated by the R-squared values in the analysis of those factors. That is, in both 2011 and 2012, factors other than weather and occupancy explained some portion of the variation in energy use, such as systems operating when the building was unoccupied or operating at levels not required by occupancy and weather. This unexplained portion was lower in 2012
than 2011, suggesting that the energy management initiative worked to reduce the portion of energy use not explained by weather and occupancy. In 1707 L Street, the R-squared value, reflecting the degree of correlation between weather and electricity use, increased from 0.77 in 2011 to 0.97 in 2012. In 1828 L Street, it increased from 0.865 in 2011 to 0.99 in 2012. In 1909 K Street, it increased from 0.58 in 2011 to 0.62 in 2012. A higher R-squared value suggests that the energy use observed was more strongly correlated to weather, and that other extraneous factors had less of an effect on the total.
These values suggest that the reduction in electricity use observed in 2012 came from usage that did not appear related to serving loads required by temperature or occupancy, but instead came from reducing loads that were extraneous, such as chillers and pumps running at night.
It is also noteworthy that the observed savings during the study period—$218,703—almost certainly understate the actual electricity usage reductions that will occur from the initiative. Many of the operational corrections will deliver electricity savings beyond the study period without any additional work. For example, temperature deadbands throughout the buildings that were corrected in 2012 and reset fan speeds will remain in place. Some measures were implemented as recently as months 11 and 12 of the study period, and the benefits will only be realized beyond the study period.
2. energy management provides a strong return on investment. Tower maintains leases with most of its tenants that provide for pass-through of some or all utility expenses. As a result, reduced electricity expenses will by and large work to reduce expenses allocated to and paid by tenants. We expect Tower to realize substantial value from this initiative in other ways.
First, we believe it is reasonable to expect Tower to realize value if tenants, over time, make decisions about rent based upon total effective rent (rent plus allocated expenses). Tower should be in a position to have total rent that is comparable with total rent in similar buildings. As compared with an owner of a building with higher electricity expenses, Tower
V. our fINDINGs
PAGe 20 | reAl-tIMe eNerGY MANAGeMeNt IN three lArGe coMMercIAl offIce buIlDINGs
would retain a larger portion of the total rent as actual rent, with a lower portion of the total effective rent delivered to the utility.
It is also likely that Tower will realize higher rents and occupancy rates based on the fact that its buildings are recognized as high-performance buildings. Many tenants and their employees attribute material value to being in buildings with greater efficiency levels, represented by high Energy Star scores, LEED ratings, and lower “carbon footprint” metrics. When they are in the market for leasable space, prospective tenants with sustainability commitments may consider only those buildings with high efficiency ratings.
For instance, the U.S. General Services Administration, the largest tenant in the country, is now required under law to lease space only in Energy Star certified buildings, with certain limited exceptions.21 Other firms, such as depository banks with offices in many cities, have made sustainability commitments that relate to selecting and renewing leases.22
Our observations suggest that Tower’s energy management initiative could improve the competitive position of Tower’s buildings for tenants with an interest in sustainability.
We also note that Washington, D.C., has implemented a benchmarking and disclosure regime as of 2012, so that prospective tenants will be able to obtain information on energy performance of all buildings subject to the statute. This will better enable the market to attribute a premium to buildings with better energy performance.23
Tower should also realize value from reduced maintenance expenses. In many instances, detecting faults allowed the building professionals to address them quickly. While the faults would likely have been detected and addressed without the energy management initiative, many weeks or months could have elapsed. For example, according to David Borchardt, a fault allowing a chiller to come on at night, as occurred in 1828 L Street, could persist for weeks or months before being detected.
Finally, we note that in 2011 and 2012 Tower purchased credits to offset its carbon footprint. By reducing the energy use of buildings, Tower can expect to reduce the cost of purchasing offsets.
On the expense side of the ledger, Tower reported that it paid the expense of the energy management initiative directly, without allocating the expense to the cost of building operation. Under certain common lease terms, an owner/operator may be permitted to allocate the expense of an energy management initiative to the building operation so both the cost and the benefit are realized by the building and the tenants. In situations such as this one, where the savings exceed the costs even in the first year, there appears to be a strong basis to support an owner or operator’s decision to treat the energy management expenses as a building expense.
figure 6. Correlation Between electricity use and Cooling degree days in 1707 L street in 2012
figure 7. Correlation Between electricity use and Cooling degree days in 1707 L street in 2011
�gure 6 Correlation Between Electricity Use and Cooling Degree Days in 1707 (2012)
�gure 7 Correlation Between Electricity and Cooling Degree Days in 1707 (2011)AND Figure 8 these are the same charts
�gure 9 Correlation Between Electricity Use and CDD (2011)
kWh/
Mon
th
250,000
700,000
kWh/
Mon
th
600,000
500,000
400,000
300,000
200,000
100,000
0
200,000
150,000
100,000
50,000
00 100 200 300 400 500 600
R² = 0.9693
Cooling Degree Days/Month
0 100 200 300 400 500 600
2011 Electricity v CDD
Cooling Degree Days/Month
2012 Electricity v CDD
y = 283.92x + 463208 R² = 0.86556
kWh/
Mon
th
Cooling Degree Days/Month
250,000
200,000
150,000
100,000
50,000
00 100 200 300 400 500 600
R² = 0.76678
2011 Electricity v CDD
PAGe 21 | reAl-tIMe eNerGY MANAGeMeNt IN three lArGe coMMercIAl offIce buIlDINGs
3. expert service providers, such as Atsite and hVAcc, added substantial value to tower’s initiative. AtSite delivered to Tower recommendations that were actionable, along with information to substantiate the findings, often based on meter information. The building engineers acted on the recommendations without the need to analyze the underlying data or to review charts. Because of the personal interaction, Tower’s buildings professionals and senior management came to trust AtSite’s recommendations and were inclined to implement them.
An alternative approach is for the building owner to obtain tools, such as software services, that provide automated recommendations and charts based on analysis of meter data. The output of these systems may be predefined recommendations delivered to the building manager or building engineer. This approach may be appropriate for certain buildings. It is likely a system could identify, for example, the “signature” of certain events, such as a chiller running during nighttime hours, that were described in this case study.
Our observations suggest, however, that automated charts and findings, without people to engage with the building engineers or to implement the recommended actions, would likely not have been sufficient to drive the observed changes in Tower’s buildings. We attribute substantial benefit to the consultative services and personal interaction among the team members. In this case, technology was used by the consultant to distill actionable recommendations, prioritize them, and make the case to the engineer to take specific corrective action.
Building engineers and operators have many tasks every day and many competing priorities. It is not clear that engineers and operators are positioned to do the additional work of the consultant (that is, information tracking and analysis) and to take the remedial action.
AtSite held regular monthly meetings with the building engineers and Tower’s senior building management. These meetings were held not only to convey recommendations but also to review history, status, and plans of various to-do items. The meetings also doubled as training in energy management for the engineers, giving them new capabilities and awareness. The regular meetings also gave the building owners and management information on the practical nature of the energy management challenges.
Another notable aspect of the service is the walk-through of the buildings. We observed the AtSite professionals gain a large amount of information by talking with the building engineers about each major building system, and the
building engineers were introduced to the AtSite team in a manner that built AtSite’s credibility and contributed to the building engineers’ trusting the recommendations. AtSite offered many observations throughout the visits that were useful to the engineers, such as noting an outside air-intake vent that was not fully closing and pump settings that appeared out of range.
Likewise, HVACC engaged directly with building engineers when alarms were triggered. Personal follow-up occurred, often by e-mail or text message, but with the knowledge that a person was available to telephone or escalate in the event the alarm was not addressed and with the knowledge that logs were kept.
It is worth noting that Tower engineers had access to the same data and charts and metrics through an AtSite website/portal. We understand they used it very rarely, if ever, because they trusted and relied on the AtSite team to identify actionable recommendations in an effective and efficient manner.
In sum, we found that the personal engagement of an energy management expert was effective in a way that technology alone might not be.
4. savings do not require major capital improvements or retrofits. The recommendations made by AtSite and implemented by Tower in this case study were operational improvements—corrections of settings and other controls that required little to no expense to implement. The few exceptions are notable for their very low cost. For example, AtSite recommended installing a time clock on certain exhaust fans and a programmable time control on the domestic water boost pump.
5. the recommended measures result in better buildings for owner and tenants. Even the best buildings stray from specifications and operating parameters because of ordinary, routine events. These events cause disruption for tenants and expense for the owner. The energy management initiative allowed the building operator to correct the faults as quickly as possible and to reduce the impact of routine events.
Consider as one example the clogged cooling tower strainer in 1828 L Street, which was detected because one of two chiller units was cycling on and off. The problem was detected quickly and addressed with a minimum of troubleshooting by the building engineer because of the intelligence provided by AtSite. One could easily see this problem going undetected and causing chiller shutdown on a hot day, which could have significant impact on tenants and owner.
PAGe 22 | reAl-tIMe eNerGY MANAGeMeNt IN three lArGe coMMercIAl offIce buIlDINGs
6. the observed results occurred in buildings that were already efficient at the outset. By all objective measures, including Energy Star scores, the three Tower buildings in this case study were well-operated, efficient buildings prior to implementing the energy management initiative. Significant energy savings were still achieved. This fact suggests energy management initiatives should have value to many—and perhaps most—building owners.
In some buildings with low Energy Star scores, a 10 to 15 percent reduction in expenses will mean large savings on a larger base of usage. And in some buildings, high Energy Star scores are the result of high-efficiency equipment, which still leaves room for savings from better operations.
At the same time, it is possible that in poorer-performing buildings the owner and building engineer may not be as responsive to energy management recommendations, while better-performing buildings reflect owners and operators who are responsive to problems.
Tower Companies is an unusual building owner/operator with regard to its culture: even before this energy management initiative, the company regularly communicated to its buildings engineers and staff that efficiency was valued. Because of this culture, the building engineers surely were more likely to engage in measures to manage energy use and to undertake more aggressive measures than its counterparts at more typical buildings.
These facts reinforce our findings that overall management attentiveness to catching operational stray that leads to energy waste is a key ingredient to high-performing buildings.
PAGe 23 | reAl-tIMe eNerGY MANAGeMeNt IN three lArGe coMMercIAl offIce buIlDINGs
This case study strongly suggests large amounts of electricity are wasted in
commercial office buildings today, even in good buildings. The electricity is
used, every day and night, to power systems that do not improve the operation
of the building, add to comfort, or supply tenant needs. This case study provides
building owners with a model for services and systems to identify the causes of wasted
energy and prevent that waste from happening in the first place.
Even in the best buildings, building systems routinely stray from optimal: ventilation equipment might be adjusted for an unusual event, such as a tenant build-out, then not returned to preferred settings; temperature might be adjusted for an after-hours conference event and not returned; controls and equipment fail, and software can have bugs; and circumstances in the buildings may change.
Tower’s initiative and the efforts of AtSite and HVACC show how better information and advice enable a building team to minimize operational stray in the first place and to catch it quickly when it occurs. This study shows the kind of savings available in the first year alone—13 percent across three already efficient buildings.
Similar savings could be available in many other office buildings. The amount of the potential savings should strongly encourage building owners and operators to undertake initiatives similar to the Tower energy management initiative.
Tenants in commercial office buildings should explore with the building owner or operator whether an energy management initiative makes sense. Since the tenants often bear the direct cost of energy use in the building, they would enjoy the benefits of savings. One option is to offer to share the costs of an initiative so that the risk to the owner is reduced.
Today, energy efficiency programs and policies tend to emphasize and encourage building owner investment in capital improvement projects, such as installation of new equipment. This case study suggests efficiency policies and programs could achieve substantial results by reducing the cost to the building owner of implementing and maintaining energy management initiatives. This case study provides a model implementation.
VI. coNclusIoN
PAGe 24 | reAl-tIMe eNerGY MANAGeMeNt IN three lArGe coMMercIAl offIce buIlDINGs
APPeNDIx Astudy Participants
tower companiesTower Companies is a family-owned, award-winning sustainable real estate development company, founded by Albert Abramson in 1947 and located in Rockville, Maryland. Tower pioneered the building of U.S. Green Building Council LEED certified residential and commercial properties. Tower’s portfolio includes 4.5 million square feet of office buildings, office parks, 1,500 apartments, regional malls, eco-progressive live/work/play communities, and hotels in the Washington, D.C., area. Among its other signature properties are Washington Square, White Flint, 2000 Tower Oaks Boulevard, River Creek, and Bethesda Place Office and Apartments. About 90 percent of the company’s properties are LEED certified.
Tower Companies has received numerous awards and recognition for its commitment to sustainability, energy independence, and building some of the healthiest buildings in the region, including recognition by the U.S. Department of Energy, the U.S. Environmental Protection Agency, the State of Maryland, the U.S. Green Building Council, the Urban Land Institute, and Harvard University.
Atsite, Inc. AtSite, founded in 1993 as a building-solutions company, is headquartered in Washington, D.C. Its performance solutions include technology, maintenance, and services through all phases of a building’s life cycle: design, construction, operation, and “rebirth.” It provides services across North America and across building sectors, including commercial office, education, health care, institutional, government, and retail.
A team of three AtSite employees served on the Tower project to identify, implement, and analyze energy conservation measures in multiple Tower-owned properties. The team consisted of the following people:
Andrea hidalgo, LEED AP O+M, senior manager, Commercial Buildings PracticeAndrea Hidalgo has 10 years of experience in commercial, mixed-use, and federal buildings, with a concentration on energy, architecture, and design/construction management. Her specialty is project management with an emphasis on efficient long-term building operations, sustainable design, and construction oversight. She oversees the delivery of smart building infrastructure, energy analyses and reporting,
energy star and thermography analyses, sustainability assessments, building commissioning, and LEED administration. Before joining AtSite, she was a construction architect for Davis, Carter, Scott, Ltd. and project manager for Project Management Services, Inc. She received her bachelor’s degree in architecture from Syracuse University and master’s in engineering management from the George Washington University. She is a LEED AP O+M, a certified infrared thermographer, co-chairs the USGBC NCR Programs Committee and the NAIOP Maryland/D.C. Sustainable Development Committee, and sits on the NAIOP Maryland/D.C. Real Estate Emerging Leaders Board. She was recently named the 2012 Real Estate Emerging Leader Member of the Year by NAIOP Maryland/D.C., the Commercial Real Estate Development Association, and received the 2012 Developing Leader Award from NAIOP National.
justin lee, LEED AP BD+C, senior engineerJustin Lee is a professional engineer (licensed in D.C., Maryland, and Virginia), a certified energy manager, and a LEED AP Building Design and Construction with eight years of experience in engineering consulting and the commercial real estate industry. He delivers client value through his knowledge of energy engineering and a thorough understanding of sustainable design principles. Prior to joining AtSite, he was a project engineer with Tolk, Inc., focusing on the design and construction of HVAC systems in large commercial speculative office buildings, build-to-suit government offices, interior renovations, fitness centers, commercial and government data centers, as well as HVAC system upgrades. He received a bachelor of science degree in mechanical engineering from Virginia Tech. He is a member of ASHRAE, the Association of Energy Engineers, and the National Society of Professional Engineers.
sam Quinn, LEED AP O+M, performance analystSam Quinn works with facility directors and building engineers to evaluate opportunities to reduce energy use. Through his analysis of real-time data, he is able to identify anomalies and specific energy signatures that are possible areas for operational improvement. He works with a variety of clients in a range of industries, including commercial buildings, multifamily residences, health care, and education. Prior to working at AtSite, he designed energy models for EMO Energy Solutions and conducted biofuel research for General Systems Research. He received his bachelor of science degree in mechanical engineering from the University of Vermont.
VII. APPeNDIces
PAGe 25 | reAl-tIMe eNerGY MANAGeMeNt IN three lArGe coMMercIAl offIce buIlDINGs
hVAc concepts (hVAcc)HVACC has been in business for more than 19 years, concentrating on controlling and monitoring facilities throughout the Washington, D.C., metropolitan area. The company is an Authorized Tridium System Integrator and is experienced in presenting LonWorks, Bacnet, Modbus, and several proprietary control networks via the Web with the Tridium JACE Controllers. HVACC operates a 24-hour monitoring and service center to handle alarm functions and customer service needs.tower companiesDavid Borchardt – chief sustainability officerEugenia Gregorio – sustainability manager Jim Lewis – director of engineering Debbie Webb – director of property managementDonna Nurmi – senior property managerNathan Sims – property manager Fernando Andrade – building engineer, 1707 L StreetEric Harris – building engineer, 1828 L Street Robinson Ramirez – building engineer, 1909 K Street
AtsiteAndrea Hidalgo – senior managerJustin Lee – senior engineer Sam Quinn – performance analyst
hVAc conceptsChris Werneke – senior account executive
APPeNDIx bAnalysis MethodologyElectricity usage data were obtained from PEPCO billing statements provided to Tower Companies for both the baseline and the study period.
A. Adjusting electricity usage Data to calendar MonthsTower Companies provided monthly utility bills received from PEPCO. These bills were based on electricity used during billing periods, rather than calendar months. Each bill included the initial and final meter reading date, the number of days in the billing period and the electricity used in kilowatt hours (kWh). Since the exact billing dates vary from year to year and weather data (number of cooling and heating days) are available on a monthly basis, we adjusted the utility bill data to calendar months using the following process:
1. First we divided the total electricity used during the billing period by the number of days in the billing period to determine an average kWh/day for that billing period.
2. We took the bills that include a portion of two different months (e.g., June 15 to July 15) and multiplied the average daily usage from each bill by the number of days from the bill that occurred during the given calendar month. Because the final meter reading date for one bill is the same as the initial reading date for the following bill, we counted the initial reading date as the first full day in a billing period and the day before the final reading date as the last full day in the billing period. For example, for the month of January 2011 (see table 4),
table 4: example of Adjusting Billing data to monthly data; 2011 data for 1707 L street nW
Meter reading Number of Days
electricity used in kWh kWh/Day Month Days/Month kWh/Monthfrom to
12/15/10 1/18/11 34 143,786 4229 Jan-11 31 131,747
1/18/11 2/14/11 27 115,433 4275 feb-11 28 120,131
2/14/11 3/17/11 31 133,408 4303 mar-11 31 136,853
3/17/11 4/14/11 28 126,928 4533 Apr-11 30 151,913
4/14/11 5/16/11 32 175,026 5470 may-11 31 191,925
5/16/11 6/13/11 28 192,293 6868 Jun-11 30 201,845
6/13/11 7/15/11 32 212,326 6635 Jul-11 31 222,634
7/15/11 8/12/11 28 213,691 7632 Aug-11 31 215,792
8/12/11 9/13/11 32 210,947 6592 sep-11 30 205,879
9/13/11 10/12/11 23 161,989 7043 oct-11 31 154,594
10/12/11 11/10/11 29 111,825 3856 nov-11 30 104,704
11/10/11 12/13/11 33 110,000 3333 dec-11 31 106,105
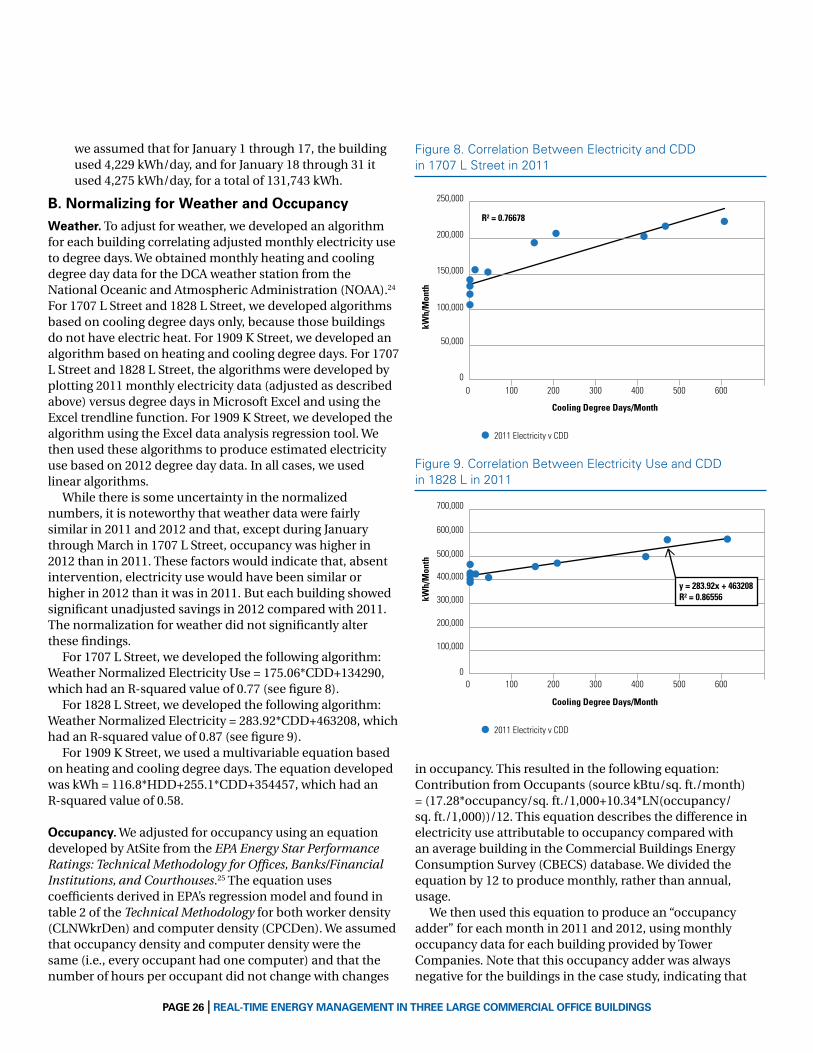
PAGe 26 | reAl-tIMe eNerGY MANAGeMeNt IN three lArGe coMMercIAl offIce buIlDINGs
figure 8. Correlation Between electricity and Cdd in 1707 L street in 2011
figure 9. Correlation Between electricity use and Cdd in 1828 L in 2011
�gure 6 Correlation Between Electricity Use and Cooling Degree Days in 1707 (2012)
�gure 7 Correlation Between Electricity and Cooling Degree Days in 1707 (2011)AND Figure 8 these are the same charts
�gure 9 Correlation Between Electricity Use and CDD (2011)
kWh/
Mon
th
250,000
700,000
kWh/
Mon
th
600,000
500,000
400,000
300,000
200,000
100,000
0
200,000
150,000
100,000
50,000
00 100 200 300 400 500 600
R² = 0.9693
Cooling Degree Days/Month
0 100 200 300 400 500 600
2011 Electricity v CDD
Cooling Degree Days/Month
2012 Electricity v CDD
y = 283.92x + 463208 R² = 0.86556
kWh/
Mon
th
Cooling Degree Days/Month
250,000
200,000
150,000
100,000
50,000
00 100 200 300 400 500 600
R² = 0.76678
2011 Electricity v CDD
�gure 6 Correlation Between Electricity Use and Cooling Degree Days in 1707 (2012)
�gure 7 Correlation Between Electricity and Cooling Degree Days in 1707 (2011)AND Figure 8 these are the same charts
�gure 9 Correlation Between Electricity Use and CDD (2011)
300,000
kWh/
Mon
thkW
h/M
onth
Cooling Degree Days/Month
250,000
200,000
150,000
100,000
50,000
0
700,000
kWh/
Mon
th
600,000
500,000
400,000
300,000
200,000
100,000
0
200,000
150,000
100,000
50,000
0
0 100 200 300 400 500 600
0 100 200 300 400 500 600
y = 175.06x + 134290R² = 0.76678
R² = 0.9693
2011 Electricity v CDD
Cooling Degree Days/Month
0 100 200 300 400 500 600
2011 Electricity v CDD
Cooling Degree Days/Month
2012 Electricity v CDD
y = 283.92x + 463208 R² = 0.86556
we assumed that for January 1 through 17, the building used 4,229 kWh/day, and for January 18 through 31 it used 4,275 kWh/day, for a total of 131,743 kWh.
b. Normalizing for Weather and occupancyWeather. To adjust for weather, we developed an algorithm for each building correlating adjusted monthly electricity use to degree days. We obtained monthly heating and cooling degree day data for the DCA weather station from the National Oceanic and Atmospheric Administration (NOAA).24 For 1707 L Street and 1828 L Street, we developed algorithms based on cooling degree days only, because those buildings do not have electric heat. For 1909 K Street, we developed an algorithm based on heating and cooling degree days. For 1707 L Street and 1828 L Street, the algorithms were developed by plotting 2011 monthly electricity data (adjusted as described above) versus degree days in Microsoft Excel and using the Excel trendline function. For 1909 K Street, we developed the algorithm using the Excel data analysis regression tool. We then used these algorithms to produce estimated electricity use based on 2012 degree day data. In all cases, we used linear algorithms.
While there is some uncertainty in the normalized numbers, it is noteworthy that weather data were fairly similar in 2011 and 2012 and that, except during January through March in 1707 L Street, occupancy was higher in 2012 than in 2011. These factors would indicate that, absent intervention, electricity use would have been similar or higher in 2012 than it was in 2011. But each building showed significant unadjusted savings in 2012 compared with 2011. The normalization for weather did not significantly alter these findings.
For 1707 L Street, we developed the following algorithm: Weather Normalized Electricity Use = 175.06*CDD+134290, which had an R-squared value of 0.77 (see figure 8).
For 1828 L Street, we developed the following algorithm: Weather Normalized Electricity = 283.92*CDD+463208, which had an R-squared value of 0.87 (see figure 9).
For 1909 K Street, we used a multivariable equation based on heating and cooling degree days. The equation developed was kWh = 116.8*HDD+255.1*CDD+354457, which had an R-squared value of 0.58.
occupancy. We adjusted for occupancy using an equation developed by AtSite from the EPA Energy Star Performance Ratings: Technical Methodology for Offices, Banks/Financial Institutions, and Courthouses.25 The equation uses coefficients derived in EPA’s regression model and found in table 2 of the Technical Methodology for both worker density (CLNWkrDen) and computer density (CPCDen). We assumed that occupancy density and computer density were the same (i.e., every occupant had one computer) and that the number of hours per occupant did not change with changes
in occupancy. This resulted in the following equation: Contribution from Occupants (source kBtu/sq. ft./month) = (17.28*occupancy/sq. ft./1,000+10.34*LN(occupancy/sq. ft./1,000))/12. This equation describes the difference in electricity use attributable to occupancy compared with an average building in the Commercial Buildings Energy Consumption Survey (CBECS) database. We divided the equation by 12 to produce monthly, rather than annual, usage.
We then used this equation to produce an “occupancy adder” for each month in 2011 and 2012, using monthly occupancy data for each building provided by Tower Companies. Note that this occupancy adder was always negative for the buildings in the case study, indicating that

PAGe 27 | reAl-tIMe eNerGY MANAGeMeNt IN three lArGe coMMercIAl offIce buIlDINGs
the Tower buildings have a lower occupancy density than an average building in the CBECS database. We used the difference between the occupancy adder from 2012 for a given month and the occupancy adder for the same month in 2011 to estimate the difference in electricity use in the given month because of differences in occupancy. Because the EPA equation yielded a number in source KBtu/sq. ft., we multiplied the occupancy adder number by the square footage and converted back to site kWh. We then added this number to the weather normalized kWh to adjust for occupancy differences from the previous year, which yielded the final weather and occupancy normalized electricity usage for 2012.
c. Whole building ApproachWe did not attempt to directly identify energy savings for any specific measures implemented.
A large number of measures were implemented in the study period, and we expect the measures to have substantial interactive effects.
We did not make any adjustments to the baseline or study period usage data to account for other factors that could have affected energy use, including known events such as construction during tenant build-out, changes in lighting, or configuration of tenant spaces. We discussed the status of the buildings on a monthly basis with Tower and AtSite to identify events that could potentially require adjustment. All events that occurred appear to be normal events in the life of the typical building.
We only included electricity usage data in this case study and excluded fuel oil and natural gas usage from our analysis.
D. study Period and baselineWe concluded we would establish a baseline of calendar year 2011 and study period of calendar year 2012, even though there is a chance the energy management services could have affected building engineer behavior in the last months of 2011. This is because AtSite was engaged in September 2011 and began planning sessions to implement the project, which could have caused buildings teams to be more conscious of energy savings opportunities. AtSite conducted its walk-throughs of the buildings in December 2011 and held its first monthly meetings with the buildings engineers in January 2012. Tower and AtSite, for purposes of measuring results for internal performance evaluation, established a baseline period of September 2010 to September 2011 for this reason.
If building engineers in late 2011 did, in fact, exercise greater energy management in expectation of being measured more closely, the effect would be to reduce the baseline energy usage and to make the study period energy usage reflect lower savings.
APPeNDIx chVAcc Alarm list
1707 l st. NWn Tower Fans Call On/Status Off and Call Off/Status
Off Alarmn Condenser and Chilled Water Pump Call On/Status
Off and Call Off/Status Off Alarmn Tower Out, Chiller 1 Supply, Chiller 2 Supply and
Hot Water Supply Temperature High/Lo Alarmn Boiler 1 and 2 Flame Failure Alarmn Induction Unit Supply and Return Fan Call On/Status
Off and Call Off/Status Off Alarmn Induction Unit Supply Static Pressure High/Lo Alarmn Induction Unit Supply Air Temperature High/Lo Alarmn Floors 2–10 AHU Supply Fan Call On/Status Off and
Call Off/Status Off Alarmn Floors 2–10 Return Air Temperature High/Lo Alarm
1828 l st. NWn Toilet and Penthouse Exhaust Fans Call On/Status
Off and Call Off/Status Off Alarmn AHU, Retail, Standby and FCU Hot Water Pumps
Call On/Status Off and Call Off/Status Off Alarmn Tower Fans Call On/Status Off and Call Off/Status
Off Alarmn Chiller 1 and 2 Supply Temperature High/Lo Alarmn Boiler 1 and 2 Supply Temperature High/Lo Alarmn Chiller 1 and 2 Failure Alarmn Boiler 1 and 2 Flame Failure Alarmn AHUs Supply and Return Fans Call On/Status Off and
Call Off/Status Off Alarmn AHUs Supply, Return, and Building Static Pressure
High/Lo Alarm n AHUs Supply Air Temperature High/Lo Alarmn AHUs Zones 1 through 4 Temperature High/Lo Alarm
(except the AHUs on floors 4, 5, 6, 7, and 10)n AHUs CO2 High Alarm

PAGe 28 | reAl-tIMe eNerGY MANAGeMeNt IN three lArGe coMMercIAl offIce buIlDINGs
1909 K st. NWn Tower Fans Call On/Status Off and Call Off/Status Off
Alarmn Tower Valves Call On/Status Off and Call Off/Status Off
Alarmn Condenser, Secondary Chilled Water and Primary Chilled
Water Pumps Call On/Status Off and Call Off/Status Off Alarm
n Chiller 1 and 2 Failure Alarmn Chilled Water Supply Temperature High/Lo Alarmn Retail Tower Fan Call On/Status Off and Call Off/Status Off
Alarmn Retail Bypass Valve Call On/Status Off and Call Off/Status
Off Alarmn Retail Loop Temperature High/Lo Alarmn VAV AHUs Supply Fan Call On/Status Off and Call Off/
Status Off Alarmn VAV AHUs Supply and Return Air High/Lo Temperature
Alarmn VAV AHUs Supply Static Pressure High/Lo Alarmn VAV AHUs Freeze Stat Alarmn VAV AHUs Outdoor Air CFM High/Lo Alarmn VAV AHUs Low Mixed-Air Temperature Alarmn AC Units Supply and Exhaust Fan Call On/Status Off and
Call Off/Status Off Alarmn AC Units Supply Air and Space Temperature Alarmn AC Units Smoke Detector Alarm
Alarms established and monitored by HVACC enabled the building engineers to receive messages by phone or e-mail with the alarm detail. While each building engineer has the ability to override the alarm or to treat it as not requiring action, a record was kept of the alarm and the engineer’s response. An important feature of HVACC monitoring is that it is staffed by personnel. As a result, HVACC can follow up or escalate if the alarm recurs or in the event of certain exceptions.
PAGe 29 | reAl-tIMe eNerGY MANAGeMeNt IN three lArGe coMMercIAl offIce buIlDINGs
endnotes
1 for a description of the market by Pike research, see the paper located at www.eebhub.org/media/files/sbms-12-executivesummary.pdf. Also, companies that provide energy management services can be found in reports and materials located on www.naesco.org.
2 many different labels and terms are often applied to the various energy management initiatives involved in this case study: energy auditing, continuous commissioning, retro-commissioning, upgraded building management systems, alarms, and more. We opted to describe this combination loosely as real-time energy management. for definition and information on continuous commissioning, see the website of energy systems Laboratory, texas A&m engineering experiment station, at http://engineering.tamu.edu/. Also see evan mills, Building Commissioning: A Golden Opportunity for Reducing Energy Costs and Greenhouse Gas Emissions, July 21, 2009, http://cx.lbl.gov/2009-assessment.html. Also see federal energy management Program, Continuous Commissioning Guidebook for Federal Energy Managers, https://www1.eere.energy.gov/femp/pdfs/ccg03_ch1.pdf.
3 this observation is based on average set-up expenses reported by several vendors.
4 norm miller, “does green still Pay off?” Costar group, 2010, http://www.costar.com/uploadedfiles/Josre/pdfs/doesgreenstillPayoff.pdf. And norm miller et al., “does green Pay off?” http://www.costar.com/uploadedfiles/Josre/pdfs/Costar-Josre-green-study.pdf.
5 for more information on the u.s. general services Administration’s requirement of energy star status for all leased space, see http://www.gsa.gov/portal/content/103228.
6 energy star scoring methodology relies on energy usage per square foot determined through the use of the energy star tool (Portfolio manager) from many inputs provided by the building owner. the score reflects a building’s performance relative to other buildings in its class. the energy star score includes both electricity and heating fuels. this case study examines only electricity use. for more on energy star scores, visit http://www.energystar.gov/index.cfm?c=evaluate_performance.pt_neprs_learn.
7 tower undertook energy initiatives in a larger number of buildings. this case study covered only the three downtown buildings.
8 While Atsite typically installs these metering devices for its clients, in this case tower engaged hVACC to perform the installation work.
9 We note that tower undertook more of the set-up and “light-up” work than a building owner in a typical installation, by separately engaging PePCo and hVACC to implement metering and network devices.
10 After several monthly meetings, each building engineer began to keep a “change log”—a record of the changes made to building operations after each monthly meeting. At the beginning of each meeting, the building engineers would review their change logs with the Atsite team and discuss how certain recommendations were working or perhaps why they had not been implemented.
11 A deadband is a setting that allows the hVAC to run with fewer on/off cycles. A four-degree deadband would have the chiller come on at 72 degrees, then run continuously until the temperature reaches 68 degrees. some settings had two-degree deadbands.
12 the hVAC cooling system could be set to switch over to economizer “free cooling” at 50 degrees (in spring/summer) and even higher in winter, which refers to the outside temperature at which the system brings in outside air to cool the building.
13 see http://www.havtech.com/2010/11/12/1828-l-installs-most-efficient-chiller-in-dc/. tower expects the $750,000 investment in this
chiller to pay back in about 10 years from reduced maintenance and utility expenses.
14 tower also engaged another vendor, Cds, to assist with certain implementation projects.
15 see http://www.distech-controls.com/news_events/Pr/Pr_tridium.html.
16 tower installed metering devices to measure electricity usage at the whole-building main meter and on certain equipment, which provided tower and Atsite with electricity usage data.
17 We did not attempt to distinguish between weekdays and weekend days over the course of the billing period.
18 natural gas was used in the buildings only for domestic hot water heating and was excluded from our study. fuel oil was excluded because fuel oil is not metered, but rather is delivered in quasi-standard volume installments (rather than topping off the tank), making it very difficult to reconstruct fuel oil usage or savings on a monthly or even annual basis. We observed nothing in the initiative or the operations of the buildings that would suggest any measures or adjustments would lead to increased fuel oil usage. in addition, 1909 K street has electric heat. Limiting the study to electricity and excluding fuel oil appears likely to understate the actual savings realized by tower.
19 tower’s total electricity rates for 2012 averaged about $0.13 per kWh (total cost with demand charges and all applicable fees and adjustments). in cities with different electricity rates, different savings and total return could be expected.
20 We made adjustments for weather differences and occupancy differences between the baseline period and the study period. We observed no other major inputs to energy use that would account for material energy reductions. our adjustments, our observations, and tower’s reporting of nonroutine energy usage events strongly suggest the full-year electricity usage savings would not have occurred without the energy management initiative. We did not, however, conduct a measurement and verification or energy audits that would support a reliable representation that specific services or energy conservation measures account for the specified savings. A more rigorous study would have implemented all energy conservation measures at the beginning of the study period and observed savings in a controlled environment. the realities of operating a multi-tenant office building make this kind of examination unrealistic or very expensive to implement; in practice, building owners will likely use a method resembling the method used in this case study.
21 for more information on the u.s. general services Administration’s requirement of energy star status for all leased space, see http://www.gsa.gov/portal/content/103228. According to a gsA memo of september 2010 to regional commissioners, “section 435 of eisA mandates that no federal agency enter into a leasing contract on or after december 19, 2010, for a building that has not earned the energy star label in the most recent year, unless the space requirement is in compliance with specific exceptions provided in the eisA statute.”
22 for information on Bank of America’s commitment to reduce ghg index of its operations, see http://about.bankofamerica.com/en-us/partnering-locally/reduce-greenhouse-emissions; and for similar commitment of Wells fargo see https://www.wellsfargo.com/about/csr/ea/greenbuildings/.
23 see Clean and Affordable energy Act (CAeA), d.C. Code § 6-1451.03 (2013).
24 see http://www.ncdc.noaa.gov/cdo-web/quickdata.
25 see http://www.energystar.gov/ia/business/evaluate_performance/office_tech_desc.pdf.

PAGe 30 | reAl-tIMe eNerGY MANAGeMeNt IN three lArGe coMMercIAl offIce buIlDINGs
Natural resources Defense council40 West 20th streetnew york, ny 10011212 727-2700fax 212 727-1773
Beijing
Chicago
Los Angeles
Bozeman
san francisco
Washington
www.nrdc.org
Printed on recycled paper
www.nrdc.org/policy www.facebook.com/nrdc.org www.twitter.com/nrdc