![Beyond the Click: Display Metrics for Demand Marketers [PowerPoint]](https://static.fdocuments.in/doc/165x107/554ce9b6b4c90513118b470b/beyond-the-click-display-metrics-for-demand-marketers-powerpoint.jpg)
Beyond the Click: Display Metrics for Demand Marketers [PowerPoint]
Upload
kissmetrics-on-slideshareCategory
view
1.711download
1
Arjun Dev Arora!
Real Time Display – The Metrics that Ma!er and How to Optimize for Success June 2014!

@danielmcgaw #KISSwebinar
Follow me!!

@arjundarora #RTD_KMWebinar
Follow me!!

Arjun Dev Arora, Chairman and Founder of ReTargeter Arjun was the founding CEO of ReTargeter and bootstrapped the company to be in the top 100 of Inc's Fastest Growing Companies list. He is a recognized expert in display advertising and retargeting.�Arjun also advises various advertising and technology start-up companies.
Dan McGaw, Director of Marketing at KISSmetrics Dan is the Director of Marketing at KISSmetrics, where he gets the opportunity to help the best marketers in the world measure their marketing and business efforts. Prior to KISSmetrics, Dan was VP of growth at Code School, where he helped the company grow to over 500k users and $400k+ in monthly revenue.

1! Core Metrics!
CPM, CPC, and CPA!
3! Intelligent Spending!
4! Execution & Optimization!
Table of Contents!
Impressions, Clicks, Conversions, RoAS!
5! Summary & Conclusion!
2! Core Dimensions!Inventory, Creatives, Time, Landing Page!

WATCH WEBINAR RECORDING NOW

Core Metrics!
1!

Impressions
Core Metrics!
• Whenever your creative is displayed, it’s considered an impression.
Why they ma"er"Impressions are the point of contact and between you and your audience. Therefore, campaign optimizations focus on serving impressions at the right time, to the right people, and in the right place.
What they tell you The way viewers respond to impressions can tell you a lot about your audience and your brand. "
What they don’t tell you Don’t expect a Fall coat sale to perform identically to a Spring sandals sale. While you can apply some wisdom between campaigns, every campaign is different and requires its own set of tests and optimizations."
How they can change Impressions vary dramatically depending on your campaign and spending goals. Do you care what websites display your ads? Or are you interested in displaying as many impressions as possible, regardless of location?

Clicks
Core Metrics!
• A click occurs when a user clicks your advertisement
Why they ma"er"
If an impression is the point of contact between you and a viewer, a click is the viewer engaging in the conversation. A click means that your creative generated enough interest for somebody to click on it. Although clicks are a common way to measure campaign performance, it should not be the main driver of your campaign
What they tell you Clicks can tell you how effective your creatives are. You can also gather intelligence about how much demand there is for your offering."
What they don’t tell you Bot traffic skews click data. As a result, you might make misinformed campaign optimizations. You can identify bot traffic and segment this group to be excluded from your campaign (more details on this later)."
How they can change
Clicks are desirable because they imply inbound traffic. Sometimes however, all that ma"ers is that somebody saw the ad. For example, a campaign urging people to “tune in” to a sitcom is pushing for awareness. The number of people who click through isn’t as important as whether or not they watch the show.""

Conversions
Core Metrics!
• Conversions occur when a user performs a desired action and differ depending on the individual
campaign goals.
Purchase Data Submission Share
Why they ma"er" Conversions are o$en the end goal of display campaigns and are affected by numerous factors.
What they tell you Poor conversion rates can have several causes: poorly designed creatives, wrong audience, not serving enough impressions, poor landing page UX, or even an undesirable offering."
What they don’t tell you
It won’t be immediately clear what is causing people to convert (or not). If you aren’t satisfied by your conversion rate, it could be an issue with your display advertising, but it could also be an issue with your pricing, website, messaging, etc. You’ll need to test to determine the root of any pa!erns.!
How they can change
Conversions will vary depending on your business and campaign goals. Conversions can be as small as a social share, or as big as purchasing a vacation package. The most common conversion types are a purchase, a share, and data submission (e.g. subscriptions/registrations)""

Click Through Conversions
Core Metrics!
• A!ribution: Click through conversions are easier to a"ribute than view through conversions.
You know what creative a person saw, when they saw it, and you know that they engaged with it
before actually converting.
• Measurement: Click through conversions are measured by click through to conversion rate
conversions/clicks.
• What does it mean? A low click through conversion rate could mean that your creative isn’t
displaying to the right audience. It could also suggest that your landing page needs work to move
visitors to convert.

View Through Conversions
Core Metrics!
• A!ribution: A"ribution is hazier for VTCs but it’s still an extremely valuable metric. Although
viewers don’t click on the creative, studies have shown that display campaigns result in an 80%
increase in branded search, meaning people see the creative and use a search engine to find the
business later.
• View through window: View through windows help define VTC a"ribution. For example, a 14
day view through window will a"ribute conversions to a creative if it was viewed within 14 days
of the conversion.
• Intelligence: The VTC rate is an important measurement of the value and effectiveness of your
campaign. A low VTC rate could indicate that you’re serving the wrong audience. Is this audience
behaving differently than other audience segments that you are not targeting/retargeting? You
might even set up a test to find out!

Core Metrics!
Purchase Data Submission Share
Ad Spend Ad spend is simply the amount you paid for advertising. • Spend = Impressions/1000 x CPM
Revenue
In this case, revenue refers to any income that results from your campaign. You can usually use a revenue pixel to track your revenue and tie it to a specific campaign.""
Return on Ad Spend RoAS
If you know your ad spend and your revenue, you can calculate your RoAS (Return on Ad Spend). • RoAS = (Revenue – Spend) / Spend You should define what RoAS works for your goals and use this metric to compare your overall advertising efforts."
Ad Spend, Revenue, and RoAS

Core Dimensions!
2!

Inventory Source
Core Dimensions!
• Inventory source refers to the particular ad network that provided the inventory space.
Understanding how your campaign performs against different inventory sources will help you
optimize.

Creatives
Core Dimensions!
• Creatives are the actual ads you display. Continuously test and optimize your creatives.

Creatives
Core Dimensions!
• These are the most common inventory sizes

Time of Day
Core Dimensions!
• Your audience may be more active online at certain times of the day. Tailor your campaign to fit
your audience.

Landing Pages
Core Dimensions
A well-designed and relevant ad, will probably drive a lot of clicks. But what happens a$er the
visitor clicks your ad? Your ads and landing pages should align so the user has a smooth path to
conversion.
• The role of the landing page
o The landing page links your creative and your offering
o The landing page should move users through your funnel
• Optimize forever
o Keep an eye on: bounce rate, conversion rate, and quality score (a propriety measure built by
Google that indicates how relevant your ads, keywords, and landing page are to a person
seeing the ad).

Landing Pages
Core Dimensions!
• Elements of a good landing page
o Design and messaging of
your landing page should be
consistent with your creative
o Should reiterate what was in
the ad and specify what the
visitor can expect
o Clearly communicate the
conversion action

Intelligent Spending!
3!
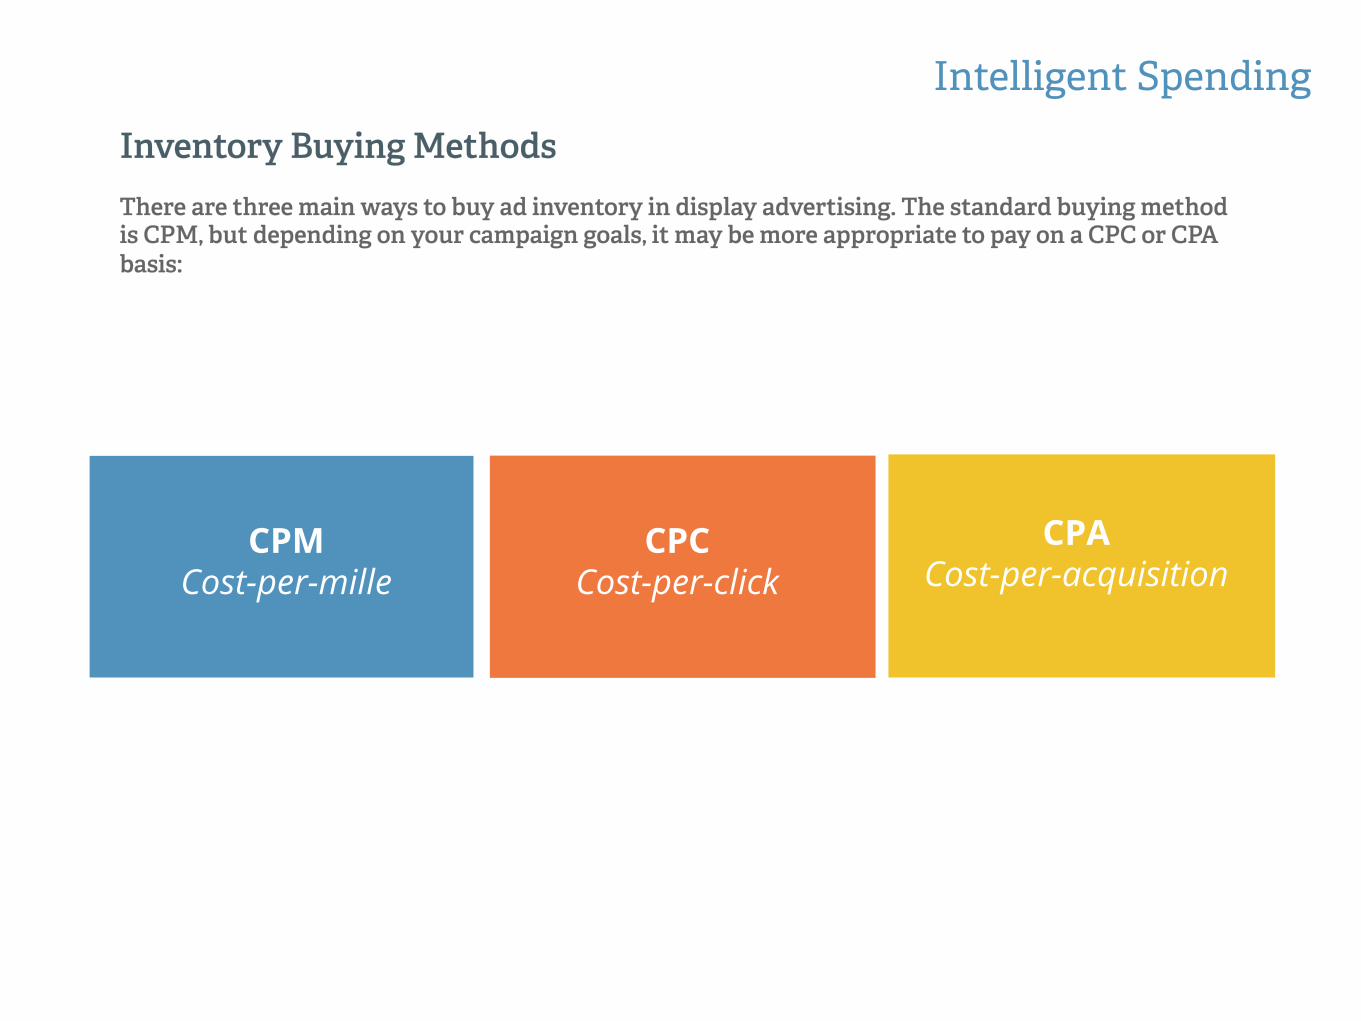
Inventory Buying Methods There are three main ways to buy ad inventory in display advertising. The standard buying method is CPM, but depending on your campaign goals, it may be more appropriate to pay on a CPC or CPA basis:!
Intelligent Spending!
CPM Cost-per-mille
CPC Cost-per-click
CPA Cost-per-acquisition

Cost-per-mille CPM!

CPM Cost-per-mille!
Intelligent Spending!
How it Works" Advertisers pay per 1,000 impressions."
Cost Range Programmatic: $0.50-$3.00 Programmatic Premium: $5-$15 Premium Direct: $10-$100+""
Who it benefits
• Industry standard for purchasing display media. • Appropriate for most display campaigns. • Works to the advantage of advertisers and adtech
companies.""
Campaign Goals Works for just about all campaign goals (brand awareness, click through, reach, conversions) because it allows room for optimization toward any goals.""

Cost-per-click CPC

CPC Cost-per-click!
Intelligent Spending!
How it Works" Advertiser pays for every click, regardless of the number of impressions displayed"
Cost Range Programmatic: $0.50-$5.00 Premium publishers don’t typically allow CPC!
Who it benefits
• Best for advertisers that care less about brand awareness and more about site traffic
• Doesn’t always work for adtech companies looking to protect their downside risk"
Campaign Goals Advertisers focused on generating site traffic"

Cost-per-acquisition CPA

CPA Cost-per-acquisition!
Intelligent Spending!
How it Works" Advertisers pay by conversion, regardless of number of impressions and clicks."
Cost Range Highly variable depending on the campaign. For example, pricing will differ if the acquisition is the sale of $10,000 so$ware product versus a $3 pair of sunglasses."
Who it benefits
• Good for advertisers trying to drive conversions regardless of traffic source.
• Can be VERY difficult for adtech companies as they take all the inventory risk."
Campaign goals Company needs to drive conversions within a fixed cost per conversion."

Buying methods vs.
Campaign Goals
Intelligent Spending!
Measure CPC/CPA
CPA Cost-per-
acquisition
Set up and optimize toward CPC and CPA goals even though you pay on a CPM basis
• Paying by CPM gives advertisers and clients the opportunity to see campaign conversion performance
• Reach the largest possible audience
So why not pay on a CPA/CPC basis?
• For CPA, view-through and click-through a"ribution must be defined before campaign launches
• CPA and CPC pricing can result in less flexibility for your campaign manager to test
• CPA/CPC pricing structures don’t always work well with adtech companies since they might not have
great control over campaign assets and performance (creative, landing pages, pricing, etc.), but take on
the risk of the actual media cost.
Pay by CPM While Optimizing Toward CPA/CPC Goals

LOG IN WITH GOOGLE
Start Your Free KISSmetrics Trial

Execution & Optimization!
4!

Execution & Optimization!
• Part of understanding your audience involves knowing when they browse the web. If you know
this, you can tailor your campaign to display ads when they are online. For example, B2B sellers
may find that they are most successful during business hours while an entertainment company
may do be"er showing impressions in the evening.
Time of Day Is your audience really looking at 3AM on a Sunday?!

Execution & Optimization!
• Different ads appeal to different kinds of audiences
• Your audience will get bored of even the best ads, it’s imperative to constantly rotate creatives
• How do you know what creatives work best? A/B test and iterate!
• Decide what element you want to test, then make an alteration to your existing creatives. For
example, try changing the color of a CTA or the wording of a tagline. Then compare the
performance of the creatives. Make sure you don’t alter too much in the test version, that
way you know exactly what drove a change in the creative’s performance.
Creative Test, test, test!

Execution & Optimization!
• Segmentation is a way to decide who is being targeted based on where they are engaging with
your website. Segments can be as complicated as SKU based or as simple as choosing between
two sections of the site.
Segmentation Organizing your audience!
Two different products Two different ad experiences

Execution & Optimization!
• Display advertising is great for reconnecting with site visitors, but extra care should be taken
not to overexpose yourself. Se"ing a frequency cap will limit the number of times tagged users
see your ads and will prevent potential customers from feeling bored, overwhelmed, or stalked.
We recommend showing 17-20 ads per user per month.
Frequency Caps How to use them properly and with different segments!

Execution & Optimization!
• Don’t waste your ad spend showing advertisements to an unqualified audience. If you’re selling
an app that is only compatible with iPhone, don’t advertise to Windows phone users.
• A more advanced optimization would be to target based off conversions driven by browser type.
For example, if Chrome users tend to convert more, you may place more of your budget
advertising to Chrome users.
Browser/Device Only show ads to certain types of devices or browsers!
Image Link

Execution & Optimization!
• Some inventory sources focus on specific site types like sports, gaming, entertainment, news, etc.
Depending on your audience, it may make sense to concentrate your ad spend on some inventory
sources while avoiding others. Similarly, you should remove underperforming inventory sources
and optimize for top performing sources.
Inventory Sources Remove the wrong inventory sources, and get more from the right inventory sources!
Execution & Optimization!
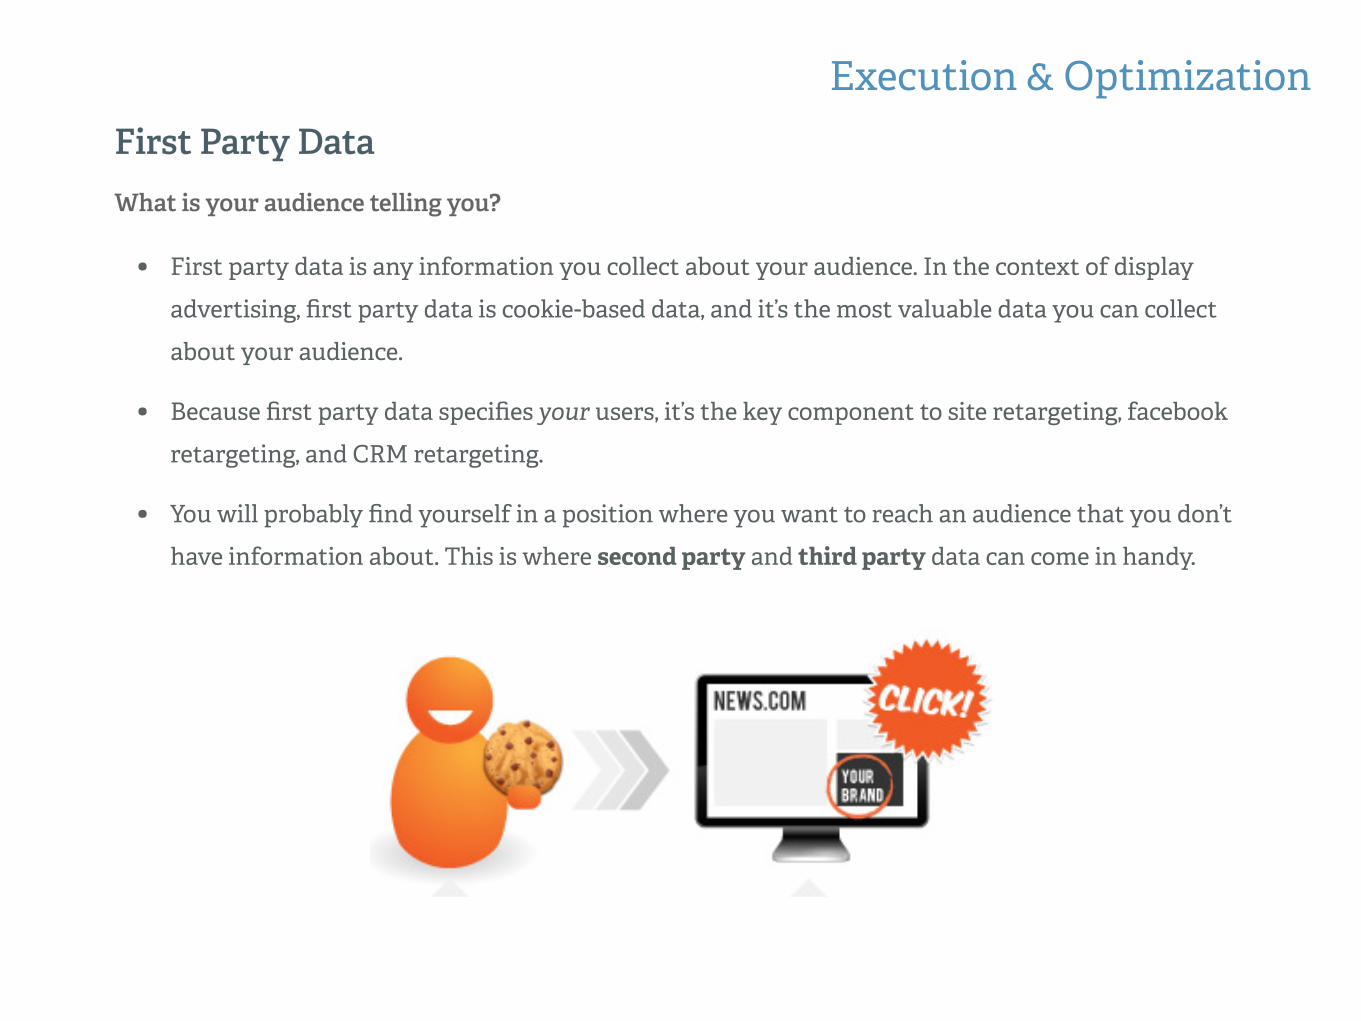
• First party data is any information you collect about your audience. In the context of display
advertising, first party data is cookie-based data, and it’s the most valuable data you can collect
about your audience.
• Because first party data specifies your users, it’s the key component to site retargeting, facebook
retargeting, and CRM retargeting.
• You will probably find yourself in a position where you want to reach an audience that you don’t
have information about. This is where second party and third party data can come in handy.
First Party Data What is your audience telling you?!

Execution & Optimization!
• Second party data is essentially somebody else’s first party data. Second party data isn’t usually
commoditized, but you can work out an arrangement with trusted partners to share customer
data. For example, a high-end watch company might partner with a yacht blog to find new
customers. The possibilities are endless, but the key is to form and maintain good partnerships.
Second Party Data Can you get proprietary access to transparent data?!

Execution & Optimization!
• Companies such as BlueKai, Peer39, and eXelate sell third-party data. These companies are also
known as DMPs or Data Aggregators and they are the behemoths of the data world. Their data is
typically purchased on a large scale from publishers. The benefit of third party data is the sheer
volume of user data you can access, but this data is also widely accessible to competitors so you
aren’t necessarily gaining unique audience intelligence.
• Third party data is great for demographic, behavioral, and contextual targeting, but can also be
used to remove bot traffic
• Third party data providers charge a fee to use their segments, usually on a CPM basis. Depending
on the the data, the CPM can be anywhere from $0.50 to $5.00
Third Party Data What’s out there, and what’s right for your business!

Execution & Optimization!Bidding Styles Bid to win all vs. bid to win most!
Bid to Win All" Bid to Win Most"
Win as many impressions as quickly as possible"
Manage your costs so inventory is cheaper, willing to lose some bids"
Appropriate for hard-to-win audiences Ex: High-level Executives
Appropriate for easy-to-find audiences Ex: College Students!
Exhausts budget rapidly" Preserves budget longer"

Execution & Optimization!
The world of display advertising is fast-moving and ever changing so it’s imperative to
keep up, or else you might be le$ behind. Keeping up can mean building new technologies
in-house, but it can also mean finding novel ways to combine existing technologies.
First Mover Advantage Using and building new solutions!
In-House"
If you want something done right, sometimes you’ve got to do it yourself. Unsurprisingly this takes a lot of time and effort, but it can pay off if it makes you stand out in the marketplace. Example: Trulia dynamic creatives
Partner Up
Innovation doesn’t have to mean building a new solution from the ground up. Existing technologies can be combined in novel ways to create brand new solutions. The key is to identify these technologies, and forge a strong partnership with the technology’s providers. This form of innovation is faster and requires less effort. However, it can leave you at the mercy of another organization that you have li"le control over, so make sure to choose your partners wisely.

CRM ReTargeting – This is a product that ReTargeter offers, and is built using technology from
LiveRamp. CRM ReTargeting lets you show advertisements to an audience defined by your CRM data.
Conversation ReTargeting– ReTargeter has also taken on the role of technology provider to power other
company’s products. PrimeLoop recently announced Conversation ReTargeting, a tool that allows
advertisers to tag users who click on links that don’t lead to their website. PrimeLoop uses ReTargeter
technology and combines it with their own link-shortening technology to offer a new solution to its
clients.
Execution & Optimization!First Mover Advantage Partners sharing technology to provide new solutions to customers!

Real Optimization Tests and Results
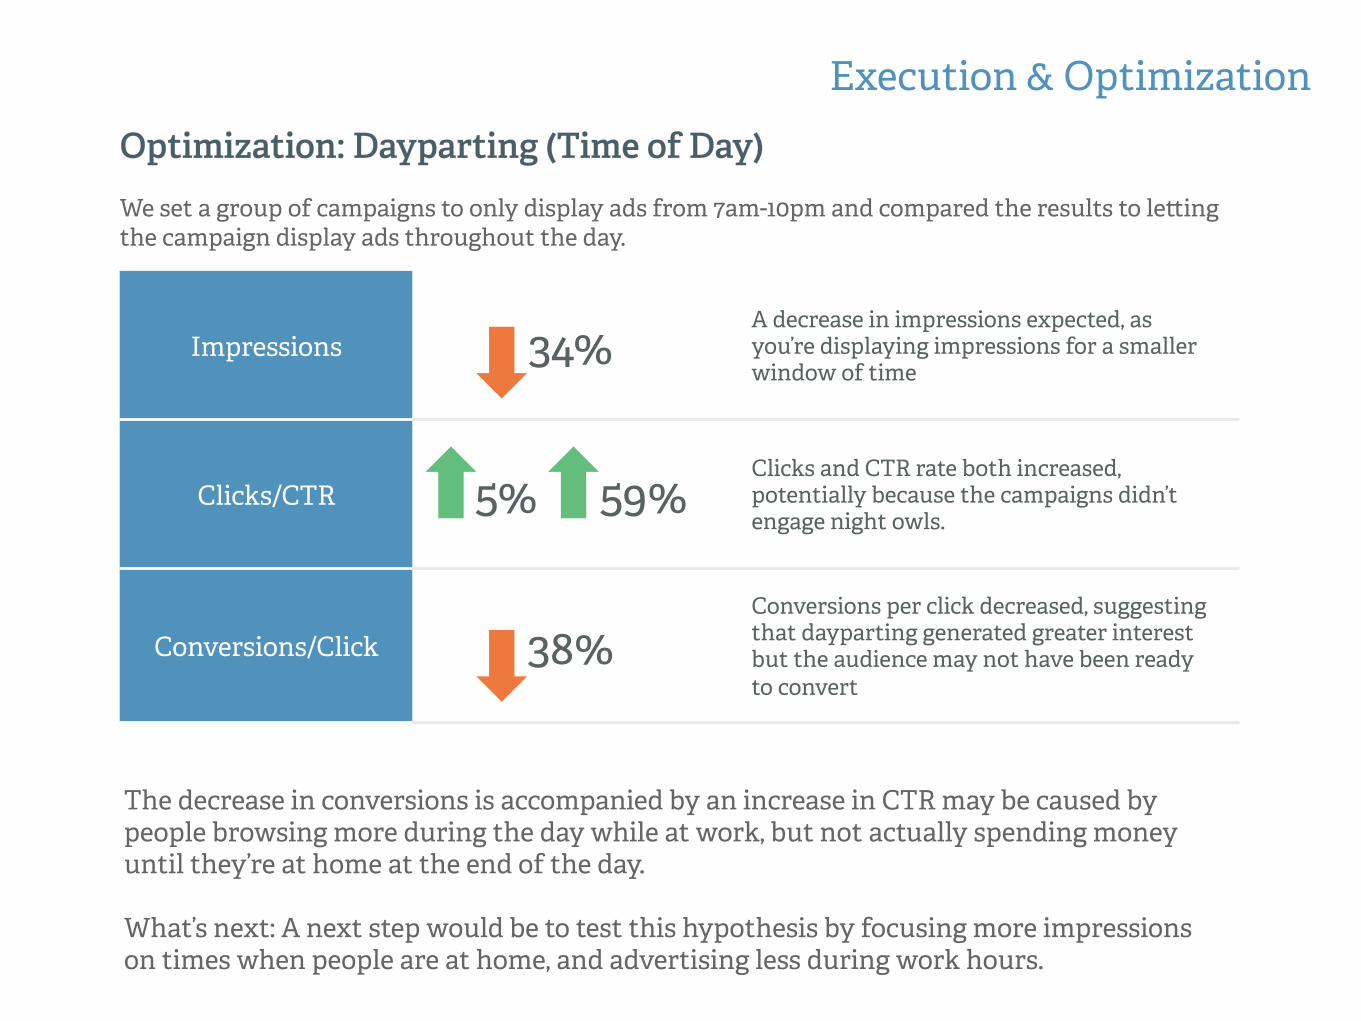
Optimization: Dayparting (Time of Day) We set a group of campaigns to only display ads from 7am-10pm and compared the results to le"ing the campaign display ads throughout the day.
Execution & Optimization!
Impressions 34% A decrease in impressions expected, as you’re displaying impressions for a smaller window of time
Clicks/CTR 5% 59% Clicks and CTR rate both increased, potentially because the campaigns didn’t engage night owls.
Conversions/Click 38% Conversions per click decreased, suggesting that dayparting generated greater interest but the audience may not have been ready to convert
The decrease in conversions is accompanied by an increase in CTR may be caused by people browsing more during the day while at work, but not actually spending money until they’re at home at the end of the day. What’s next: A next step would be to test this hypothesis by focusing more impressions on times when people are at home, and advertising less during work hours.

Optimization: Bot Traffic Bots are an unfortunate part of the ad industry but if you identify and remove bot traffic, you will likely see an improvement in your ad spend. Here’s the result of excluding some segments identified as bot traffic.
Execution & Optimization!
Impressions 4% A decrease in impressions reflects the bot traffic that has been weeded out
Clicks/CTR 17% 20% Clicks and CTR rate both decreased, both promising results as this was probably all bot traffic
Conversions/Click 13% Conversions per click increased, suggesting that at least some bot traffic has been successfully removed and ads are now being more concentrated on an engaged and interested audience
No advertiser wants to waste their ad spend on bots so making any effort you can to minimize bot traffic should only have a positive impact on your campaign. What’s next: Unfortunately fraudsters are extremely adaptable and optimize quickly so always be on the lookout for ways to eliminate bots.

Optimization: Inventory Quality Some advertisers only want to display ads on certain sites while others appreciate as much exposure as possible. We tested what happened when we only displayed ads on select inventory.
Execution & Optimization!
Impressions 38% A decrease in impressions is caused by the decrease in overall available inventory.
Clicks/CTR 20% 28% The decrease in overall clicks is likely driven by the decrease of impressions. Of the impressions displayed however, there seems to be more audience engagement.
Conversions/Click 75%
Again, although overall impressions and clicks went down, the rate of conversions to clicks went up substantially. This suggests that displaying ads on quality inventory reaches a more qualified audience.
What works for one advertiser won’t necessarily work for another. You should always test your own campaign. What’s next?: More optimizing, always.

Summary and Conclusion!
5!
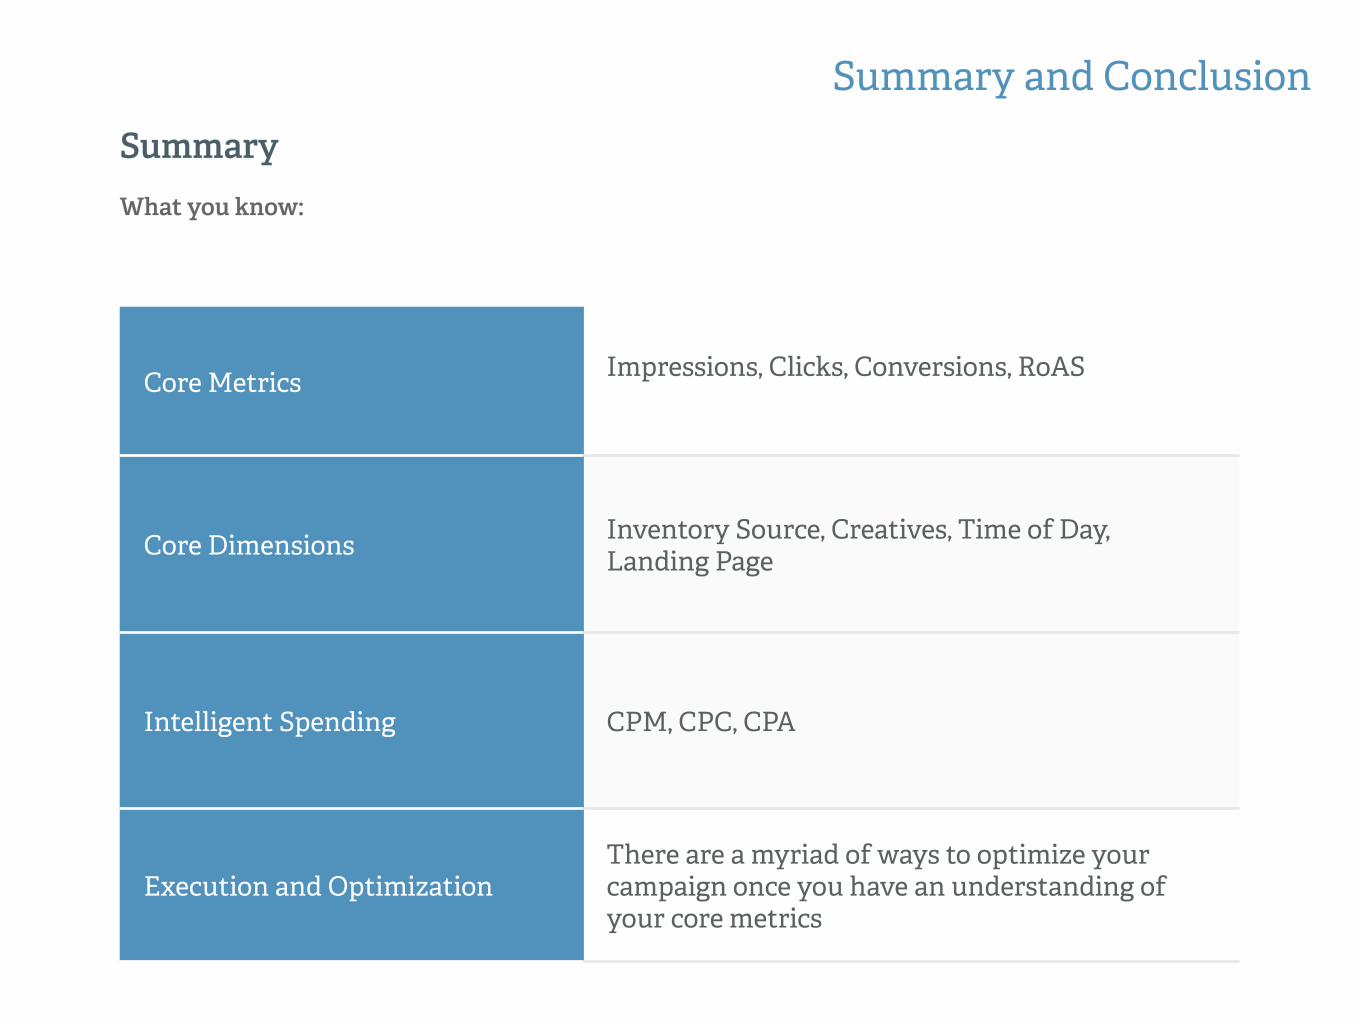
Summary What you know:!
Summary and Conclusion!
Core Metrics" Impressions, Clicks, Conversions, RoAS
Core Dimensions Inventory Source, Creatives, Time of Day, Landing Page
Intelligent Spending CPM, CPC, CPA"
Execution and Optimization There are a myriad of ways to optimize your campaign once you have an understanding of your core metrics"

Conclusion
Main Takeaways
Congratulations! You’re ready to create, manage, and optimize your own display campaigns. Don’t forget that just about anything is possible with RTB, make sure you constantly test, and always be optimizing
Summary and Conclusion!

Questions?!
Arjun Dev Arora Chairman/Founder
ReTargeter
@ArjunDArora [email protected]!
Dan McGaw Director of Marketing
KISSmetrics
@danielmcgaw [email protected]!

Thank You!