
Real time anomaly detection in network tra c time series · Real time anomaly detection in network...
12
Real time anomaly detection in network traffic time series Sergio Mart´ ınez Tagliafico 1 , Gast´ on Garc´ ıa Gonz´ alez 1 , Alicia Fern´ andez 1 , Gabriel G´ omez Sena 1 , and Jos´ e Acu˜ na 1,2 1 Instituto de Ingenier´ ıa El´ ectrica, Facultad de Ingenier´ ıa, Universidad de la Rep´ ublica, Uruguay {sematag,gastong,alicia,ggomez,acuna}@fing.edu.uy 2 Telef´ onica M´ oviles, Uruguay [email protected] Abstract. Anomaly detection is a relevant field of study for many ap- plications and contexts. In this paper we focus in on-line anomaly detec- tion on unidimensional time series provided by different network opera- tor equipments. We have implemented two detection methods, we have optimized them for on-line processing and we have adapted them for in- tegration into a testbed of a well known Hadoop big data platform. We have analyzed the behavior of both methods for the particular datasets available but we also have applied the methods to a publicly available labeled datasets obtaining good results. Keywords: Anomaly Detection · Kalman Filter · Hadoop. 1 Introduction Detecting anomalies in the behavior of multiple variables gathered from the net- work infrastructure is an essential task to be able to detect failures and also to react as soon as possible to solve the issues. Although common monitoring systems can be able to report failures in hardware equipment or software ser- vices, they do not normally provide alarms when the quality of one service is being degraded. Moreover, an efficient anomaly analysis can be useful to detect performance issues, attacks to network security and fraud attempts. Although anomalies analysis in telecommunications traffic is a mature area [2][12][5][3][9] with approaches based on statistical methods [11][8], the emer- gence of big data platforms which enable the processing of massive and diverse data, poses new opportunities and challenges. Particularly the development of analytics for platforms that solve the detection of anomalies of large volumes of data simultaneously is a important issue [1][4][13] and determines the need of adapting the algorithms implementations for parallel processing. All the variables considered in this work have some kind of periodic behavior so our methods will provide a prediction based on the statistical of the past samples of the variable. Also a decision process is needed to signal which samples should be considered as anomalies. As stated, the ability to detect anomalies in
Transcript of Real time anomaly detection in network tra c time series · Real time anomaly detection in network...

Real time anomaly detection in network traffictime series
Sergio Martınez Tagliafico1, Gaston Garcıa Gonzalez1, Alicia Fernandez1,Gabriel Gomez Sena1, and Jose Acuna1,2
1 Instituto de Ingenierıa Electrica, Facultad de Ingenierıa,Universidad de la Republica, Uruguay
{sematag,gastong,alicia,ggomez,acuna}@fing.edu.uy2 Telefonica Moviles, [email protected]
Abstract. Anomaly detection is a relevant field of study for many ap-plications and contexts. In this paper we focus in on-line anomaly detec-tion on unidimensional time series provided by different network opera-tor equipments. We have implemented two detection methods, we haveoptimized them for on-line processing and we have adapted them for in-tegration into a testbed of a well known Hadoop big data platform. Wehave analyzed the behavior of both methods for the particular datasetsavailable but we also have applied the methods to a publicly availablelabeled datasets obtaining good results.
Keywords: Anomaly Detection · Kalman Filter · Hadoop.
1 Introduction
Detecting anomalies in the behavior of multiple variables gathered from the net-work infrastructure is an essential task to be able to detect failures and alsoto react as soon as possible to solve the issues. Although common monitoringsystems can be able to report failures in hardware equipment or software ser-vices, they do not normally provide alarms when the quality of one service isbeing degraded. Moreover, an efficient anomaly analysis can be useful to detectperformance issues, attacks to network security and fraud attempts.
Although anomalies analysis in telecommunications traffic is a mature area[2][12][5][3][9] with approaches based on statistical methods [11][8], the emer-gence of big data platforms which enable the processing of massive and diversedata, poses new opportunities and challenges. Particularly the development ofanalytics for platforms that solve the detection of anomalies of large volumes ofdata simultaneously is a important issue [1][4][13] and determines the need ofadapting the algorithms implementations for parallel processing.
All the variables considered in this work have some kind of periodic behaviorso our methods will provide a prediction based on the statistical of the pastsamples of the variable. Also a decision process is needed to signal which samplesshould be considered as anomalies. As stated, the ability to detect anomalies in

2 S. Martınez et al.
real time is a value added feature because it enables a fast reaction to reducethe service unavailability or degradation time for the customer.
The main contribution of this work is the development of an anomaly detec-tion strategy based on stochastic modeling and the implementation on a Hadoop3
big data platform testbed. We have also implemented a classification strategybased on Parzen Windows and we have compared both methods. For the vali-dation process we used real data provided by a network operator and we alsotested our method with publicly available labeled datasets.
In this document, we define in Section 2 the relevant types of anomalies forthe specific application field and the proposed methods. In section 3 we depictsome implementation details. In Section 4 we show some selected validationscenarios and finally in Section 5 we conclude and identify some possible futureworks.
2 Strategy for anomaly detection
2.1 Type of anomalies
We can define an “anomaly” as a set of values of a variable that are far from itsnormal or expected values. Therefore, we need to define a region of the featurespace of the data that represents its normal behavior. Any data out of the normalregion, will be consider as an anomaly.
The definition of the normal feature space can be a complex task. In somecases the normal behavior feature space may vary along the time and also it issometimes difficult to have labeled traffic to aid the normal region definition.
Based on [5], anomalies can be classified as:
– Point Anomalies: A single value can be considered as anomalous with respectto the rest of the data.
– Contextual Anomalies: A single value is anomalous in the context of itsneighbors values but in other cases can be considered normal.
– Collective Anomalies: A collection of related data values is anomalous withrespect to the entire data set.
The data used for this work is non labeled unidimensional time series obtainedfrom telecommunication infrastructure, for instance, the interface traffic from arouter. The relevant anomaly types for this scenario are “Point Anomalies” and“Collective Anomalies”. When we find an abnormal change of the series valuerespect to the expected value for that time instant, we will be in presence of apoint anomaly. Besides, we can find that some values have a slight but prolongedwithdrawal in time so as to be considered a collective anomaly.
For this particular context it is also relevant the ability to perform anomalydetection in real time. The scenario is that a monitoring system will producea stream of sample values for the chosen variable. The cadence of the variablesamples will depend on the monitoring system configuration, typically in the
3 http://hadoop.apache.org/

Real time anomaly detection in network traffic time series 3
order of minutes. The detection process will receive a streaming of values andit should produce an indication if an anomaly is detected. It is obvious that thedetection process cannot take longer than the sample interval.
2.2 Point and Collective anomalies: ARIMA+Kalman models
There are a lot of techniques mainly used for anomaly detection in this scenarios[5] and our first approach is to adjust a stochastic model for the time series anddefine an anomaly based on whether an observation is suspicious of not beinggenerated by this model.
Let be yk a time series and Yk = (y1, . . . , yk) the vector of observationswhich represents its evolution up to time k, the detection process used is basedon obtaining the distribution of the series in time k + 1 given its evolution Yk.We will write this distribution as:
p(yk+1|Yk) = p(yk+1|yk, . . . , y1)
In this approach we use ARIMA (Autoregressive Integrated Moving Average)models represented as a state space model [7].
yk = Zxk + εk, {εk} iid ∼ N(0, σ2ε) (1)
xk+1 = Txk +Rηk, {ηk} iid ∼ N(0,Q) (2)
where Z, T and R are fixed matrices. Matrices are represented by bold lettersin our notation.
As every distributions in this model are Gaussian, the distributions p(yk+1|Yk),p(xk|Yk) y p(xk+1|Yk) are also Gaussian. Lets call xk|k = E [xk|Yk], xk+1|k =E [xk+1|Yk], P k|k = Var [xk|Yk] y P k+1|k = Var [xk+1|Yk], then
p(xk|Yk) = N(xk|k,P k|k) (3)
p(xk+1|Yk) = N(xk+1|k,P k+1|k) (4)
p(yk+1|Yk) = N(Zxk+1|k,ZP k+1|kZ′ + σ2
ε) (5)
where xk|k, xk+1|k, Zxk+1|k are minimum variance linear unbiased estimators(MVLUE) of xk, xk+1 and yk+1 respectively given Yk.
The on-line estimation of this distribution can be done by the well knownKalman Filter equations.
ek = yk −Zxk|k−1, Fk = ZP k|k−1Z′ + σ2
ε
xk|k = xk + P k|k−1Z′F−1k ek, P k|k = P k|k−1 − P k|k−1Z
′F−1k ZP k|k−1
xk+1|k = T xk|k−1 +Kkek, P k+1|k = TP k|k−1(T −KkZ)′ +RQkR′
Using this result, we can manage to efficiently update the distributions andthe state as soon as each sample arrives to the system. As can be seen, onlymatrix sum and product are involved. This result will be very important foron-line anomaly detection.

4 S. Martınez et al.
Anomalies definitions The first stage in our anomaly detection process is toidentify an abrupt change of the data values from the expected value for a giventime instant. This condition can be defined as:
Definition (Type A anomalies - Point Anomalies): Let be yk a Gaussianprocess modeling a time series, Yn = (y1, . . . , yn) the set of realizations repre-senting the evolving up to the time instant n and p(yn+1|Yn) = N(mn+1, Pn+1)the conditional distribution of yn+1 given its evolution up to time instant k = n.A point type anomaly occurs at k = n+ 1 if
‖yn+1 −mn+1‖ > r ∗√Pn+1
that means at k = n + 1 the value is more than r standard deviations far fromits expected value.
The second stage is intended to detect an slight but sustained in time shiftfrom the expected series value.
Definition (Type B anomalies - Collective Anomalies): Let be yk a Gaussianprocess modeling a time series, {yn−(l−1), . . . , yn} the last l observations of theseries and p(yk+1|Yk) = N(mk+1, Pk+1) the conditional distribution of yk+1
given its evolution up to the time instant k. A collective anomaly occurs atk = n if
yk −mk <√Pk ∀ k = n− (l − 1) : n
oryk −mk >
√Pk ∀ k = n− (l − 1) : n
2.3 Point anomalies: Parzen windows
The analyzed data has an intrinsic weekly periodicity, so we have chosen theParzen windows method4, to measure how near is a sample from its nearestneighbors.
For that purpose, we began constructing a circular buffer with the accu-mulated samples of the last week indexed by its collected time-stamp. When anew test sample arrives, a cluster of an hour history of samples centered in itstime-stamp is created.
For each value in the cluster, we considered a gauss function with mean valuethe sample and a presetted variance value. The new test sample is then evaluatedwith each of the cluster functions and the accumulated value is compared witha presetted threshold value. If the sum is above the threshold, it means that inthe environment of the current sample there are several samples of the cluster.Otherwise it means that the current sample is far from the values of the clusterand it is labeled as an out-lier. The outliers are discarded for updating thecircular history buffer.
4 Inspired on the density estimation by Parzen windows.[6]

Real time anomaly detection in network traffic time series 5
Method The circular buffer can be represented as W = (xnt , ..., xnt+m), where
the index t indicates the temporal position in the buffer, and the index n indicatesthe week where the sample belongs. At the beginning all the samples of the bufferare from the same week.
When the samples begin to arrive in real time, the current sample xnk is taken
and a cluster wk is generated from the samples of the circular buffer taken halfhour back and half hour forward referring to the time of the current sample.
wk = (xnk−h/2, ...xnk−1, x
n−1k , xn−1k+1 , ..., x
n−1k+h/2)
Then, for each cluster sample, a window function is used, where the value ofthe current sample is evaluated. In this case we will use a gauss function wherethe mean will be the value of the sample and the variance σ will be a presettedparameter.
pk = (N(xnk−h/2, σ), ...N(xnk−1, σ), N(xn−1k , σ), N(xn−1k+1 , σ), ..., N(xn−1k+h/2, σ))
All the values obtained from the evaluated functions are added and the resultis compared with a threshold value U . If the sum is above the threshold it meansthat in the environment of the current sample there are several samples of thecluster nearby. Otherwise it means that the current sample is very far from thevalues of the cluster, then it is labeled as out-lier. The outliers are discardedwhen updating the circular buffer.
k+h/2∑i=k−h/2
pki(xnk ) < U. (6)
3 Implementation highlights
The implementation was done in Python and has been integrated into a Hor-tonworks HDP5 platform testbed. The on-line data ingestion was done throughApache NiFi and Apache Kafka and then the data processing was done runningthe python code with pySpark. The implemented software was thought witha modular architectural design in mind so as to enable an easy change of thedetection algorithms.
For the modeling phase, we use the module statsmodels.tsa.statespace6
and particularly the class statsmodels.tsa.statespace.sarimax.SARIMAX, whichallow modeling by ARIMA space state models.
The anomaly detection algorithm is implemented in the module anomaliasKF7.The two main components of the anomaly detection process for real time detec-tion are implemented in the class AnomalyDetector.py helped with the pykalman8
module for the Kalman Filter equations.
5 https://hortonworks.com/products/data-platforms/hdp/6 (http://www.statsmodels.org/dev/statespace.html)7 https://iie.fing.edu.uy/ sematag/anomalias/8 https://pykalman.github.io/

6 S. Martınez et al.
4 Experiments and results
4.1 Dataset characterization
The available time series for evaluating the proposed methods come from ourpartner, a mobile operator in Uruguay. Table 1 show the main characteristicsof the series and figure 1 illustrate the general behavior of each one. For eachseries, we use the data of the first days to adjust the stochastic model and therest of the data was used to test the method.
Series Name Sample frequency Duration Train set
1 Mobile Data Downlink Bytes 1 sample each 5 minutes 28 days First 7 days
2 Voice Calls Originated 1 sample each 1 hour 28 days First 7 days
3 Accounting Mobile Data 1 sample each 5 minutes 18 days First 4 days
4 SMS Originated 1 sample each 5 minutes 28 days First 7 days
Table 1: Time series used for validation
(a) Mobile data download(b) Voice calls
(c) Accounting(d) Originated SMSs
Fig. 1: Global view of the time series analyzed
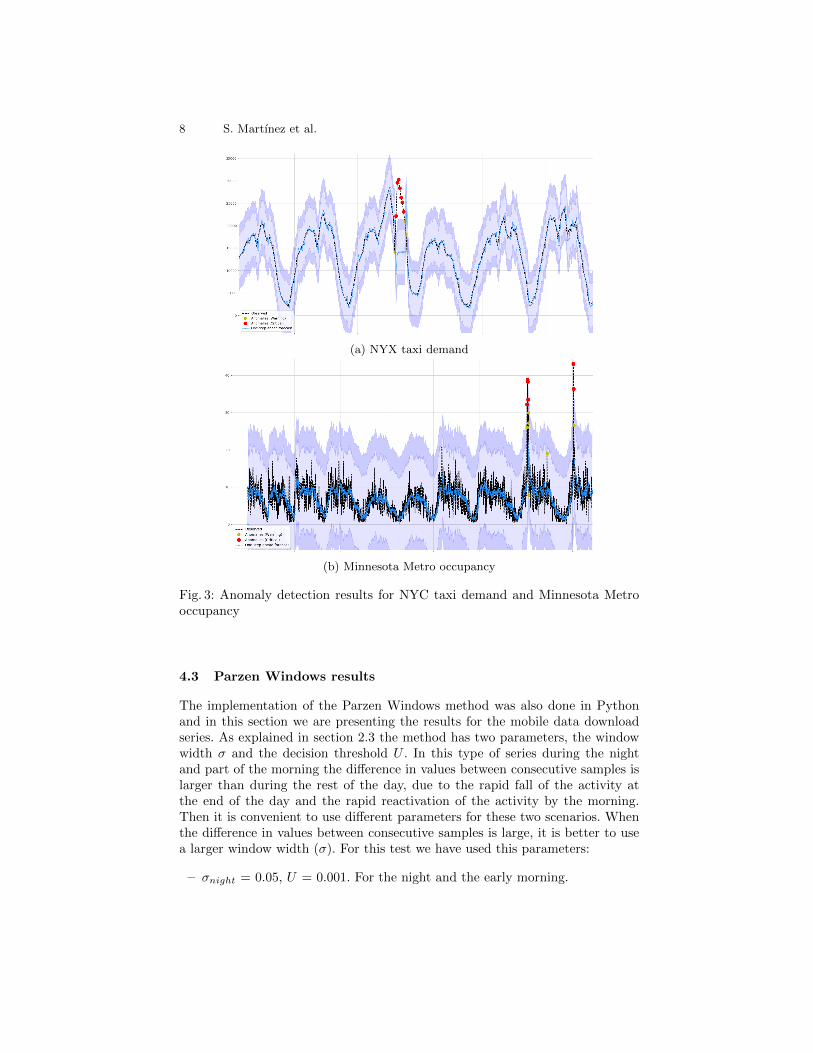
Among the referred real datasets and to improve the evaluation of the pro-posed strategy in other types of time series, we have tested our approach intwo time series from the Numenta Anomaly Benchmark (NAB)[10]: the hourlydemand for New York City taxis and the real time traffic data (occupancy) fromthe Twin Cities Metro area in Minnesota.

Real time anomaly detection in network traffic time series 7
4.2 ARIMA+Kalman results
The proposed approach was applied to detect anomalies for the four time seriesreferred in Table 1. Figure 2 shows some anomalies (in red) detected on theseries. In all cases anomalies were detected in zones where the series have anobvious abnormal behavior. Moreover, no relevant false alarms were generated,only some cases were generated immediately after a true anomaly was detectedas shown in figure 2b.
(a) Voice
(b) Mobile data download
Fig. 2: Anomaly detection results for Mobile data download and Voice data
We have obtained similar results for the NAB time series, as can be seen infigure 3. In all cases, low false alarms were generated and labeled anomalies werecompletely detected. Also good performance is achieved for others NAB timeseries.
8 S. Martınez et al.
(a) NYX taxi demand
(b) Minnesota Metro occupancy
Fig. 3: Anomaly detection results for NYC taxi demand and Minnesota Metrooccupancy
4.3 Parzen Windows results
The implementation of the Parzen Windows method was also done in Pythonand in this section we are presenting the results for the mobile data downloadseries. As explained in section 2.3 the method has two parameters, the windowwidth σ and the decision threshold U . In this type of series during the nightand part of the morning the difference in values between consecutive samples islarger than during the rest of the day, due to the rapid fall of the activity atthe end of the day and the rapid reactivation of the activity by the morning.Then it is convenient to use different parameters for these two scenarios. Whenthe difference in values between consecutive samples is large, it is better to usea larger window width (σ). For this test we have used this parameters:
– σnight = 0.05, U = 0.001. For the night and the early morning.

Real time anomaly detection in network traffic time series 9
– σday = 0.01, U = 0.001. For the rest of the day.
(a) Parzen method applied to mobile data download. Parameters: σnight =0.05, σday = 0.01 and U = 0.001.
(b) Parzen method applied to mobile data download with a wider window.Parameters: σnight = 0.07, σday = 0.03 and U = 0.001.
Fig. 4: Anomaly detection results for mobile data download
As shown in Figure 4a the outliers (in red), correspond to the detected pointtype anomalies. The parameters were adjusted until an acceptable result wasobtained. In Figure 4b the effect of a wider window is shown (σnight = 0.07, andσday = 0.03).
As can be seen, the amount of red samples decreased because the model ismore tolerant when the window width increases.
Another way to visualize the data is the one shown in Figure 5b. This repre-sentation is quite helpful to find anomalies at a glance and to depict the weeklyevolution of the series.
Figure 5a shows a series corresponding to one month of data collected andclassified. In figure 5b you can see the same series represented as the flower. An

10 S. Martınez et al.
(a) Series corresponding to one month of data.
(b) The same series represented in a flower of a week.
Fig. 5: Flower representation
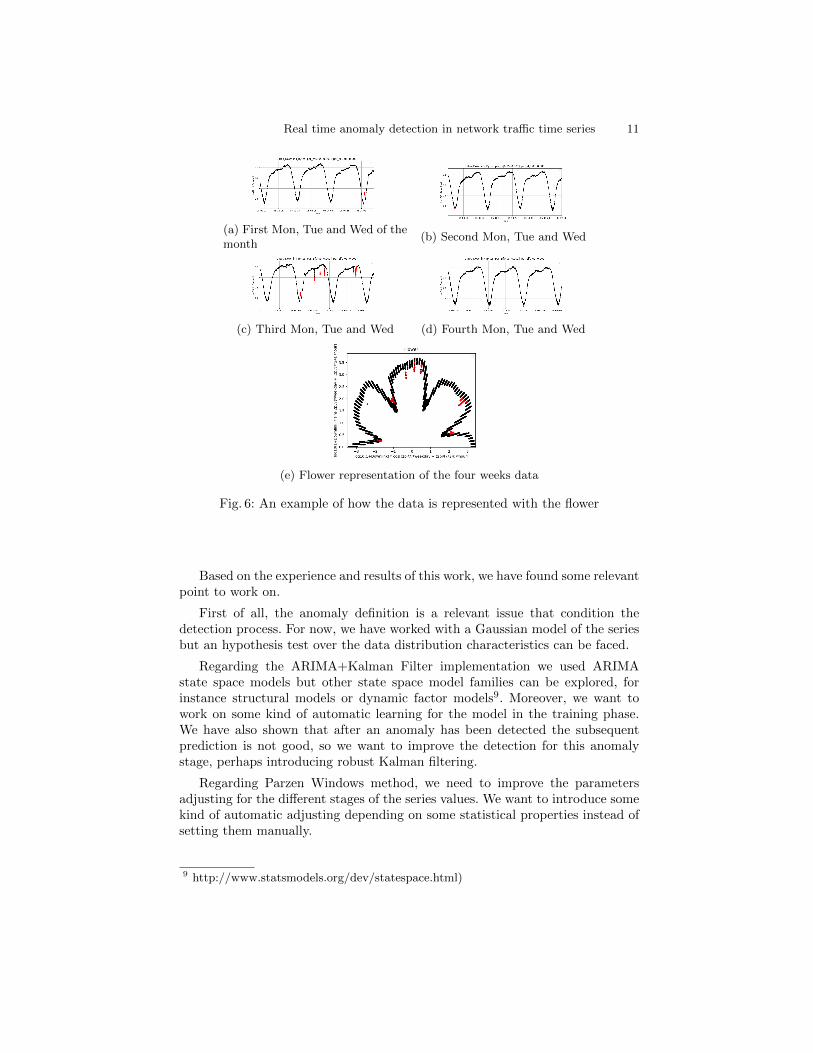
entire turn of the flower represents a week’s time, in figure 5b are the four weekscorresponding to the month of figure 5a. In figure 6 shows an example for threeday of the week.
5 Conclusions and future work
We have implemented an algorithm for real time anomaly detection using ARIMAmodels and Kalman filtering, obtaining good performance results for our oper-ator partner time series. Both point an contextual anomalies can be detected.The approach was also tested with publicly available labeled time series showinggood results. The use of Kalman filtering enable us the use of the algorithm forreal time anomalies detection.
We have also implemented a Parzen Windows oriented method for pointanomalies which is simple and requires very few calculation resources. We havealso obtained interesting detection results.
Both methods were implemented and integrated as a module into a hadoopplatform sandbox, enabling the later integration to the operator production sys-tems.
Real time anomaly detection in network traffic time series 11
(a) First Mon, Tue and Wed of themonth
(b) Second Mon, Tue and Wed
(c) Third Mon, Tue and Wed (d) Fourth Mon, Tue and Wed
(e) Flower representation of the four weeks data
Fig. 6: An example of how the data is represented with the flower
Based on the experience and results of this work, we have found some relevantpoint to work on.
First of all, the anomaly definition is a relevant issue that condition thedetection process. For now, we have worked with a Gaussian model of the seriesbut an hypothesis test over the data distribution characteristics can be faced.
Regarding the ARIMA+Kalman Filter implementation we used ARIMAstate space models but other state space model families can be explored, forinstance structural models or dynamic factor models9. Moreover, we want towork on some kind of automatic learning for the model in the training phase.We have also shown that after an anomaly has been detected the subsequentprediction is not good, so we want to improve the detection for this anomalystage, perhaps introducing robust Kalman filtering.
Regarding Parzen Windows method, we need to improve the parametersadjusting for the different stages of the series values. We want to introduce somekind of automatic adjusting depending on some statistical properties instead ofsetting them manually.
9 http://www.statsmodels.org/dev/statespace.html)
12 S. Martınez et al.
Acknowledgements
This work was partially supported by Telefonica Moviles (Uruguay) and theGroups Program of the Comision Sectorial de Investigacion Cientıfica, Univer-sidad de la Republica (Uruguay). The authors are thankful to both institutions.
The authors would like to thank Pedro Casas for its good advice at thebeginning of the project.
References
1. Bar, A., Finamore, A., Casas, P., Golab, L., Mellia, M.: Large-scale network trafficmonitoring with dbstream, a system for rolling big data analysis. In: Big Data (BigData), 2014 IEEE International Conference on. pp. 165–170. IEEE (2014)
2. Bhuyan, M.H., Bhattacharyya, D.K., Kalita, J.K.: Network Anomaly Detec-tion: Methods, Systems and Tools. IEEE Communications Surveys & Tutorials16(1), 303–336 (FebJan 2014). https://doi.org/10.1109/surv.2013.052213.00046,http://dx.doi.org/10.1109/surv.2013.052213.00046
3. Brutlag, J.D.: Aberrant behavior detection in time series for network monitoring.In: LISA. vol. 14, pp. 139–146 (2000)
4. Casas, P., Soro, F., Vanerio, J., Settanni, G., D’Alconzo, A.: Network security andanomaly detection with big-dama, a big data analytics framework (2017)
5. Chandola, V., Banerjee, A., Kumar, V.: Anomaly detection: A survey. ACM Com-put. Surv. 41(3), 15:1–15:58 (Jul 2009). https://doi.org/10.1145/1541880.1541882,http://doi.acm.org/10.1145/1541880.1541882
6. Duda, R.O., Hart, P.E., Stork, D.G.: Pattern Classification. Wiley-Interscience,second edition edn. (2000)
7. Durbin, J., Koopman, S.J.: Time series analysis by state space methods, vol. 38.Oxford University Press (2012)
8. Knorn, F., Leith, D.J.: Adaptive kalman filtering for anomaly detection in softwareappliances. In: INFOCOM Workshops 2008, IEEE. pp. 1–6. IEEE (2008)
9. Lakhina, A., Crovella, M., Diot, C.: Diagnosing network-wide traffic anomalies. In:ACM SIGCOMM Computer Communication Review. vol. 34, pp. 219–230. ACM(2004)
10. Lavin, A., Ahmad, S.: Evaluating real-time anomaly detection algorithms–the nu-menta anomaly benchmark. In: Machine Learning and Applications (ICMLA), 2015IEEE 14th International Conference on. pp. 38–44. IEEE (2015)
11. Mazel, J., Casas, P., Labit, Y., Owezarski, P.: Sub-space clustering, inter-clusteringresults association & anomaly correlation for unsupervised network anomaly de-tection. In: Proceedings of the 7th International Conference on Network and Ser-vices Management. pp. 73–80. International Federation for Information Processing(2011)
12. Soule, A., Salamatian, K., Taft, N.: Combining filtering and statistical methodsfor anomaly detection. In: Proceedings of the 5th ACM SIGCOMM Conference onInternet Measurement. pp. 31–31. IMC ’05, USENIX Association, Berkeley, CA,USA (2005), http://dl.acm.org/citation.cfm?id=1251086.1251117
13. Vanerio, J., Casas, P.: Ensemble-learning approaches for network security andanomaly detection. In: Proceedings of the Workshop on Big Data Analytics andMachine Learning for Data Communication Networks. pp. 1–6. ACM (2017)