Real-Time Analysis of Exhaled Breath via Resonance-Enhanced Multiphoton Ionization-Mass Spectrometry...
6
Real-Time Analysis of Exhaled Breath via Resonance-Enhanced Multiphoton Ionization-Mass Spectrometry with a Medium Pressure Laser Ionization Source: Observed Nitric Oxide Profile LUKE CHANDLER SHORT,* RU ¨ DIGER FREY, and THORSTEN BENTER Bergische Universita ¨t Wuppertal, Fachbereich C—Mathematik und Naturwissenschaften, Gaußstr. 20, D-42119 Wuppertal, Germany (L.C.S., T.B.); and Bruker Daltonic, GmbH, Fahrenheitstr. 4, 28359 Bremen, Germany (R.F.) An elevated concentration of nitric oxide (NO) in alveolar ventilation is indicative of inflammatory stress within the lung. We present here the first description of time-resolved measurement of NO in breath using photoionization mass spectrometry, providing new capabilities for the medical investigator, such as isotopic tracing. Here we use resonance- enhanced multiphoton ionization (REMPI) with time-of-flight mass spectrometry (TOF-MS) coupled with a medium pressure laser ionization (MPLI) source for the selective detection of NO in breath. To demonstrate this technology, a single male subject breathes NO-free air for several minutes, and then the exhaled breath is monitored. The ability of REMPI to differentiate among three different isotopomers of NO is demonstrated, and then the concentration profile of NO in exhaled breath is measured. A similar time-dependence concentration is found as observed by previous techniques. The advantages of this approach compared to other techniques are: (1) parts-per-billion by volume (ppbV) mixing ratios of NO can be measured on a sub-second time scale, (2) since the technique operates optically as well as mass-resolved, isotopomers of NO are discernable, permitting the use of isotopic tracing, and (3) other biologically significant gas molecules can be measured via REMPI. Index Headings: Breath analysis; Inflammation; Resonance-enhanced multiphoton ionization; Mass spectrometry; REMPI-MS; NO; Nitric oxide. INTRODUCTION Analysis of breath for specific trace gases or profiles of multiple gas molecules is a promising new diagnostic technique for certain health conditions, including lung cancer, 1,2 breast cancer, 3 ulcerative colitis, 4 and oxidative stress in the lung. 5,6 In addition, breath analysis is minimally or noninvasive, ideally suited to patients sensitive to more invasive techniques, e.g., pediatric patients. Breath analysis can be broadly divided into techniques that first collect samples for an analysis at a later time, i.e., off-line, and techniques that monitor the breath in real time, i.e., on-line. The off-line analysis of volatile organic compounds in breath has been shown to be a promising tool for the investigation of lung cancer. 7 On-line techniques have been used to monitor breath with sub-second resolution, permitting the measurement of exhaled nitric oxide (NO), an indicator of pulmonary in- flammation. 8 These on-line techniques are of particular interest for the diagnosis and monitoring of lung inflammation, because the part of the breath originating from the lower lung can be monitored separate from the bulk of the air within a single breath. In the field of atmospheric chemistry, on-line monitoring of NO has seen considerable success with numerous techniques, and these techniques have been successfully applied to medical diagnosis. Due to its biological significance, NO remains an ideal molecule to demonstrate the application of new atmospheric techniques to the field of medicine. Within the human body, NO behaves as a secondary messenger molecule involved in the inflammation response. 9 One biosynthetic source for NO is from epithelial cells from L- arginine by the enzyme NO synthase. Once generated, NO travels to the surrounding tissues, triggering the relaxation of capillary muscles, resulting in an increase in blood flow to damaged or irritated tissues. 10 In the cellular environment, NO is oxidized to nitrite; however, in the presence of the enzymes oxyhemoglobin or oxymyoglobin, NO is oxidized to ni- trate. 11,12 These higher oxidized species have less of a vaso- dilatory effect, 12 resulting in a gradual decrease of vasodilation around the site of infection or inflammation. Production of excess NO from the human epithelial tissue is consequently used as an indication of inflammation and infection. 13 The use of 15 N 16 O as an isotopic tracer (dominant natural isotope is 14 N 16 O) from metabolized L-[guanidino- 15 N 2 ]argi- nine has been shown to be effective in monitoring certain physiological and pathophysiological processes. 14,15 Measure- ment of biosynthetic 15 N 16 O in breath has been measured using an off-line sampling technique, i.e., it lacks temporal resolution and thus cannot distinguish between the alveolar and dead- space portion of each breath. 16 Since a rapid equilibrium exists between the liquid-phase concentration of NO within the capillary bed of the lung and the gas-phase concentration in the air above the epithelial tissue, a sample of exhaled air is an accurate and timely indicator of NO production from the capillary bed. During the inhalation and rest phases of breathing, the concentration of NO accumulates within the airway dead space. As one exhales, first the gas from the mouth is removed, then the trachea, followed by that of the lung. This concentration profile, specifically the concentration of NO during the last phase of breathing, i.e., alveolar air, is used to determine the severity of inflammation in the lung. Not all parts within the respiratory system produce the same amount of NO. It is highest in the nasopharynx and decreases as one moves further into the lung. Several studies have suggested that the high concentration of NO in the upper respiratory system is due to both the antimicrobial properties of NO, 9 as well as the ability of NO to facilitate oxygen uptake. 17 Within the paranasal sinuses the mixing ratio of NO can be up to approximately 1 part per million by volume (ppmV), 17,18 while the mixing ratio of NO originating from the lung (orally sampled breath) ranges from a few parts-per-billion by volume (ppbV) to 50 ppbV. 13,19 Given that the concentration of NO resulting from production in the lung can be up to a thousand- Received 10 July 2005; accepted 8 December 2005. * Author to whom correspondence should be sent. E-mail: lcshort@ uni-wuppertal.de or [email protected]. Volume 60, Number 2, 2006 APPLIED SPECTROSCOPY 217 0003-7028/06/6002-0217$2.00/0 Ó 2006 Society for Applied Spectroscopy
Transcript of Real-Time Analysis of Exhaled Breath via Resonance-Enhanced Multiphoton Ionization-Mass Spectrometry...

Real-Time Analysis of Exhaled Breath via Resonance-EnhancedMultiphoton Ionization-Mass Spectrometry with a MediumPressure Laser Ionization Source: Observed Nitric Oxide Profile
LUKE CHANDLER SHORT,* RUDIGER FREY, and THORSTEN BENTERBergische Universitat Wuppertal, Fachbereich C—Mathematik und Naturwissenschaften, Gaußstr. 20, D-42119 Wuppertal, Germany (L.C.S.,T.B.); and Bruker Daltonic, GmbH, Fahrenheitstr. 4, 28359 Bremen, Germany (R.F.)
An elevated concentration of nitric oxide (NO) in alveolar ventilation is
indicative of inflammatory stress within the lung. We present here the first
description of time-resolved measurement of NO in breath using
photoionization mass spectrometry, providing new capabilities for the
medical investigator, such as isotopic tracing. Here we use resonance-
enhanced multiphoton ionization (REMPI) with time-of-flight mass
spectrometry (TOF-MS) coupled with a medium pressure laser ionization
(MPLI) source for the selective detection of NO in breath. To demonstrate
this technology, a single male subject breathes NO-free air for several
minutes, and then the exhaled breath is monitored. The ability of REMPI
to differentiate among three different isotopomers of NO is demonstrated,
and then the concentration profile of NO in exhaled breath is measured. A
similar time-dependence concentration is found as observed by previous
techniques. The advantages of this approach compared to other
techniques are: (1) parts-per-billion by volume (ppbV) mixing ratios of
NO can be measured on a sub-second time scale, (2) since the technique
operates optically as well as mass-resolved, isotopomers of NO are
discernable, permitting the use of isotopic tracing, and (3) other
biologically significant gas molecules can be measured via REMPI.
Index Headings: Breath analysis; Inflammation; Resonance-enhanced
multiphoton ionization; Mass spectrometry; REMPI-MS; NO; Nitric oxide.
INTRODUCTION
Analysis of breath for specific trace gases or profiles ofmultiple gas molecules is a promising new diagnostictechnique for certain health conditions, including lungcancer,1,2 breast cancer,3 ulcerative colitis,4 and oxidativestress in the lung.5,6 In addition, breath analysis is minimally ornoninvasive, ideally suited to patients sensitive to moreinvasive techniques, e.g., pediatric patients. Breath analysiscan be broadly divided into techniques that first collect samplesfor an analysis at a later time, i.e., off-line, and techniques thatmonitor the breath in real time, i.e., on-line. The off-lineanalysis of volatile organic compounds in breath has beenshown to be a promising tool for the investigation of lungcancer.7 On-line techniques have been used to monitor breathwith sub-second resolution, permitting the measurement ofexhaled nitric oxide (NO), an indicator of pulmonary in-flammation.8 These on-line techniques are of particular interestfor the diagnosis and monitoring of lung inflammation, becausethe part of the breath originating from the lower lung can bemonitored separate from the bulk of the air within a singlebreath. In the field of atmospheric chemistry, on-linemonitoring of NO has seen considerable success withnumerous techniques, and these techniques have beensuccessfully applied to medical diagnosis. Due to its biological
significance, NO remains an ideal molecule to demonstrate theapplication of new atmospheric techniques to the field ofmedicine.
Within the human body, NO behaves as a secondarymessenger molecule involved in the inflammation response.9
One biosynthetic source for NO is from epithelial cells from L-arginine by the enzyme NO synthase. Once generated, NOtravels to the surrounding tissues, triggering the relaxation ofcapillary muscles, resulting in an increase in blood flow todamaged or irritated tissues.10 In the cellular environment, NOis oxidized to nitrite; however, in the presence of the enzymesoxyhemoglobin or oxymyoglobin, NO is oxidized to ni-trate.11,12 These higher oxidized species have less of a vaso-dilatory effect,12 resulting in a gradual decrease of vasodilationaround the site of infection or inflammation. Production ofexcess NO from the human epithelial tissue is consequentlyused as an indication of inflammation and infection.13
The use of 15N16O as an isotopic tracer (dominant naturalisotope is 14N16O) from metabolized L-[guanidino-15N2]argi-nine has been shown to be effective in monitoring certainphysiological and pathophysiological processes.14,15 Measure-ment of biosynthetic 15N16O in breath has been measured usingan off-line sampling technique, i.e., it lacks temporal resolutionand thus cannot distinguish between the alveolar and dead-space portion of each breath.16
Since a rapid equilibrium exists between the liquid-phaseconcentration of NO within the capillary bed of the lung andthe gas-phase concentration in the air above the epithelialtissue, a sample of exhaled air is an accurate and timelyindicator of NO production from the capillary bed. During theinhalation and rest phases of breathing, the concentration ofNO accumulates within the airway dead space. As one exhales,first the gas from the mouth is removed, then the trachea,followed by that of the lung. This concentration profile,specifically the concentration of NO during the last phase ofbreathing, i.e., alveolar air, is used to determine the severity ofinflammation in the lung.
Not all parts within the respiratory system produce the sameamount of NO. It is highest in the nasopharynx and decreasesas one moves further into the lung. Several studies havesuggested that the high concentration of NO in the upperrespiratory system is due to both the antimicrobial properties ofNO,9 as well as the ability of NO to facilitate oxygen uptake.17
Within the paranasal sinuses the mixing ratio of NO can be upto approximately 1 part per million by volume (ppmV),17,18
while the mixing ratio of NO originating from the lung (orallysampled breath) ranges from a few parts-per-billion by volume(ppbV) to 50 ppbV.13,19 Given that the concentration of NOresulting from production in the lung can be up to a thousand-
Received 10 July 2005; accepted 8 December 2005.* Author to whom correspondence should be sent. E-mail: [email protected] or [email protected].
Volume 60, Number 2, 2006 APPLIED SPECTROSCOPY 2170003-7028/06/6002-0217$2.00/0
� 2006 Society for Applied Spectroscopy
fold smaller than that produced in the nasal cavities, care mustbe taken to seal the nasal cavities during oral sampling.
EXPERIMENTAL
Analytical Techniques for Measuring Gas-Phase NitricOxide. The large number of analytical techniques previouslydeveloped reflects the importance of accurate, in situ measure-ments of NO in the gas phase. These techniques includeinfrared (IR) and ultraviolet visible (UV/VIS) absorption,20
fluorescence,21 and laser magnetic resonance (LMRS)19
spectroscopies, as well as chemiluminescence.20,22–24 Achallenge to some of these detection techniques is the limitedcapability of absolute determination and quantification of NOin the presence of other nitrogen oxides, while others do nothave appropriate detection limits when taking a time-resolvedsample.
Spectroscopic techniques used to measure NO rely upon theabsorption of light at a particular wavelength,20 as described bythe Beer–Lambert law. At room temperature, analytes withadjacent absorption bands often obscure molecular identity andquantification. Also, for sensitive detection in the gas phase,long absorption paths are necessary, and thus require consider-able space. Laser-induced fluorescence (LIF) is a technique thatmeasures NO by collecting fluorescence light after suitableexcitation of molecular states. An example LIF scheme for NOis the excitation of ground-state NO to the electronicallyexcited A 2Rþ state, and then the monitoring of fluorescencelight after state relaxation.25 The LMRS technique19 measureslight absorption by a paramagnetic molecule, e.g., NO, asa strong magnetic field is varied. As the magnetic field isswitched on, degenerate states split (Zeeman effect), resultingin a change in the absorption at a particular wavelength. Thiseffect and the resulting absorption bands are significantlysimplified for molecules with a single unpaired electron, i.e.,radical species. Molecules such as NO radicals are thus ideallysuited for this technique. Although LMRS has an appropriatedetection limit, often below ppbV, one significant drawback isthat it can only measure paramagnetic molecules. Also, thesetup requires a bulky magnet to produce a sufficiently strongmagnetic field.
A powerful chemical technique available to measure NO ischemiluminescence,23,26 which has been shown to work well atmeasuring NO in human breath.27 Sampled NO is titrated withozone, resulting in electronically excited nitrogen dioxide(NO2*) and oxygen. This NO2* subsequently relaxes toproduce a photon (590 to 2800 nm) that can be efficientlymeasured using a photomultiplier tube. Although this tech-nique has both good temporal resolution and sensitivity (parts-per-trillion by volume, pptV), it can only be used to measurenitrogen oxides.
Photoionization Mass Spectrometry. In addition to theoptical and chemical techniques that measure NO in air,another approach to gas analysis is mass spectrometry. Oftenthis technique relies on the nonselective ionization ofmolecules within a sample, requiring the addition of a mass-selective device for selectivity. One example is single photonionization (SPI) using vacuum ultraviolet light (VUV)generated either from a lamp or a laser source for ionization.A similar nonselective approach is multiphoton ionization(MPI), which uses intense laser radiation to ‘‘pump’’ moleculesinto the ionization region. Under high photon flux conditions,nonspecific or virtual states are created, leading to ionization
after subsequent multiple photon absorption. The lifetime ofthese virtual states are on the order of the oscillation time of thephoton (;10�15 s). However, due to the required high photonflux (approximately GW cm�2), fragmentation and thus loss ofthe parent ion is a difficulty for this approach.
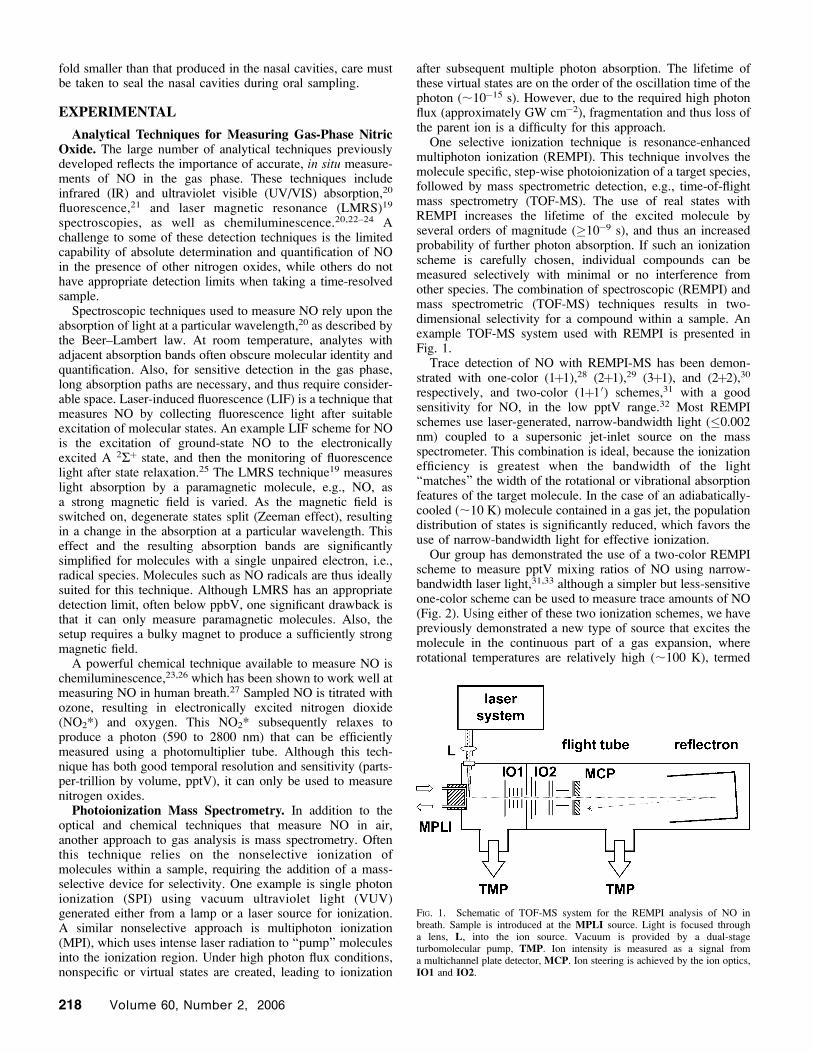
One selective ionization technique is resonance-enhancedmultiphoton ionization (REMPI). This technique involves themolecule specific, step-wise photoionization of a target species,followed by mass spectrometric detection, e.g., time-of-flightmass spectrometry (TOF-MS). The use of real states withREMPI increases the lifetime of the excited molecule byseveral orders of magnitude (�10�9 s), and thus an increasedprobability of further photon absorption. If such an ionizationscheme is carefully chosen, individual compounds can bemeasured selectively with minimal or no interference fromother species. The combination of spectroscopic (REMPI) andmass spectrometric (TOF-MS) techniques results in two-dimensional selectivity for a compound within a sample. Anexample TOF-MS system used with REMPI is presented inFig. 1.
Trace detection of NO with REMPI-MS has been demon-strated with one-color (1þ1),28 (2þ1),29 (3þ1), and (2þ2),30
respectively, and two-color (1þ10) schemes,31 with a goodsensitivity for NO, in the low pptV range.32 Most REMPIschemes use laser-generated, narrow-bandwidth light (�0.002nm) coupled to a supersonic jet-inlet source on the massspectrometer. This combination is ideal, because the ionizationefficiency is greatest when the bandwidth of the light‘‘matches’’ the width of the rotational or vibrational absorptionfeatures of the target molecule. In the case of an adiabatically-cooled (;10 K) molecule contained in a gas jet, the populationdistribution of states is significantly reduced, which favors theuse of narrow-bandwidth light for effective ionization.
Our group has demonstrated the use of a two-color REMPIscheme to measure pptV mixing ratios of NO using narrow-bandwidth laser light,31,33 although a simpler but less-sensitiveone-color scheme can be used to measure trace amounts of NO(Fig. 2). Using either of these two ionization schemes, we havepreviously demonstrated a new type of source that excites themolecule in the continuous part of a gas expansion, whererotational temperatures are relatively high (;100 K), termed
FIG. 1. Schematic of TOF-MS system for the REMPI analysis of NO inbreath. Sample is introduced at the MPLI source. Light is focused througha lens, L, into the ion source. Vacuum is provided by a dual-stageturbomolecular pump, TMP. Ion intensity is measured as a signal froma multichannel plate detector, MCP. Ion steering is achieved by the ion optics,IO1 and IO2.
218 Volume 60, Number 2, 2006

medium pressure laser ionization (MPLI). Since the distribu-tion of states is relatively broad for MPLI, this source is bestmatched to a broad-bandwidth laser light source.32
The spectroscopic resolution of isotopomers of NO,however, requires a narrow-bandwidth light source. Therefore,for this study we use the MPLI source for sample introduction,followed by narrow-bandwidth REMPI of NO.
Medium Pressure Laser Ionization Source. TraditionalREMPI sampling techniques lack sufficient time-resolution andsensitivity to monitor trace gases in dynamic processes. Ourdevelopment of the MPLI source (Fig. 3, right) has permittedboth a real-time (sub-second) and more sensitive analysis thanwith previous jet-sources.32 The primary concern when de-veloping MPLI was to establish detection limits in the relevantppmV to sub-ppbV range (depending on required temporalresolution), while simultaneously providing the ability tosample directly from ambient pressure. The typical samplingfrequency of the MPLI system is up to 200 Hz, limited only bythe maximum repetition rate of the laser system.
The pulsed operation of the MPLI source favors the use ofa pulsed mass analyzer; as a result, TOF-MS instruments havebeen frequently used as mass selective devices.34–36 Inaddition, these instruments have the multi-channel advantage,i.e., a complete mass spectrum is acquired for each ionizationevent. Further, TOF-MS analyzers are relatively rugged, simplein design, and do not require the ultra-low vacuum conditionscommon to other mass spectrometric techniques.37
Photoionization of some Biologically Significant Mole-cules. An extensive amount of literature is available on themass spectrometric detection of compounds using narrow-bandwidth multiphoton ionization. A few selected examples ofbiologically relevant species that can be measured are: (1)inorganic, e.g., carbon monoxide,38 NO,31,32,38 NO2,31,32,39,40
carbon monoxide,41 and oxygen;42 (2) organic, e.g., acetalde-hyde,43–45 acetone,46,47 ammonia,48 butadiene,49 iso-butanal,50
formaldehyde51,52 and propanal;53,54 and (3) aromatics, e.g.,benzene,55 naphthalene,38 and toluene.38 While these techni-ques are often presented as being strictly molecule-specific, it isoften possible to detect several different molecules indepen-dently using the same setup. Furthermore, a similar photoion-ization scheme can often be used with structurally similaranalytes, as is the case with many aromatic molecules, and thenmass resolution is relied upon for analyte selectivity.
Resonance-Enhanced Multiphoton Ionization of NitricOxide. The REMPI scheme that we have chosen for themeasurement of NO in sampled breath is presented in Eqs. 1and 3, while Eqs. 1 and 2 are used to demonstrate the ability ofREMPI to differentiate among the isotopomers of NO.31 Forboth ionization schemes, the target molecule in the groundstate, NO (X 2P), first absorbs light at ;226 nm, leading topopulation of the A 2Rþ state:
NOðX 2PÞ!hv1ðk ; 226nmÞNOðA 2RþÞ ð1Þ
and then either a second photon of ;226 nm is absorbed by theexcited molecule, leading to ionization (see Fig. 2, right),
NOðA 2RþÞ!hv1ðk ; 226nmÞNOþ þ e� ð2Þ
or when 308 nm light is present,
NOðA 2RþÞ!hv2ðk ¼308nmÞNOþ þ e� ð3Þ
The ionization cross-section for NO (A 2Rþ) is considerablygreater at 308 nm than at ;226 nm, so that Eqs. 1 and 3 will bethe most likely ionization scheme when 308 nm light ispresent.32 As the two-color REMPI scheme consisting of Eqs.1 and 3 results in the more sensitive detection of NO, the breathanalysis results are performed with this ionization scheme. It isworth noting that Eqs. 1 and 2 will still result in the selectiveionization of NO, and since only one light source is required,the overall setup is both smaller and simpler to operate.
One important feature of using this particular REMPI schemefor the analysis of NO in breath is that there are sharp absorptionlines for NO in this wavelength range of 226.0 nm to 226.3 nm,whereas the absorption cross-section of other molecules presentin breath are either comparatively small or not well defined.Thus, the ionization of these matrix molecules is limited ornonexistent, improving the selectivity for NO in breath. Massselectivity with a TOF-MS can then be used to further improveselectivity for NO. The major gas species in breath includeinorganic molecules, e.g., carbon dioxide, nitric oxide, nitrogen,oxygen, and water, and organic molecules, e.g., aldehydes,ketones, and saturated and un-saturated hydrocarbons. Othergas species are present under certain circumstances, be itenvironmental exposure, e.g., benzene or other industrialsolvents, medication, e.g., sulfur-containing gases or aldehydes,or medical conditions, e.g., aldehydes associated with certain
FIG. 2. Wavelength-dependent REMPI-MS spectra of NO with [1] two-color(226 þ 308 nm) and [2] one-color (226 þ 226 nm) REMPI using a TOF-MSequipped with a MPLI source. REMPI-MS spectra adapted from Appel.33
FIG. 3. (Left) Schematic of breath-sampling system. NO-free synthetic air isbreathed in through a one-way valve, 1, breathed out through another one-wayvalve, 2, and sampled prior to the flow meter; excess air is exhausted.Overpressure of synthetic air provides a slight air flow through the 0.5-meterlong exhaust tube. (Right) Schematic diagram of the MPLI source. Sample gasis pumped through a valve-controlled injection cylinder. The valve is openedfor typically 100 to 400 ls, letting a small sample of gas expand into a vacuum,where it is subsequently ionized. Electrostatic lenses transfer the ion packet intothe TOF-MS. Typical sampling frequency is 10 Hz.
APPLIED SPECTROSCOPY 219
cancers. For a review of trace gases found in breath and currenttechniques for their detection, see Ref. 56.
MATERIALS AND METHODS
Chemicals Used. Helium carrier gas is obtained fromAirGas Specialty Gases (AirGas West; Long Beach, CA), witha specified purity of 99.995%. Synthetic air containing 80%nitrogen and 20% oxygen is used for dilution and the NO-in-breath experiments, obtained from Oxygen Service Company(Orange, CA) with a specified purity of 99.9995%. Both thehelium and synthetic air gases were analyzed with REMPI-MS,with a concentration of NO below the detection limit (,pptV).The NO is obtained in specific, factory-diluted concentrationsfrom AirGas of: (1) 10 000 ppmV NO with 10 000 ppmVnitrogen oxides (NOx), balanced with nitrogen, (2) 1.06 ppmVNO with 1.01 ppmV NOx, balanced with nitrogen, and (3) 1.14ppmV NO with 1.34 ppmV NOx, balanced with helium. NO isfurther purified by three pump–freeze cycles using liquidnitrogen. A pure, white solid results, which is then evaporatedand balanced with nitrogen to 900 mbar.
Sample Preparation. Internal Review Board approval (HS#99*1255) was obtained prior to these experiments. Theparticipant (non-smoker, no respiratory ailments) breathedsynthetic air for two minutes. A breathing system designed forgas sampling is constructed from parts provided by HansRudolph (Kansas City, Missouri), which is schematicallyshown in Fig. 3, left. Due to the high concentration of NOwithin room air (;20 ppbV), a source of NO-free air must beprovided to accurately measure the low concentration of NOfound in breath. Sampling of NO with a Teflon line does notresult in the loss of analyte via heterogeneous reactions on thewall. Further, due to the low uptake coefficient of NO overliquid water, 1.9 3 10�3 mol L�1 atm�1,57 droplets within thesampling line do not significantly affect the measuredconcentration of NO in breath.
The direction and magnitude of flow is measured usinga VMM-401 (Interface Associates; Aliso Viejo, CA) in-lineflow meter. Slightly pressurized synthetic air ensures closure ofthe soft palate, minimizing sampling of NO from the nasalcavity. A 0.32 cm (i.d.), 100 cm long Teflon tube (Swagelok;Solon, Ohio) transfers a portion of this gas to the inlet of theMPLI source of the TOF-MS. Flow of the sample gas (10 mLmin�1) is maintained through the MPLI source by a down-stream controlled butterfly valve, with flow provided bya Pfeiffer Duo 10 roughing pump (Pfeiffer Vacuum; Asslar,Germany) on the exhaust side of the MPLI inlet.
Laser System. Tunable light for the two-step REMPIprocess is generated using an EMG 150 excimer–FL 3002dye laser system (Lambda Physik AG; Gottingen, Germany)using Coumarin 120 dye (Lambda Physik AG; Gottingen,Germany).32 The excimer laser produced light at 308 nmsimultaneously from two laser cavities. One beam is useddirectly, while the other is used to pump the dye laser, resultingin tunable light in the range 425 to 460 nm. The dye laser isequipped with a second-harmonic generator, providing UVlight in the range 212 to 230 nm, with a bandwidth of 0.002 nm.
Mass Spectrometer. A Bruker TurboTOF-MS (Bruker-Daltonics GmbH.; Bremen, Germany) is used to measure theions generated via one- or two-color REMPI. This system isdescribed elsewhere.32,58,59 In brief, the mass spectrometerconsists of a 0.8-m flight tube, dual-channel plate detector, andhigh-speed data acquisition electronics. The inlet stage has
been replaced with a MPLI source, described above.Calibration of the system is made by alternating theintroduction of 10, 20, 30, 40, and 50 ppbV NO in helium,alternating with pure helium.
RESULTS AND DISCUSSION
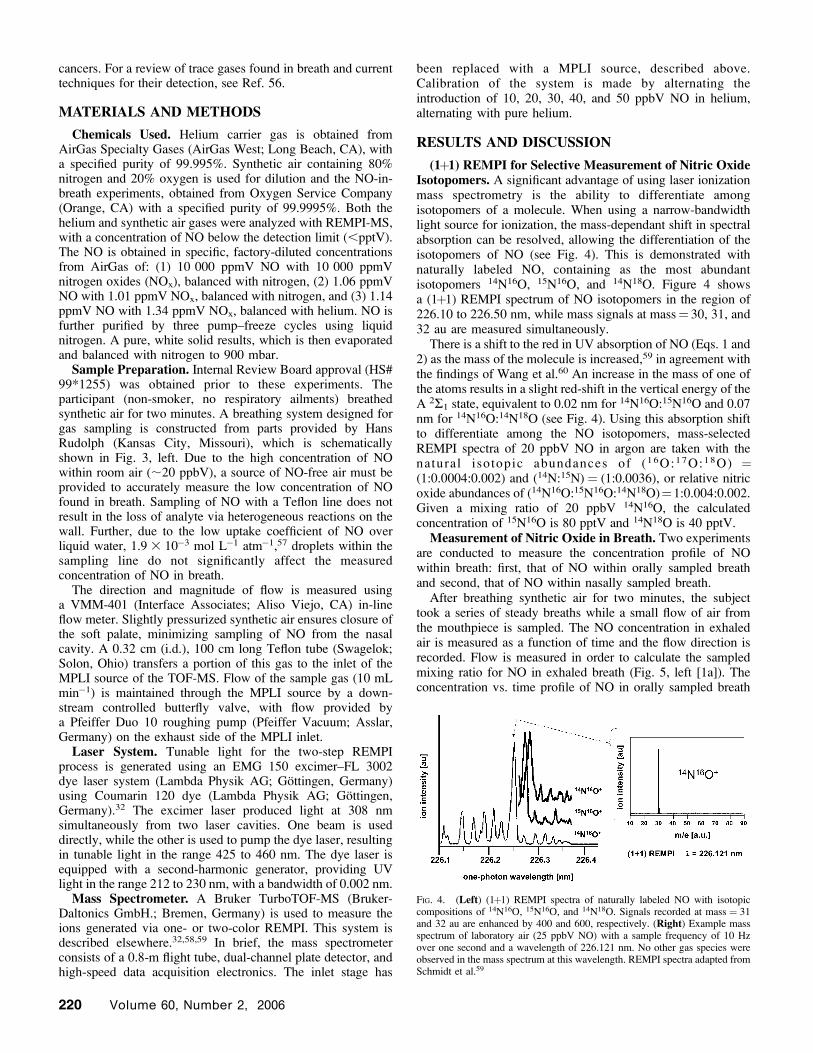
(1þ1) REMPI for Selective Measurement of Nitric OxideIsotopomers. A significant advantage of using laser ionizationmass spectrometry is the ability to differentiate amongisotopomers of a molecule. When using a narrow-bandwidthlight source for ionization, the mass-dependant shift in spectralabsorption can be resolved, allowing the differentiation of theisotopomers of NO (see Fig. 4). This is demonstrated withnaturally labeled NO, containing as the most abundantisotopomers 14N16O, 15N16O, and 14N18O. Figure 4 showsa (1þ1) REMPI spectrum of NO isotopomers in the region of226.10 to 226.50 nm, while mass signals at mass¼ 30, 31, and32 au are measured simultaneously.
There is a shift to the red in UV absorption of NO (Eqs. 1 and2) as the mass of the molecule is increased,59 in agreement withthe findings of Wang et al.60 An increase in the mass of one ofthe atoms results in a slight red-shift in the vertical energy of theA 2R1 state, equivalent to 0.02 nm for 14N16O:15N16O and 0.07nm for 14N16O:14N18O (see Fig. 4). Using this absorption shiftto differentiate among the NO isotopomers, mass-selectedREMPI spectra of 20 ppbV NO in argon are taken with thenatural i sotopic abundances of (1 6O:1 7O:1 8O) ¼(1:0.0004:0.002) and (14N:15N) ¼ (1:0.0036), or relative nitricoxide abundances of (14N16O:15N16O:14N18O)¼1:0.004:0.002.Given a mixing ratio of 20 ppbV 14N16O, the calculatedconcentration of 15N16O is 80 pptV and 14N18O is 40 pptV.
Measurement of Nitric Oxide in Breath. Two experimentsare conducted to measure the concentration profile of NOwithin breath: first, that of NO within orally sampled breathand second, that of NO within nasally sampled breath.
After breathing synthetic air for two minutes, the subjecttook a series of steady breaths while a small flow of air fromthe mouthpiece is sampled. The NO concentration in exhaledair is measured as a function of time and the flow direction isrecorded. Flow is measured in order to calculate the sampledmixing ratio for NO in exhaled breath (Fig. 5, left [1a]). Theconcentration vs. time profile of NO in orally sampled breath
FIG. 4. (Left) (1þ1) REMPI spectra of naturally labeled NO with isotopiccompositions of 14N16O, 15N16O, and 14N18O. Signals recorded at mass ¼ 31and 32 au are enhanced by 400 and 600, respectively. (Right) Example massspectrum of laboratory air (25 ppbV NO) with a sample frequency of 10 Hzover one second and a wavelength of 226.121 nm. No other gas species wereobserved in the mass spectrum at this wavelength. REMPI spectra adapted fromSchmidt et al.59
220 Volume 60, Number 2, 2006

reproduces previous observations19,61,62 that there is a peakconcentration of NO during exhalation, after which a constantlevel is reached. The concentration profile we observeddescribes the production of NO in the respiratory system.During the inhalation and pause phases of a breathing cycle,the concentration of NO builds up within the lung until it isreleased during exhalation. This results in a sudden peak of;20 ppbV NO. Following this peak, the concentration of themeasured NO represents the steady-state production of NO.This ‘‘rise-peak-plateau’’ behavior of NO in exhaled humanbreath has also been measured using chemiluminescence, inone study with a peak NO concentration of 20 (610) ppbV anda plateau concentration of 15 (66) ppbV,61 and in anotherstudy with a peak NO concentration of 30 ppbV and a plateauconcentration of 5 ppbV13 (see Fig. 5, left [1b]). It is theplateau region that represents the constant production of NOfrom the epithelium, i.e., alveolar ventilation. To determine theelevated production of NO resulting from pulmonary stress,this alveolor ventilation is frequently monitored for NO. In onestudy, the NO concentration profile within orally exhaledbreath from an asthmatic was measured to be 50 ppbV (peak)and 20 ppbV (plateau),62 demonstrating the increased relativeconcentration of NO within breath for an individual withpulmonary stress.
The measurement of NO in exhaled breath sampled from thenose is presented in Fig. 5, right [2]. We found a peakconcentration of up to 110 ppbV from nasally sampled breath,a value more than four times that of the NO measured from theoral cavity alone. This stresses the necessity of providing somemeans of separating measurements taken from the mouthversus that taken from the nose, e.g., slight overpressure ofinhaled synthetic air.
Additional measurements of NO in orally exhaled breathfrom the subject during a deep exhalation and then duringshort, rapid breathing were taken (Fig. 6). The mixing ratio ofthe maximum NO peak (20 ppbV NO) and the steady-stateplateau region (5 ppbV) for a deep exhalation are the sameconcentrations as measured during the normal breathing cycles.During rapid breathing, we found the maximum concentrationincreased to 30 ppbV NO, and this high-concentration NOpeak is continually regenerated. Kondo explained thissustained, increased production of NO in alveolar breath asa result of a pressure-dependent NO production within theepithelial tissue of the lung.63 Measuring NO under various
flow conditions, and consequently pressure, Pedroletti foundthat an exhalation flow of 50 mL s�1 is ideal for sampling.64
CONCLUSION
This study presents MPLI-MS as a new technique availablefor the time-resolved measurement of NO in breath. Theresulting system can be made portable and brought into themedical setting using newer-generation, portable lasers. Whenmeasuring NO via REMPI, we found a concentration profile inagreement with that of research groups using differenttechniques (chemiluminescence and LMRS). Sampling thebreath from a person without respiratory ailments, we founda dead-space air NO concentration of 20 ppbV and an alveolarventilation concentration of 5 ppbV. In contrast to thechemiluminescence method, MPLI-MS can also selectivelymeasure isotopically labeled NO, as demonstrated with REMPIof 14N16O, 15N16O, and 14N18O. Further, MPLI-MS can beused to measure other biologically significant molecules,including many inorganic, organic, and aromatic trace-gasspecies. In forthcoming studies, we will explore the applicationof MPLI-MS for the measurement of other biologicallysignificant molecules.
ACKNOWLEDGMENTS
This work was financially supported by the University of California, Irvine,the BMBF Germany, within projects 01 LO 9520/6 and 07 AK 302/0 and theNational Science Foundation, grant ATM-0083435.
1. M. Phillips, R. N. Cataneo, A. R. C. Cummin, A. J. Gagliardi, K. Gleeson,J. Greenberg, R. A. Maxfield, and W. N. Rom, Chest 123, 2115 (2003).
2. M. Phillips, K. Gleeson, J. M. B. Hughes, J. Greenberg, R. N. Cataneo, L.Baker, and W. P. McVay, Lancet 353, 1930 (1999).
3. S. Ebeler, A. Clifford, and T. Shibamoto, J. Chromatogr. B 702, 211(1997).
4. J. O. N. Lundberg, P. M. Hellstrom, J. M. Lundberg, and K. Alving,Lancet 344, 1673 (1994).
5. M. Phillips, R. N. Cataneo, J. Greenberg, R. Grodman, R. Gunawardena,and A. Naidu, Eur. Respir. J. 21, 48 (2003).
6. K. Alving, E. Weitzberg, and J. M. Lundberg, Eur. Respir. J. 6, 1368(1993).
7. R. Machado, D. Laskowski, O. Deffenderfer, T. Burch, S. Zheng, P.Mazzone, T. Mekhail, C. Jennings, J. Stoller, J. Pyle, J. Duncan, R. Dweik,and S. Erzurum, Am. J. Respir. Crit. Care Med. 171, 1286 (2005).
8. S. Kharitonov, D. Yates, R. Robbins, R. Logan-Sinclair, E. Shinebourne,and P. J. Barnes, Lancet 343, 133 (1994).
9. A. S. Vander and D. Luciano, Human Physiology (McGraw Hill, NewYork, 1990).
10. J. O. N. Lundberg, J. M. Lundberg, K. Alving, and E. Weitzberg, NatureMedicine 3, 30 (1997).
FIG. 5. (Left) [1a] Temporal profile of NO measured with REMPI-MS fromorally sampled breath with flow profile for reference: [NO]¼ 20 ppbV peak, 5ppbV plateau. [1b] Reference concentration profile of NO in breath withchemiluminescence from Gabbay et al.13 (Right) [2] Temporal profile of NOfrom nasally sampled breath: [NO] ¼ 80 ppbV peak, 30 ppbV plateau. Peakconcentration range for nasal sampling was 80 to 110 ppbV. For both cases [1a]and [2], NO is measured using (1þ1) REMPI at 226.121 nm.
FIG. 6. Difference in concentration profile associated with deep breathing vs.rapid breathing. Total time for both breathing cycles is ;2 s. Measurementstaken with (1þ1) REMPI at 10 Hz, 2 shots per mass spectrum.
APPLIED SPECTROSCOPY 221

11. E. Weitzberg and J. O. N. Lundberg, Nitric Oxide 2, 1 (1998).12. L. J. Ignarro, J. M. Fukuto, J. M. Griscavage, N. E. Rogers, and R. E.
Byrns, PNAS 90, 8103 (1993).13. E. F. Gabbay, A. J. Fisher, T. Small, A. J. Leonard, and P. A. Corris, Eur.
Respir. J. 11, 467 (1998).14. Y. Luiking and N. Deutz, Clin. Nutr. 6, 103 (2003).15. P. Forte, B. Kneale, E. Milne, P. Chowienczyk, A. Johnston, N. Benjamin,
and J. Ritter, Hypertension 32, 730 (1998).16. P. Krumbiegel, E. Denk, R. Russow, U. Rolle-Kampczk, G. Metzner, and
O. Herbarth, Exp. Lung Res. 28, 535 (2002).17. J. O. N. Lundberg, J. M. Lundberg, G. Settergren, K. Alving, and E.
Weitzberg, Acta Physiol. Scand. 155, 467 (1995).18. P. E. Silkoff, J. Chatkin, W. Qian, S. Chakravorty, C. Gutierrez, H. Furlott,
P. McClean, S. Rai, N. Zamel, and J. Haight, Am. J. Rhinol. 13, 169(1999).
19. P. Murtz, L. Menzel, W. Bloch, A. Hess, O. Michel, and W. Urban, J.Appl. Physiol. 86, 1075 (1999).
20. U. Platt, PCCP 1, 5409 (1999).21. R. Atkinson, Atmos. Environ. 34, 2063 (2000).22. A. Soop, A. Sollevi, E. Weitzberg, J. O. N. Lundberg, J. Palm, and J.
Albert, Eur. Respir. J. 21, 594 (2003).23. Y. Maeda, K. Aoki, and M. Munemori, Anal. Chem. 52, 307 (1980).24. B. Ridley, M. Carroll, G. Gregory, and G. Sachse, J. Geophys. Res. 93,
15813 (1988).25. W. T. Rawlins, M. E. Fraser, S. M. Miller, and W. A. M. Blumberg, J.
Chem. Phys. 96, 7555 (1992).26. B. Ridley, M. Carroll, G. Gregory, and G. Sachse, J. Gerophys. Res. 93,
15813 (1988).27. L. E. Gustafsson, A. M. Leone, M. G. Persson, N. P. Wiklund, and S.
Moncada, Biochem. Biophys. Res. Comm. 181, 852 (1991).28. H. Zacharias, J. B. Halpern, and K. H. Welge, Chem. Phys. Lett. 43, 41
(1976).29. S. Guizard, D. Chapoulard, M. Horani, and D. Gauyacq, Appl. Phys. B 48,
471 (1989).30. D. Zakheim and P. Johnson, J. Chem. Phys. 68, 3644 (1978).31. R. M. Garnica, M. F. Appel, L. Eagan, J. R. McKeachie, and T. Benter,
Anal. Chem. 72, 5639 (2000).32. J. R. McKeachie, W. E. van der Veer, L. C. Short, R. M. Garnica, M. F.
Appel, and T. Benter, Analyst (Cambridge, U.K.) 126, 1221 (2001).33. M. F. Appel, Ph.D. Thesis, University of California, Irvine, California
(2003).34. U. Bosl, J. Mass Spectrom. 35, 289 (2000).35. T. Onoda, G. Saito, and T. Imasaka, Anal. Chim. Acta 412, 213 (2000).36. H. Oser, R. Thanner, and H. H. Grotheer, Combust. Sci. Technol. 116, 567
(1996).37. R. J. Cotter, Time-of-Flight Mass Spectrometry: Instrumentation and
Applications in Biological Research (American Chemical Society,Washington, D.C., 1997).
38. J. Pfab, Spectroscopy in Environmental Science (John Wiley and Sons,New York, 1995).
39. R. Weishaupl, Ph.D. Thesis, Technical University of Munich, Munich(2003).
40. T. Benter, M. Liesner, V. Sauerland, and R. Schindler, Fresenius’ J. Anal.Chem. 351, 489 (1995).
41. B. Bakker and D. Parker, Chem. Phys. Lett. 330, 293 (2000).42. B. Bakker and D. Parker, Chem. Phys. 112, 4037 (2000).43. H. T. Kim and S. L. Anderson, J. Chem. Phys. 114, 3018 (2001).44. J. G. Philis and C. Kosmidis, J. Mol. Struct. 563, 99 (2001).45. N. C. Shand, C. L. Ning, and J. Pfab, Chem. Phys. Lett. 247, 32 (1995).46. R. McDiarmid, J. Chem. Phys. 95, 1530 (1991).47. R. McDiarmid and A. Sabljic, J. Chem. Phys. 89, 6086 (1988).48. H. Dickinson, D. Rolland, and T. P. Softley, J. Phys. Chem. A 105, 5590
(2001).49. R. McDiarmid, Chem. Phys. Lett. 188, 423 (1992).50. G. F. Metha, M. A. Buntine, A. J. Bradley, and R. J. S. Morrison, J. Mol.
Spectrosc. 206, 73 (2001).51. J. Liu, H. Kim, and S. Anderson, J. Chem. Phys. 114, 9797 (2001).52. X. Li, X. Xie, L. Li, and C. Zhang, Chin. J. Chem. Phys. 4, 235 (1991).53. N. C. Shand, C. L. Ning, M. R. F. Siggel, I. C. Walker, and J. Pfab, J.
Chem. Soc., Faraday Trans. 93, 2883 (1997).54. G. F. Metha, M. A. Buntine, D. C. Mcgilvery, and R. J. S. Morrison, J.
Mol. Spectrosc. 165, 32 (1994).55. U. Bosl, R. Weinkauf, K. Walter, C. Weickhardt, and E. W. Schlag, J.
Phys. Chem. 94, 8567 (1990).56. A. Amann and D. Smith, Breath Analysis for Clinical Diagnosis and
Therapeutic Monitoring (World Scientific Books, Singapore, 2005).57. B. Finlayson-Pitts and J. Pitts, Chemistry of the Upper and Lower
Atmosphere (Academic Press, San Diego, 2000).58. T. Benter, M. F. Appel, R. M. Garnica, S. Schmidt, and R. N. Schindler,
Abstracts of Papers of the Am. Chem. Soc. 218, U174 (1999).59. S. Schmidt, M. F. Appel, R. M. Garnica, R. N. Schindler, and T. Benter,
Anal. Chem. 71, 3721 (1999).60. D. X. Wang, C. Haridas, and S. P. J. Reddy, Mol. Spectrosc. 175, 73
(1996).61. E. H. Geigel, I. Perillo, A. Torres, P. Perkins, A. Pietropaoli, L. Frasier, M.
Frampton, and M. Utell, J. Appl. Physiol. 86, 211 (1999).62. M. Shinkai, S. Suzuki, A. Miyashita, H. Koboyashi, T. Okubo, and Y.
Ishigatsubo, Chest 121, 1847 (2002).63. R. Kondo, M. Haniuda, T. Yamanda, E. Sato, K. Fujimoto, K. Kubo, and J.
Amano, Respir. Physiol. Neurobiol. 139, 33 (2003).64. C. Pedroletti, W. Zetterquist, L. Nordvall, and K. Alving, Pediatric Res. 52,
393 (2002).
222 Volume 60, Number 2, 2006