REAL EXCHANGE RATE STATIONARITY IN MANAGED …empirical evidence on the issue and identifies...
32
WORKING PAPER NO. 93 REAL EXCHANGE RATE STATIONARITY IN MANAGED FLOATS: EVIDENCE FROM INDIA RENU KOHLI OCTOBER, 2002 INDIAN COUNCIL FOR RESEARCH ON INTERNATIONAL ECONOMIC RELATIONS Core-6A, 4 th Floor, India Habitat Centre, Lodi Road, New Delhi-110 003
Transcript of REAL EXCHANGE RATE STATIONARITY IN MANAGED …empirical evidence on the issue and identifies...

WORKING PAPER NO. 93
REAL EXCHANGE RATE STATIONARITY IN MANAGED FLOATS: EVIDENCE FROM INDIA
RENU KOHLI
OCTOBER, 2002
INDIAN COUNCIL FOR RESEARCH ON INTERNATIONAL ECONOMIC RELATIONS
Core-6A, 4th Floor, India Habitat Centre, Lodi Road, New Delhi-110 003

Contents
Foreword .............................................................................................................................. i
I. Introduction................................................................................................................ 1
II. Purchasing Power Parity – Methods, Problems and the Evidence ............................ 3
III. Testing for Mean-Reversion ...................................................................................... 7
III.1 Unit Root Tests......................................................................................................... 8
III.2 Variance Ratio Tests............................................................................................... 15
III.3 Cointegration Tests................................................................................................. 16
IV. Conclusion ............................................................................................................... 19
Foreword
The Indian economy has undergone many changes over the past decade as a result of which the nature of price movements and other macroeconomic variables has changed too. These changes present new opportunities for study and analysis for researchers. This paper by Renu Kohli tests for mean-reversion in the real exchange rate for India during the recent period of floating exchange rates.
The concept of purchasing power parity is important not just because it is a
cornerstone of most exchange rate determination models. It is of keen interest to policy makers as it serves as a benchmark for computing an equilibirum exchange rate and assessing whether shocks to the real exchange rate dampen over time. This paper finds evidence of mean-reversion in the real exchange rate series constructed with the consumer price index as deflator, as well as in the series constructed using the ratio of wholesale and consumer price indices to proxy for the shares of tradable and non-tradable goods.
Shankar Acharya Acting Director & Chief Executive
ICRIER October, 2002
i
Real Exchange Rate Stationarity in Managed Floats: Evidence from India
Renu Kohli∗
The paper tests for mean-reversion in real exchange rates for India during the recent float period. Using unit root tests with improved power, we test for stationarity of the real exchange rate, using several definitions of the real exchange rate. We also conduct cointegration and variance ratio tests to complement the evidence from unit root tests. We find evidence of mean-reversion in the real exchange rate series constructed with the consumer price index as deflator, as well as for a series constructed using the ratio of wholesale and consumer price indices to proxy for the shares of tradable and non-tradable goods. Though the evidence is based on a very short sample, the results indicate that sources of disturbance to the real exchange rate are monetary. This conclusion however, is challenged when the relative differential of tradable and nontradable goods is analysed for stationarity, suggesting that real shocks may explain real exchange rate movements. Keywords: real exchange rate; purchasing power parity
JEL Classification Nos. E50, E60, F30
∗The author is employed by the Reserve Bank of India and currently on deputation to ICRIER. The views expressed here are the author’s own and not of the institution to which she belongs. I am grateful to Prof. K. L. Krishna for invaluable help and Mili Gupta for programming assistance. I am, of course, responsible for any errors.

I. Introduction
Purchasing power parity, or the law of one price, is one of the most popularly
tested theories in economics. In fact, tests for PPP have evolved along with time series
analysis as much advancement in time series techniques have been applied in attempts to
uncover parity reversion in real exchange rates. Testing for mean-reversion in the real
exchange rate is important for many reasons. It is an important constituent of most
models of exchange rate determination, being regarded as a long-run equilibrium or an
arbitrage condition in goods and assets markets. The real exchange rate dynamics implied
in models of inter-temporal smoothing of traded goods consumption (Rogoff, 1992) and
cross-country wealth redistribution/transfers (Obstfeld and Rogoff, 1995) makes the PPP
hypothesis a meaningful one to examine. The concept is also of interest to policy makers
as it serves as a benchmark for computing an equilibirum exchange rate and assessing
whether shocks to the real exchange rate dampen over time. A failure to reject the
random walk hypothesis, for example, implies that permanent, real shocks explain real
exchange rate movements. On the other hand, finding mean-reversion properties implies
that nominal disturbances have no permanent impact upon the real exchange rate.
The behaviour of the real exchange rate and its responses to nominal and real
disturbances as part of the macro-adjustment process assume significance for India,
which has recently shifted to a market-determined (though managed) exchange rate
regime. As Froot & Rogoff (1995) note, changes in exchange rate regime imply that
deviations from parity might be eliminated through different processes altogether.
Adjustments to parity are made through domestic price level movements in a fixed
1

exchange rate regime, but when the regime is a float; parity reversion takes place via
nominal exchange rate movements. Apart from changes in exchange rate regime, trade
liberalisation and loosening of foreign exchange restrictions in India during the past
decade has reduced many distortions, factors that suggest convergence in theory, at least
in tradable goods. Finally, the exchange rate plays a central role in maintaining external
and domestic equilibrium and understanding its response to shocks is important to policy-
makers. This paper therefore aims to investigate how much evidence for PPP can be
found for India during the float period.
Empirical evidence for developing countries on this issue is still fairly thin and
concentrated around relatively homogenous groups of countries, e.g. Latin America or
East Asia, leaving a gap of individual country studies with time series data (Edwards,
1999). This study attempts to fill this gap as it focuses exclusively on India. Existing
empirical evidence for India finds some support for the PPP hypothesis for the pre-float
period (Berg & Jayanetti, 1995 for 1957-87; Baghestani, 1997 for 1973:1-1991:2). These
studies however, restrict themselves to cointegration tests, which are weak tests for the
PPP hypothesis. Our paper differs from these studies in two respects. One, we employ
comprehensive tests viz. unit root, variance ratio tests and cointegration, testing for both
strong and weak mean-reversion in the real exchange rate. We check the robustness of
results using different definitions of the real exchange rate. Two, we test for mean-
reversion restricting ourselves to the post-float period, using monthly data for 1993:01 –
2001:03. The period under the float may indeed be considered too short to reveal mean-
reversion in the real exchange rate. But we do not extend the sample backwards as gains
2

from long-sample evidence may be offset by the fact that the float period is a very small
proportion of the long sample. Moreover, some studies (for e.g. Baxter & Stockman,
1989; Taylor, 2000) have identified the regime dependency of real exchange rates.
Combining fixed and floating exchange rate regimes in such circumstances is likely to
inhibit uncovering parity reversion under the float. Instead we employ efficient unit root
tests with improved power to overcome this gap.
The paper is organised into four sections. Section II briefly reviews existing
empirical evidence on the issue and identifies problems encountered by researchers in
uncovering parity reversion, Section III tests for mean-reversion with four different series
of real exchange rate using unit root, variance ratio and cointegration tests. Section IV
concludes.
II. Purchasing Power Parity – Methods, Problems and the Evidence
Testing for purchasing power parity has evolved considerably with the
introduction of more powerful testing methods. Early tests for PPP focused on estimates
of the coefficient on relative price levels, testing for absolute PPP, where the nominal
exchange rate equals the foreign-domestic price levels, or relative PPP, where changes in
relative price levels are offset by changes in the exchange rate. A useful survey of these
early studies is to be found in Officer (1976). Simultaneity and the possibility of non-
stationary exchange rate and prices shifted the focus upon testing time series properties of
the residuals. Termed as stage two tests by Froot & Rogoff (1995), these consist of
testing the hypothesis that the log of real exchange rate follows a random walk, or is non-
3

stationary. Another strand of tests (Stage III tests) utilise cointegration techniques to test
for a long-run equilibrium relationship between the nominal exchange rate and price
levels. The serious small sample bias of cointegration tests and difficulties in
interpretation of the long-run coefficients have however, made unit root tests more
preferable since they directly test mean-reversion in the real exchange rate (Froot &
Rogoff, 1995).
Empirical evidence for the industrialised countries conforms to the opinion that
the random walk hypothesis is difficult to reject for floating currencies, implying that
nominal disturbances to the real exchange rate have permanent, or infinite, effects. Most
studies also report estimates of half-lives of parity deviations between 3-5 years,
indicating a slow convergence to equilibirum. Evidence regarding permanent deviations
from parity, i.e. the Belassa-Samuelson effect, is not supported by data from
industrialised countries except for Japan. The use of panel data and more powerful unit
root tests has helped uncover more support for the hypothesis. But mean reversion in the
real exchange rate in developing countries’ data has been difficult to find, partly because
the shift to floating exchange rates amongst this group of countries has been recent,
making it meaningless to apply PPP-based models on such data. An up to date summary
for developing countries can be found in Edwards (1999), who notes that empirical
evidence on mean-reversion for developing countries is sparse, with far more evidence
for Latin American countries. For currencies that have been formally stabilised, like the
intra-European exchange rates, the evidence is more mixed.
4
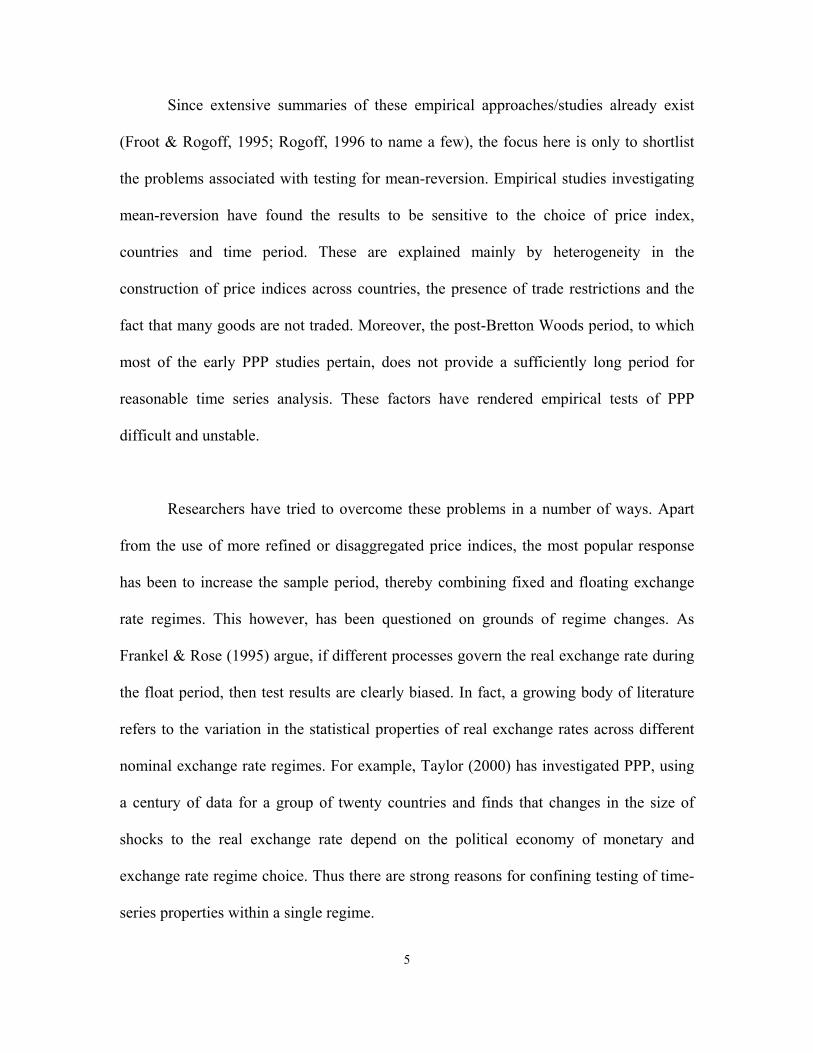
Since extensive summaries of these empirical approaches/studies already exist
(Froot & Rogoff, 1995; Rogoff, 1996 to name a few), the focus here is only to shortlist
the problems associated with testing for mean-reversion. Empirical studies investigating
mean-reversion have found the results to be sensitive to the choice of price index,
countries and time period. These are explained mainly by heterogeneity in the
construction of price indices across countries, the presence of trade restrictions and the
fact that many goods are not traded. Moreover, the post-Bretton Woods period, to which
most of the early PPP studies pertain, does not provide a sufficiently long period for
reasonable time series analysis. These factors have rendered empirical tests of PPP
difficult and unstable.
Researchers have tried to overcome these problems in a number of ways. Apart
from the use of more refined or disaggregated price indices, the most popular response
has been to increase the sample period, thereby combining fixed and floating exchange
rate regimes. This however, has been questioned on grounds of regime changes. As
Frankel & Rose (1995) argue, if different processes govern the real exchange rate during
the float period, then test results are clearly biased. In fact, a growing body of literature
refers to the variation in the statistical properties of real exchange rates across different
nominal exchange rate regimes. For example, Taylor (2000) has investigated PPP, using
a century of data for a group of twenty countries and finds that changes in the size of
shocks to the real exchange rate depend on the political economy of monetary and
exchange rate regime choice. Thus there are strong reasons for confining testing of time-
series properties within a single regime.
5

A relatively recent response to overcome insufficient time series variation has
been the introduction of cross-sectional variation through the use of panel data (Abuaf &
Jorion, 1990; Frankel & Rose, 1995; Jorion & Sweeney, 1996; Papell, 1997; O’Connell,
1998 amongst others). Studies with panel estimation have uncovered mean-reversion in
several instances, indicating the utility of greater variation within a single regime. In the
same vein are studies using tests with higher power (Cheung & Lai, 1998; Culver &
Papell, 1999) and studies exploring the possibility of a non-linear adjustment process of
the real exchange rate (Taylor & Sarno, 1998; Darbha & Patel, 2000 to name but a few).
This generation of research not only rejects the random walk hypothesis more frequently,
but also demonstrates that increased power of unit root tests does uncover mean-reversion
in small samples of the float period.
This paper seeks to combine these developments with data from a developing
country, i.e. India, and test for mean-reversion during a single regime. It responds to the
problems identified above in three different ways. First, we confine ourselves to a single
exchange rate regime, viz. the float period. In order to overcome the low power problems
associated with conventional unit root tests, we employ unit root tests with improved
power, using the modifications proposed by Elliott, Rothenberg & Stock (1996) and Park
and Fuller (1995). We also compute variance ratio statistics to uncover parity. Finally, we
employ a weaker test of mean-reversion, viz. cointegration, using the popular procedure
due to Johansen & Juselius (1990). The following section deals with these in sequence.
6

III. Testing for Mean-Reversion
This section probes the real exchange rate of the rupee for mean-reversion, using
four different series. The real exchange rate is calculated as
ppeq tttt−+=
* (1)
where e is the nominal (dollar) exchange rate expressed in domestic currency,
is the domestic price index and is the analogous US price index. All variables are
expressed in logarithms. The first series is constructed using the consumer price indices
of India and the US respectively to obtain a CPI-deflated real exchange rate series. The
second series is constructed using the ratio of wholesale/producer and consumer price
indices (India and the US) on the assumption that these two price series proxy for the
share of tradable and non-tradable goods respectively. Since the manufacturing index
covers a greater proportion of tradable goods’ prices, one would expect, a priori, PPP to
hold more strongly with these indices. Finally, we use the two trade-weighted real
exchange rate indices (36 countries and 5 countries) published by the Reserve Bank of
India. The data is monthly, spanning the 1993-2001:03 time horizon.
t pt
pt
*
The four series are plotted in Figs. 1-4, centred by their respective sample means.
The two trade-weighted REER indices and the CPI-based real exchange rate series
exhibit some patterns of reversal. The fourth series, constructed as the ratio of wholesale
to consumer prices for US/India respectively, appears to be stationary around a strong
deterministic trend. One explanation of a trend in the relative prices of traded and non-
7

traded goods is widening differentials in productivity growth in the two sectors, as has
been shown for Japan by Obstfeld (1993). Other reasons could be change in composition
of tradable goods over time, changes in the cost of goods arbitrage (reflecting trade
liberalisation, reductions in transportation costs etc.) or simply, measurement errors that
may affect the proportionality of non-traded and traded goods prices.1 The presence of
these effects implies that PPP fails to hold or that shocks to the real exchange rate are
infinitely lived.
III.1 Unit Root Tests
A strict version of PPP requires that the real exchange rate be constant. Termed as
stage two tests by Froot & Rogoff (1995), the test is based upon whether the real
exchange rate contains a unit root. If this hypothesis is rejected then there is evidence of
mean-reversion, i.e. the real exchange rate is not governed by permanent shocks. Thus in
the equation
ερµ ttt rr ++=−1
(2)
the stationarity of is necessary if the real exchange rate is mean-reverting. If
then is a non-stationary process and the nominal exchange rate and the price
differential deviate from one another, suggesting that some shocks to the real exchange
rate are permanent. There can be valid economic reasons for the real exchange rate to be
non-stationary. The permanent components in real exchange rate movements can be
ε t1≥ρ
rt
1 For instance, if the non-traded goods price index is subject to a fixed-weight or new-goods bias, a change in relative prices will generate upward index movements (Froot & Rogoff, 1995: 1663).
8

explained by increased productivity induced real exchange rate appreciation (Balassa,
1964); permanent changes in relative productivity of traded and non-traded sectors
(Baumol-Bowen, 1966); permanent changes in government spending (Froot and Rogoff,
1991; Alesina & Perotti, 1995), or simply a bias in the measurement of the consumer
price index.
A conventional test for unit roots in a series is the Augmented Dickey-Fuller
(ADF) test, which involves regressing the first difference of a series on a constant, its
lagged level and lagged first differences, i.e. p
εαρµ tt
p
i itt qqq +++= ∆∑∆−=− 111
(3)
The lagged first-differences are included to control for autocorrelation errors.
The value of was selected using the recursive t-statistic procedure, starting from a
maximum value of , since the data is monthly in frequency. A significance level
of 5-10 % (1.645) was used to assess the significance of the last lag.
p
p
12=p
The results of the ADF tests, demeaned and detrended, are presented in Table 1.2
The table also shows the results of the Phillips-Perron unit root tests, which allows for
conditional heteroskedasticity of the residuals. We leave the detailed comparison of the
results for later. Suffice it to say for now that the data supports the stationarity hypothesis
9
2 A time trend usually does not feature in PPP tests as it is inconsistent with the hypothesis. Inclusion of a time trend however, controls for the presence of the Balassa-Samuelson effect, which hypothesises differential rates of growth in the tradable and nontradable sectors.

when we use a relaxed criterion for the CPI and WPI/CPI deflated real exchange rate
series. Stationarity is unequivocally accepted only in the case of the 5-country trade
weighted REER series. Using stricter levels of significance, i.e. one per cent level of
significance, we are unable to reject the random walk hypothesis with the rest of the
series.
Unit root tests are well known to have low power, especially in small samples.
One response to this problem has been to search for improved efficiency unit root tests.
Cheung & Lai (1998) employ two efficient univariate tests proposed by Elliott,
Rothenberg & Stock (ERS, 1996) and Park and Fuller (1995) to uncover parity reversion.
These tests require much shorter sample sizes than conventional unit root tests to attain
the same statistical power.
The ERS (1996) modification to the augmented Dickey-Fuller test uses the
generalised least squares estimation ( test). This test is based upon an
analysis of the sequence of Neyman-Pearson tests of the null hypothesis against
the local alternative , where e . The locally detrended data process is
obtained by regressing the real exchange rate series q on
GLSDF −
0<
1:0 =ρH
TeH a /1: +=ρ
t zt
βzqq ttt−= (4)
10

where is the least squares coefficient of on . and
. The demeaned process is similarly obtained by replacing q
above with q and . The DF τ (detrended) and the (demeaned)
tests are then based on the following regression:
β
1(,
~qt
~zt
( )′−−= qqqq Tt
LL )1(,...,)1(,~
21ρρ
GLSDF − µ
( ′−−= zzzz Tt
LL )1(,...,)~21 ρρ
t
µ1=zt
)t
GLS−
vqqq ttj
p
j jtt++= ∆∑∆ =110 φφ (5)
and the test statistic is the t-statistic on q , testing H
against H
. ERS
(1996) show that this modification yields substantial power improvement with small
samples, which is equivalent to the power attainment of conventional ADF tests in large
samples. The parameter defining the local alternative e for calculating the series with
time trend is set equal to –13.5 and without trend is set to –7, as recommended by ERS
(1996). The results of the ADF-GLS tests are presented in Table 1, but before we analyse
these, we discuss the modification of the augmented Dickey-Fuller test proposed by Park
and Fuller (1995).
t1 0: 00 =φ 0: 00 <φ
The Park and Fuller modification makes use of weighted symmetric least squares
estimation after demeaning and detrending the real exchange rate series . The
test requires minimizing a weighted sum of errors with respect to and
qt
WSDF − ρ α in
(1) above, where ( )αααα p,..., 21= and ‘p’ is the number of lags selected on the basis of
significance of the ‘t’ statistic on α . The weights in the estimation are specified as wt
11

( )Ttwt ,....,2,1= .3 The test statistic is where V is the estimated variance
from the WSLS regression and the hypothesis is tested against .
∧
= −∧
−
1)(2/1
ρρτ Vws
:0H
∧)(ρ
1=ρ 1:0 <ρH
1+≤ pt (twt −= /(T −p − tp ≤<+11=tw
The ADF-GLS and ADF-WS unit root test results are presented in Table 1. Both
demeaned and detrended cases are considered for four real exchange rate series. The DF-
GLS test rejects stationarity of the real exchange rate, however defined, for the entire
1993-2000 sample. But the DF-WS test supports stationarity for the demeaned and
detrended CPI-deflated real exchange rate series as well as the detrended WPI/CPI
deflated series. Stationarity of all other series is however, rejected when the DF-GLS and
Df-WS tests are applied to the data.
Are these results stable over the sample period? Trimming the sample down to
1993-99 shows that much of the results are undisturbed (Table 2) except for the DF-GLS
test for the CPI-deflated and the WPI/CPI real exchange rate series, both of which are
now stationary. One must recall though that, these are borderline cases, since the non-
stationarity null is rejected at a 10 per cent level of significance. Apart from these
changes, the full sample results are basically preserved, indicating the robustness of the
unit root tests
3 This is specified by for 1 ; for , and forT .
0=twTt ≤<
≤ )2)1 p pT −p−
12

Finally, both ADF-GLS and the ADF-WS tests reject mean-reversion in the 5 and
36 country trade-weighted REER series, except for the detrended 5-country REER where
parity reversion is uncovered over the 1993-99 time horizon. The 36-country REER does
not exhibit mean-reversion at all.
What conclusions can be drawn from these tests, given the mixed evidence on
parity reversion? Both ADF and Phillips-Perron test show the CPI-base, the Pnt
tP -base
and the 5-country index of real exchange rates to be a stationary series. For the CPI based
real exchange rate series, it is not possible to find mean-reversion, using stricter
confidence levels. However, when we subject the series to the test for unit
roots, the series exhibits mean-reversion at a 5 per cent significance level. The same is
the case with the series constructed to reflect the concept that parity holds for traded
goods. The CPI-based and the
GLSDF −
Pnt
tP based real exchange rate series are the only two
series where parity can be detected with the aid of a more efficient unit-root tests, viz. the
tests. This conforms to the findings of other researchers too, notably Cheung
& Lai (1998).
WSDF −
The evidence regarding trend stationarity of the WPI/CPI real exchange rate
series is significant. Noting that PPP holds only with the inclusion of the trend term, it
may reflect the presence of the Balassa-Samuelson effect discussed earlier in the paper.
The incompleteness of PPP to fully account for exchange rate movements is well
recognised (Frankel, 1976) as it holds only when price disturbances are originating from
13

monetary sources. To elaborate, a monetary shock like an expansion in the domestic
money stock, will cause both the domestic price level and the exchange rate to increase in
the same proportion. After accounting for the dynamics of all adjustments, an increase in
the money stock will reduce the purchasing power of money, both in terms of a domestic
basket of goods, as in terms of a foreign basket of goods. The proportionaility between
the price level and the exchange rate however, will not be maintained when a real shock
impacts the exchange rate.
To further expand this point, consider an increase in productivity in tradable
goods. This will lead to a rise in domestic incomes, causing the demand for nontradables
to rise. The rise in demand will lead to a rise in the domestic price level and an
appreciation of the real exchange rate to restore equilibrium. The increases in the
exchange rate and the domestic price level, in this case will not be proportionate. Since
the mean of India’s real exchange rate, defined as the relative country’s differentials in
tradeable/nontradablgoods is itself observed to shift upwards over time, it is worthy of
exploring whether this deviation is due to the occurrence of real shocks and we leave this
issue for further research.
The results also reveal that the real exchange rate computed with the US dollar as
the base currency exhibits a greater tendency to display mean-reversion than vis-à-vis
other currencies as the base. This is in conformity with stylised evidence on the issue for
other countries as well. Moreover, this result is also in line with evidence where it is more
common to detect parity for countries which stabilise their currencies. It is widely
14

believed that the rupee is stabilised with respect to the US dollar. In an earlier work
(Kohli, 2000) a central bank reaction function modelled to test for exchange rate
management strategy, yields evidence of a policy of real exchange rate stabilisation by
the authorities. When the authorities are targeting the real exchange rate, they are
attempting to move the real exchange rate towards equilibrium, i.e. PPP, by varying the
nominal exchange rate to restore equilibrium. When a floating exchange rate is managed
via this policy rule, short-run deviations from PPP and mean-reversion in the rupee’s real
exchange rate vis-à-vis the dollar may not be surprising.
To conclude, the difference in the different exchange rate series is confirmed
when we computed variance ratio statistics to test for unit roots, which are presented
next.
III.2 Variance Ratio Tests
In the next stage of investigating real exchange rate stationarity we computed the
variance ratio test statistic proposed by Cochrane (1988). Under the null of a random
walk, the variance of series is hypothesised to grow linearly over time. For a
stationary series, the variance ratio statistic,
qt
( ) ( )qqqq tttst −− ++ 1Var , converges to zero
as s increases. If the true process is I (1), this statistic gives a quantitative measure of the
effects of permanent shocks upon the real exchange rate.
15

Fig. 5 plots the variance ratio statistic for the four measures of the real exchange
rate. From the figure we can observe that the variance ratio statistic rises more sharply
over the horizon ( s to ) for the 36-country real effective exchange rate
(reer36) index than for the 5-country index (reer5), the CPI-based or the
wholesale/consumer prices-based real exchange rate series. As the horizon length
increases, the variance ratio statistic for all series, except the 36-country REER,
converges. While by itself, this does not constitute conclusive evidence of stationarity, it
does lend further support to the evidence from the unit root tests where we were unable to
reject the random walk hypothesis for the 36-country, trade-weighted REER series.
1= 25=s
III.3 Cointegration Tests
Cointegration tests are weak tests of PPP since they require only that some linear
combination of domestic price level ( ), the foreign price level ( *) and the nominal
exchange rate (e ) be stationary. The null hypothesis here is that of no cointegration
between the three series. A stronger test for PPP can be implemented by imposing
proportionality and symmetry restrictions upon the coefficients on and * to be 1, -1.
Thus in the equation
pt pt
pt
t
pt
uppe tttt +
−+=
*
0lnlnln ββ (6)
the restriction is tested, which is a bivariate test. Alternately, the trivariate case
(7)
1=β
t+
2β uppe ttt++=
*
10lnlnln ββ
16

may be examined, where the symmetry restriction ( ) ( )11 ,,21 −=ββ is tested. The
evidence using cointegration tests suggests that while the cointegration null, a weaker
hypothesis, is often rejected, the proportionality restrictions are typically violated.
We use the cointegration proccedure due to Johansen & Juselius (1990) and the
results are presented in Table 3. As the table shows, we experimented with several
combinations of the four exchange rate series. Both trivariate and bivariate systems were
tested for cointegrating relationships. Inferences regarding the existence of a
cointegrating vector between the nominal exchange rate, foreign and domestic prices are
primarily based upon finite sample critical values as finite sample analyses can bias the
likelihood ratio tests towards finding cointegration too often.4 Finite sample critical
values were obtained by adjusting the asymptotic critical values, details of which are
reported below the table.
Using finite sample critical values, we are unable to reject the null of no
cointegration for any of the bivariate and trivariate cases. However, at a more relaxed
significance (>5 <10 per cent) level, it is possible to conclude that a stationary
combination of the nominal exchange rate and the foreign and domestic price levels
exists with a broader price index as the deflator. Moreover, evidence of cointegration can
be found when a bivariate relationship between the nominal exchange rate and
4 In fact, the finite sample bias magnifies as the dimension of the estimated system and the lag-order increase (Cheung & Lai, 1993).
17
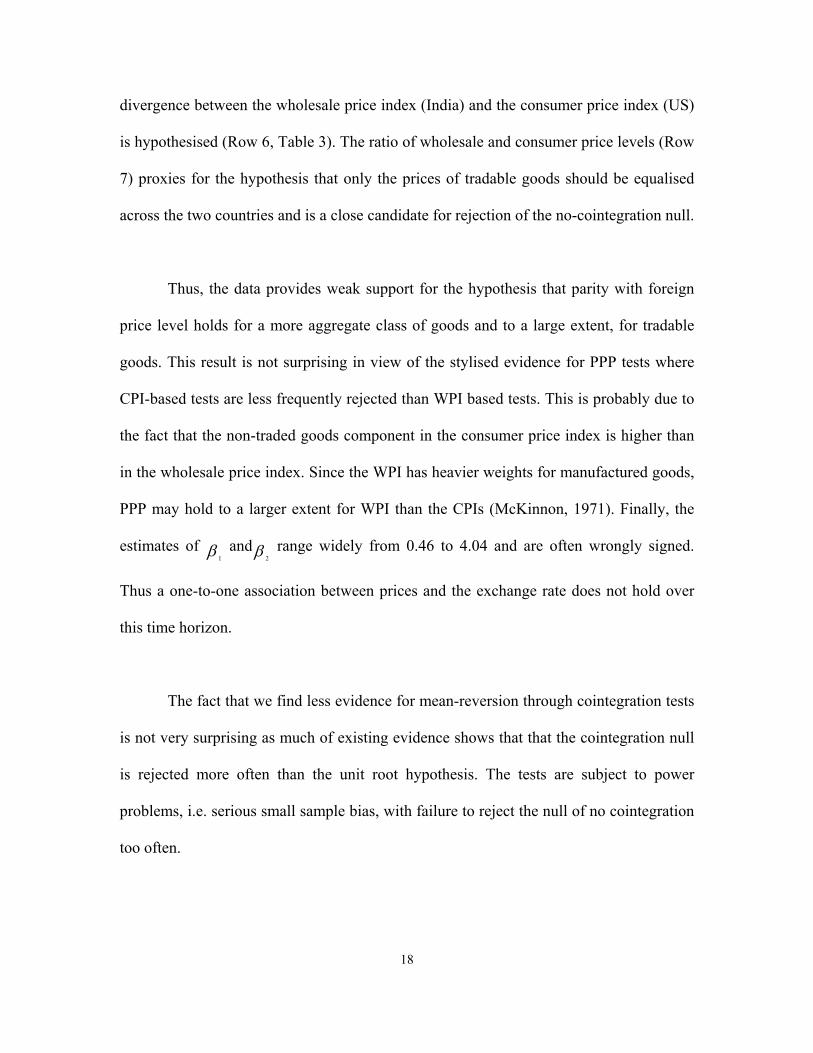
divergence between the wholesale price index (India) and the consumer price index (US)
is hypothesised (Row 6, Table 3). The ratio of wholesale and consumer price levels (Row
7) proxies for the hypothesis that only the prices of tradable goods should be equalised
across the two countries and is a close candidate for rejection of the no-cointegration null.
Thus, the data provides weak support for the hypothesis that parity with foreign
price level holds for a more aggregate class of goods and to a large extent, for tradable
goods. This result is not surprising in view of the stylised evidence for PPP tests where
CPI-based tests are less frequently rejected than WPI based tests. This is probably due to
the fact that the non-traded goods component in the consumer price index is higher than
in the wholesale price index. Since the WPI has heavier weights for manufactured goods,
PPP may hold to a larger extent for WPI than the CPIs (McKinnon, 1971). Finally, the
estimates of and range widely from 0.46 to 4.04 and are often wrongly signed.
Thus a one-to-one association between prices and the exchange rate does not hold over
this time horizon.
β 1 β 2
The fact that we find less evidence for mean-reversion through cointegration tests
is not very surprising as much of existing evidence shows that that the cointegration null
is rejected more often than the unit root hypothesis. The tests are subject to power
problems, i.e. serious small sample bias, with failure to reject the null of no cointegration
too often.
18

IV. Conclusion
This paper has examined mean-reversion in the real exchange rate for India after
change in exchange rate regime in 1993. Tests for stationarity used unit root tests as well
as cointegration and variance ratio tests and were applied to four different series of the
real exchange rate. The evidence on parity reversion uncovered in this paper for the
period after the float is somewhat mixed with bulk of the findings indicting mean-
reversion for the consumer prices and the WPI/CPI deflated real exchange rate series.
The use of recent developments in unit root testing like the ADF-GLS and ADF-WS
tests, which yield substantial power improvements in small samples, shows that the real
exchange rate series defined vis-à-vis the US dollar exhibits mean-reverting tendencies.
The data does not however, support stationarity for the REER series, which is computed
with a broader base of currencies. This may reflect the potential effects of currency
stabilisation on unit root tests. It may also imply that models emphasising real
determinants of the exchange rate may offer a more accurate description of real exchange
rate behaviour as opposed to nominal disturbances.
Several caveats accompany the results obtained in this paper. As with most time-
series studies suffering from data inadequacy handicaps, this study too is no exception.
Thus the results of this study are to be interpreted with a great deal of caution given the
extremely short time-span available for analysis, the fact that purchasing power parity is
essentially a long run condition and uncertainty associated with the rate of reversion to an
unconditional mean. For example, it could well be the case that nominal exchange rate
19

movements due to short-term nominal price rigidities may affect the real exchange rate
but different processes may govern the long-run behaviour of the real exchange rate.
Possible hypotheses for exploration in this regard are the popular Belassa-Samuelson
effect, where a rise in productivity in the tradable goods sector triggers a wage increase in
the tradable goods sector, and if the productivity differentials between the two sectors
widen, a price increase in the non-tradable goods sector is inevitable. One prediction of
this theory is that fast growing economies will experience a real exchange rate
appreciation, presuming that the traded goods sector is the locus of productivity
increases. This would be a worthwhile hypothesis to explore in the Indian context,
particularly as our examination suggests the failure of PPP to hold for the detrended
relative prices of tradable and nontradable sectors.
A second aspect that could be explored to explain real exchange rate behaviour is
fiscal policy effect. The long-run real effects of government spending have been shown to
affect the real exchange rate by Froot & Rogoff (1991). It may of course, also be the case
that none of these explanations may universally account for real exchange rate changes in
the long-run and may complement purchasing power parity. Further, one has to make an
allowance for policy effects like currency stabilisation vis-à-vis the dollar, which induce
bias in the data.
20
Bibliography & References
Abuaf, N. & Jorion, P. (1990) “Purchasing power parity in the long run”, Journal of Finance, Vol. 45 (1) March: 157-74.
Alesina, A. & Perotti, R. (1995) “Taxation and Redistribution in an Open Economy”,
European Economic Review, May 1995, 39(5), Pp. 961-79. Baghestani, H. (1997) “Purchasing power parity in the presence of foreign exchange
black markets: the case of India”, Applied Economics, 1997, 29. Balassa, B. (1964) “The Purchasing Power Parity Doctrine: A reappraisal”, The Journal
of Political Economy, 72: 584 – 596. Baumol, W. & Bowen, W. (1966) Performing Arts: The Economic dilemma, The
Twentieth Century Fund, New York. Baxter, M. & Stockman, A. C. (1989) “Business Cycles and the Exchange Rate System”,
Journal of Monetary Economics, 23:377-400. Berg, H. V. D. & Jayanetti, S. C. (1995) “Getting Closer to the Long Run: Using Black
Market Rupee/Dollar Exchange Rates to Test Purchasing Power Parity”, The Indian Journal Of Economics, Vol. LXXV, issue no. 298.
Cheung, Y. & Lai, K. S. (1993) “Finite-Sample Sizes of Johansen's Likelihood Ratio
Tests for Cointegration.”, Oxford Bulletin of Economics and Statistics 55, 313-328.
Cheung, Y. & Lai, K. S. (1998) “Parity Reversion in Real Exchange Rates during the
post-Bretton Woods period”, Journal of International Money and Finance, Vol. 17 (4) August: 597-614.
Culver, S. E. & Papell, D. H. (1999) “Long Run PPP with Short-Run Data: Evidence
with a Null Hypothesis of Stationarity”, Journal of International Money and Finance, Vol. 18 (5) October: 751-68.
Cochrane, J. H. (1988) “How Big is the Random Walk in GNP?”, Journal of Political
Economy, 96: 893-920. Darbha, G. & U. Patel (2000) “"Nonlinear Adjustment in Real Exchange Rates and Long
Run Purchasing Power Parity - Further Evidence" NIPFP Discussion Paper No. 2. Edwards, S. (1999) “Capital Flows to Latin America” in Martin Feldstein (eds.)
International Capital Flows, NBER, Cambridge, M. A.
21

Elliott, G., Rothenberg, T. & Stock, J. (1996) “Efficient Tests for an Autoregressive Unit root”, Econometrica, 64, 813-836.
Frankel, J. (1976) “A Monetary Approach to the Exchange Rate: Doctrinal Aspects and
Empirical Evidence”, Scandinavian Journal of Economics. Frankel, J. & Rose, A. (1995) “A Panel project on purchasing power parity: Mean
reversion within and between countries”, NBER Working Paper No. 5006, NBER, Cambridge, M. A.
Froot, K. A. & Rogoff, K. (1991) “Government consumption and the real exchange rate:
the empirical evidence”, mimeo, Harvard Business School. Froot, K. A. & Rogoff, K. (1995) “Perspectives on PPP and Long-Run Real Exchange
Rates” in G. M. Grossman, K. Rogoff (eds.) Handbook of International Economics, Vol. III. 1647-88. North Holland, New York.
International Monetary Fund International Financial Statistics, Various Issues. Johansen, S. & Juselius, K. (1990) “Maximum Likelihood Estimation and Inference on
Cointegration-with Applications to the Demand for Money”, Oxford Bulletin of Economics and Statistics, 52, 2.
Jorion, P. & Sweeney, R. J. (1996) “Mean reversion in real exchange rates: Evidence and
implications for forecasting”, Journal of International Money and Finance, 15, 535-550.
Kohli, R. (2000) “Real Exchange rate Stabilisation and Managed Floating: Exchange Rate Policy in India: 1993-99” ICRIER Working Ppr. No. 59, February, 2000.
McKinnon, R. (1971) “Monetary Theory and Control Flexibility in the Foreign
Exchanges”, Essays in International Finance, 84, Princeton University. Ng, S. & Perron, P. (1995) “Unit root tests in ARMA models with data dependent
methods for selection of the truncation lag”, Journal of the American Statistical Association, 90 (1995), 268-281.
Ng, S. & Perron, P. “Lag length selection and the construction of unit root tests with good
size and power” forthcoming in Econometrica. Obstfeld, M. (1993) “Model trending real exchange rates”, University of California at
Berkeley, Center for International and Development Economics Research Working Paper, C93-011.
Obstfeld, M. & Rogoff, K. S. (1995) “The intertemporal approach to the current account”
in G. M. Grossman, K. Rogoff (eds.) Handbook of International Economics, Vol. III. 1737-1799. North Holland, New York.
22

O’Conell, P. G. J. (1998) “The overvaluation of purchasing power parity”, Journal of
International Economics, Vol. 44, 1-19. Officer, L. H. (1976) “The Purchasing Power Parity Theory of Exchange Rates: A
Review Article”, IMF Staff Papers, 23: 1-60. Papell, D. H. (1997) “Searching for stationarity: Purchasing power parity under the
current float”, Journal of International Economics, 43 (1997), 313-332. Park, H. J. & Fuller, W. A. (1995) “Alternative Estimators and Unit Root Tests for the
Autoregressive Process”, Journal of Time Series Analysis, 16(4), 415-429. Reinsel, G. C. & Ahn, S. K. (1988) “Asymptotic properties of the Likelihood Ratio Test
for Cointegration in the Non-stationary Vector AR Model”, Technical Report, Department of Statistics, University of Wisconsin, Madison.
Reserve Bank of India Handbook of Statistics, 2000. RBI Bulletin, Various Issues. Rogoff, K. (1992) “Traded goods consumption smoothing and the random walk
behaviour of the exchange rate”, Bank of Japan Monetary and Economic Studies, 10, 1-29.
Rogoff, K. (1996) “The Purchasing Power Parity Puzzle”, Journal of Economic
Literature, 34, 647-68. Taylor, M. P. & Sarno, L. (1998) “The Behaviour of Real Exchange Rates during the
post-Bretton Woods period”, Journal of International Economics, 46 (1998), 281-312.
Taylor, A. M. (2000) “A Century of Purchasing Power Parity”, NBER Working Paper
Series, Working Paper 8012, NBER, Cambridge, M. A.
23

3.05
3.10
3.15
3.20
3.25
3.30
93 94 95 96 97 98 99 00 01
Fig. 1: CPI Deflated Exchange Rate
4.50
4.55
4.60
4.65
4.70
4.75
4.80
93 94 95 96 97 98 99 00 01
Fig. 2: 5-Country Weighted Real EffectiveExchange Rate
24
4.00
4.05
4.10
4.15
4.20
4.25
93 94 95 96 97 98 99 00 01
Fig. 3: 36-Country Weighted Real EffectiveExchange Rate
3.0
3.2
3.4
3.6
3.8
4.0
93 94 95 96 97 98 99 00 01
Fig. 4: Ratio of WPI to CPI Deflated Exchange Rate

Table 1: Unit Root Tests
(1993-2000) Exchange rate Augmented Dickey Fuller Phillips - Perron
Detrended Demeaned detrended demeaned
cpicpi ppe −+ * 3.37*** 3.34** 3.33*** 3.30**
cpi
wpi
cpi
ppi
pp
ppe −+
**
3.97** 1.39 3.66** 1.23
REER-5 country
weighted 4.29* 4.39* 4.18* 4.16*
REER-36 country
weighted 2.56 2.52 2.73 2.52
Critical values at 1%, 5% and 10% for the ADF and Phillips-Perron tests are 3.5, 2.89 and 2.58 respectively for the intercept. Critical values at the 1%, 5% and 10% for the ADF and Phillips-Perron are 4.05, 3.45 and 3.15 respectively for trend and intercept. *(**(***)) indicate significance at 1, 5 and 10 per cent level respectively.
DF-GLS DF-WS
MAIC Ng-Perron Ng-Perron Exchange Rate
detrended demeaned detrended demeaned detrended Demeaned
cpicpi ppe −+ * 2.66
(2.73)
0.74
(1.77)
2.48
(2.74)
1.30
(1.81)
3.08***
(2.96)
2.80**
(2.26)
cpi
wpi
cpi
ppi
pp
ppe −+
**
2.61
(2.73)
1.00
(1.80)
2.61
(2.73)
1.00
(1.80)
3.16***
(3.12)
1.76
(2.35)
REER-5 country
weighted
2.45
(2.72)
1.22
(1.80)
2.62
(2.74)
1.35
(1.81)
2.12
(2.99)
2.15
(2.26)
REER-36
country weighted
2.11
(2.71)
0.80
(1.79)
2.40
(2.74)
1.07
(1.81)
2.82
(2.99)
2.08
(2.26)
Finite sample critical values for the DF-GLS and DF-WS are given in parentheses. *(**(***)) indicate significance at 1, 5 and 10 per cent level respectively. The lag lengths for the DF-GLS test were selected using both minimized AIC and Ng-Perron’s ‘t’ statistic criteria. Use of the MAIC criterion provides substantial size improvements in the DF-GLS context (Ng-Perron, 2000).
25
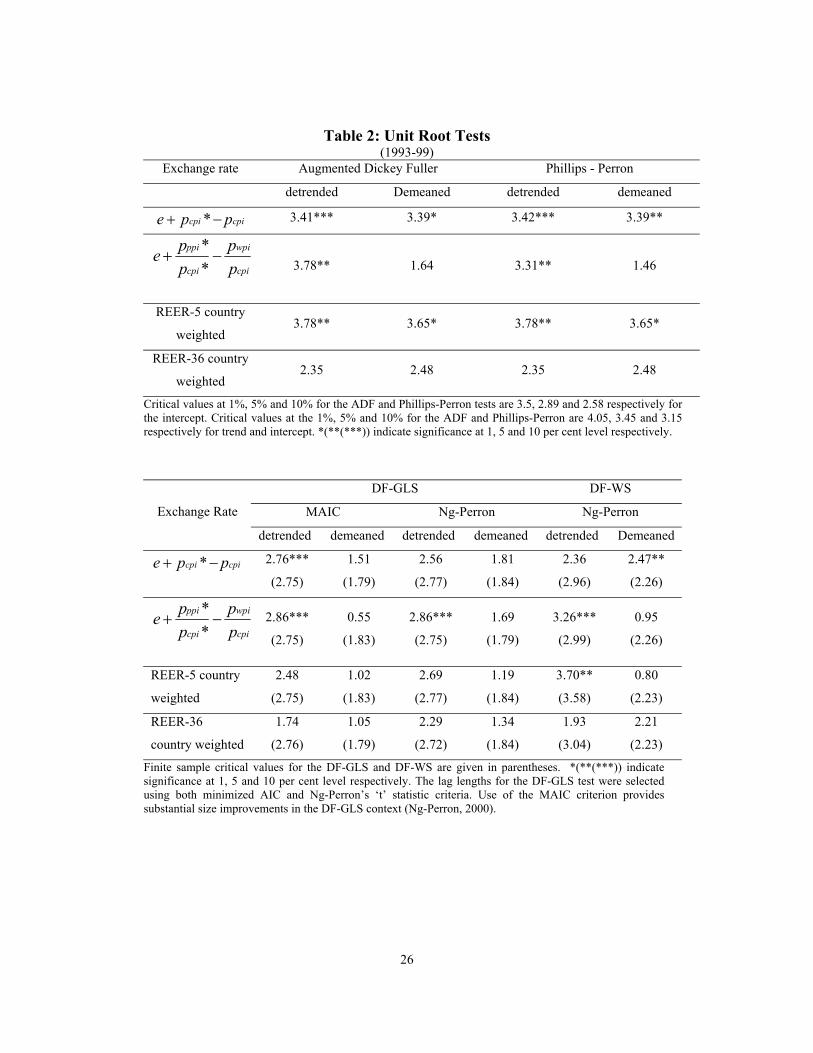
Table 2: Unit Root Tests (1993-99)
Exchange rate Augmented Dickey Fuller Phillips - Perron
detrended Demeaned detrended demeaned
cpicpi ppe −+ * 3.41*** 3.39* 3.42*** 3.39**
cpi
wpi
cpi
ppi
pp
ppe −+
**
3.78** 1.64 3.31** 1.46
REER-5 country
weighted 3.78** 3.65* 3.78** 3.65*
REER-36 country
weighted 2.35 2.48 2.35 2.48
Critical values at 1%, 5% and 10% for the ADF and Phillips-Perron tests are 3.5, 2.89 and 2.58 respectively for the intercept. Critical values at the 1%, 5% and 10% for the ADF and Phillips-Perron are 4.05, 3.45 and 3.15 respectively for trend and intercept. *(**(***)) indicate significance at 1, 5 and 10 per cent level respectively.
DF-GLS DF-WS
MAIC Ng-Perron Ng-Perron Exchange Rate
detrended demeaned detrended demeaned detrended Demeaned
cpicpi ppe −+ * 2.76***
(2.75)
1.51
(1.79)
2.56
(2.77)
1.81
(1.84)
2.36
(2.96)
2.47**
(2.26)
cpi
wpi
cpi
ppi
pp
ppe −+
**
2.86***
(2.75)
0.55
(1.83)
2.86***
(2.75)
1.69
(1.79)
3.26***
(2.99)
0.95
(2.26)
REER-5 country
weighted
2.48
(2.75)
1.02
(1.83)
2.69
(2.77)
1.19
(1.84)
3.70**
(3.58)
0.80
(2.23)
REER-36
country weighted
1.74
(2.76)
1.05
(1.79)
2.29
(2.72)
1.34
(1.84)
1.93
(3.04)
2.21
(2.23)
Finite sample critical values for the DF-GLS and DF-WS are given in parentheses. *(**(***)) indicate significance at 1, 5 and 10 per cent level respectively. The lag lengths for the DF-GLS test were selected using both minimized AIC and Ng-Perron’s ‘t’ statistic criteria. Use of the MAIC criterion provides substantial size improvements in the DF-GLS context (Ng-Perron, 2000).
26

Fig. 5: Variance Ratio Tests
0
5
10
15
20
25
301 3 5 7 9 11 13 15 17 19 21 23 25
Horizon length in months (s)
Var
ianc
e R
atio
reer36
reer5
Pt/Pnt rer CPI base rer
27
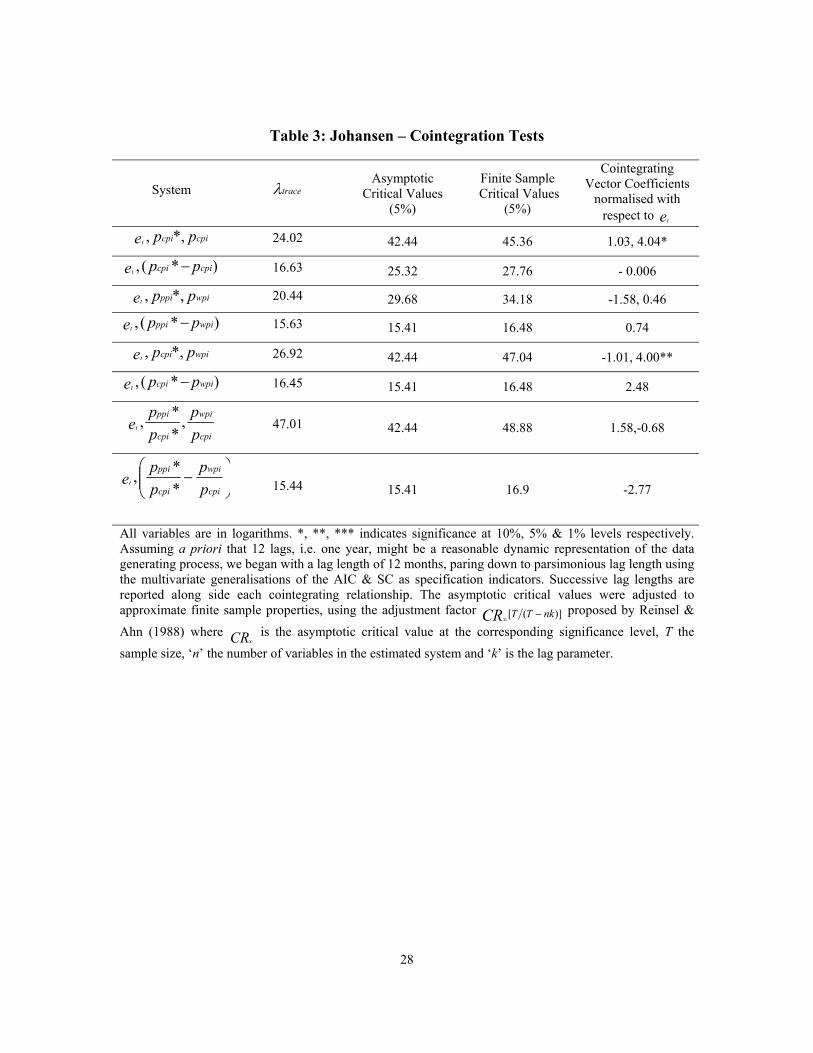
Table 3: Johansen – Cointegration Tests
System traceλ Asymptotic
Critical Values (5%)
Finite Sample Critical Values
(5%)
Cointegrating Vector Coefficients
normalised with respect to e t
cpicpi ppet *,, 24.02 42.44 45.36 1.03, 4.04*
)*(, cpicpi ppet − 16.63 25.32 27.76 - 0.006
wpippi ppet *,, 20.44 29.68 34.18 -1.58, 0.46
)*(, wpippi ppet − 15.63 15.41 16.48 0.74
wpicpi ppet *,, 26.92 42.44 47.04 -1.01, 4.00**
)*(, wpicpi ppet − 16.45 15.41 16.48 2.48
cpi
wpi
cpi
ppi
pp
pp
et ,**, 47.01 42.44 48.88 1.58,-0.68
−
cpi
wpi
cpi
ppi
pp
pp
et **,
15.44 15.41 16.9 -2.77
All variables are in logarithms. *, **, *** indicates significance at 10%, 5% & 1% levels respectively. Assuming a priori that 12 lags, i.e. one year, might be a reasonable dynamic representation of the data generating process, we began with a lag length of 12 months, paring down to parsimonious lag length using the multivariate generalisations of the AIC & SC as specification indicators. Successive lag lengths are reported along side each cointegrating relationship. The asymptotic critical values were adjusted to approximate finite sample properties, using the adjustment factor )]([ nkTT −
∞CR proposed by Reinsel & Ahn (1988) where CR is the asymptotic critical value at the corresponding significance level, T the sample size, ‘n’ the number of variables in the estimated system and ‘k’ is the lag parameter.
∞
28